
CHNSO Elemental Analyses of Volatile Organic Liquids by Combined GC/MS and GC/Flame Ionisation Detection Techniques with Application to Hydrocarbon-Rich Biofuels


Abstract
:
1. Introduction
Background
2. Results
2.1. CHNSO Results of Simulated Hydrocarbon Oil Mixtures
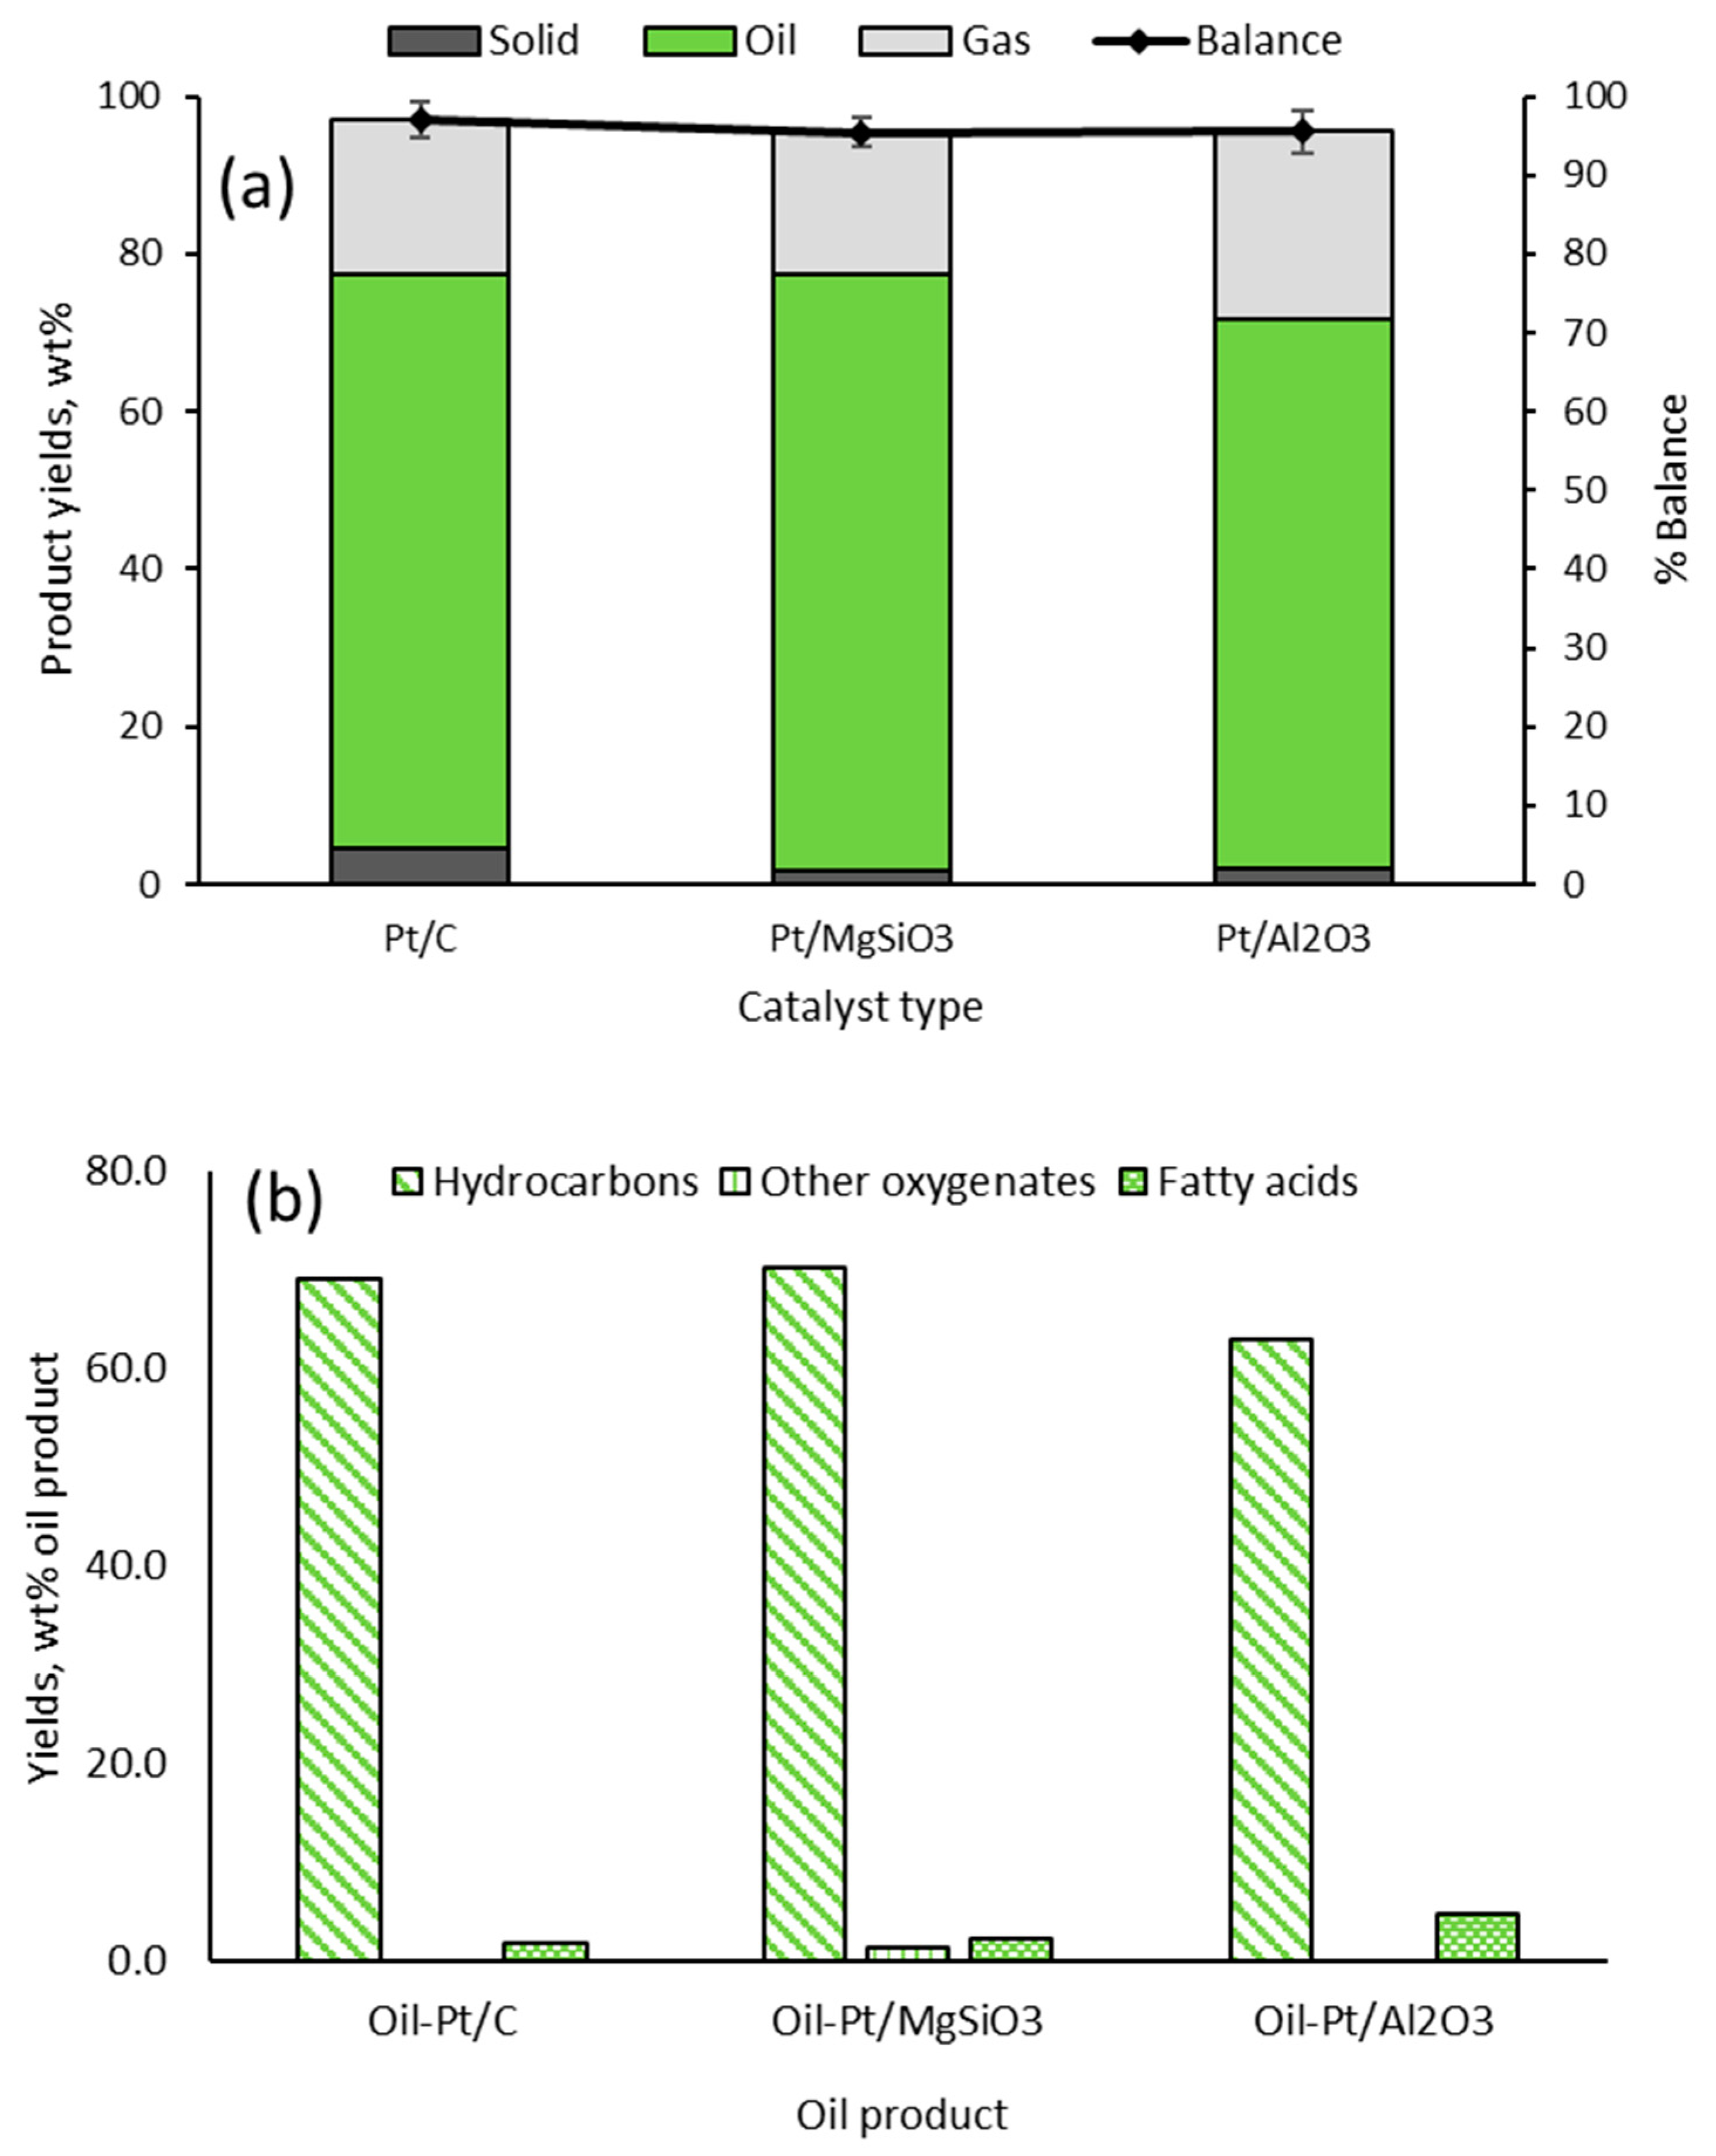
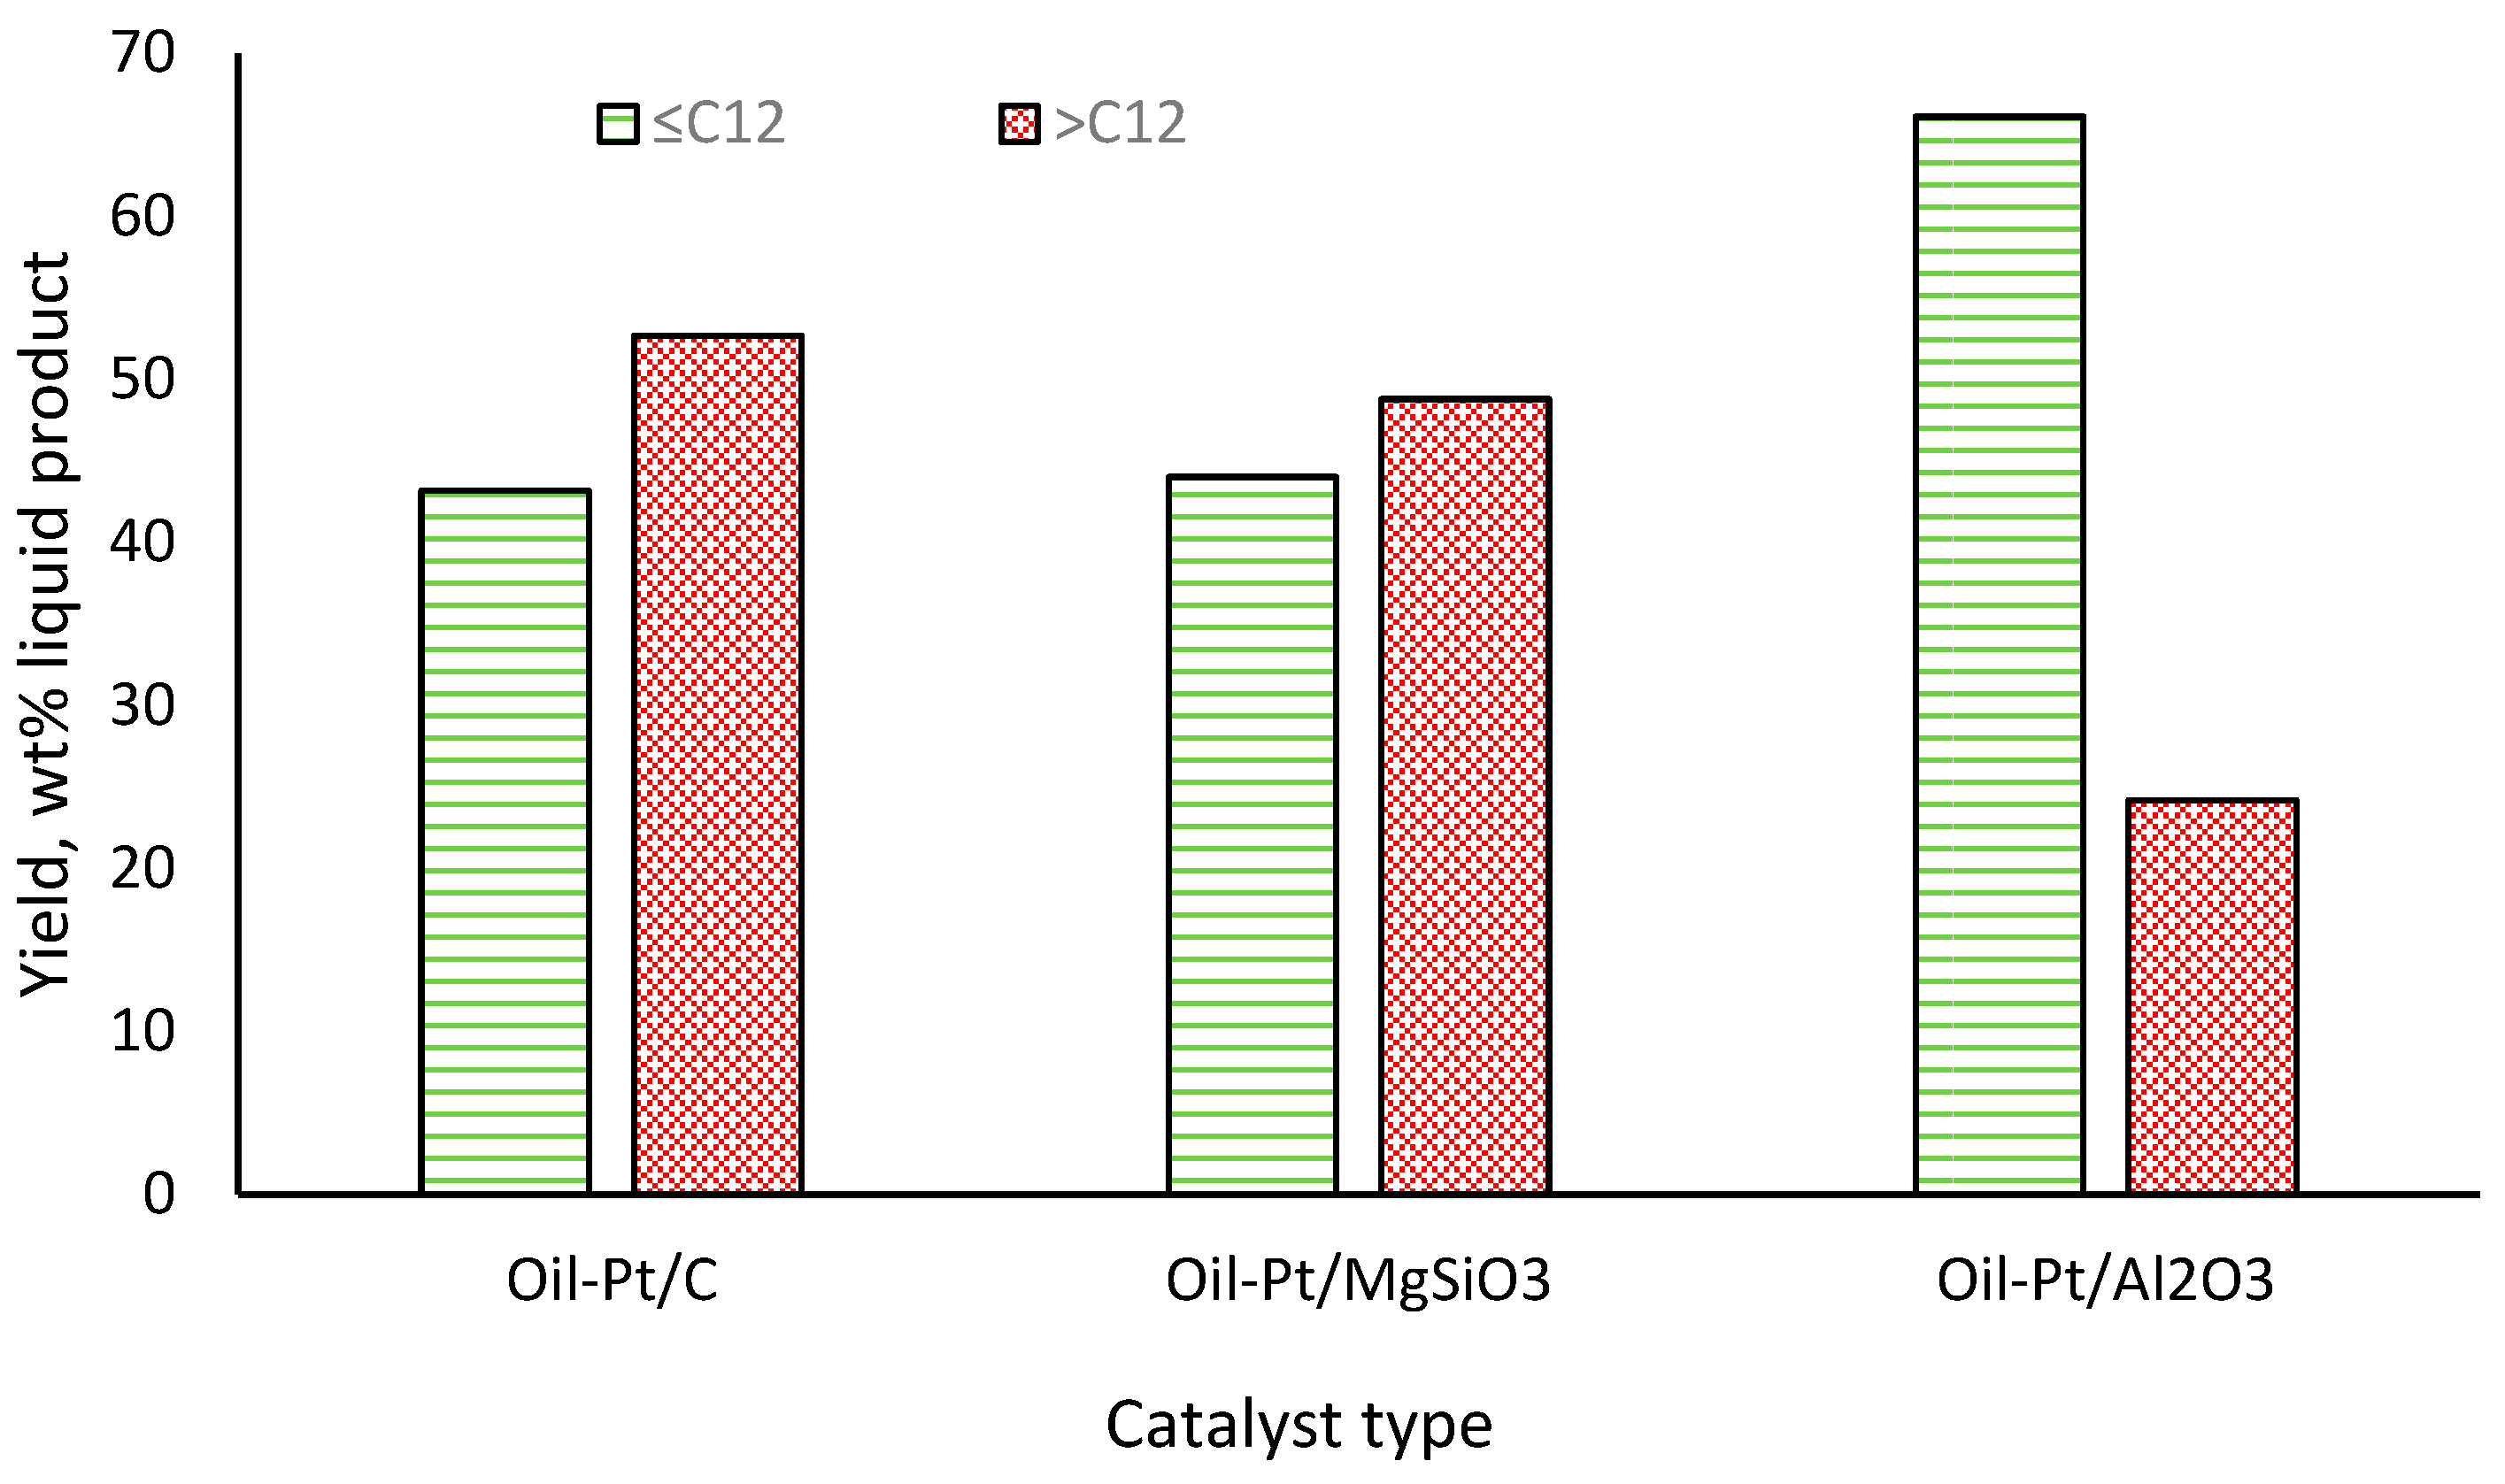
2.2. Yields and Compositions of Oil-Pt/C, Oil-Pt/MgSiO3 and Oil-Pt/Al2O3
2.3. CHNSO Results of RSO-Derived Organic Liquid Products
3. Discussion
Commentary and Future Perspectives
4. Materials and Methods
4.1. Preparation of the Hydrocarbon-Rich Liquid Samples
4.2. Analysis of Fatty Acid Contents in Oil-Pt/C, Oil-Pt/MgSiO3, and Oil-Pt/Al2O3
4.3. Analysis of Organic Liquid Products by Gas Chromatography
4.4. Evaluation of Experimental Results
Supplementary Materials
Author Contributions
Funding
Institutional Review Board Statement
Informed Consent Statement
Data Availability Statement
Acknowledgments
Conflicts of Interest
References
- Fellner, J.; Aschenbrenner, P.; Cencic, O.; Rechberger, H. Determination of the biogenic and fossil organic matter content of refuse-derived fuels based on elementary analyses. Fuel 2011, 90, 3164–3171. [Google Scholar] [CrossRef]
- Kim, D.; Park, S.; Park, K.Y. Upgrading the fuel properties of sludge and low rank coal mixed fuel through hydrothermal carbonization. Energy 2017, 141, 598–602. [Google Scholar] [CrossRef]
- Abdulhamid, Q.M.; Al-Tikrity, E.T.B.; Fadhil, A.B.; Foot, P.J.S. Thermal cracking of Al-Dora asphalt for the simultaneous production of light fuel and activated carbon for desulfurization process. J. Anal. Appl. Pyrolysis 2023, 173, 106072. [Google Scholar] [CrossRef]
- Carrie, J.; Sanei, H.; Stern, G. Standardisation of Rock–Eval pyrolysis for the analysis of recent sediments and soils. Org. Geochem. 2012, 46, 38–53. [Google Scholar] [CrossRef]
- Kostik, V.; Memeti, S.; Bauer, B. Fatty acid composition of edible oils and fats. J. Hyg. Eng. Des. 2013, 4, 112–116. [Google Scholar]
- Lobato-Aguilar, H.; Uribe-Calderón, J.A.; Herrera-Kao, W.; Duarte-Aranda, S.; Baas-López, J.M.; Escobar-Morales, B.; Cauich-Rodríguez, J.V.; Cervantes-Uc, J.M. Synthesis, characterization, and chlorhexidine release from either montmorillonite or palygorskite modified organoclays for antibacterial applications. J. Drug Deliv. Sci. Technol. 2018, 46, 452–460. [Google Scholar] [CrossRef]
- Goel, H.; Santhiya, D. Role of Trigonella foenum-graecum leaf extract in tailoring the synthesis and properties of bioactive glass nanoparticles. Sustain. Mater. Technol. 2022, 33, e00485. [Google Scholar] [CrossRef]
- Beloglazkina, E.K.; Moiseeva, A.A.; Tsymbal, S.A.; Guk, D.A.; Kuzmin, M.A.; Krasnovskaya, O.O.; Borisov, R.S.; Barskaya, E.S.; Tafeenko, V.A.; Alpatova, V.M. The Copper Reduction Potential Determines the Reductive Cytotoxicity: Relevance to the Design of Metal–Organic Antitumor Drugs. Molecules 2024, 29, 1032. [Google Scholar] [CrossRef]
- Taran, O.P.; Boltenkov, V.V.; Ermolaeva, N.I. Relations between the Chemical Composition of Organic Matter in Lacustrine Ecosystems and the Genesis of Their Sapropel. Geochem. Int. 2018, 56, 256–265. [Google Scholar] [CrossRef]
- Krivácsy, Z.; Gelencsér, A.; Kiss, G.; Mészáros, E.; Molnár, A.; Hoffer, A.; Mészáros, T.; Sárvári, Z.; Temesi, D.; Varga, B.; et al. Study on the Chemical Character of Water-Soluble Organic Compounds in Fine Atmospheric Aerosol at the Jungfraujoch. J. Atmos. Chem. 2001, 39, 235–259. [Google Scholar] [CrossRef]
- Tóth, A.; Hoffer, A.; Pósfai, M.; Ajtai, T.; Kónya, Z.; Blazsó, M.; Czégény, Z.; Kiss, G.; Bozóki, Z.; Gelencsér, A. Chemical characterization of laboratory-generated tar ball particles. Atmos. Chem. Phys. 2018, 18, 10407–10418. [Google Scholar] [CrossRef]
- Naik, S.; Goud, V.V.; Rout, P.K.; Jacobson, K.; Dalai, A.K. Characterization of Canadian biomass for alternative renewable biofuel. Renew. Energy 2010, 35, 1624–1631. [Google Scholar] [CrossRef]
- Chan, W.P.; Wang, J.-Y. Characterisation of sludge for pyrolysis conversion process based on biomass composition analysis and simulation of pyrolytic properties. Waste Manag. 2018, 72, 274–286. [Google Scholar] [CrossRef]
- Madsen, R.B.; Zhang, H.B.; Goldstein, P.; Glasius, M.A.H. Characterizing Semivolatile Organic Compounds of Biocrude from Hydrothermal Liquefaction of Biomass. Energy Fuels 2017, 31, 4122–4134. [Google Scholar] [CrossRef]
- Sharma, K.; Shah, A.A.; Toor, S.S.; Seehar, T.H.; Pedersen, T.H.; Rosendahl, L.A. Co-Hydrothermal Liquefaction of Lignocellulosic Biomass in Supercritical Water. Energies 2021, 14, 1708. [Google Scholar] [CrossRef]
- Singh, M.V.; Kumar, S.; Sarker, M. Waste HD-PE plastic, deformation into liquid hydrocarbon fuel using pyrolysis-catalytic cracking with a CuCO3 catalyst. Sustain. Energy Fuels 2018, 2, 1057–1068. [Google Scholar] [CrossRef]
- Zannikos, F.; Kalligeros, A.; Kalligeros, S.; Lois, E. Converting Biomass and Waste Plastic to Solid Fuel Briquettes. J. Renew. Energy 2013, 2013, 360368. [Google Scholar] [CrossRef]
- Mallow, O.; Spacek, S.; Schwarzböck, T.; Fellner, J.; Rechberger, H. A new thermoanalytical method for the quantification of microplastics in industrial wastewater. Environ. Pollut. 2020, 259, 113862. [Google Scholar] [CrossRef]
- Ahmad, N.; Sahrin, N.; Talib, N.; Ghani, F.S.A. Characterization of energy content in food waste by using thermogravimetric analyser (TGA) and elemental analyser (CHNS-O). J. Phys. Conf. Ser. 2019, 1349, 012140. [Google Scholar] [CrossRef]
- Goli, V.S.N.S.; Singh, P.; Singh, D.N.S.; Tak, L.K. Investigations on characteristics of landfill-mined-soil-like-fractions and their dependency on organic matter. Process Saf. Environ. Prot. 2022, 162, 795–812. [Google Scholar] [CrossRef]
- Razmjoo, P.; Pourzamami, H.; Teiri, H.; Hajizadeh, Y. Determination of an empirical formula for organic composition of mature compost produced in Isfahan-Iran composting plant in 2013. Int. J. Environ. Health Eng. 2015, 4, 3. [Google Scholar] [CrossRef]
- Ahmadi, M.; Asadinezhad, A. Synthesis and characterization of azodianiline covalent organic frameworks intended for energy storage. J. Mol. Struct. 2023, 1286, 135647. [Google Scholar] [CrossRef]
- Patterson, R.K. Automated Pregl-Dumas technique for determining total carbon, hydrogen, and nitrogen in atmospheric aerosols. Anal. Chem. 1973, 45, 605–609. [Google Scholar] [CrossRef]
- Hartmann, C.H. Gas chromatography detectors. Anal. Chem. 1971, 43, 113–125. [Google Scholar] [CrossRef]
- Chen, K.; Mackie, J.C.; Kennedy, E.M.; Dlugogorski, B.Z. Determination of toxic products released in combustion of pesticides. Prog. Energy Combust. Sci. 2012, 38, 400–418. [Google Scholar] [CrossRef]
- Campanile, V.A.; Badley, J.H.; Peters, E.D.; Agazzi, E.J.; Brooks, F.R. Improved Method for Determination of Oxygen. Anal. Chem. 1951, 23, 1421–1426. [Google Scholar] [CrossRef]
- Ras, M.R.; Borrull, F.; Marcé, R.M. Sampling and preconcentration techniques for determination of volatile organic compounds in air samples. TrAC Trends Anal. Chem. 2008, 28, 347–361. [Google Scholar] [CrossRef]
- Poole, S.K.; Dean, T.A.; Oudsema, J.W.; Poole, C.F. Sample preparation for chromatographic separations: An overview. Anal. Chim. Acta 1990, 236, 3–42. [Google Scholar] [CrossRef]
- Poole, C.F.; Poole, S.K. Sample Preparation for Chromatographic Analysis. In Chromatography Today; Elsevier: Amsterdam, The Netherlands, 1991; 1026p. [Google Scholar]
- Pawliszyn, J. New directions in sample preparation for analysis of organic compounds. TrAC Trends Anal. Chem. 1995, 14, 113–122. [Google Scholar] [CrossRef]
- Tiwari, M.; Dirbeba, M.J.; Lehmusto, J.; Yrjas, P.; Vinu, R. Analytical and applied pyrolysis of challenging biomass feedstocks: Effect of pyrolysis conditions on product yield and composition. J. Anal. Appl. Pyrolysis 2024, 177, 106355. [Google Scholar] [CrossRef]
- Bojkovic, A.; Vermeire, F.H.; Kuzmanović, M.D.T.; Hang, V.G.; Kevin, M. Analytics Driving Kinetics: Advanced Mass Spectrometric Characterization of Petroleum Products. Energy Fuels 2022, 36, 6–59. [Google Scholar] [CrossRef]
- Dettman, H.D.; Wade, T.L.; French-McCay, D.P.; Bejarano, A.C.; Hollebone, B.P.; Faksness, L.-G.; Mirnaghi, F.S.; Yang, Z.; Loughery, J.; Pretorius, T.; et al. Recommendations for the advancement of oil-in-water media and source oil characterization in aquatic toxicity test studies. Aquat. Toxicol. 2023, 261, 106582. [Google Scholar] [CrossRef]
- Colleoni, E.; Samaras, V.G.; Guida, P.; Frassoldati, A.; Faravelli, T.; Roberts, W.L. Unraveling the complexity of pyrolysates from residual fuels by Py-GCxGC-FID/SCD/TOF-MS with an innovative data processing method. J. Anal. Appl. Pyrolysis 2023, 175, 106204. [Google Scholar] [CrossRef]
- Madsen, R.B.; Bernberg, R.Z.K.; Biller, P.; Becker, J.; Iversen, B.B.; Glasius, M. Hydrothermal co-liquefaction of biomasses—Quantitative analysis of bio-crude and aqueous phase composition. Sustain. Energy Fuels 2017, 1, 789–805. [Google Scholar] [CrossRef]
- Friederici, L.; Meščeriakovė, S.-M.; Neumann, A.; Sermyagina, E.; Meščeriakovas, A.; Lähde, A.; Grimmer, C.; Streibel, T.; Rüger, C.P.; Zimmermann, R. Effect of hydrothermal carbonization and eutectic salt mixture (KCl/LiCl) on the pyrolysis of Kraft lignin as revealed by thermal analysis coupled to advanced high-resolution mass spectrometry. J. Anal. Appl. Pyrolysis 2022, 166, 105604. [Google Scholar] [CrossRef]
- Ourak, M.; Gallego, M.M.; Burnens, G.; Largeau, J.-F.; Sana, K.; Zagrouba, F.; Tazerout, M. Experimental Study of Pyrolytic Oils from Used Tires: Impact of Secondary Reactions on Liquid Composition. Waste Biomass Valorization 2021, 12, 4663–4678. [Google Scholar] [CrossRef]
- Pandey, S.P.; Kumar, S. Valorisation of argemone mexicana seeds to renewable fuels by thermochemical conversion process. J. Environ. Chem. Eng. 2020, 8, 104271. [Google Scholar] [CrossRef]
- Mancini, S.D.; Schwartzman, J.A.S.; Nogueira, A.R.; Kagohara, D.A.; Zanin, M. Additional steps in mechanical recycling of PET. J. Clean. Prod. 2010, 18, 92–100. [Google Scholar] [CrossRef]
- Asadieraghi, M.; Daud, W.M.A.W. In-situ catalytic upgrading of biomass pyrolysis vapor: Using a cascade system of various catalysts in a multi-zone fixed bed reactor. Energy Convers. Manag. 2015, 101, 151–163. [Google Scholar] [CrossRef]
- Kříbek, B.; Bičáková, O.; Sýkorová, I.; Havelcová, M.; Veselovský, F.; Knésl, I.; Mészárosová, N. Experimental pyrolysis of metalliferous coal: A contribution to the understanding of pyrometamorphism of organic matter and sulfides during coal waste heaps fires. Int. J. Coal Geol. 2021, 245, 103817. [Google Scholar] [CrossRef]
- Cazier, F.; Genevray, P.; Dewaele, D.; Nouali, H.; Verdin, A.; Ledoux, F.; Hachimi, A.; Courcot, L.; Billet, S.; Bouhsina, S.; et al. Characterisation and seasonal variations of particles in the atmosphere of rural, urban and industrial areas: Organic compounds. J. Environ. Sci. 2016, 44, 45–56. [Google Scholar] [CrossRef]
- Khan, A.; Mirza, M.; Fahlman, B.; Rybchuk, R.; Yang, J.; Harfield, D.; Anyia, A.O. Mapping Thermomechanical Pulp Sludge (TMPS) Biochar Characteristics for Greenhouse Produce Safety. J. Agric. Food Chem. 2015, 63, 1648–1657. [Google Scholar] [CrossRef]
- Ali, D.; Agarwal, R.; Hanifa, M.; Rawat, P.; Paswan, R.; Rai, D.; Tyagi, I.; Naik, B.S.; Pippal, A. Thermo-physical properties and microstructural behaviour of biochar-incorporated cementitious material. J. Build. Eng. 2023, 64, 105695. [Google Scholar] [CrossRef]
- Masoumi, S.; Boahene, P.E.; Dalai, A.K. Biocrude oil and hydrochar production and characterization obtained from hydrothermal liquefaction of microalgae in methanol-water system. Energy 2021, 217, 119344. [Google Scholar] [CrossRef]
- Heracleous, E.; Vassou, M.; Lappas, A.A.; Rodriguez, J.K.; Chiaberge, S.; Bianchi, D. Understanding the Upgrading of Sewage Sludge-Derived Hydrothermal Liquefaction Biocrude via Advanced Characterization. Energy Fuels 2022, 36, 12010–12020. [Google Scholar] [CrossRef]
- Jayanth, T.A.S.; Mamindlapelli, N.K.; Begum, S.; Arelli, V.; Juntupally, S.; Ahuja, S.; Dugyala, S.K.; Anupoju, G.R. Anaerobic mono and co-digestion of organic fraction of municipal solid waste and landfill leachate at industrial scale: Impact of volatile organic loading rate on reaction kinetics, biogas yield and microbial diversity. Sci. Total Environ. 2020, 748, 142462. [Google Scholar] [CrossRef]
- Hernowo, P.; Steven, S.; Restiawaty, E.; Irawan, A.; Carolus, C.B.; Marno, S.; Meliana, Y.; Bindar, Y. Chemicals component yield prediction and kinetic parameters determination of oil palm shell pyrolysis through volatile state approach and experimental study. J. Anal. Appl. Pyrolysis 2022, 161, 105399. [Google Scholar] [CrossRef]
- Peters, M.A.; Alves, C.T.; Wang, J.; Onwudili, J.A. Subcritical Water Hydrolysis of Fresh and Waste Cooking Oils to Fatty Acids Followed by Esterification to Fatty Acid Methyl Esters: Detailed Characterization of Feedstocks and Products. ACS Omega 2022, 7, 46870–46883. [Google Scholar] [CrossRef]
- Climent, M.J.; Corma, A.; Iborra, S. Conversion of biomass platform molecules into fuel additives and liquid hydrocarbon fuels. Green Chem. 2014, 16, 516–547. [Google Scholar] [CrossRef]
- Wabeke, J.T.; Al-Zubaidi, H.; Adams, C.P.; Ariyadasa, L.A.W.; Nick, S.T.; Bolandi, A.; Ofoli, R.Y.; Obare, S.O. Synthesis of Nanoparticles for Biomass Conversion Processes. Green Technol. Environ. 2014, 12, 219–246. [Google Scholar] [CrossRef]
- Onwudili, J.A.; Williams, P.T. Catalytic and non-catalytic low-pressure hydrothermal liquefaction of pinewood sawdust, polyolefin plastics and their mixtures. J. Clean. Prod. 2023, 430, 139733. [Google Scholar] [CrossRef]
- Firestone, D. Official Methods and Recommended Practices of American Oil Chemist’s Society, 6th ed.; AOCS Press: Champaign, IL, USA, 2009. [Google Scholar]
- Alves, C.T.; Peters, M.A.; Onwudili, J.A. Application of thermogravimetric analysis method for the characterisation of products from triglycerides during biodiesel production. J. Anal. Appl. Pyrolysis 2022, 168, 105766. [Google Scholar] [CrossRef]

| Elemental Composition | ||||||
|---|---|---|---|---|---|---|
| Standards | Analysis | C (wt%) | H (wt%) | N (wt%) | S (wt%) | O (wt%) |
| Mixture 1 | Method 1 | 84.02 ± 0.23 | 15.41 ± 0.02 | 0.20 ± 0.00 | 0 | 0.47 ± 0.22 |
| Method 2 | 86.05 ± 0.49 | 13.95 ± 0.21 | 0 | 0 | 0 | |
| Theoretical | 86.10 | 13.90 | 0 | 0 | 0 | |
| Mixture 2 | Method 1 | 71.53 ± 14.76 | 11.89 ± 0.02 | 0.10 ± 0.02 | 0 | 16.48 ± 18.0 |
| Method 2 | 86.94 ± 0.80 | 13.06 ± 0.11 | 0 | 0 | 0 | |
| Theoretical | 88.79 | 11.21 | 0 | 0 | 0 | |
| Mixture 3 | Method 1 | 64.20 ± 6.11 | 11.35 ± 1.02 | 0.11 ± 1.02 | 0 | 24.33 ± 7.10 |
| Method 2 | 85.73 ± 0.58 | 14.27± 0.15 | 0 | 0 | 0 | |
| Theoretical | 86.90 | 13.10 | 0 | 0 | 0 | |
| RT (min) | Compounds Present | Formula | RI | No. C Atoms | No. H Atoms | No. O Atoms | No. of C Atoms × 12.011 | No. of H Atoms × 1.008 | No. of O Atoms × 15.999 | Mol. Wt. | wt% Yield in Final Oil | wt% C | wt% H | wt% O |
|---|---|---|---|---|---|---|---|---|---|---|---|---|---|---|
| 2.757 | Heptane | C7H16 | 700 | 7 | 16 | 0 | 84.077 | 16.128 | 0.00 | 100.205 | 5.145 | 4.317 | 0.828 | 0.000 |
| 3.855 | Toluene | C7H8 | 762 | 7 | 8 | 0 | 84.077 | 8.064 | 0.00 | 92.141 | 0.460 | 0.420 | 0.040 | 0.000 |
| 4.536 | Octane | C8H18 | 800 | 8 | 18 | 0 | 96.088 | 18.144 | 0.00 | 114.232 | 6.276 | 5.279 | 0.997 | 0.000 |
| 6.463 | Ethylbenzene | C8H10 | 863 | 8 | 10 | 0 | 96.088 | 10.08 | 0.00 | 106.168 | 0.665 | 0.602 | 0.063 | 0.000 |
| 7.416 | o-Xylene | C8H10 | 895 | 8 | 10 | 0 | 96.088 | 10.08 | 0.00 | 106.168 | 1.357 | 1.228 | 0.129 | 0.000 |
| 7.581 | Nonane | C9H20 | 900 | 9 | 20 | 0 | 108.099 | 20.16 | 0.00 | 128.259 | 6.572 | 5.539 | 1.033 | 0.000 |
| 9.208 | Propyl benzene | C9H12 | 957 | 9 | 12 | 0 | 108.099 | 12.096 | 0.00 | 120.195 | 0.248 | 0.223 | 0.025 | 0.000 |
| 9.935 | 1-Ethyl-2-methylbenzene | C9H12 | 983 | 9 | 12 | 0 | 108.099 | 12.096 | 0.00 | 120.195 | 1.509 | 1.358 | 0.152 | 0.000 |
| 10.429 | Decane | C10H22 | 1000 | 10 | 22 | 0 | 120.11 | 22.176 | 0.00 | 142.286 | 6.082 | 5.134 | 0.948 | 0.000 |
| 12.063 | 1,3-Diethylbenzene | C10H14 | 1066 | 10 | 14 | 0 | 120.11 | 14.112 | 0.00 | 134.222 | 0.450 | 0.403 | 0.047 | 0.000 |
| 12.194 | 1-Methyl-2-propylbenzene | C10H14 | 1071 | 10 | 14 | 0 | 120.11 | 14.112 | 0.00 | 134.222 | 0.961 | 0.860 | 0.101 | 0.000 |
| 12.689 | 1-Ethenyl-4-ethylbenzene | C10H10 | 1091 | 10 | 10 | 0 | 120.11 | 10.08 | 0.00 | 130.19 | 0.244 | 0.225 | 0.019 | 0.000 |
| 12.905 | Undecane | C11H24 | 1200 | 11 | 24 | 0 | 132.121 | 24.192 | 0.00 | 156.313 | 5.633 | 4.761 | 0.872 | 0.000 |
| 14.013 | (1,1-Dimethylpropyl) benzene | C11H16 | 1245 | 11 | 16 | 0 | 132.121 | 16.128 | 0.00 | 148.249 | 0.393 | 0.351 | 0.043 | 0.000 |
| 14.155 | 1-Phenyl-1-butene | C10H12 | 1150 | 10 | 12 | 0 | 120.11 | 12.096 | 0.00 | 132.206 | 0.322 | 0.293 | 0.029 | 0.000 |
| 14.489 | 1-Methyl-4-butylbenzene | C11H16 | 1264 | 11 | 16 | 0 | 132.121 | 16.128 | 0.00 | 148.249 | 0.555 | 0.494 | 0.060 | 0.000 |
| 14.938 | Naphthalene | C10H8 | 1182 | 10 | 8 | 0 | 120.11 | 8.064 | 0.00 | 128.174 | 0.390 | 0.366 | 0.025 | 0.000 |
| 15.082 | Dodecane | C12H26 | 1200 | 12 | 26 | 0 | 144.132 | 26.208 | 0.00 | 170.34 | 5.225 | 4.421 | 0.804 | 0.000 |
| 16.534 | (1,3-dimethylbutyl) benzene | C12H18 | 1274 | 12 | 18 | 0 | 144.132 | 18.144 | 0.00 | 162.276 | 0.364 | 0.324 | 0.041 | 0.000 |
| 17.048 | Tridecane | C13H28 | 1300 | 13 | 28 | 0 | 156.143 | 28.224 | 0.00 | 184.367 | 4.499 | 3.810 | 0.689 | 0.000 |
| 17.174 | 1-Methyl naphthalene | C11H10 | 1372 | 11 | 10 | 0 | 132.121 | 10.08 | 0.00 | 142.201 | 0.309 | 0.287 | 0.022 | 0.000 |
| 18.437 | 1-Methyl-2-n-hexylbenzene | C13H20 | 1377 | 13 | 20 | 0 | 156.143 | 20.16 | 0.00 | 176.303 | 0.305 | 0.270 | 0.035 | 0.000 |
| 18.858 | Tetradecane | C14H30 | 1400 | 14 | 30 | 0 | 168.154 | 30.24 | 0.00 | 198.394 | 3.923 | 3.325 | 0.598 | 0.000 |
| 20.222 | (1-Methylheptyl) benzene | C14H22 | 1481 | 14 | 22 | 0 | 168.154 | 22.176 | 0.00 | 190.33 | 0.296 | 0.262 | 0.035 | 0.000 |
| 20.547 | Pentadecane | C15H32 | 1500 | 15 | 32 | 0 | 180.165 | 32.256 | 0.00 | 212.421 | 6.065 | 5.144 | 0.921 | 0.000 |
| 22.13 | Hexadecane | C16H34 | 1600 | 16 | 34 | 0 | 192.176 | 34.272 | 0.00 | 226.448 | 1.709 | 1.451 | 0.259 | 0.000 |
| 22.777 | 2,6,10-Trimethyltridecane | C16H34 | 1647 | 16 | 34 | 0 | 192.176 | 34.272 | 0.00 | 226.448 | 0.763 | 0.648 | 0.116 | 0.000 |
| 22.949 | 4-Methyl pentadecane | C16H34 | 1660 | 16 | 34 | 0 | 192.176 | 34.272 | 0.00 | 226.448 | 0.467 | 0.397 | 0.071 | 0.000 |
| 23.018 | 2-Methyl hexadecane | C17H36 | 1657 | 17 | 36 | 0 | 204.187 | 36.288 | 0.00 | 240.475 | 1.135 | 0.964 | 0.171 | 0.000 |
| 23.125 | 3-Methyl hexadecane | C17H36 | 1667 | 17 | 38 | 0 | 204.187 | 38.304 | 0.00 | 242.491 | 0.813 | 0.685 | 0.128 | 0.000 |
| 23.506 | Heptadecane | C17H36 | 1700 | 17 | 36 | 0 | 204.187 | 36.288 | 0.00 | 240.475 | 30.155 | 25.605 | 4.550 | 0.000 |
| 23.635 | (1-Methyldecyl) benzene | C17H28 | 1711 | 17 | 28 | 0 | 204.187 | 28.224 | 0.00 | 232.411 | 0.674 | 2.173 | 0.300 | 0.000 |
| 24.222 | (1,1-Dimethylnonyl) benzene | C17H28 | 1763 | 17 | 28 | 0 | 204.187 | 28.224 | 0.00 | 232.411 | 0.370 | 0.325 | 0.045 | 0.000 |
| 24.542 | Undecyl benzene | C17H28 | 1790 | 17 | 28 | 0 | 204.187 | 28.224 | 0.00 | 232.411 | 0.346 | 0.304 | 0.042 | 0.000 |
| 24.651 | Octadecane | C18H38 | 1800 | 18 | 38 | 0 | 216.198 | 38.304 | 0.00 | 254.502 | 0.500 | 0.425 | 0.075 | 0.000 |
| 25.663 | Nonadecane | C19H40 | 1900 | 19 | 40 | 0 | 228.209 | 40.32 | 0.00 | 268.529 | 0.628 | 0.534 | 0.094 | 0.000 |
| Unreacted fatty acids (as Octadec-9-enoic acid) | C18H36O2 | - | 18 | 36 | 2 | 216.198 | 36.288 | 31.998 | 284.484 | 2.340 | 1.778 | 0.298 | 0.263 | |
| Total for each element | 84.983 | 14.705 | 0.263 |
| RT (min) | Compounds Present | Formula | RI | No. C Atoms | No. H Atoms | No. O Atoms | No. of C Atoms × 12.011 | No. of H Atoms × 1.008 | No. of O Atoms × 15.999 | Mol. Wt. | wt% Yield in Final Oil | wt% C | wt% H | wt% O |
|---|---|---|---|---|---|---|---|---|---|---|---|---|---|---|
| 2.022 | Hexane | C6H14 | 600 | 6 | 14 | 0 | 72.066 | 14.112 | 0.000 | 86.178 | 2.270 | 1.898 | 0.372 | 0.000 |
| 2.462 | 2-Methyl hexane | C7H16 | 683 | 7 | 16 | 0 | 84.077 | 16.128 | 0.000 | 100.205 | 0.481 | 0.403 | 0.077 | 0.000 |
| 2.69 | Hept-1-ene | C7H14 | 695 | 7 | 14 | 0 | 84.077 | 14.112 | 0.000 | 98.189 | 0.375 | 0.321 | 0.054 | 0.000 |
| 2.776 | Heptane | C7H16 | 700 | 7 | 16 | 0 | 84.077 | 16.128 | 0.000 | 100.205 | 4.653 | 3.904 | 0.749 | 0.000 |
| 2.864 | (E)-Hept-2-ene | C7H14 | 705 | 7 | 14 | 0 | 84.077 | 14.112 | 0.000 | 98.189 | 0.425 | 0.364 | 0.061 | 0.000 |
| 3.879 | Toluene | C7H8 | 760 | 7 | 8 | 0 | 84.077 | 8.064 | 0.000 | 92.141 | 0.403 | 0.368 | 0.035 | 0.000 |
| 3.934 | 3-Methyl heptane | C8H18 | 776 | 8 | 18 | 0 | 96.088 | 18.144 | 0.000 | 114.232 | 0.344 | 0.289 | 0.055 | 0.000 |
| 4.349 | Oct-1-ene | C8H16 | 791 | 8 | 18 | 0 | 96.088 | 18.144 | 0.000 | 114.232 | 0.252 | 0.212 | 0.040 | 0.000 |
| 4.563 | 2,4-Dimethy heptane | C9H20 | 793 | 9 | 20 | 0 | 108.099 | 20.16 | 0.000 | 128.259 | 5.733 | 4.831 | 0.901 | 0.000 |
| 4.757 | (E)-Oct-2-ene | C8H16 | 805 | 8 | 16 | 0 | 96.088 | 16.128 | 0.000 | 112.216 | 0.240 | 0.205 | 0.034 | 0.000 |
| 6.489 | Ethylbenzene | C8H10 | 863 | 8 | 10 | 0 | 96.088 | 10.08 | 0.000 | 106.168 | 0.542 | 0.491 | 0.051 | 0.000 |
| 6.732 | (3,3-dimethylbutyl)-benzene | C12H18 | - | 12 | 18 | 0 | 144.132 | 18.144 | 0.000 | 162.276 | 0.358 | 0.318 | 0.040 | 0.000 |
| 7.351 | Non-1-ene | C9HJ18 | 891 | 9 | 18 | 0 | 108.099 | 18.144 | 0.000 | 126.243 | 0.282 | 0.241 | 0.041 | 0.000 |
| 7.442 | o-Xylene | C8H10 | 895 | 8 | 10 | 0 | 96.088 | 10.08 | 0.000 | 106.168 | 0.292 | 0.264 | 0.028 | 0.000 |
| 7.604 | Nonane | C9H20 | 900 | 9 | 20 | 0 | 108.099 | 20.16 | 0.000 | 128.259 | 6.460 | 5.445 | 1.015 | 0.000 |
| 7.799 | (E)-2-Nonene | C9H18 | 907 | 9 | 18 | 0 | 108.099 | 18.144 | 0.000 | 126.243 | 0.375 | 0.321 | 0.054 | 0.000 |
| 9.228 | Propyl benzene | C9H12 | 957 | 9 | 12 | 0 | 108.099 | 12.096 | 0.000 | 120.195 | 0.156 | 0.140 | 0.016 | 0.000 |
| 9.661 | 3-Methyl nonane | C10H22 | 968 | 10 | 22 | 0 | 120.11 | 22.176 | 0.000 | 142.286 | 0.238 | 0.201 | 0.037 | 0.000 |
| 9.956 | 1-ethyl-2-methylbenzene | C9H12 | 983 | 9 | 12 | 0 | 108.099 | 12.096 | 0.000 | 120.195 | 0.261 | 0.235 | 0.026 | 0.000 |
| 10.324 | 1,3,5-trimethylbenzene | C9H12 | 996 | 9 | 12 | 0 | 108.099 | 12.096 | 0.000 | 120.195 | 0.259 | 0.233 | 0.026 | 0.000 |
| 10.45 | Decane | C10H22 | 1000 | 10 | 22 | 0 | 120.11 | 22.176 | 0.000 | 142.286 | 6.412 | 5.412 | 0.999 | 0.000 |
| 10.607 | (E)-Dec-2-ene | C10H20 | 1004 | 10 | 20 | 0 | 120.11 | 20.16 | 0.000 | 140.27 | 0.263 | 0.226 | 0.038 | 0.000 |
| 11.917 | Ethyl 2-(4-isobutylphenyl)propionate | C15H22O2 | - | 15 | 22 | 2 | 180.165 | 22.176 | 31.998 | 234.339 | 0.951 | 0.716 | 0.090 | 0.147 |
| 12.077 | 2-Methyl decane | C11H24 | 1061 | 11 | 24 | 0 | 132.121 | 24.192 | 0.000 | 156.313 | 0.446 | 0.779 | 0.120 | 0.000 |
| 12.227 | (1,3,3-Trimethylnonyl) benzene | C18H30 | - | 18 | 30 | 0 | 216.198 | 30.24 | 0.000 | 246.438 | 0.291 | 0.255 | 0.036 | 0.000 |
| 12.729 | Octadecyl 2-ethylhexanoate | C24H48O | - | 24 | 48 | 1 | 288.264 | 48.384 | 15.999 | 352.647 | 0.453 | 0.370 | 0.062 | 0.021 |
| 12.928 | Undecane | C11H24 | 1100 | 11 | 24 | 0 | 132.121 | 24.192 | 0.000 | 156.313 | 5.883 | 4.973 | 0.911 | 0.000 |
| 14.041 | (1,1-Dimethylpropyl) benzene | C11H16 | 1151 | 11 | 16 | 0 | 132.121 | 16.128 | 0.000 | 148.249 | 0.206 | 0.183 | 0.022 | 0.000 |
| 14.289 | Pentyl benzene | C11H16 | 1163 | 11 | 16 | 0 | 132.121 | 16.128 | 0.000 | 148.249 | 0.161 | 0.143 | 0.018 | 0.000 |
| 14.49 | 3-Methyl undecane | C12H26 | 1169 | 12 | 26 | 0 | 144.132 | 26.208 | 0.000 | 170.34 | 0.254 | 0.215 | 0.039 | 0.000 |
| 15.105 | Dodecane | C12H26 | 1200 | 12 | 26 | 0 | 144.132 | 26.208 | 0.000 | 170.34 | 5.455 | 4.616 | 0.839 | 0.000 |
| 16.29 | 4-Methyl dodecane | C13H28 | 1264 | 13 | 28 | 0 | 156.143 | 28.224 | 0.000 | 184.367 | 0.320 | 0.271 | 0.049 | 0.000 |
| 17.072 | Tridecane | C13H28 | 1300 | 13 | 28 | 0 | 156.143 | 28.224 | 0.000 | 184.367 | 4.240 | 3.591 | 0.649 | 0.000 |
| 17.194 | 2-Methyl naphthalene | C11H10 | 1312 | 11 | 10 | 0 | 132.121 | 10.08 | 0.000 | 142.201 | 0.163 | 0.152 | 0.012 | 0.000 |
| 17.986 | 2-Hexyl decan-1-ol | C16H34O | 1337 | 16 | 34 | 1 | 192.176 | 34.272 | 15.999 | 242.447 | 0.306 | 0.242 | 0.043 | 0.020 |
| 18.23 | 2-Methyl tridecane | C14H30 | 1361 | 14 | 30 | 0 | 168.154 | 30.24 | 0.000 | 198.394 | 0.231 | 0.196 | 0.035 | 0.000 |
| 18.883 | Tetradecane | C14H30 | 1400 | 14 | 30 | 0 | 168.154 | 30.24 | 0.000 | 198.394 | 3.506 | 2.972 | 0.534 | 0.000 |
| 20.575 | Pentadecane | C15H32 | 1500 | 15 | 32 | 0 | 180.165 | 32.256 | 0.000 | 212.421 | 5.872 | 4.980 | 0.892 | 0.000 |
| 22.159 | Hexadecane | C16H34 | 1600 | 16 | 34 | 0 | 192.176 | 34.272 | 0.000 | 226.448 | 1.645 | 1.396 | 0.490 | 0.000 |
| 22.804 | 2,6,10-Trimethyltridecane | C16H34 | 1641 | 16 | 34 | 0 | 192.176 | 34.272 | 0.000 | 226.448 | 2.266 | 1.923 | 0.343 | 0.000 |
| 22.895 | 5-Methyl tetradecane | C15H32 | 1646 | 15 | 32 | 0 | 180.165 | 32.256 | 0.000 | 212.421 | 0.582 | 0.494 | 0.088 | 0.000 |
| 23.153 | 2-Methyl heptadecane | C18H38 | 1649 | 18 | 38 | 0 | 216.198 | 38.304 | 0.000 | 254.502 | 0.450 | 0.383 | 0.068 | 0.000 |
| 23.538 | Heptadecane | C17H36 | 1700 | 17 | 36 | 0 | 204.187 | 36.288 | 0.000 | 240.475 | 27.660 | 23.486 | 4.174 | 0.000 |
| 24.68 | Octadecane | C18H38 | 1800 | 18 | 38 | 0 | 216.198 | 38.304 | 0.000 | 254.502 | 0.428 | 0.363 | 0.064 | 0.000 |
| 25.693 | Nonadecane | C19H40 | 1900 | 19 | 40 | 0 | 228.209 | 40.32 | 0.000 | 268.529 | 0.435 | 0.370 | 0.065 | 0.000 |
| Unreacted fatty acids (as Octadec-9-enoic acid) | C18H36O2 | - | 18 | 36 | 2 | 216.198 | 36.288 | 31.998 | 284.484 | 2.980 | 2.265 | 0.380 | 0.335 | |
| Total for each element | 81.660 | 14.774 | 0.523 |
| RT (min) | Compounds Present | Formula | RI | No. C Atoms | No. H Atoms | No. O Atoms | No. of C Atoms × 12.011 | No. of H Atoms × 1.008 | No. of O Atoms × 15.999 | Mol. Wt. | wt% Yield in Final Oil | wt% C | wt% H | wt% O |
|---|---|---|---|---|---|---|---|---|---|---|---|---|---|---|
| 2.021 | Hexane | C6H14 | 600 | 6 | 14 | 0 | 72.066 | 14.112 | 0.000 | 86.178 | 4.065 | 3.399 | 0.666 | 0.000 |
| 2.207 | Methyl cyclopentane | C6H12 | 625 | 6 | 12 | 0 | 72.066 | 12.096 | 0.000 | 84.162 | 0.619 | 0.530 | 0.089 | 0.000 |
| 2.468 | Benzene | C6H6 | 659 | 6 | 6 | 0 | 72.066 | 6.048 | 0.000 | 78.114 | 1.034 | 0.954 | 0.080 | 0.000 |
| 2.694 | 1,2-Dimethyl cyclopentane | C7H14 | 695 | 7 | 14 | 0 | 84.077 | 14.112 | 0.000 | 98.189 | 0.430 | 0.368 | 0.062 | 0.000 |
| 2.777 | Heptane | C7H16 | 700 | 7 | 16 | 0 | 84.077 | 16.128 | 0.000 | 100.205 | 6.819 | 5.721 | 1.098 | 0.000 |
| 3.12 | Methyl cyclohexane | C7H14 | 719 | 7 | 14 | 0 | 84.077 | 14.112 | 0.000 | 98.189 | 0.407 | 0.349 | 0.059 | 0.000 |
| 3.276 | Ethyl cyclopentane | C7H14 | 727 | 7 | 14 | 0 | 84.077 | 14.112 | 0.000 | 98.189 | 0.599 | 0.513 | 0.086 | 0.000 |
| 3.878 | Toluene | C7H8 | 760 | 7 | 8 | 0 | 84.077 | 8.064 | 0.000 | 92.141 | 2.378 | 2.170 | 0.208 | 0.000 |
| 4.565 | 2,4-Dimethyl heptane | C9H20 | 793 | 9 | 20 | 0 | 108.099 | 20.160 | 0.000 | 128.259 | 7.509 | 6.329 | 1.180 | 0.000 |
| 5.552 | Propyl cyclopentane | C8H16 | 832 | 8 | 16 | 0 | 96.088 | 16.128 | 0.000 | 112.216 | 0.354 | 0.304 | 0.051 | 0.000 |
| 6.488 | Ethylbenzene | C7H10 | 863 | 8 | 10 | 0 | 96.088 | 10.080 | 0.000 | 106.168 | 1.279 | 1.157 | 0.121 | 0.000 |
| 6.731 | p-Xylene | C7H10 | 871 | 8 | 10 | 0 | 96.088 | 10.080 | 0.000 | 106.168 | 0.823 | 0.745 | 0.078 | 0.000 |
| 7.442 | o-Xylene | C7H10 | 895 | 8 | 10 | 0 | 96.088 | 10.080 | 0.000 | 106.168 | 1.584 | 1.433 | 0.150 | 0.000 |
| 7.606 | Nonane | C9H20 | 900 | 9 | 20 | 0 | 108.099 | 20.160 | 0.000 | 128.259 | 7.299 | 6.152 | 1.147 | 0.000 |
| 7.813 | trans-1,2-Diethyl cyclopentane | C9H18 | 907 | 9 | 18 | 0 | 108.099 | 18.144 | 0.000 | 126.243 | 0.433 | 0.371 | 0.062 | 0.000 |
| 9.229 | Propyl benzene | C9H12 | 957 | 9 | 12 | 0 | 108.099 | 12.096 | 0.000 | 120.195 | 0.495 | 0.445 | 0.050 | 0.000 |
| 9.455 | 1-Ethyl-3-methyl benzene | C9H12 | 965 | 9 | 12 | 0 | 108.099 | 12.096 | 0.000 | 120.195 | 2.065 | 3.428 | 0.384 | 0.000 |
| 10.329 | 1,3,5-trimethylbenzene | C9H12 | 996 | 9 | 12 | 0 | 108.099 | 12.096 | 0.000 | 120.195 | 0.966 | 0.869 | 0.097 | 0.000 |
| 10.451 | Decane | C10H22 | 1000 | 10 | 22 | 0 | 120.110 | 22.176 | 0.000 | 142.286 | 6.764 | 5.709 | 1.054 | 0.000 |
| 11.453 | Indane | C9H10 | 1035 | 9 | 10 | 0 | 108.099 | 10.080 | 0.000 | 118.179 | 0.552 | 0.505 | 0.047 | 0.000 |
| 11.941 | n-Butyl benzene | C10H14 | 1060 | 10 | 14 | 0 | 120.110 | 14.112 | 0.000 | 134.222 | 0.659 | 0.590 | 0.069 | 0.000 |
| 12.084 | 1,3-Diethyl benzene, | C10H14 | 1066 | 10 | 14 | 0 | 120.110 | 14.112 | 0.000 | 134.222 | 0.321 | 0.287 | 0.034 | 0.000 |
| 12.216 | 1-Methyl-2-propyl benzene | C10H14 | 1071 | 10 | 14 | 0 | 120.110 | 14.112 | 0.000 | 134.222 | 0.595 | 0.533 | 0.063 | 0.000 |
| 12.505 | 1-Methyl-3-(1-methylethyl) benzene | C10H14 | 1083 | 10 | 14 | 0 | 120.110 | 14.112 | 0.000 | 134.222 | 0.193 | 0.173 | 0.020 | 0.000 |
| 12.71 | 1-Methyl indane | C10H12 | 1091 | 10 | 12 | 0 | 120.110 | 12.096 | 0.000 | 132.206 | 0.398 | 0.362 | 0.036 | 0.000 |
| 12.927 | Undecane | C11H24 | 1100 | 11 | 24 | 0 | 132.121 | 24.192 | 0.000 | 156.313 | 5.814 | 4.914 | 0.900 | 0.000 |
| 13.166 | 1-methyl-4-isopropylbenzene | C10H14 | 1110 | 10 | 14 | 0 | 120.110 | 14.112 | 0.000 | 134.222 | 0.184 | 0.165 | 0.019 | 0.000 |
| 13.927 | 2,3-Dihydro-5-methyl-1H-indene | C10H12 | 1146 | 11 | 14 | 0 | 132.121 | 14.112 | 0.000 | 146.233 | 0.287 | 0.259 | 0.028 | 0.000 |
| 14.037 | (1,1-Dimethylpropyl) benzene | C11H16 | 1151 | 11 | 16 | 0 | 132.121 | 16.128 | 0.000 | 148.249 | 0.401 | 0.358 | 0.044 | 0.000 |
| 14.177 | 1-Methyl-2-(2-propenyl) benzene | C10H12 | 1150 | 10 | 12 | 0 | 120.110 | 12.096 | 0.000 | 132.206 | 0.685 | 0.623 | 0.063 | 0.000 |
| 14.291 | Pentyl benzene | C11H16 | 1163 | 11 | 16 | 0 | 132.121 | 16.128 | 0.000 | 148.249 | 0.466 | 0.415 | 0.051 | 0.000 |
| 14.511 | 1-Methyl-4-butyl benzene | C11H16 | 1173 | 11 | 16 | 0 | 132.121 | 16.128 | 0.000 | 148.249 | 0.335 | 0.299 | 0.036 | 0.000 |
| 14.954 | Naphthalene | C10H8 | 1182 | 10 | 8 | 0 | 120.110 | 8.064 | 0.000 | 128.174 | 1.060 | 0.993 | 0.067 | 0.000 |
| 15.103 | Dodecane | C12H26 | 1200 | 12 | 26 | 0 | 144.132 | 26.208 | 0.000 | 170.340 | 5.523 | 4.674 | 0.850 | 0.000 |
| 15.209 | 2,3-Dihydro-1,6-dimethyl-1H-indene | C11H14 | 1205 | 11 | 14 | 0 | 132.121 | 14.112 | 0.000 | 146.233 | 0.368 | 0.333 | 0.036 | 0.000 |
| 16.395 | Hexyl benzene | C12H18 | 1266 | 12 | 18 | 0 | 144.132 | 18.144 | 0.000 | 162.276 | 0.383 | 0.340 | 0.043 | 0.000 |
| 16.555 | (1,3-Dimethylbutyl) benzene | C10H14 | 1247 | 10 | 14 | 0 | 120.110 | 14.112 | 0.000 | 134.222 | 0.348 | 0.311 | 0.037 | 0.000 |
| 17.069 | Tridecane | C13H26 | 1300 | 13 | 26 | 0 | 156.143 | 26.208 | 0.000 | 182.351 | 3.973 | 3.402 | 0.571 | 0.000 |
| 17.533 | 2- Methyl naphthalene | C11H10 | 1312 | 11 | 10 | 0 | 132.121 | 10.080 | 0.000 | 142.201 | 1.188 | 1.104 | 0.084 | 0.000 |
| 18.881 | Tetradecane | C14H30 | 1400 | 14 | 30 | 0 | 168.154 | 30.240 | 0.000 | 198.394 | 2.935 | 2.488 | 0.447 | 0.000 |
| 19.034 | 2-Ethyl naphthalene | C12H12 | 1400 | 12 | 12 | 0 | 144.132 | 12.096 | 0.000 | 156.228 | 0.220 | 0.203 | 0.017 | 0.000 |
| 19.496 | 1,4-Dimethyl naphthalene | C12H12 | 1423 | 12 | 12 | 0 | 144.132 | 12.096 | 0.000 | 156.228 | 0.202 | 0.186 | 0.016 | 0.000 |
| 20.571 | Pentadecane | C15H32 | 1500 | 15 | 32 | 0 | 180.165 | 32.256 | 0.000 | 212.421 | 4.207 | 3.568 | 0.639 | 0.000 |
| 22.157 | Hexadecane | C16H34 | 1600 | 16 | 34 | 0 | 192.176 | 34.272 | 0.000 | 226.448 | 1.379 | 1.171 | 0.209 | 0.000 |
| 23.519 | Heptadecane | C17H34 | 1700 | 17 | 34 | 0 | 204.187 | 34.272 | 0.000 | 238.459 | 11.696 | 10.015 | 1.681 | 0.000 |
| Unreacted fatty acids (as Octadec-9-enoic acid) | C18H36O2 | - | 18 | 36 | 2 | 216.198 | 36.288 | 31.998 | 284.484 | 6.625 | 5.035 | 0.845 | 0.745 | |
| Total for each element | 84.248 | 13.672 | 0.745 |
| Elemental Compositions | ||||||
|---|---|---|---|---|---|---|
| Sample Code | Analysis | C (wt%) | H (wt%) | N (wt%) | S (wt%) | O (wt%) |
| Oil-Pt/C | Method 1 | 83.31 ± 3.20 | 13.93 ± 0.51 | 0.20 ± 0.00 | nd | 2.56 ± 0.08 |
| Method 2 | 84.99 ± 0.22 | 14.70 ± 0.53 | nd | nd | 0.26 ± 0.05 | |
| Oil-Pt/MgSiO3 | Method 1 | 68.58 ± 0.52 | 11.80 ± 0.16 | 0.13 ± 0.02 | nd | 19.49 ± 0.13 |
| Method 2 | 82.28 ± 0.27 | 14.27 ± 0.08 | nd | nd | 0.52 ± 0.10 | |
| Oil-Pt/Al2O3 | Method 1 | 59.24 ± 0.62 | 9.04 ± 0.08 | 0.13 ± 0.01 | nd | 31.59 ± 0.14 |
| Method 2 | 84.20 ± 0.88 | 13.72± 0.46 | nd | nd | 0.75 ± 0.12 | |
| Heavy Hydrocarbons (Mixture 1) | Light Hydrocarbons (Mixture 2) | Combined Light and Heavy Hydrocarbons (Mixture 3) |
|---|---|---|
| Hexadecane Heptadecane Octadecane | Ortho-xylene Toluene Decane | Ortho-xylene Toluene Decane Hexadecane Heptadecane Octadecane |
Disclaimer/Publisher’s Note: The statements, opinions and data contained in all publications are solely those of the individual author(s) and contributor(s) and not of MDPI and/or the editor(s). MDPI and/or the editor(s) disclaim responsibility for any injury to people or property resulting from any ideas, methods, instructions or products referred to in the content. |
© 2024 by the authors. Licensee MDPI, Basel, Switzerland. This article is an open access article distributed under the terms and conditions of the Creative Commons Attribution (CC BY) license (https://creativecommons.org/licenses/by/4.0/).
Share and Cite
Onwudili, J.A.; Peters, M.A.; Alves, C.T. CHNSO Elemental Analyses of Volatile Organic Liquids by Combined GC/MS and GC/Flame Ionisation Detection Techniques with Application to Hydrocarbon-Rich Biofuels. Molecules 2024, 29, 4346. https://doi.org/10.3390/molecules29184346
Onwudili JA, Peters MA, Alves CT. CHNSO Elemental Analyses of Volatile Organic Liquids by Combined GC/MS and GC/Flame Ionisation Detection Techniques with Application to Hydrocarbon-Rich Biofuels. Molecules. 2024; 29(18):4346. https://doi.org/10.3390/molecules29184346
Chicago/Turabian StyleOnwudili, Jude Azubuike, Morenike Ajike Peters, and Carine Tondo Alves. 2024. "CHNSO Elemental Analyses of Volatile Organic Liquids by Combined GC/MS and GC/Flame Ionisation Detection Techniques with Application to Hydrocarbon-Rich Biofuels" Molecules 29, no. 18: 4346. https://doi.org/10.3390/molecules29184346
APA StyleOnwudili, J. A., Peters, M. A., & Alves, C. T. (2024). CHNSO Elemental Analyses of Volatile Organic Liquids by Combined GC/MS and GC/Flame Ionisation Detection Techniques with Application to Hydrocarbon-Rich Biofuels. Molecules, 29(18), 4346. https://doi.org/10.3390/molecules29184346