

A Diboronic Acid-Based Fluorescent Sensor Array for Rapid Identification of Lonicerae Japonicae Flos and Lonicerae Flos
 and
and
Abstract
1. Introduction
2. Results and Discussion
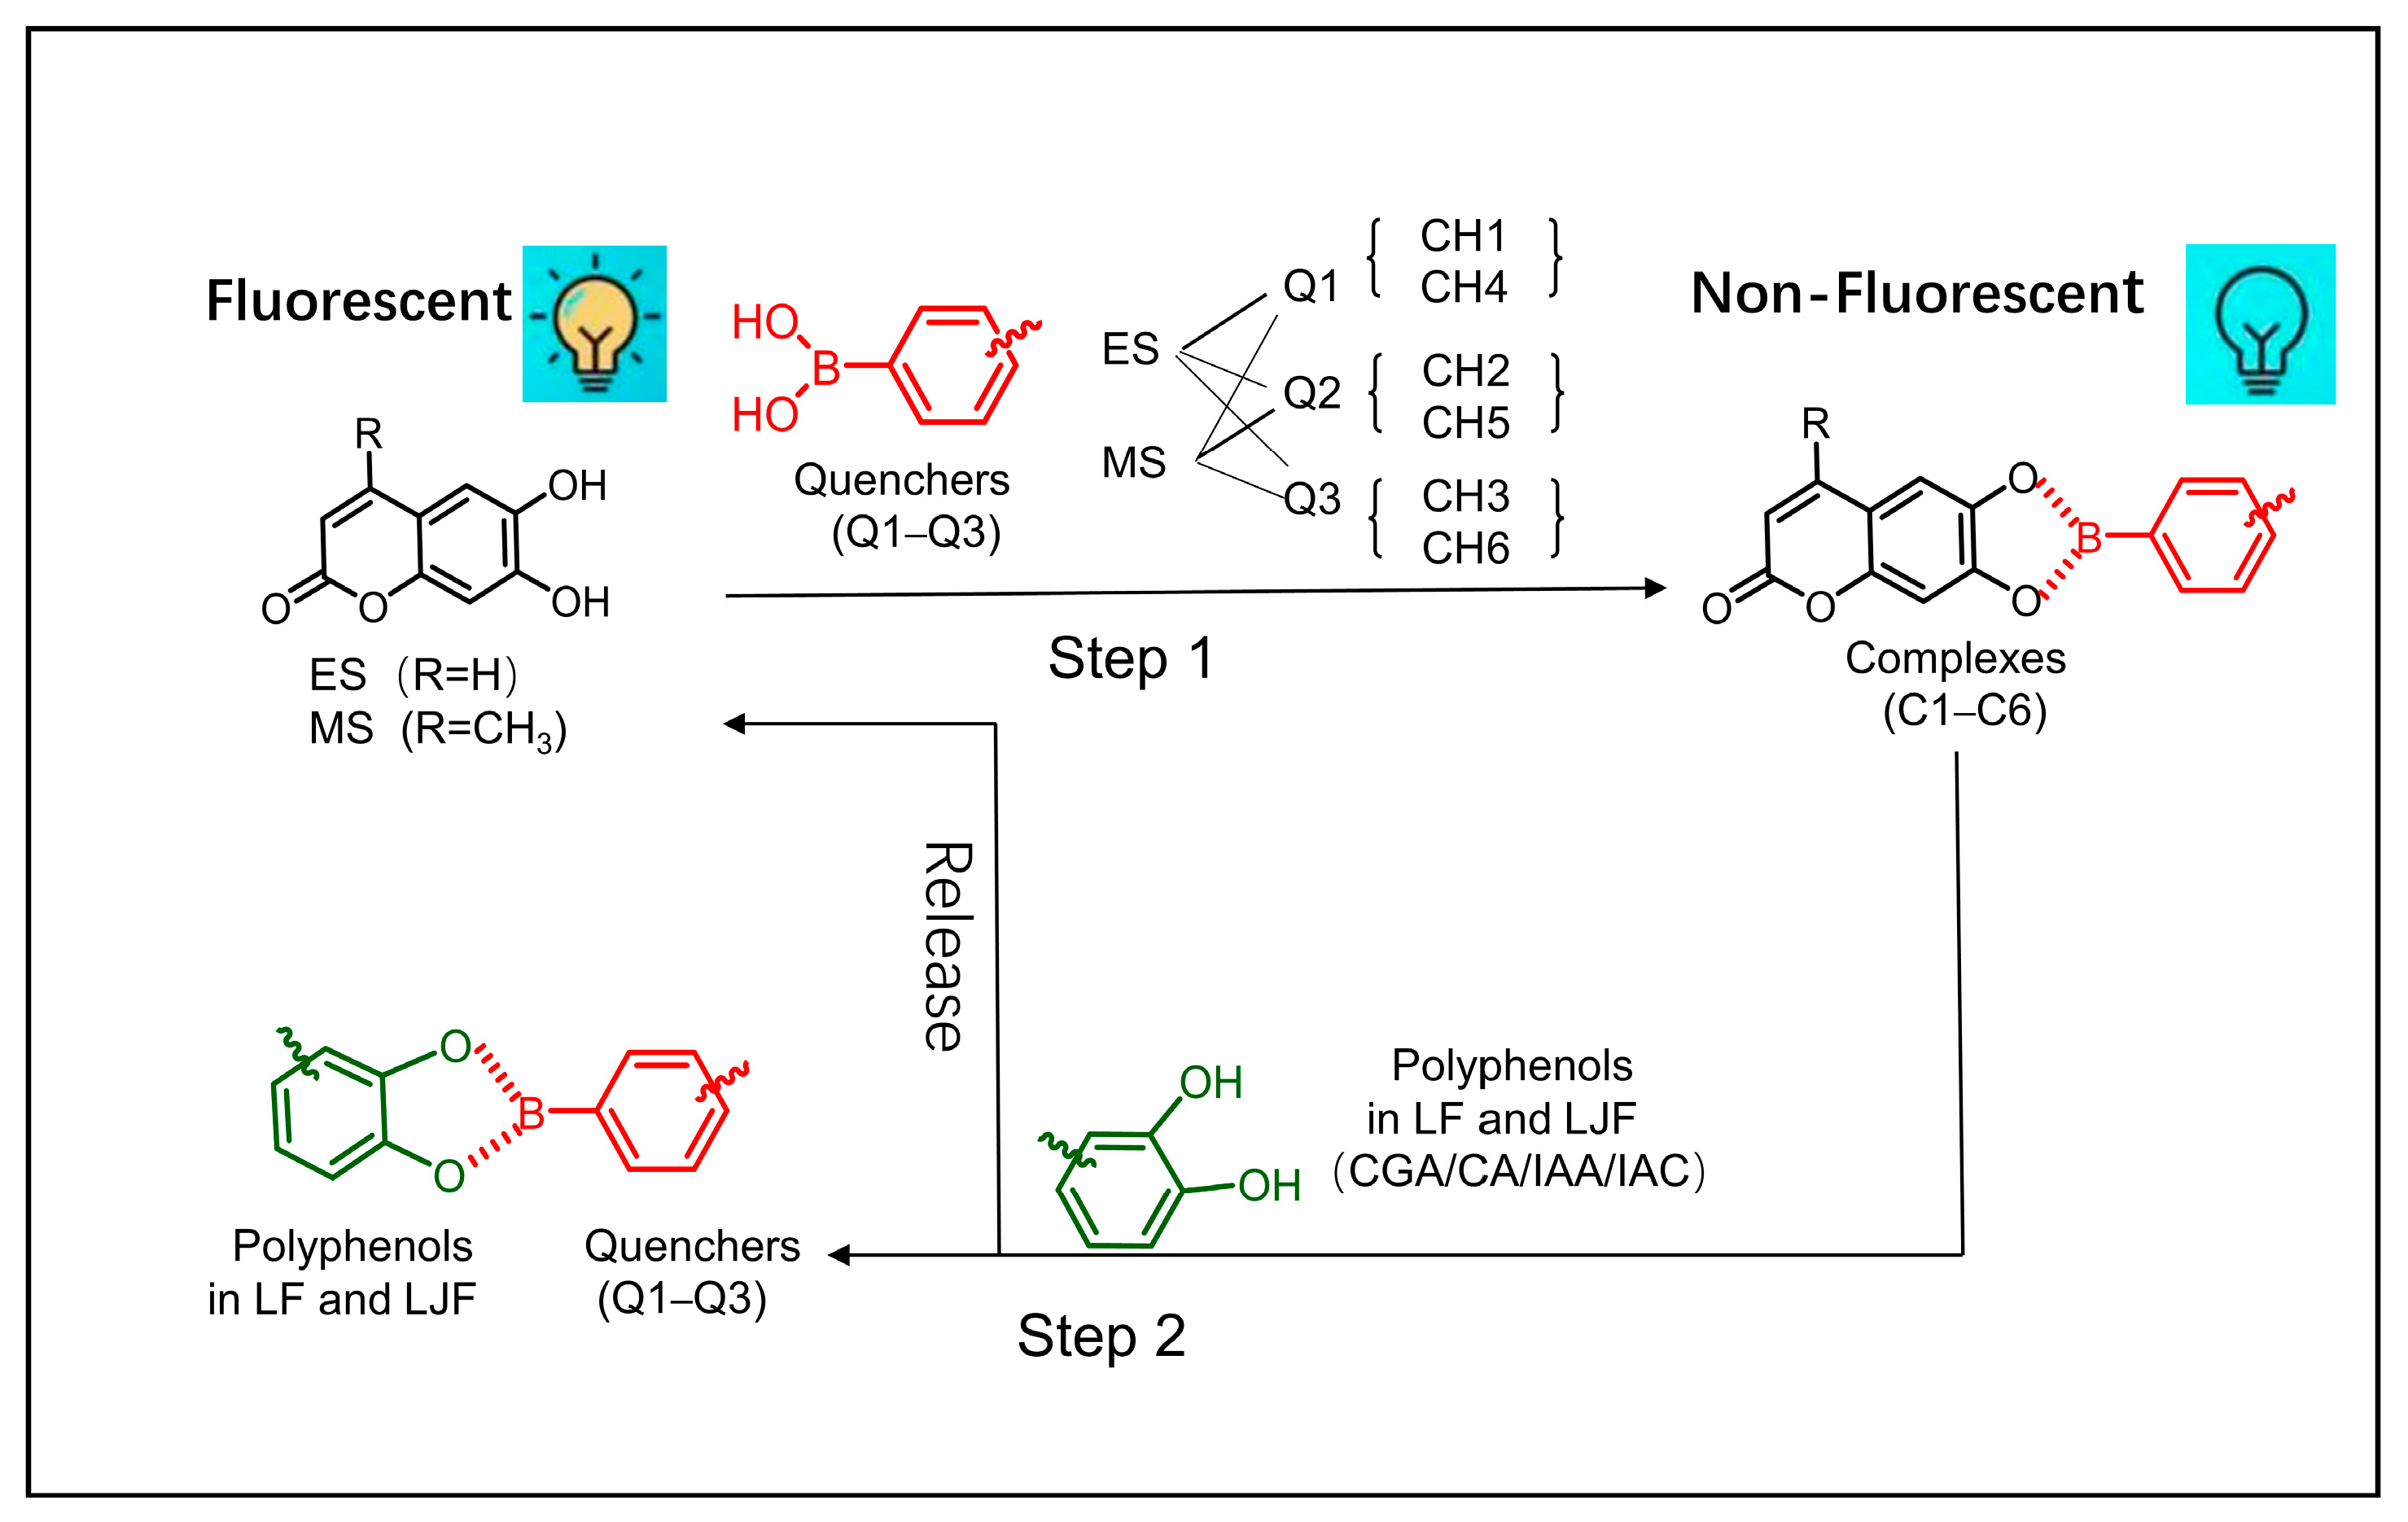
2.1. Principle of Fluorescent Sensor Array Response
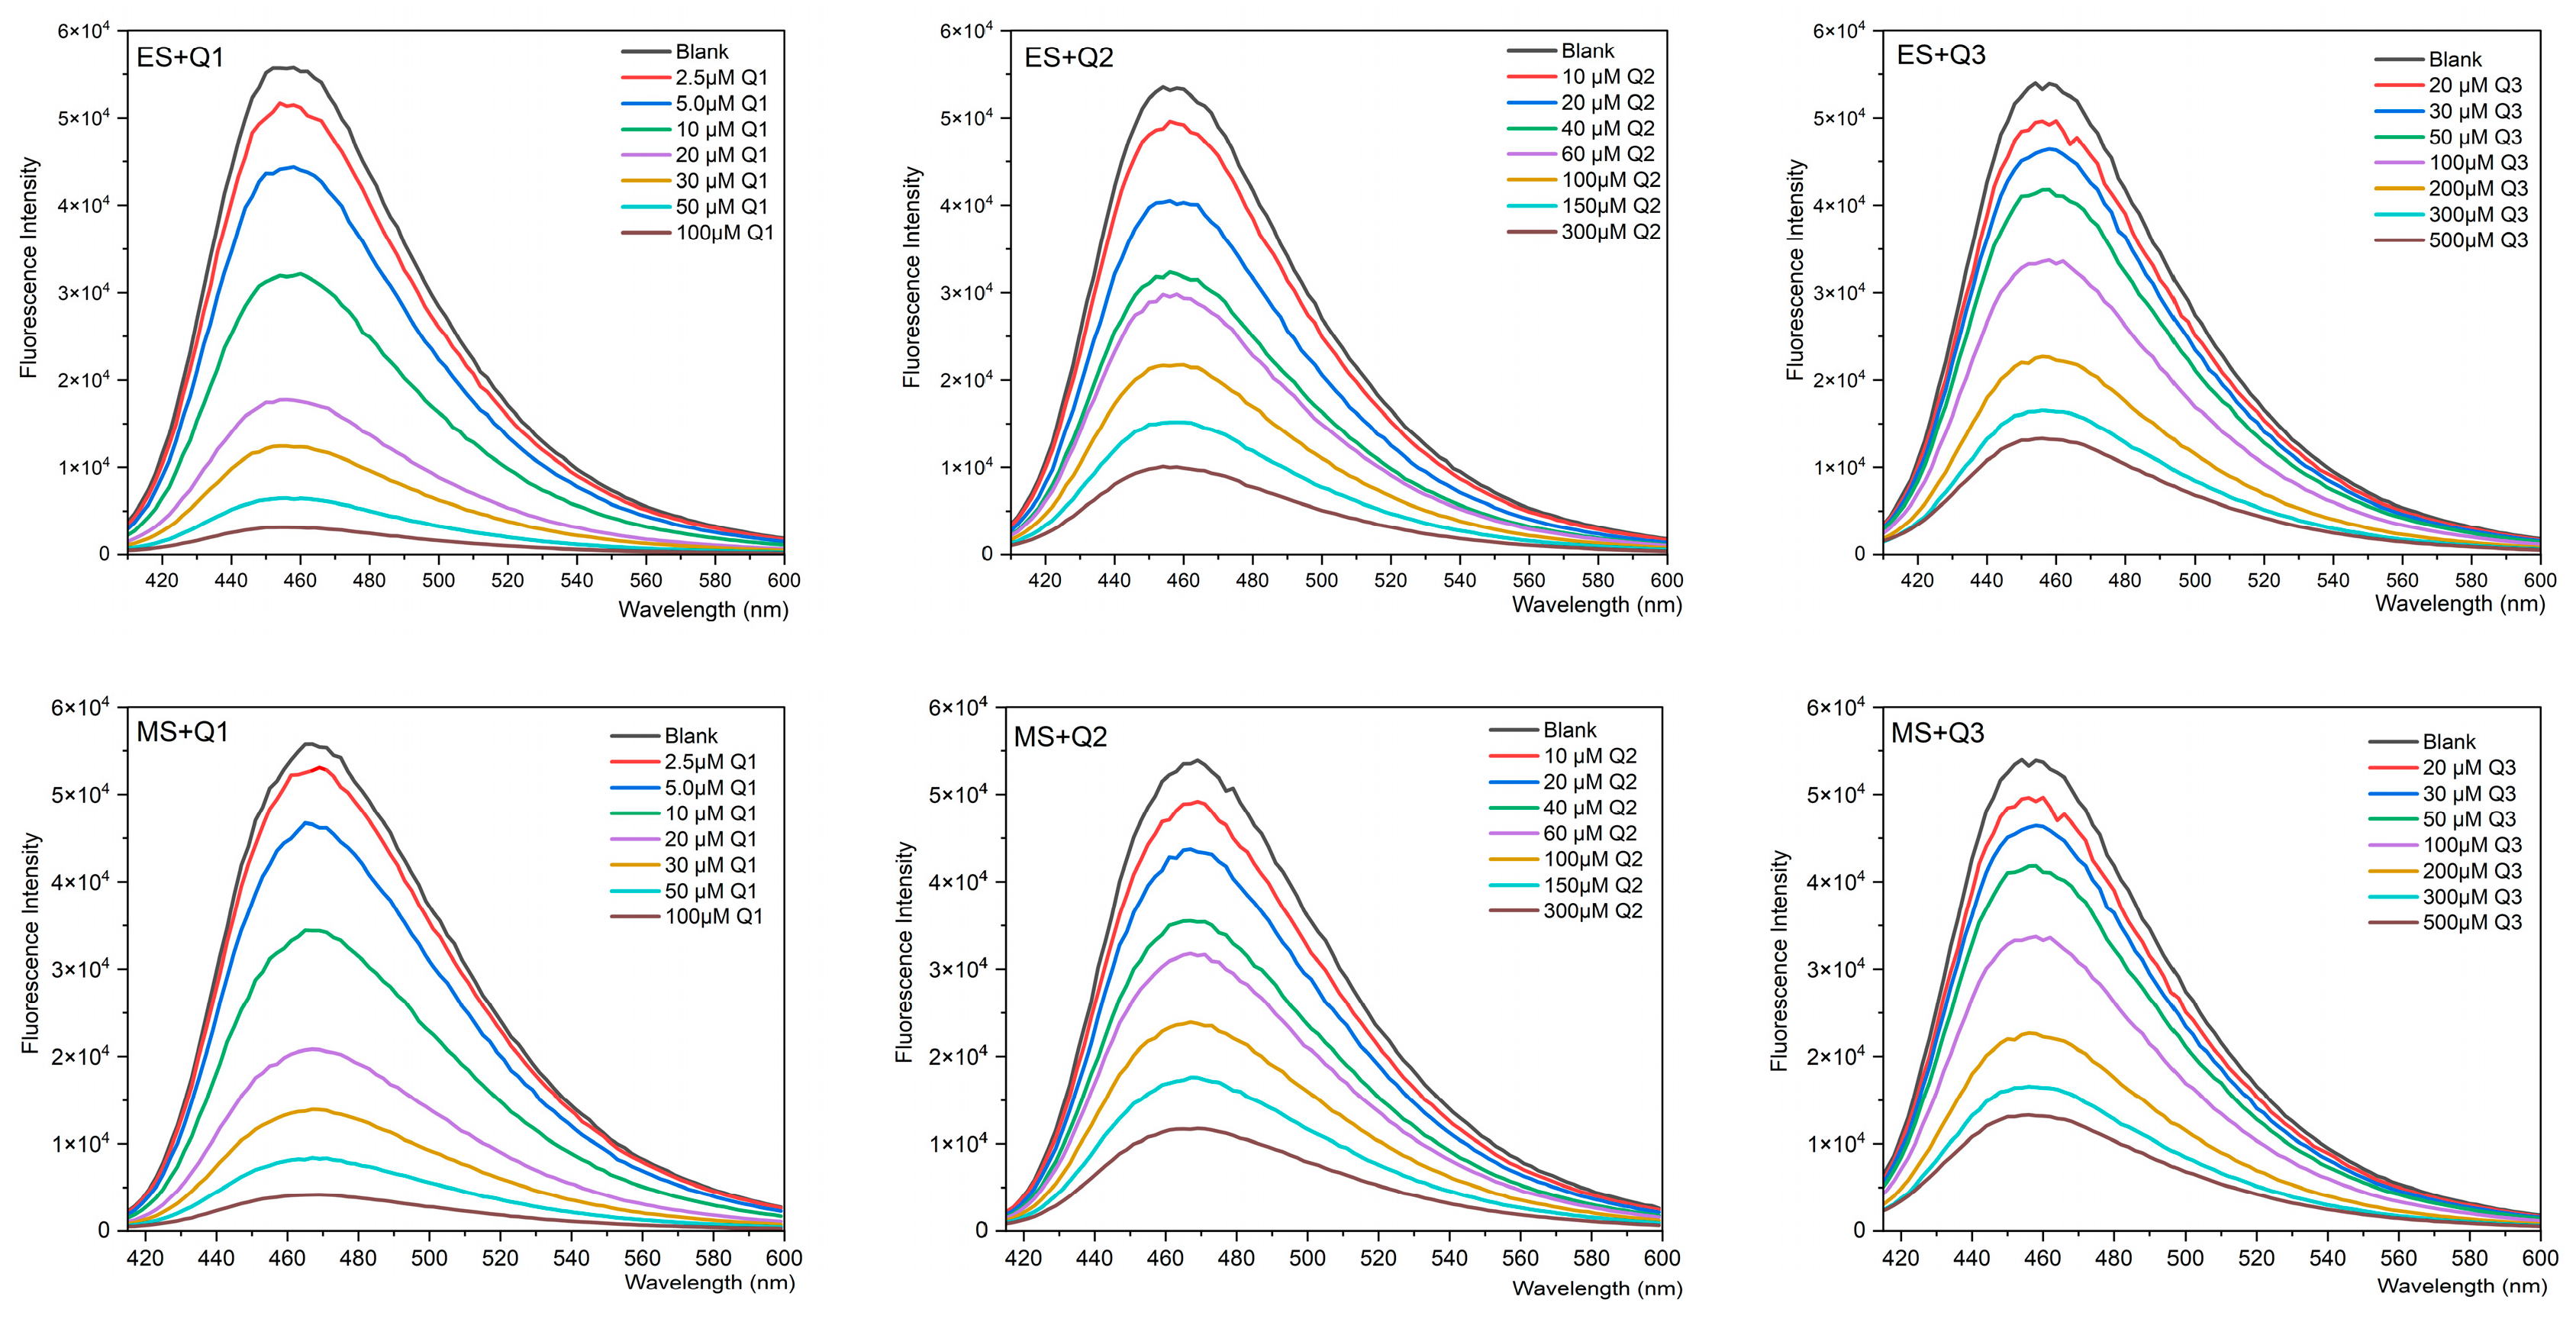
2.2. Determination of Concentration of Q1–Q3 Using Fluorescence Quenching Curves
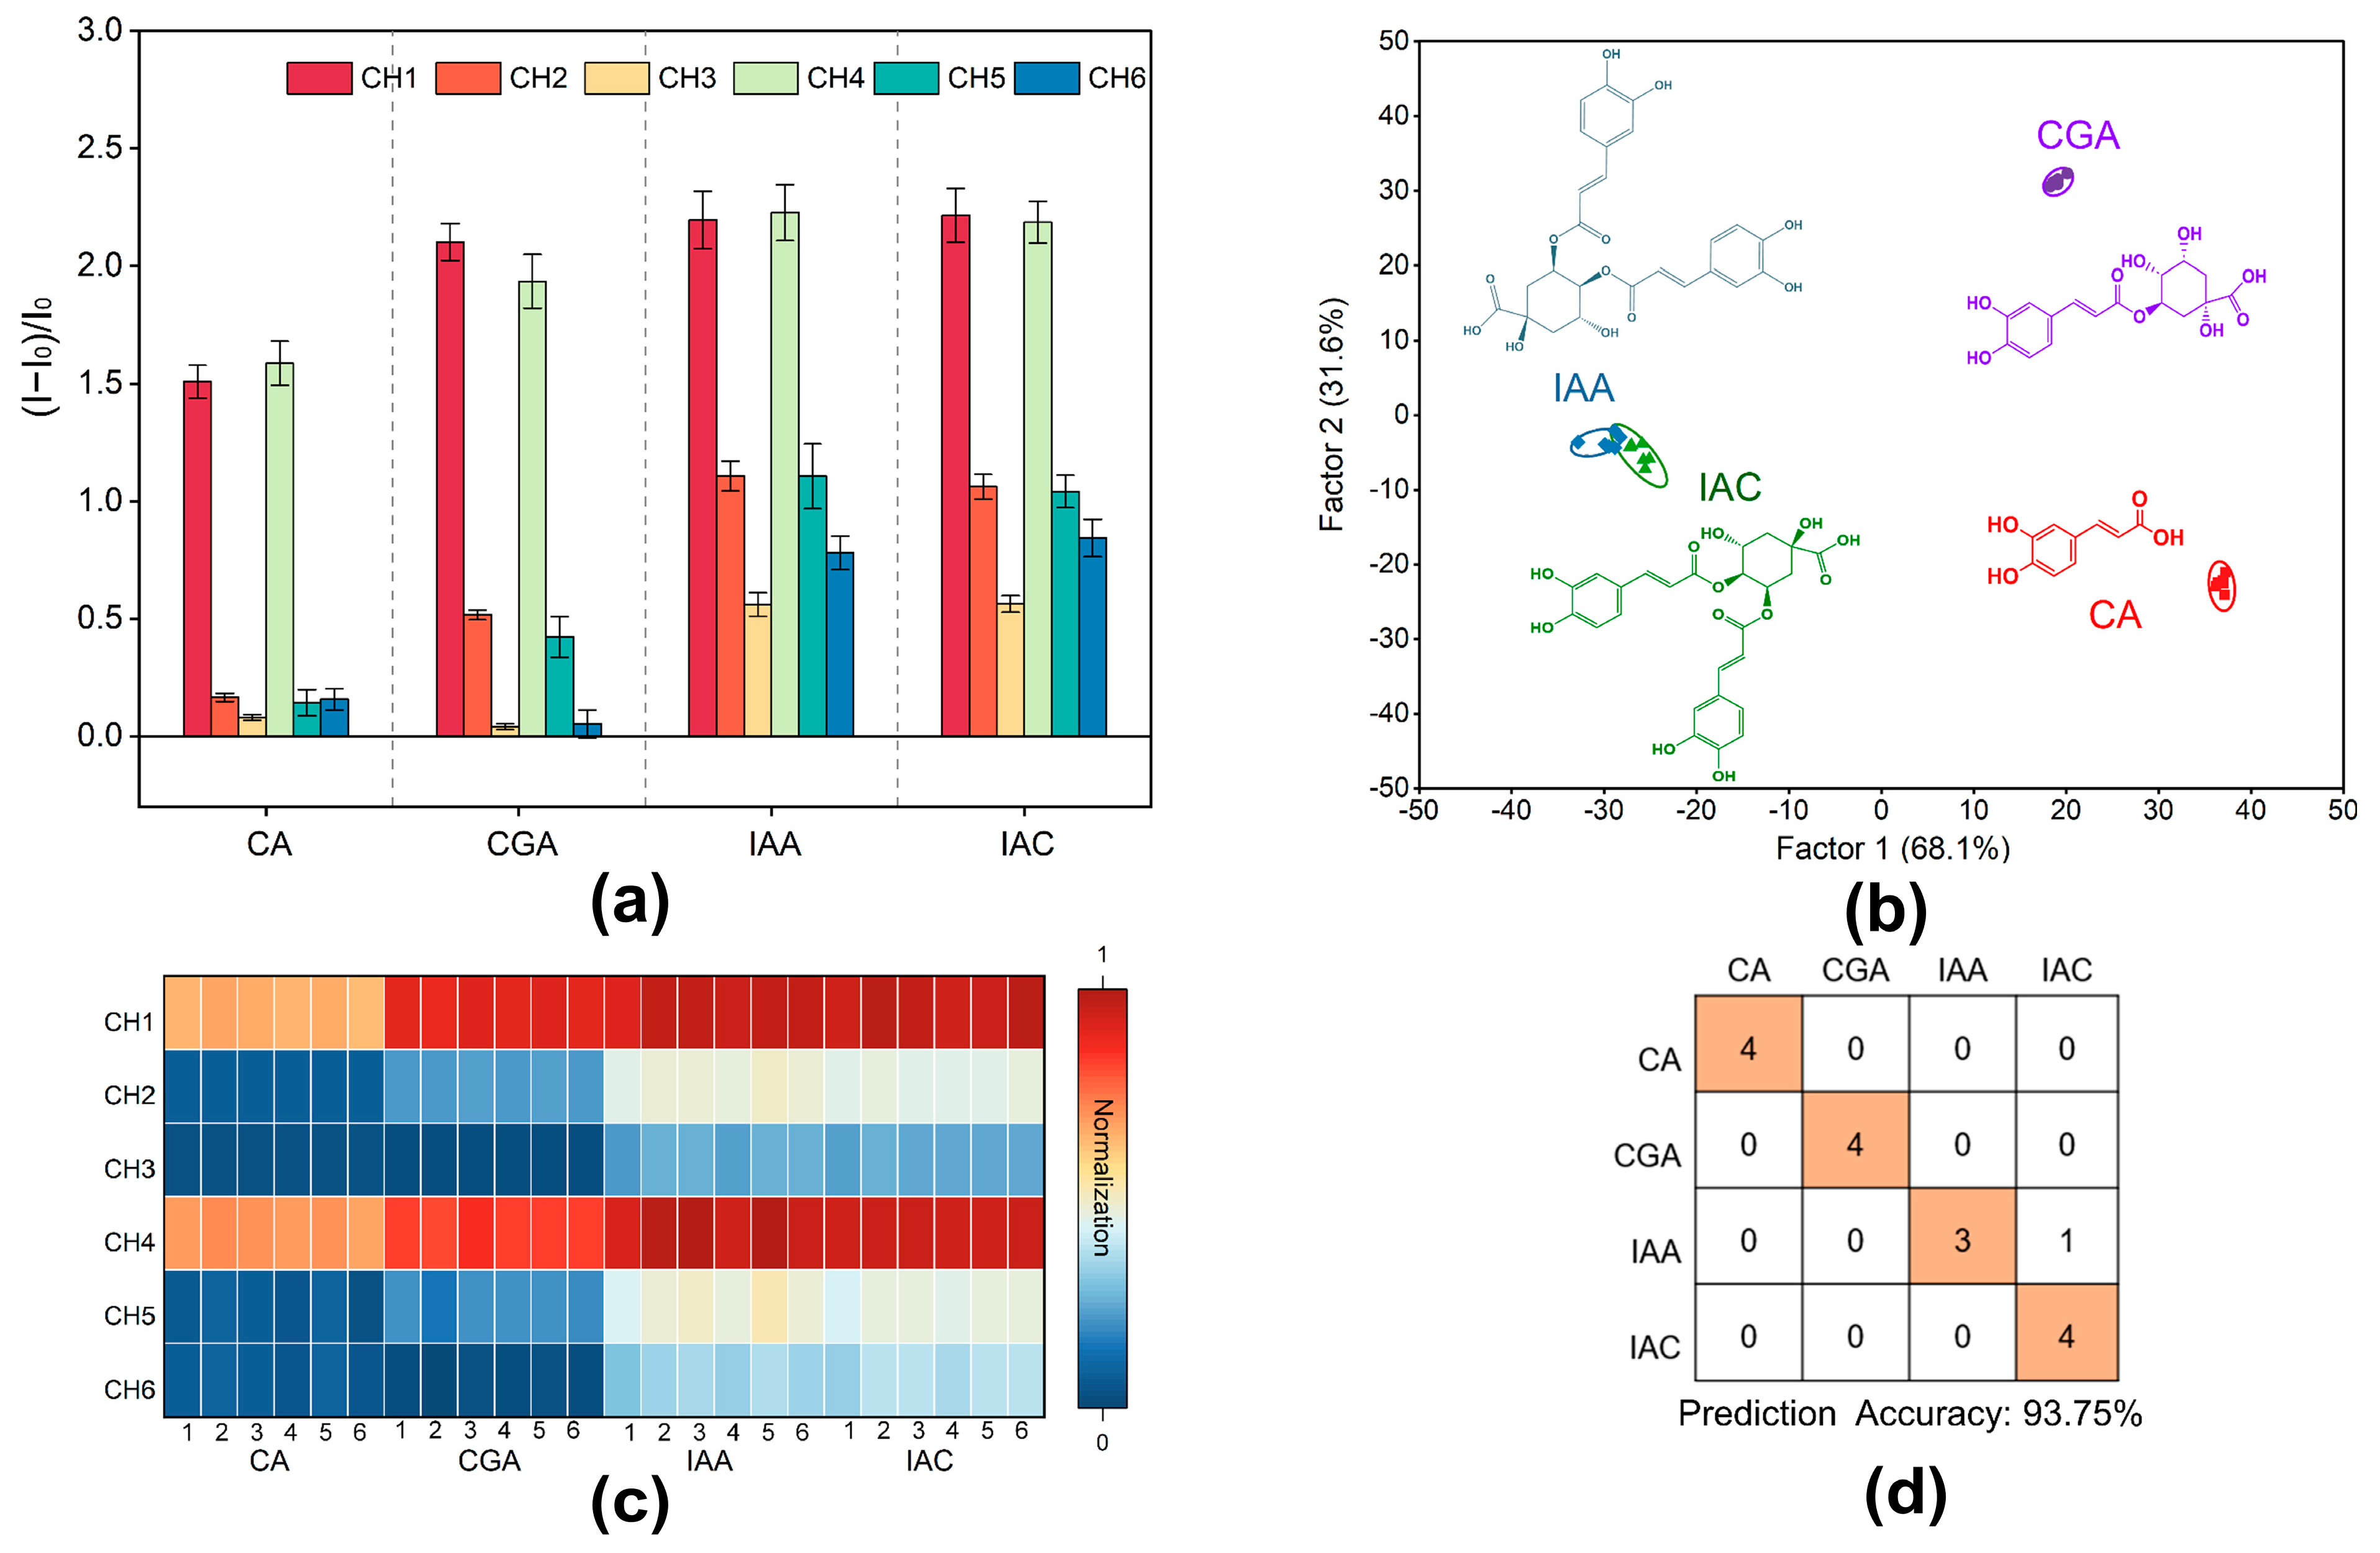
2.3. Quenching Curves for Differentiation of 4 Types of Phenolic Acid Components by Fluorescent Sensors
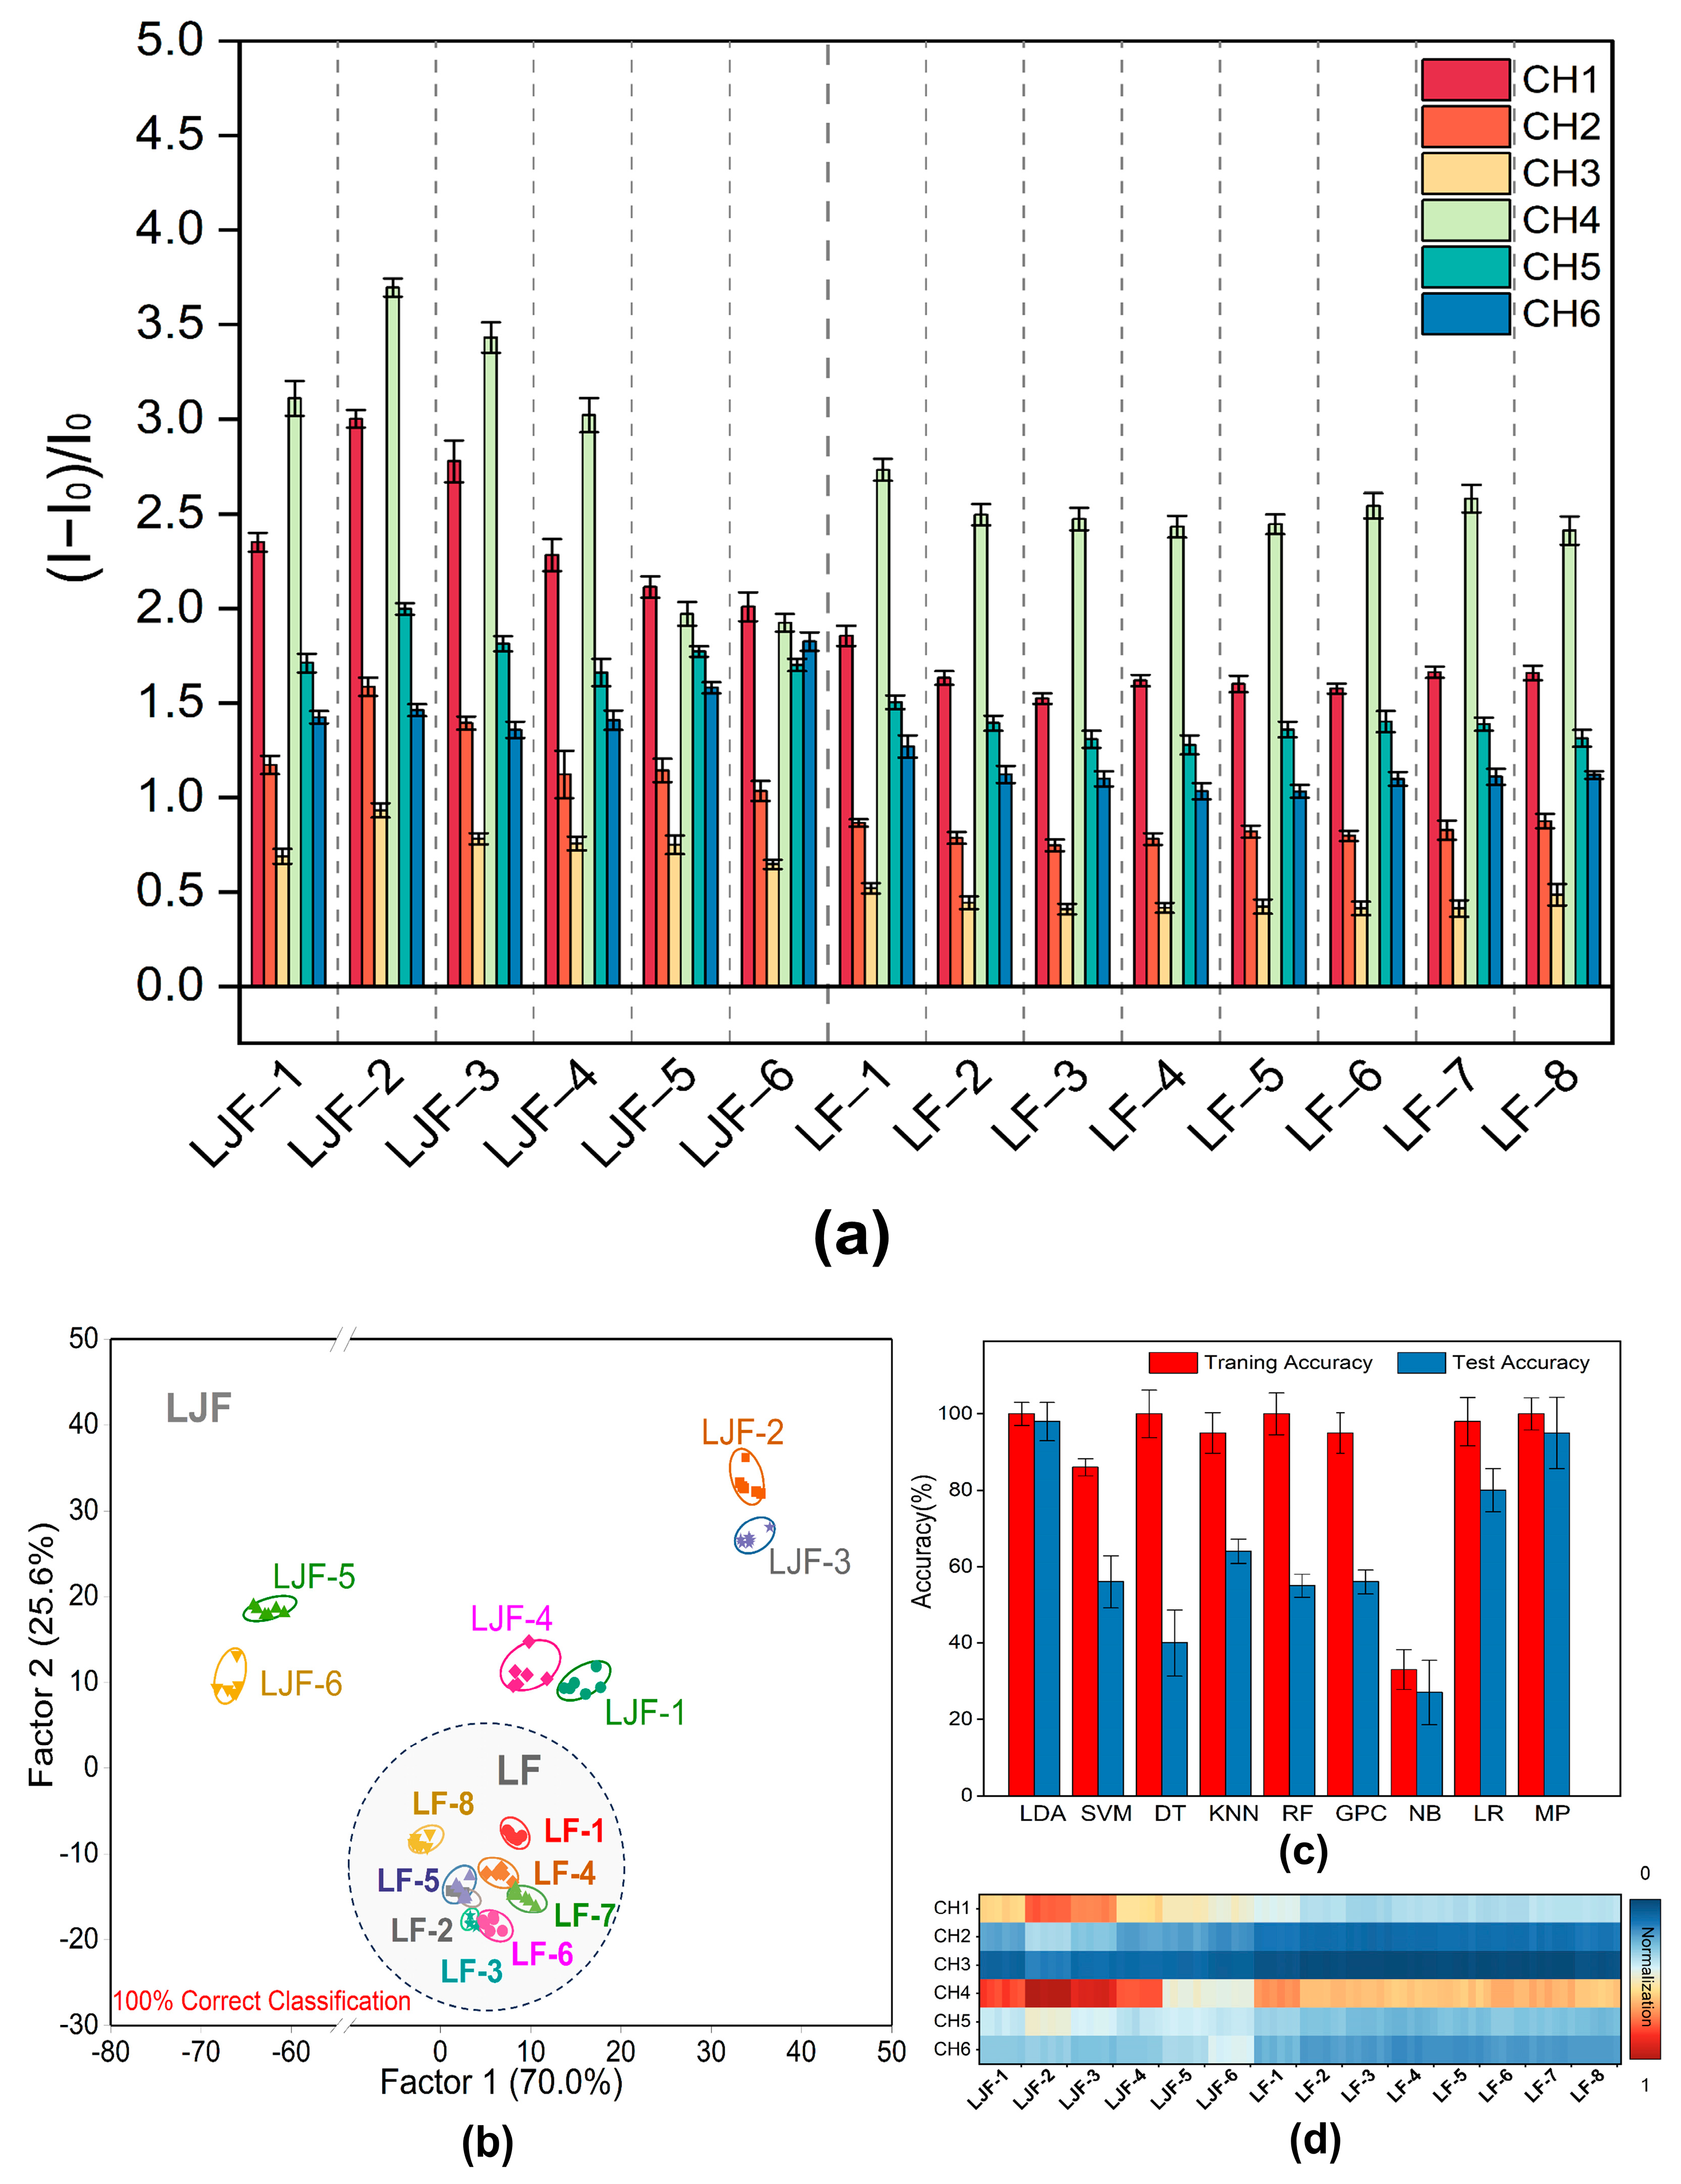
2.4. Identification of 14 Baches of LJF and LF
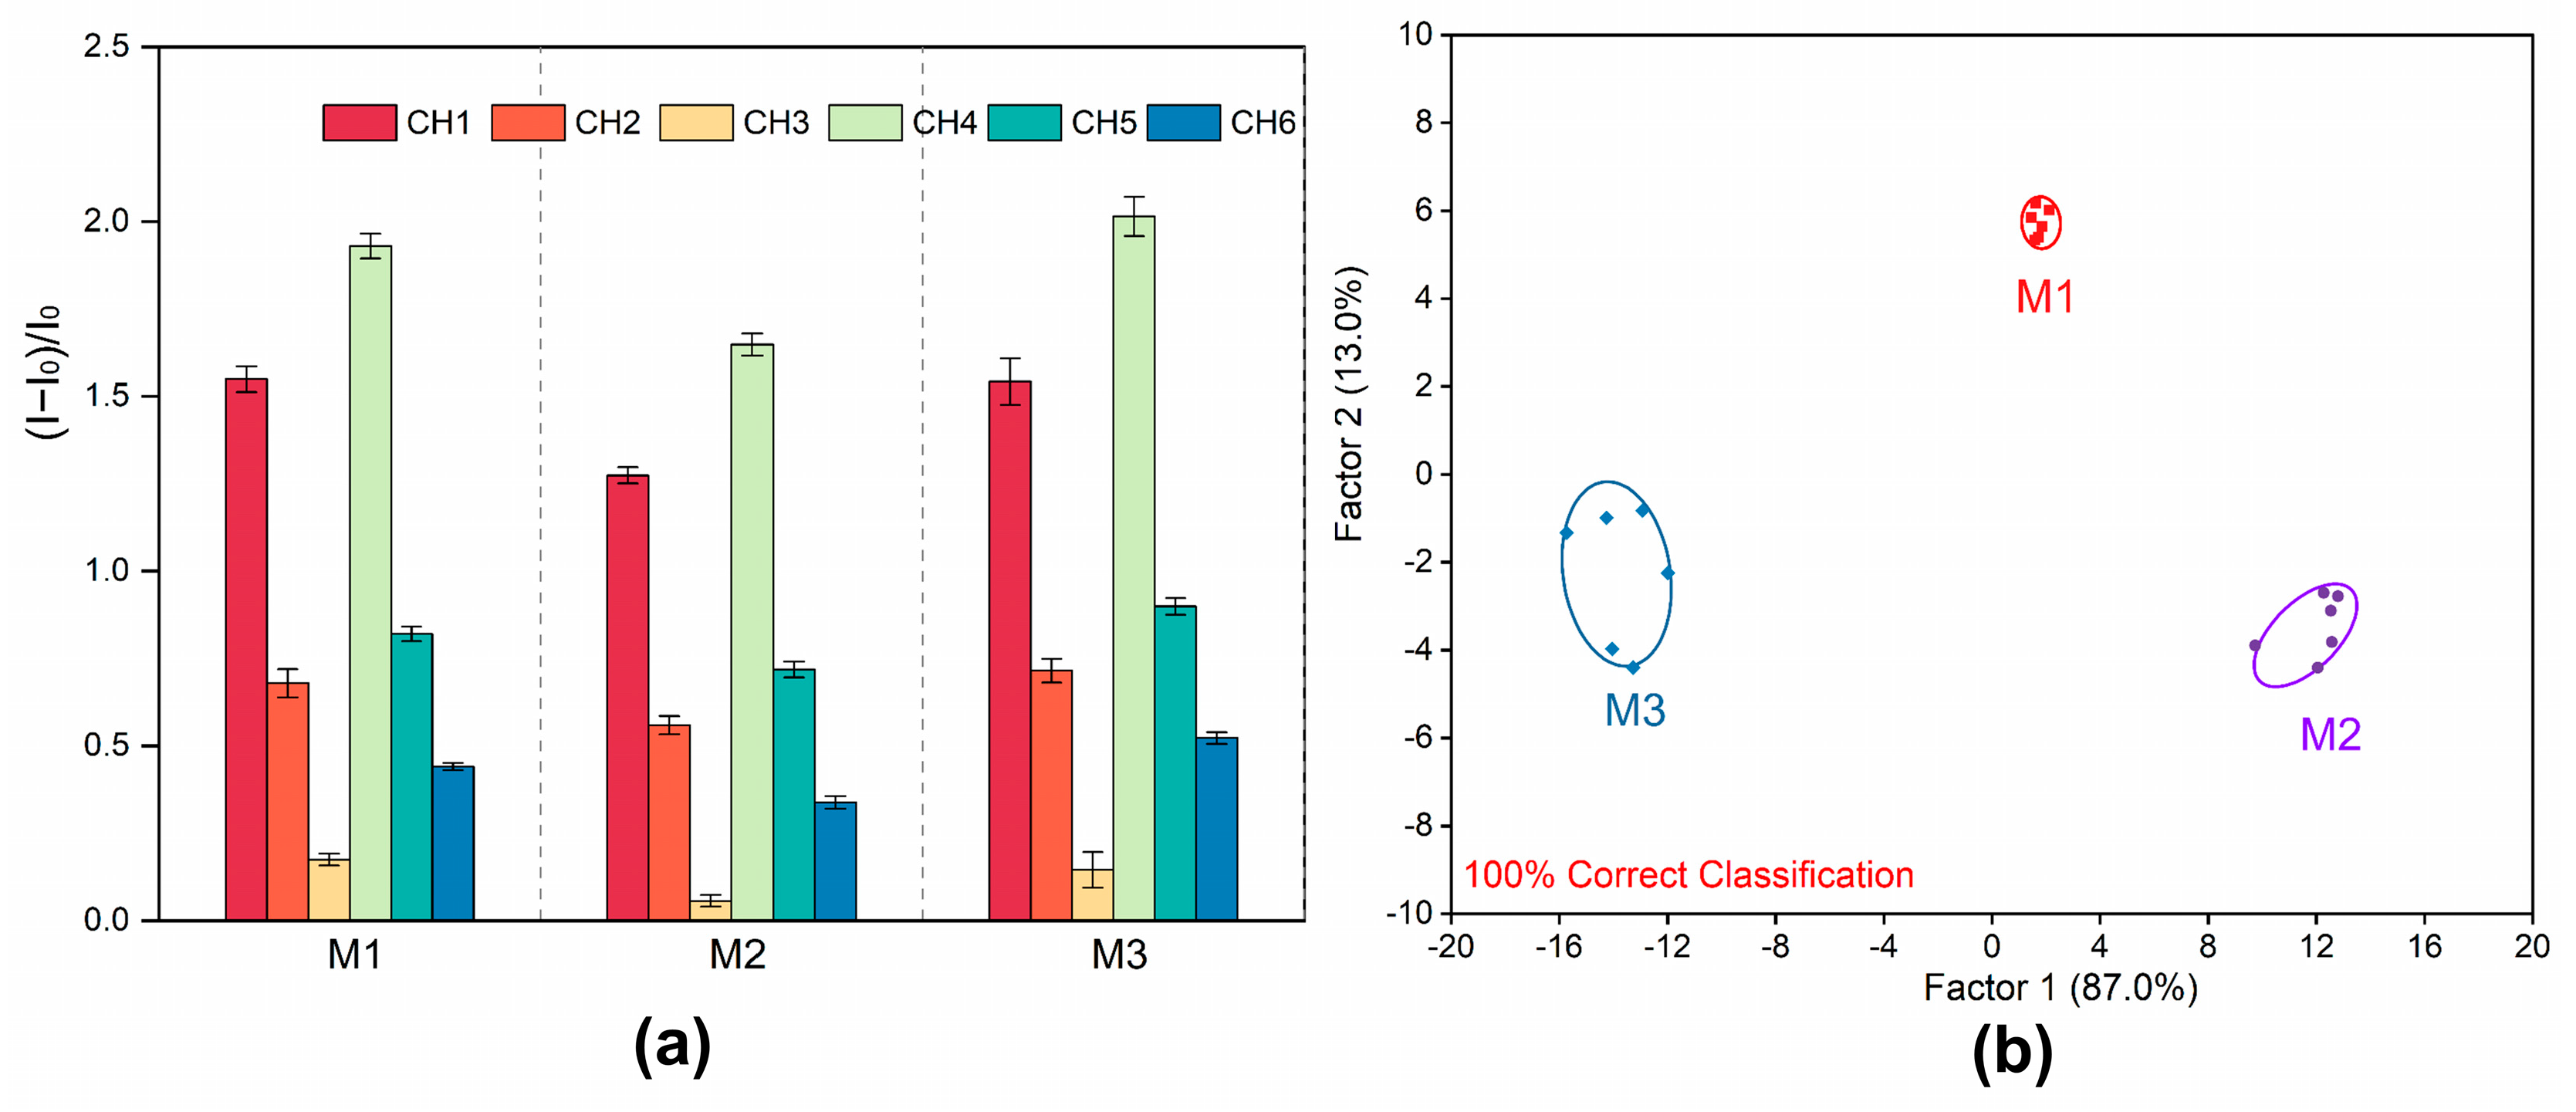
2.5. Discrimination of Jinyinhua Mixtures from Three Different Manufacturers
3. Materials and Methods
3.1. Instruments
3.2. Reagents
3.3. Sample Collection and Identification
3.4. Sample Preparation
3.5. Synthesis of Quenchers (Q1–Q3)
3.6. Optimization of Q1–Q3 Concentration and Construction of Fluorescent Sensor Array
3.7. Determination of Four Phenolic Acid Components
3.8. Determination of 14 Batches of Samples and Jinyinhua Mixtures from 3 Different Manufacturers
3.9. Data Analysis
4. Conclusions
Supplementary Materials
Author Contributions
Funding
Institutional Review Board Statement
Informed Consent Statement
Data Availability Statement
Conflicts of Interest
References
- Li, Y.; Li, W.; Fu, C.; Song, Y.; Fu, Q. Lonicerae japonicae Flos and Lonicerae Flos: A Systematic Review of Ethnopharmacology, Phytochemistry and Pharmacology. Phytochem. Rev. 2020, 19, 1–61. [Google Scholar] [CrossRef] [PubMed]
- Zheng, S.; Liu, S.; Hou, A.; Wang, S.; Na, Y.; Hu, J.; Jiang, H.; Yang, L. Systematic Review of Lonicerae japonicae Flos: A Significant Food and Traditional Chinese Medicine. Front. Pharmacol. 2022, 13, 1013992. [Google Scholar] [CrossRef] [PubMed]
- Wang, L.; Jiang, Q.; Hu, J.; Zhang, Y.; Li, J. Research Progress on Chemical Constituents of Lonicerae japonicae Flos. Biomed Res. Int. 2016, 2016, 8968940. [Google Scholar] [CrossRef]
- Yang, Q.-R.; Zhao, Y.-Y.; Hao, J.-B.; Li, W.-D. Research Progress on Chemical Constituents and Their Differences between Lonicerae japonicae Flos and Lonicerae Flos. Chin. Mater. Medica 2016, 41, 1204–1211. [Google Scholar] [CrossRef]
- Li, W.; Zhang, L.; He, P.; Li, H.; Pan, X.; Zhang, W.; Xiao, M.; He, F. Traditional Uses, Botany, Phytochemistry, and Pharmacology of Lonicerae japonicae Flos and Lonicerae Flos: A Systematic Comparative Review. J. Ethnopharmacol. 2024, 322, 117278. [Google Scholar] [CrossRef]
- Cai, Z.; Wang, C.; Chen, C.; Zou, L.; Chai, C.; Chen, J.; Tan, M.; Liu, X. Quality Evaluation of Lonicerae japonicae Flos and Lonicerae Flos Based on Simultaneous Determination of Multiple Bioactive Constituents Combined with Multivariate Statistical Analysis. Phytochem. Anal. 2021, 32, 129–140. [Google Scholar] [CrossRef] [PubMed]
- Gao, Y.; Hou, R.; Han, Y.; Fei, Q.; Cai, R.; Qi, Y. Shuang-Huang-Lian injection induces an immediate hypersensitivityreaction via C5a but not IgE. Sci. Rep. 2018, 8, 3572. [Google Scholar] [CrossRef]
- Chinese Pharmacopoeia Commission. Pharmacopoeia of the People’s Republic of China; China Medical Science and Technology Press: Beijing, China, 2020. [Google Scholar]
- Miao, H.; Zhang, Y.; Huang, Z.; Lu, B.; Ji, L. Lonicera japonica Attenuates Carbon Tetrachloride-Induced Liver Fibrosis in Mice: Molecular Mechanisms of Action. Am. J. Chin. Med. 2019, 47, 351–367. [Google Scholar] [CrossRef]
- Shang, X.; Pan, H.; Li, M.; Miao, X.; Ding, H. Lonicera japonica Thunb.: Ethnopharmacology, phytochemistry and pharmacology of an important traditional Chinese medicine. J. Ethnopharmacol. 2011, 138, 1–21. [Google Scholar] [CrossRef]
- Liang, Y.C.; Long, W.W.; Qing, Z.J.; Rui, B.Q.; Yuan, L.J.; Ikhlas, K.; Rudolf, B.; An, G.D. Traditional Chinese Medicines against COVID19: A Global Overview. World Chin. Med. 2022, 8, 279–313. [Google Scholar] [CrossRef]
- Liu, K.; Jin, Y.; Gu, L.; Li, M.; Wang, P.; Yin, G.; Wang, S.; Wang, T.; Wang, L.; Wang, B. Classification and Authentication of Lonicerae japonicae Flos and Lonicerae Flos by Using 1H-NMR Spectroscopy and Chemical Pattern Recognition Analysis. Molecules 2023, 28, 6860. [Google Scholar] [CrossRef] [PubMed]
- Kang, S.; Zhang, J.; Wang, Y.D.; Han, H.Q.; Liang, S.; Lu, J.; Ma, S.C. Pharmacognostic authentication study for Lonicerae japonicae Flos and Lonicerae Flos. Chin. J. Pharm. Anal. 2014, 34, 1913–1921. [Google Scholar] [CrossRef]
- Yan, R.; Chen, J.; Sun, S.; Guo, B. Rapid Identification of Lonicerae japonicae Flos and Lonicerae Flos by Fourier Transform Infrared (FT-IR) Spectroscopy and Two-Dimensional Correlation Analysis. J. Mol. Struct. 2016, 1124, 110–116. [Google Scholar] [CrossRef]
- He, S.; Long, W.; Hai, C.; Chen, H.; Tang, C.; Rong, X.; Yang, J.; Fu, H. Rapid identification of traditional Chinese medicines (Lonicerae japonicae flos and Lonicerae flos) and their origins using excitation-emission matrix fluorescence spectroscopy coupled with chemometrics. Spectrochim. Acta. A Mol. Biomol. Spectrosc. 2024, 307, 123639. [Google Scholar] [CrossRef]
- Wang, J.; Cai, Z.; Jin, C.; Peng, D.; Zhai, Y.; Qi, H.; Bai, R.; Guo, X.; Yang, J.; Zhang, C. Species Classification and Origin Identification of Lonicerae japonicae Flos and Lonicerae Flos Using Hyperspectral Imaging with Support Vector Machine. J. Food Compos. Anal. 2024, 132, 106356. [Google Scholar] [CrossRef]
- Cai, Z.; Wang, C.; Zou, L.; Liu, X.; Chen, J.; Tan, M.; Mei, Y.; Wei, L. Comparison of Multiple Bioactive Constituents in the Flower and the Caulis of Lonicera japonica Based on UFLC-QTRAP-MS/MS Combined with Multivariate Statistical Analysis. Molecules 2019, 24, 1936. [Google Scholar] [CrossRef]
- Wu, T.; Yin, J.; Wu, X.; Li, W.; Bie, S.; Zhao, J.; Song, X.; Yu, H.; Li, Z. Discrimination and Characterization of Volatile Organic Compounds in Lonicerae japonicae Flos and Lonicerae Flos Using Multivariate Statistics Combined with Headspace Gas Chromatography–Ion Mobility Spectrometry and Headspace Solid-phase Microextraction Gas Chromatography–Mass Spectrometry Techniques. Rapid Commun. Mass Spectrom. 2024, 38, e9693. [Google Scholar] [CrossRef]
- Gao, Y.; Zhang, X.; Wang, W.; Xing, Z.; Xu, L.; Tian, X. Qualitative Identification of Lonicerae japonicae Flos in Traditional Chinese Medicine Using Metabarcoding Combined with Specific Mini-Barcodes. Mol. Biol. Rep. 2023, 50, 8817–8825. [Google Scholar] [CrossRef]
- Wang, Z.; Jiang, C.; Jin, Y.; Yang, J.; Zhao, Y.; Huang, L.; Yuan, Y. Cationic Conjugated Polymer Fluorescence Resonance Energy Transfer for DNA Methylation Assessment to Discriminate the Geographical Origins of Lonicerae japonicae Flos. J. Agric. Food Chem. 2023, 71, 12346–12356. [Google Scholar] [CrossRef]
- Ni, W.; Yu, Y.; Gao, X.; Han, Y.; Zhang, W.; Zhang, Z.; Xiao, W.; Hu, Q.; Zhang, Y.; Huang, H.; et al. Multilocus Distance-Regulated Sensor Array for Recognition of Polyphenols via Machine Learning and Indicator Displacement Assay. Anal. Chem. 2024, 96, 301–308. [Google Scholar] [CrossRef]
- Xu, L.; Wang, H.; Xiao, W.; Zhang, W.; Stewart, C.; Huang, H.; Li, F.; Han, J. PAMAM Dendrimer-Based Tongue Rapidly Identifies Multiple Antibiotics. Sens. Actuators B Chem. 2023, 382, 133519. [Google Scholar] [CrossRef]
- Tropp, J.; Ihde, M.H.; Williams, A.K.; White, N.J.; Eedugurala, N.; Bell, N.C.; Azoulay, J.D.; Bonizzoni, M. A Sensor Array for the Discrimination of Polycyclic Aromatic Hydrocarbons Using Conjugated Polymers and the Inner Filter Effect. Chem. Sci. 2019, 10, 10247–10255. [Google Scholar] [CrossRef]
- Yang, Z.; Fan, L.; Fan, X.; Hou, M.; Cao, Z.; Ding, Y.; Zhang, W. Porphyrin-GO Nanocomposites Based NIR Fluorescent Sensor Array for Heparin Sensing and Quality Control. Anal. Chem. 2020, 92, 6727–6733. [Google Scholar] [CrossRef]
- Ding, Y.; Wang, J.; Wang, R.; Xie, Y. Development of Porphyrin-Based Fluorescent Sensors and Sensor Arrays for Saccharide Recognition. Chin. Chem. Lett. 2024, 35, 109008. [Google Scholar] [CrossRef]
- Yuan, Y.; Zhang, L.L.; Liu, J.T.; Zhang, H.B.; Xu, J. Analysis and prediction of quality markers of Lonicerae japonicae Flos. China J. Chin. Mater. Medica 2021, 47, 1730–1738. [Google Scholar] [CrossRef]
- Valdes-García, J.; Zamora-Moreno, J.; Salomón-Flores, M.K.; Martínez-Otero, D.; Barroso-Flores, J.; Yatsimirsky, A.K.; Bazany-Rodríguez, I.J.; Dorazco-González, A. Fluorescence Sensing of Monosaccharides by Bis-Boronic Acids Derived from Quinolinium Dicarboxamides: Structural and Spectroscopic Studies. J. Org. Chem. 2023, 88, 2174–2189. [Google Scholar] [CrossRef]
- Basiruddin, S.; Swain, S.K. Phenylboronic acid functionalized reduced graphene oxide based fluorescence nano sensor for glucose sensing. Mater. Sci. Eng. C 2016, 58, 103–109. [Google Scholar] [CrossRef]
- Cordes, D.B.; Gamsey, S.; Sharrett, Z.; Miller, A.; Thoniyot, P.; Wessling, R.A.; Singaram, B. 18.The Interaction of Boronic Acid-Substituted Viologens with Pyranine: The Effects of Quencher Charge on Fluorescence Quenching and Glucose Response. Langmuir 2005, 21, 6540–6547. [Google Scholar] [CrossRef]
- Yu, X.; Fu, L.; Wang, T.; Liu, Z.; Niu, N.; Chen, L. Multivariate Chemical Analysis: From Sensors to Sensor Arrays. Chin. Chem. Lett. 2024, 35, 109167. [Google Scholar] [CrossRef]
- Li, X.; Guo, Z.; Luo, G.; Miao, P. Fluorescence DNA Switch for Highly Sensitive Detection of miRNA Amplified by Duplex-Specific Nuclease. Sensors 2022, 22, 3252. [Google Scholar] [CrossRef]
- Yu, Y.; Ni, W.; Shi, X.; Bian, Y.; Li, H.; Liu, M.; Chen, W.; Zhang, M.; Jiang, S.; Cheng, M.; et al. A Supramolecular Fluorescent Sensor Array Composed of Conjugated Fluorophores and Cucurbit[7]uril for Bacterial Recognition. Anal. Chem. 2024, 96, 14490–14498. [Google Scholar] [CrossRef] [PubMed]
- Chen, L.; Tian, X.; Li, Y.; Yang, C.; Lu, L.; Zhou, Z.; Nie, Y. An AIE Dye Based Smartphone and LDA Integrated Portable, Intelligent and Rapid Detection System as Trace Water Indicator and Cyanide Detector. Dye. Pigment. 2019, 166, 1–7. [Google Scholar] [CrossRef]
- Liu, Y.; Minami, T.; Nishiyabu, R.; Wang, Z.; Anzenbacher, P. Sensing of Carboxylate Drugs in Urine by a Supramolecular Sensor Array. J. Am. Chem. Soc. 2013, 135, 7705–7712. [Google Scholar] [CrossRef] [PubMed]
- Li, J.; Qiao, C.; Liu, H.; Zhao, D.; Zhang, J.; Lu, L.; Huo, D.; Hou, C. Fluorescence Nanoparticle Sensor Array Combined with Multidimensional Data Processing for the Determination of Small Organics and the Identification of Baijiu. Anal. Lett. 2023, 56, 2749–2763. [Google Scholar] [CrossRef]


| Characteristic | LJF | LF | ||
|---|---|---|---|---|
| L. japonica | L. macranthoides | L. hypoglauca | L. confusa | |
| form | 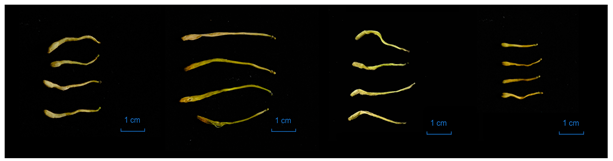 | |||
| macroscopic characteristics | yellowish-white or greenish-white, densely covered with greyish-white hairs | greenish-brown or yellowish-white, nearly glabrous | yellowish-white or yellowish-brown, sparse hairs | yellowish-brown, bud slight, densely covered with white hairs |
| surface view of corolla | 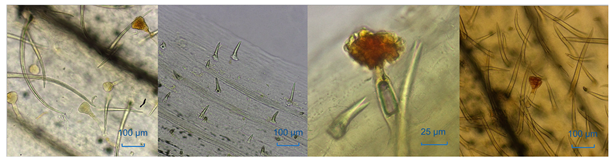 | |||
| microscopic characteristics | more spreading non-glandular hairs and glandular hairs | non-glandular hairs a little shorter, sparse glandular hairs | sparse non-glandular hairs, head of glandular hair surrounded with scutellate | more non-glandular hairs, the head of glandular hair sunken in the middle of the top |
| Sample No. | Producing Area | Name | Species |
|---|---|---|---|
| LJF-1 | Fengqiu, Henan | Lonicerae Japonicae Flos | L. japonica |
| LJF-2 | Fengqiu, Henan | Lonicerae Japonicae Flos | L. japonica |
| LJF-3 | Pingyi, Shandong | Lonicerae Japonicae Flos | L. japonica |
| LJF-4 | Linyi, Shandong | Lonicerae Japonicae Flos | L. japonica |
| LJF-5 | Julu, Hebei | Lonicerae Japonicae Flos | L. japonica |
| LJF-6 | Tangshan, Hebei | Lonicerae Japonicae Flos | L. japonica |
| LF-1 | Anlong, Guizhou | Lonicerae Flos | L. confusa |
| LF-2 | Bozhou, Anhui | Lonicerae Flos | L. macranthoides |
| LF-3 | Shaoyang, Hunan | Lonicerae Flos | L. macranthoides |
| LF-4 | ziyuan, Guangxi | Lonicerae Flos | L. macranthoides |
| LF-5 | Bozhou, Anhui | Lonicerae Flos | L. hypoglauca |
| LF-6 | Ziyuan, Guanxi | Lonicerae Flos | L. macranthoides |
| LF-7 | Xinyang, Henan | Lonicerae Flos | L. macranthoides |
| LF-8 | Julu, Hebei | Lonicerae Flos | L. hypoglauca |
Disclaimer/Publisher’s Note: The statements, opinions and data contained in all publications are solely those of the individual author(s) and contributor(s) and not of MDPI and/or the editor(s). MDPI and/or the editor(s) disclaim responsibility for any injury to people or property resulting from any ideas, methods, instructions or products referred to in the content. |
© 2024 by the authors. Licensee MDPI, Basel, Switzerland. This article is an open access article distributed under the terms and conditions of the Creative Commons Attribution (CC BY) license (https://creativecommons.org/licenses/by/4.0/).
Share and Cite
Bian, Y.; Xiang, C.; Xu, Y.; Zhu, R.; Qin, S.; Zhang, Z. A Diboronic Acid-Based Fluorescent Sensor Array for Rapid Identification of Lonicerae Japonicae Flos and Lonicerae Flos. Molecules 2024, 29, 4374. https://doi.org/10.3390/molecules29184374
Bian Y, Xiang C, Xu Y, Zhu R, Qin S, Zhang Z. A Diboronic Acid-Based Fluorescent Sensor Array for Rapid Identification of Lonicerae Japonicae Flos and Lonicerae Flos. Molecules. 2024; 29(18):4374. https://doi.org/10.3390/molecules29184374
Chicago/Turabian StyleBian, Ying, Chenqing Xiang, Yi Xu, Rongping Zhu, Shuanglin Qin, and Zhijun Zhang. 2024. "A Diboronic Acid-Based Fluorescent Sensor Array for Rapid Identification of Lonicerae Japonicae Flos and Lonicerae Flos" Molecules 29, no. 18: 4374. https://doi.org/10.3390/molecules29184374
APA StyleBian, Y., Xiang, C., Xu, Y., Zhu, R., Qin, S., & Zhang, Z. (2024). A Diboronic Acid-Based Fluorescent Sensor Array for Rapid Identification of Lonicerae Japonicae Flos and Lonicerae Flos. Molecules, 29(18), 4374. https://doi.org/10.3390/molecules29184374