Article

Discovery and Optimization of Ergosterol Peroxide Derivatives as Novel Glutaminase 1 Inhibitors for the Treatment of Triple-Negative Breast Cancer

1
College of Pharmacy, Qiqihar Medical University, Qiqihar 161006, China
2
College of Pharmacy, Hainan University, Haikou 570228, China
3
Research Institute of Medicine & Pharmacy, Qiqihar Medical University, Qiqihar 161006, China
*
Authors to whom correspondence should be addressed.
Both authors contributed equally to this work.
Molecules 2024, 29(18), 4375; https://doi.org/10.3390/molecules29184375
Submission received: 22 August 2024 / Revised: 11 September 2024 / Accepted: 13 September 2024 / Published: 14 September 2024
(This article belongs to the Special Issue Bioactivity of Natural Compounds: From Plants to Humans)

Abstract

:
In this study, novel ergosterol peroxide (EP) derivatives were synthesized and evaluated to assess their antiproliferative activity against four human cancer cell lines (A549, HepG2, MCF-7, and MDA-MB-231). Compound 3g exhibited the most potent antiproliferative activity, with an IC50 value of 3.20 µM against MDA-MB-231. This value was 5.4-fold higher than that of the parental EP. Bioassay optimization further identified 3g as a novel glutaminase 1 (GLS1) inhibitor (IC50 = 3.77 µM). In MDA-MB-231 cells, 3g reduced the cellular glutamate levels by blocking the glutamine hydrolysis pathway, which triggered reactive oxygen species production and induced caspase-dependent apoptosis. Molecular docking indicated that 3g interacts with the reaction site of the variable binding pocket by forming multiple interactions with GLS1. In a mouse model of breast cancer, 3g showed remarkable therapeutic effects at a dose of 50 mg/kg, with no apparent toxicity. Based on these results, 3g could be further evaluated as a novel GLS1 inhibitor for triple-negative breast cancer (TNBC) therapy.

Graphical Abstract

1. Introduction

Glutamine was the most abundant non-essential amino acid in human serum and provided carbon and nitrogen sources for cancer cells in the process of tumor occurrence and development. It was used for cancer cell biosynthesis, providing energy for cancer cells and promoting tumor growth [1,2,3,4,5]. Glutamine was hydrolyzed by glutaminase (GLS) to produce glutamic acid, which was then catalyzed by glutamine dehydrogenase to produce α-ketoglutaric acid. Glutamine then entered the tricarboxylic acid (TCA) cycle to provide nutrients for tumor cells [6,7,8,9]. The glutamine hydrolysis pathway could also adjust the reactive oxygen species (ROS) levels to regulate the antioxidant defense functions in cells, thereby protecting cells from oxidative stress [10,11,12]. Several human cancer cell lines showed sensitivity to glutamine starvation, including ovarian carcinoma, pancreatic cancer, breast cancer, glioblastoma multiforme, acute myeloid leukemia, and small-cell lung cancer. Blocking glutamine hydrolysis was, therefore, a viable cancer treatment strategy. Glutamine was hydrolyzed by glutaminase 1 (GLS1), which was a key metabolic enzyme in glutamine hydrolysis. Indeed, inhibiting GLS1 activity could effectively suppress the occurrence of tumors [13,14,15,16,17]. Therefore, the development of novel GLS1 inhibitors became a research focus in recent years.
Natural products had good medicinal value and became one of the main choices for the development of new anticancer drugs [18]. Ergosterol peroxide (EP, 1) (Figure 1), as a natural steroid compound extracted from the traditional Chinese medicine Ganoderma lucidum, received extensive attention in recent years [19]. It had a variety of biological effects, including anti-inflammatory, antitumor, antioxidant and immunosuppressive activities [20,21,22]. Among these activities, the antitumor activity of EP was the most significant, and it had obvious inhibitory effects on breast cancer, lung cancer, colorectal cancer, ovarian cancer, gastric cancer, hepatocellular carcinoma and prostate cancer [23,24,25,26,27,28,29]. In recent years, our group explored the mechanisms and derivatization of EP. Many highly active EP derivatives were obtained in our studies with derivatization on the C-3 position of EP [30,31,32]. In addition, in our previous studies, it was found that EP offers moderate GLS1-inhibitory activity (IC50 = 33.67 μM). Therefore, with reasonable structural modifications, EP, as the lead compound, can be used by us to develop new and efficient GLS1 inhibitors.
BPTES was the first reported small-molecule inhibitor of GLS1 with a symmetrical structure consisting of thiadiazole, amide, and phenyl [33,34,35]. A large number of derivatives that significantly inhibited GLS1 had been synthesized in structural derivatization studies based on the skeleton structure of BPTES [36,37,38]. A structure–activity relationship analysis showed that the amide group was an important pharmacophore for binding and that the thiadiazole group at its end could be replaced with a variety of substituents, without affecting the GLS1-inhibitory activity of the compound [39]. The benzene ring also featured a large space for modification [40]. Based on the idea of molecular hybridization, important groups or substituents from the structure of BPTES and its derivatives were introduced into EP by us to improve the antitumor and enzyme-inhibitory activities of EP derivatives. At the same time, it was also considered by us that the introduction of large sterically hindered groups into the C-3 hydroxyl group of EP might have decreased its biological activity. Therefore, different linkers with varying lengths and structures were designed by us to connect EP and BPTES substituents and the influence of the chemical space on the derivatives’ biological activities was examined. The structural design strategy for the new EP derivative is shown in Figure 1.
In the present study, diverse substituents derived from BPTES were introduced to the 3-hydroxyl group of EP through different linkers. Consequently, a novel compound was identified, which demonstrated enhanced GLS1-inhibitory activity and held potential as a candidate for cancer therapy.

2. Results and Discussion
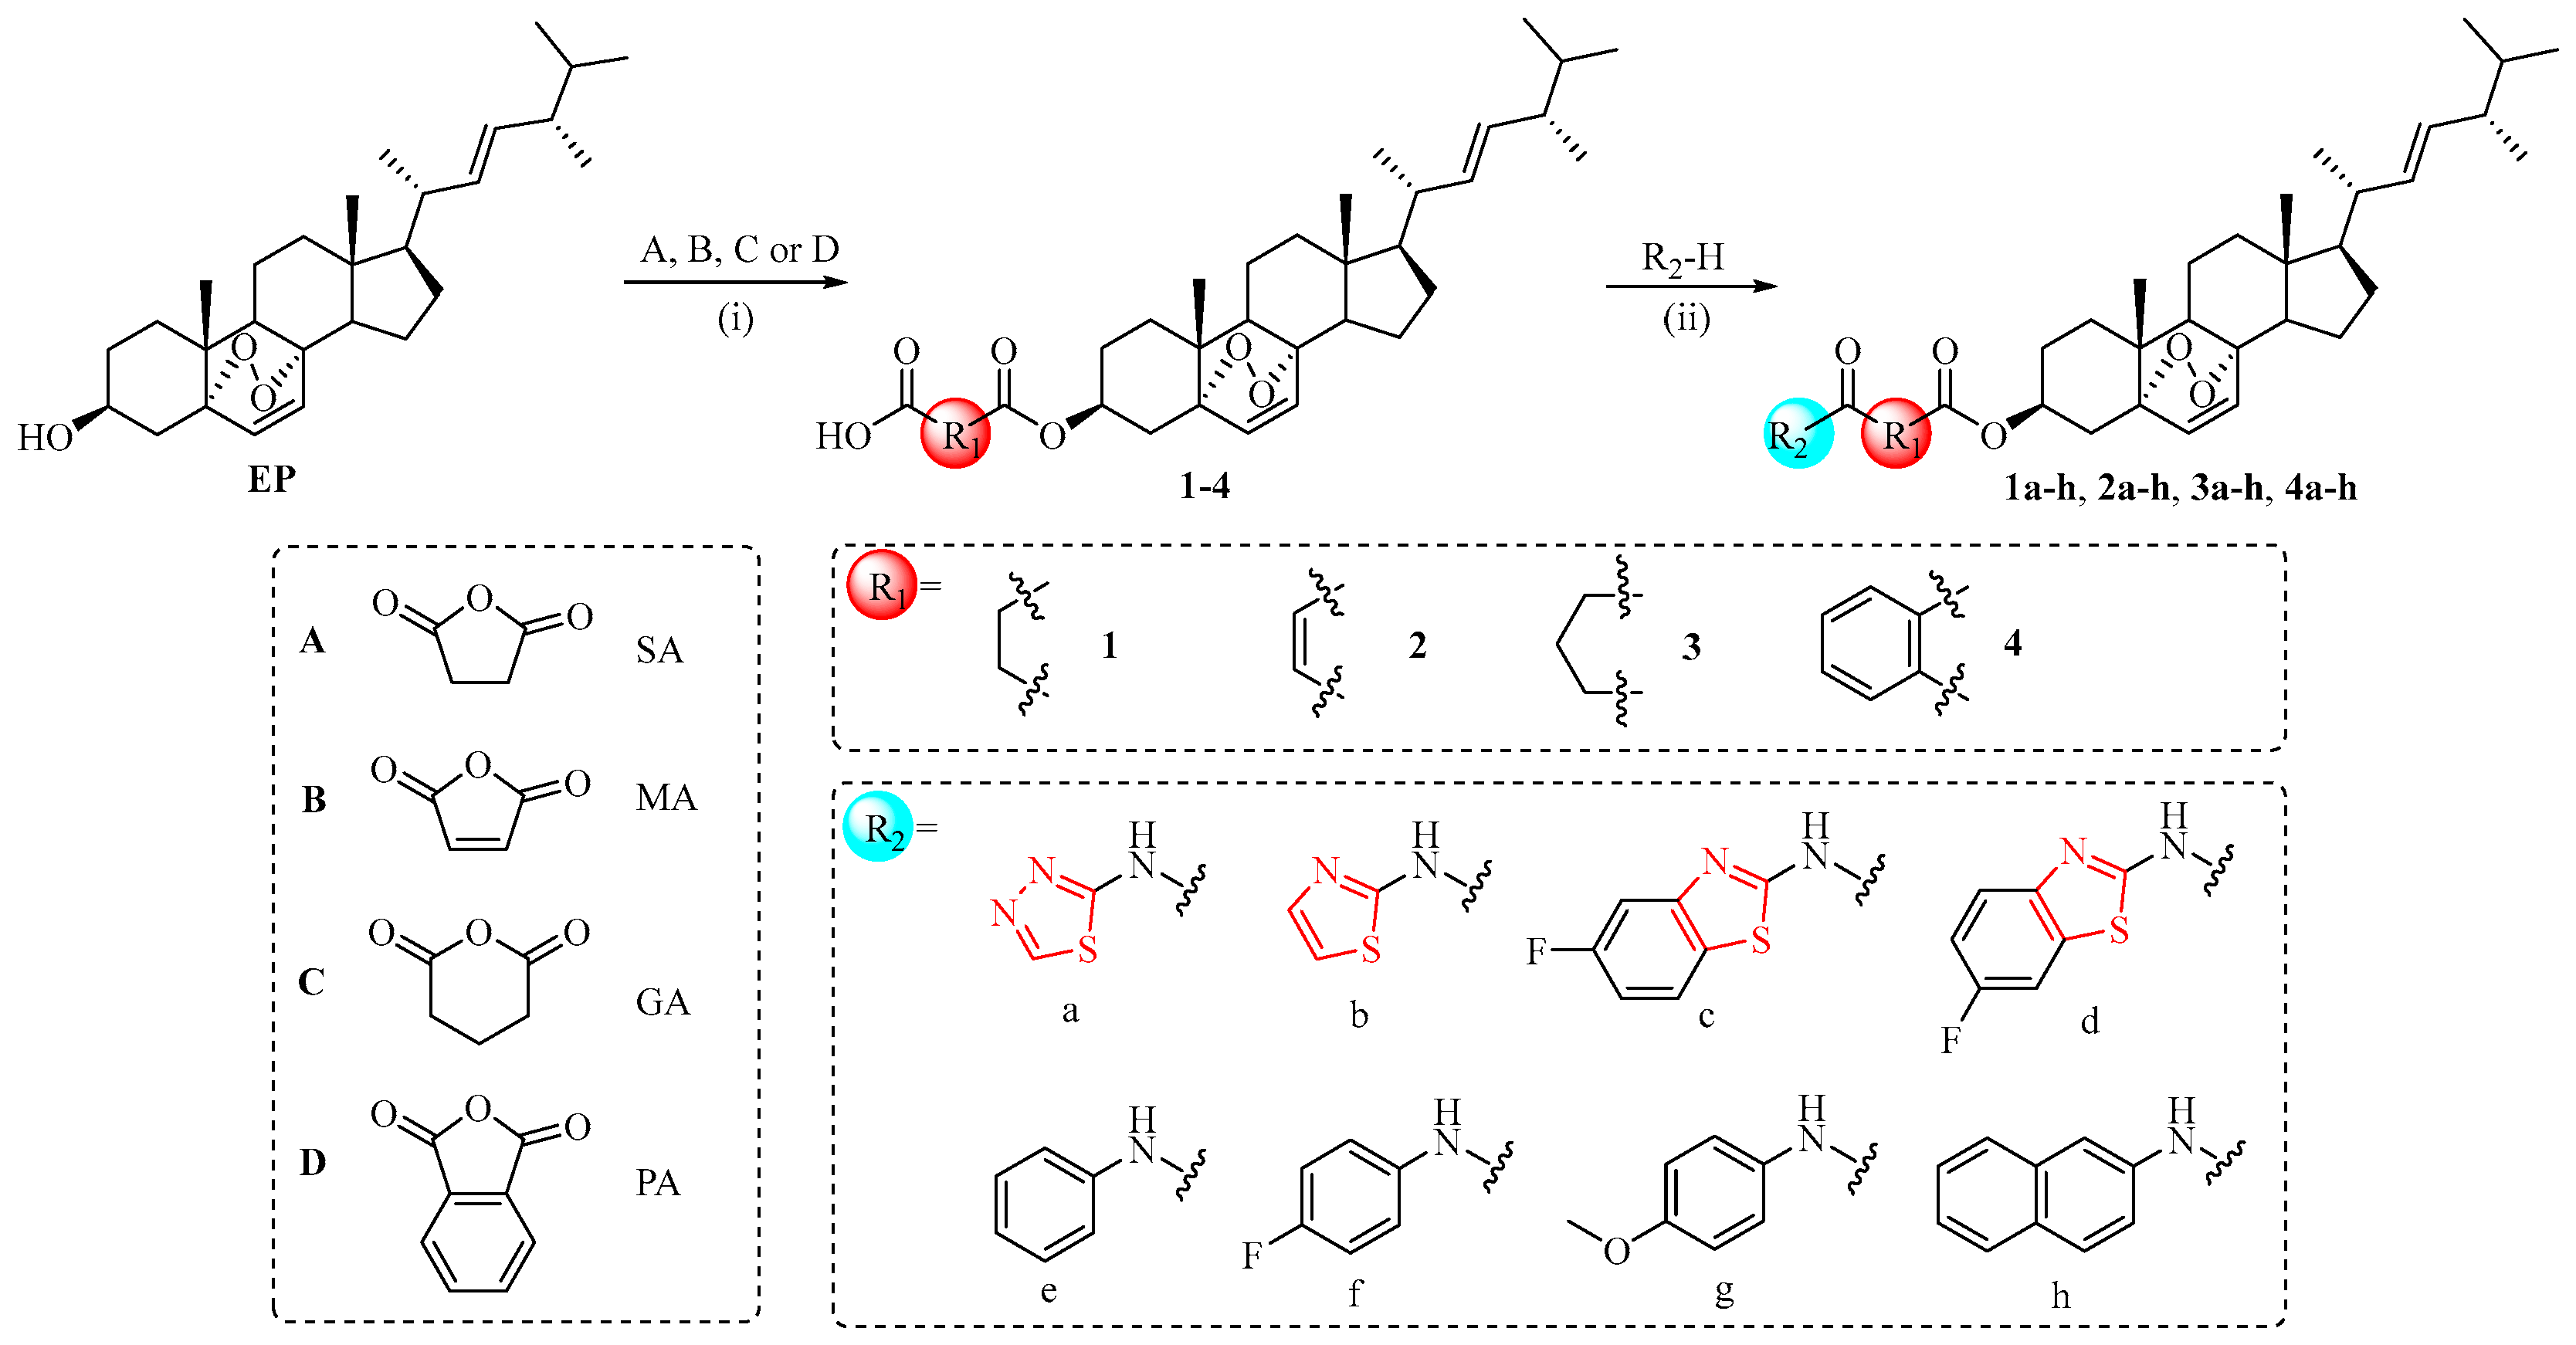
2.1. Chemistry

As shown in Scheme 1 and detailed in the Experimental Section, the synthetic pathways employed for the preparation of the key intermediates 14 and the target compounds 1ah, 2ah, 3ah, and 4ah were presented. Initially, in dichloromethane (CH2Cl2) under reflux conditions, the 3-hydroxyl group of EP was subjected to acylation with succinic anhydride (SA), maleic anhydride (MA), glutaric anhydride (GA), or phthalic anhydride (PA), thereby yielding the intermediates, namely 14. Subsequently, the intermediates were treated with appropriate amino compounds (R2-H) in the presence of the catalysts 1-hydroxybenzotriazole monohydrate (HOBT·H2O), 1-ethyl-3-(3-dimethylaminopropyl) carbodiimide hydrochloride (EDCI·HCl), and pyridine (Py) in dimethylformamide (DMF) at room temperature to obtain the target compounds 1ah, 2ah, 3ah, and 4ah.

2.2. In Vitro Antiproliferative Activity of EP Derivatives

The in vitro antiproliferative activity of the novel EP derivatives (1ah, 2ah, 3ah, and 4ah) was evaluated on four different human cancer cell lines (A549, HepG2, MCF-7, and MDA-MB-231) using an MTT assay. The experimental results are summarized in Table 1. Compared with EP, most of the compounds exhibited better cytotoxic activities against almost all the cell lines. Compound 3g exhibited the most potent inhibitory activity, with an IC50 value of 3.20 µM against the MDA-MB-231 cell line, and it had 5.4-fold higher activity than EP (IC50 = 17.26 µM).
The current data suggest that when the hydroxyl at the C-3 atom was substituted with an ester linkage, most EP derivatives offered better inhibitory activity than EP against all four tumor cell lines. The preliminary structure–activity relationship analysis was as follows. Compounds 1a, 1b, 2a, 2b, 3a, 3b, 4a, and 4b containing either a thiadiazole ring or a thiazole ring exhibited improved activity, while the introduction of benzothiazole presented relatively weak inhibition activity (1c, 1d, 2c, 2d, 3c, 3d, 4c, and 4d). Meanwhile, compounds with high lipophilic group content, such as compounds 1h, 2h, 3h, and 4h, showed relatively moderate cytotoxicity.
Furthermore, the replacement of the heterocyclic ring with a phenyl ring could contribute to the enhancement of the inhibitory activity (compounds 1e, 2e, 3e, and 4e). Consequently, the phenyl ring of the substituents was retained, and EP derivatives possessing a phenyl ring were given priority. The subsequent introduction of an electron-donating methoxy group into compounds 1g, 2g, 3g, and 4g led to an improvement in their inhibitory activity.
For the purpose of further validating our design strategy aimed at enhancing the inhibitory activities, four linkers were chosen. Compounds 3e, 3g, and 3h exhibited the highest inhibitory activity when the chain length of the linker region included five carbon atoms (such as glutaric acid). However, introducing a large sterically hindered linker (such as phthalic acid) into the 3-hydroxyl of EP decreased the antiproliferative activity (i.e., compounds 4f, 4g, and 4h). These results implied that the flexibility of the linker, which determined the spatial orientation of the substituent portion, was crucial for the inhibitory activities. Additionally, these linkers comprised two carbonyl groups that were connected to the substituents through an amide linkage, and this might have offered a binding group for protein–ligand interactions.
Overall, structural modification of EP generated the most potent derivative 3g, in which a 3-hydroxyl group was modified with the lipophilic substituent 4-methoxyphenyl via the linker glutaric acid. Based on these data, we further investigated 3g as a potential anticancer agent. Triple-negative breast cancer (TNBC) was the most aggressive molecular subtype of breast tumors [41,42,43], with high levels of GLS1 and increased glutamine uptake, providing cells with intermediates that met the TCA cycle [44,45]. Based on the potent inhibitory effects observed in MDA-MB-231 cells, we evaluated the inhibitory effects of GLS1 in order to further characterize compound 3g.

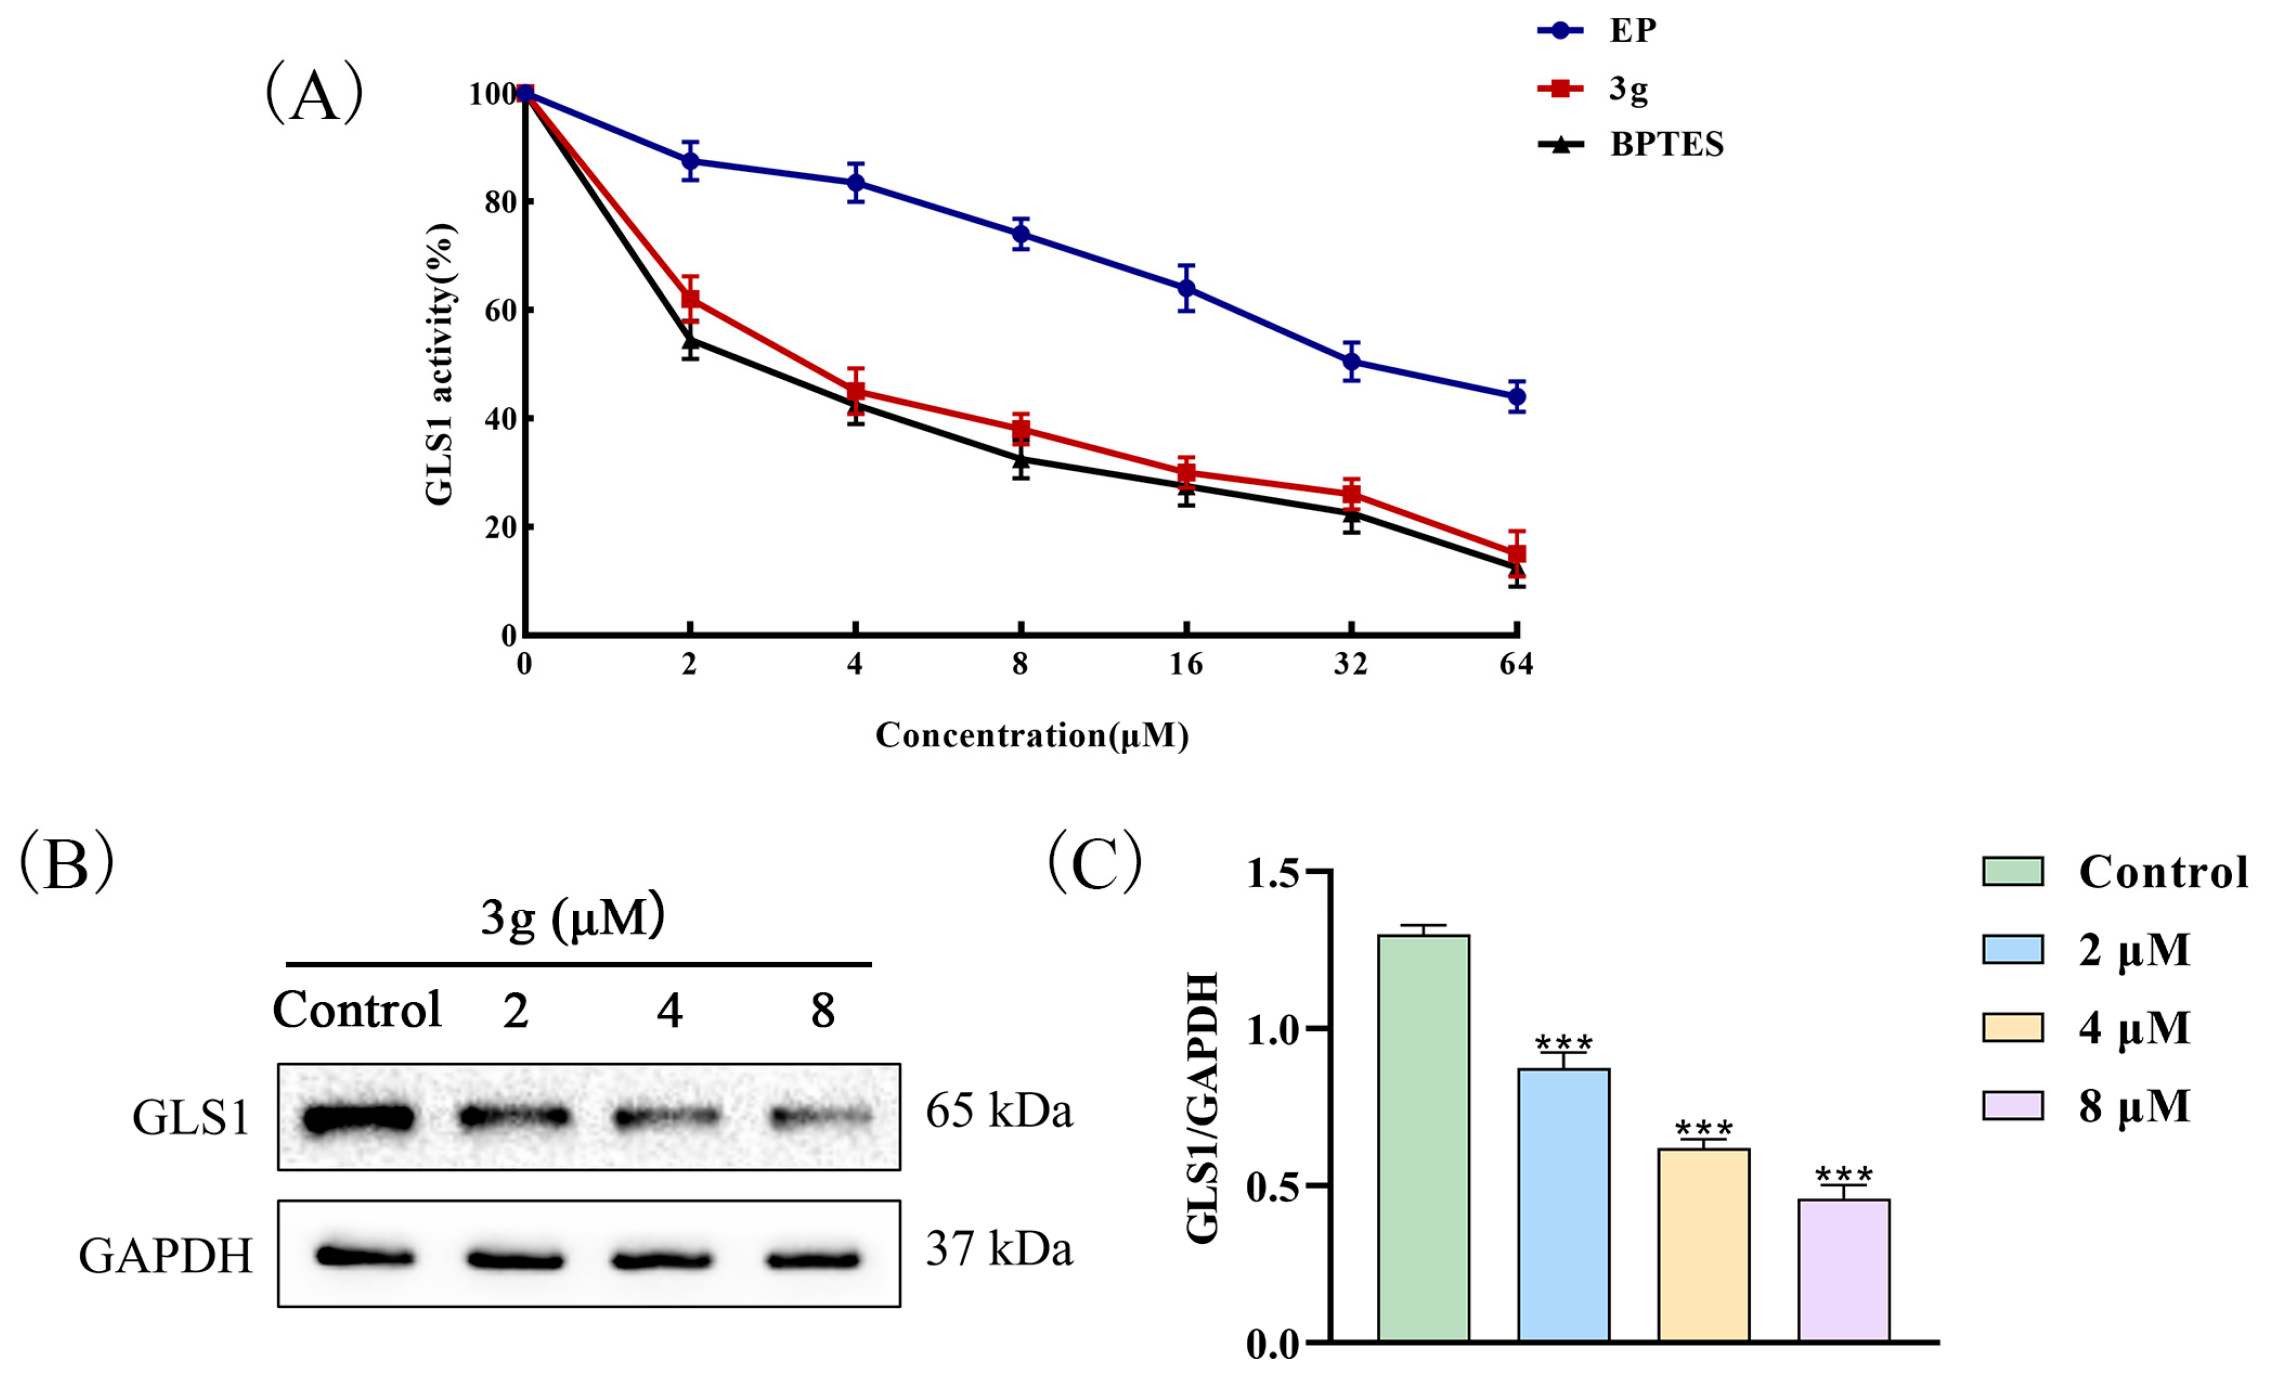
2.3. Compound 3g Inhibited the GLS1 Activity of MDA-MB-231 Cells

The GLS1 inhibitory activity of compound 3g in MDA-MB-231 cells was evaluated using a GLS1 inhibitor screening kit. The parent structure EP and BPTES was used as a reference, and the results are depicted in Figure 2A. Interestingly, both 3g and EP significantly suppressed the activity of GLS1. Notably, 3g inhibited GLS1 significantly more than EP (IC50 = 33.67 μM) in MDA-MB-231 cells (IC50 = 3.77 μM), and the GLS1 inhibitory effect of 3g was similar to that of BPTES (IC50 = 3.23 μM). Western blot analysis also yielded the same results (Figure 2B,C). Therefore, 3g was worthy of further study to determine its bioactivity and pharmacological mechanisms as a new antitumor drug candidate.

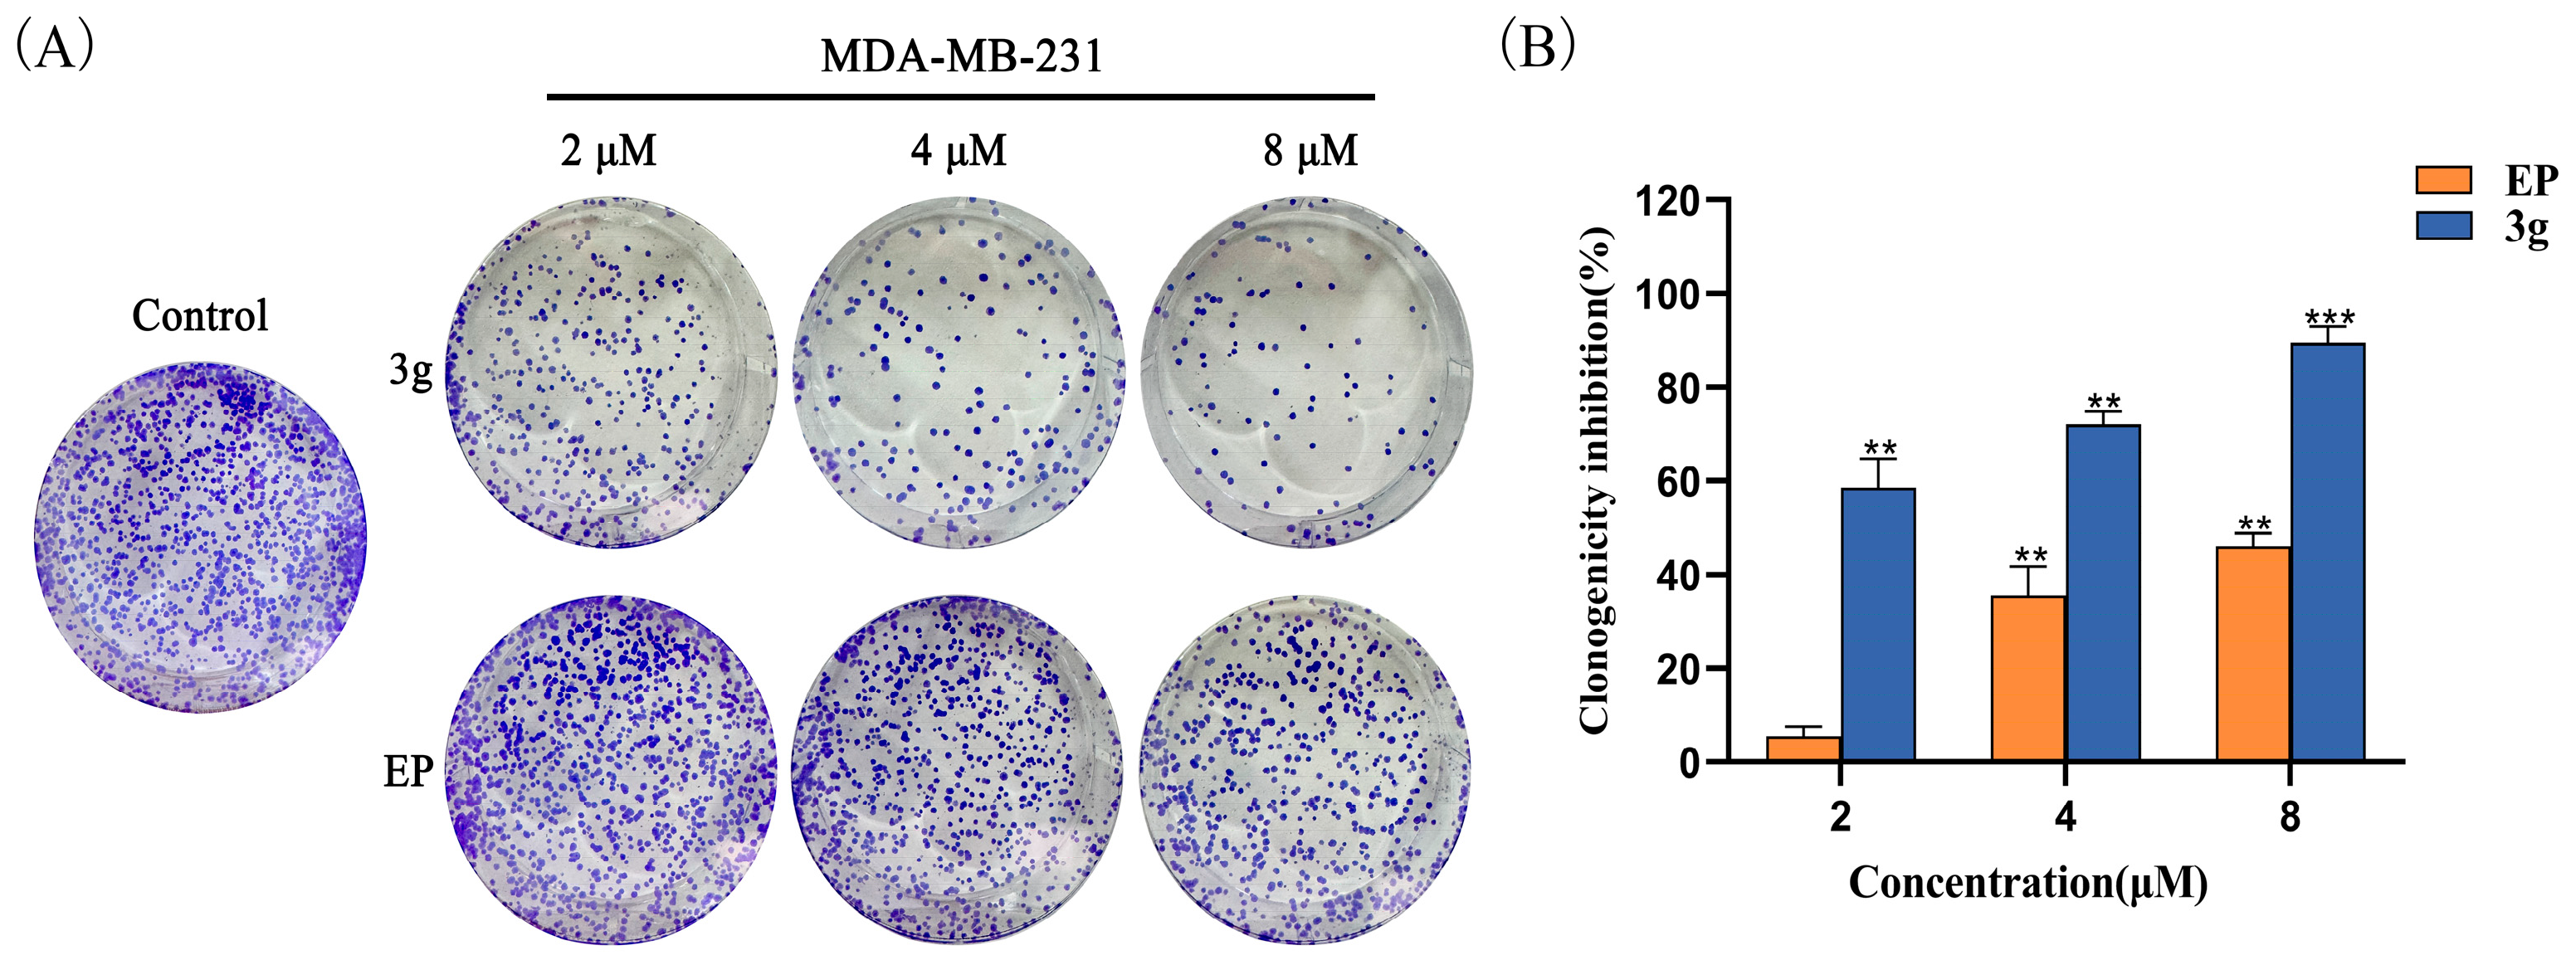
2.4. Compound 3g Inhibited the Colony Formation of MDA-MB-231 Cells

To explore the inhibitory effect of 3g on the proliferation of MDA-MB-231 cells, we treated MDA-MB-231 cells with different concentrations of 3g and EP. The results illustrated in Figure 3 showed that 3g had a significant inhibitory effect on the proliferation of MDA-MB-231 cells, with inhibitory abilities greater than those of EP. Compared with the blank control group, the proliferation inhibition rate of 3g against MDA-MB-231 cells at 2 μM reached 56.27%.

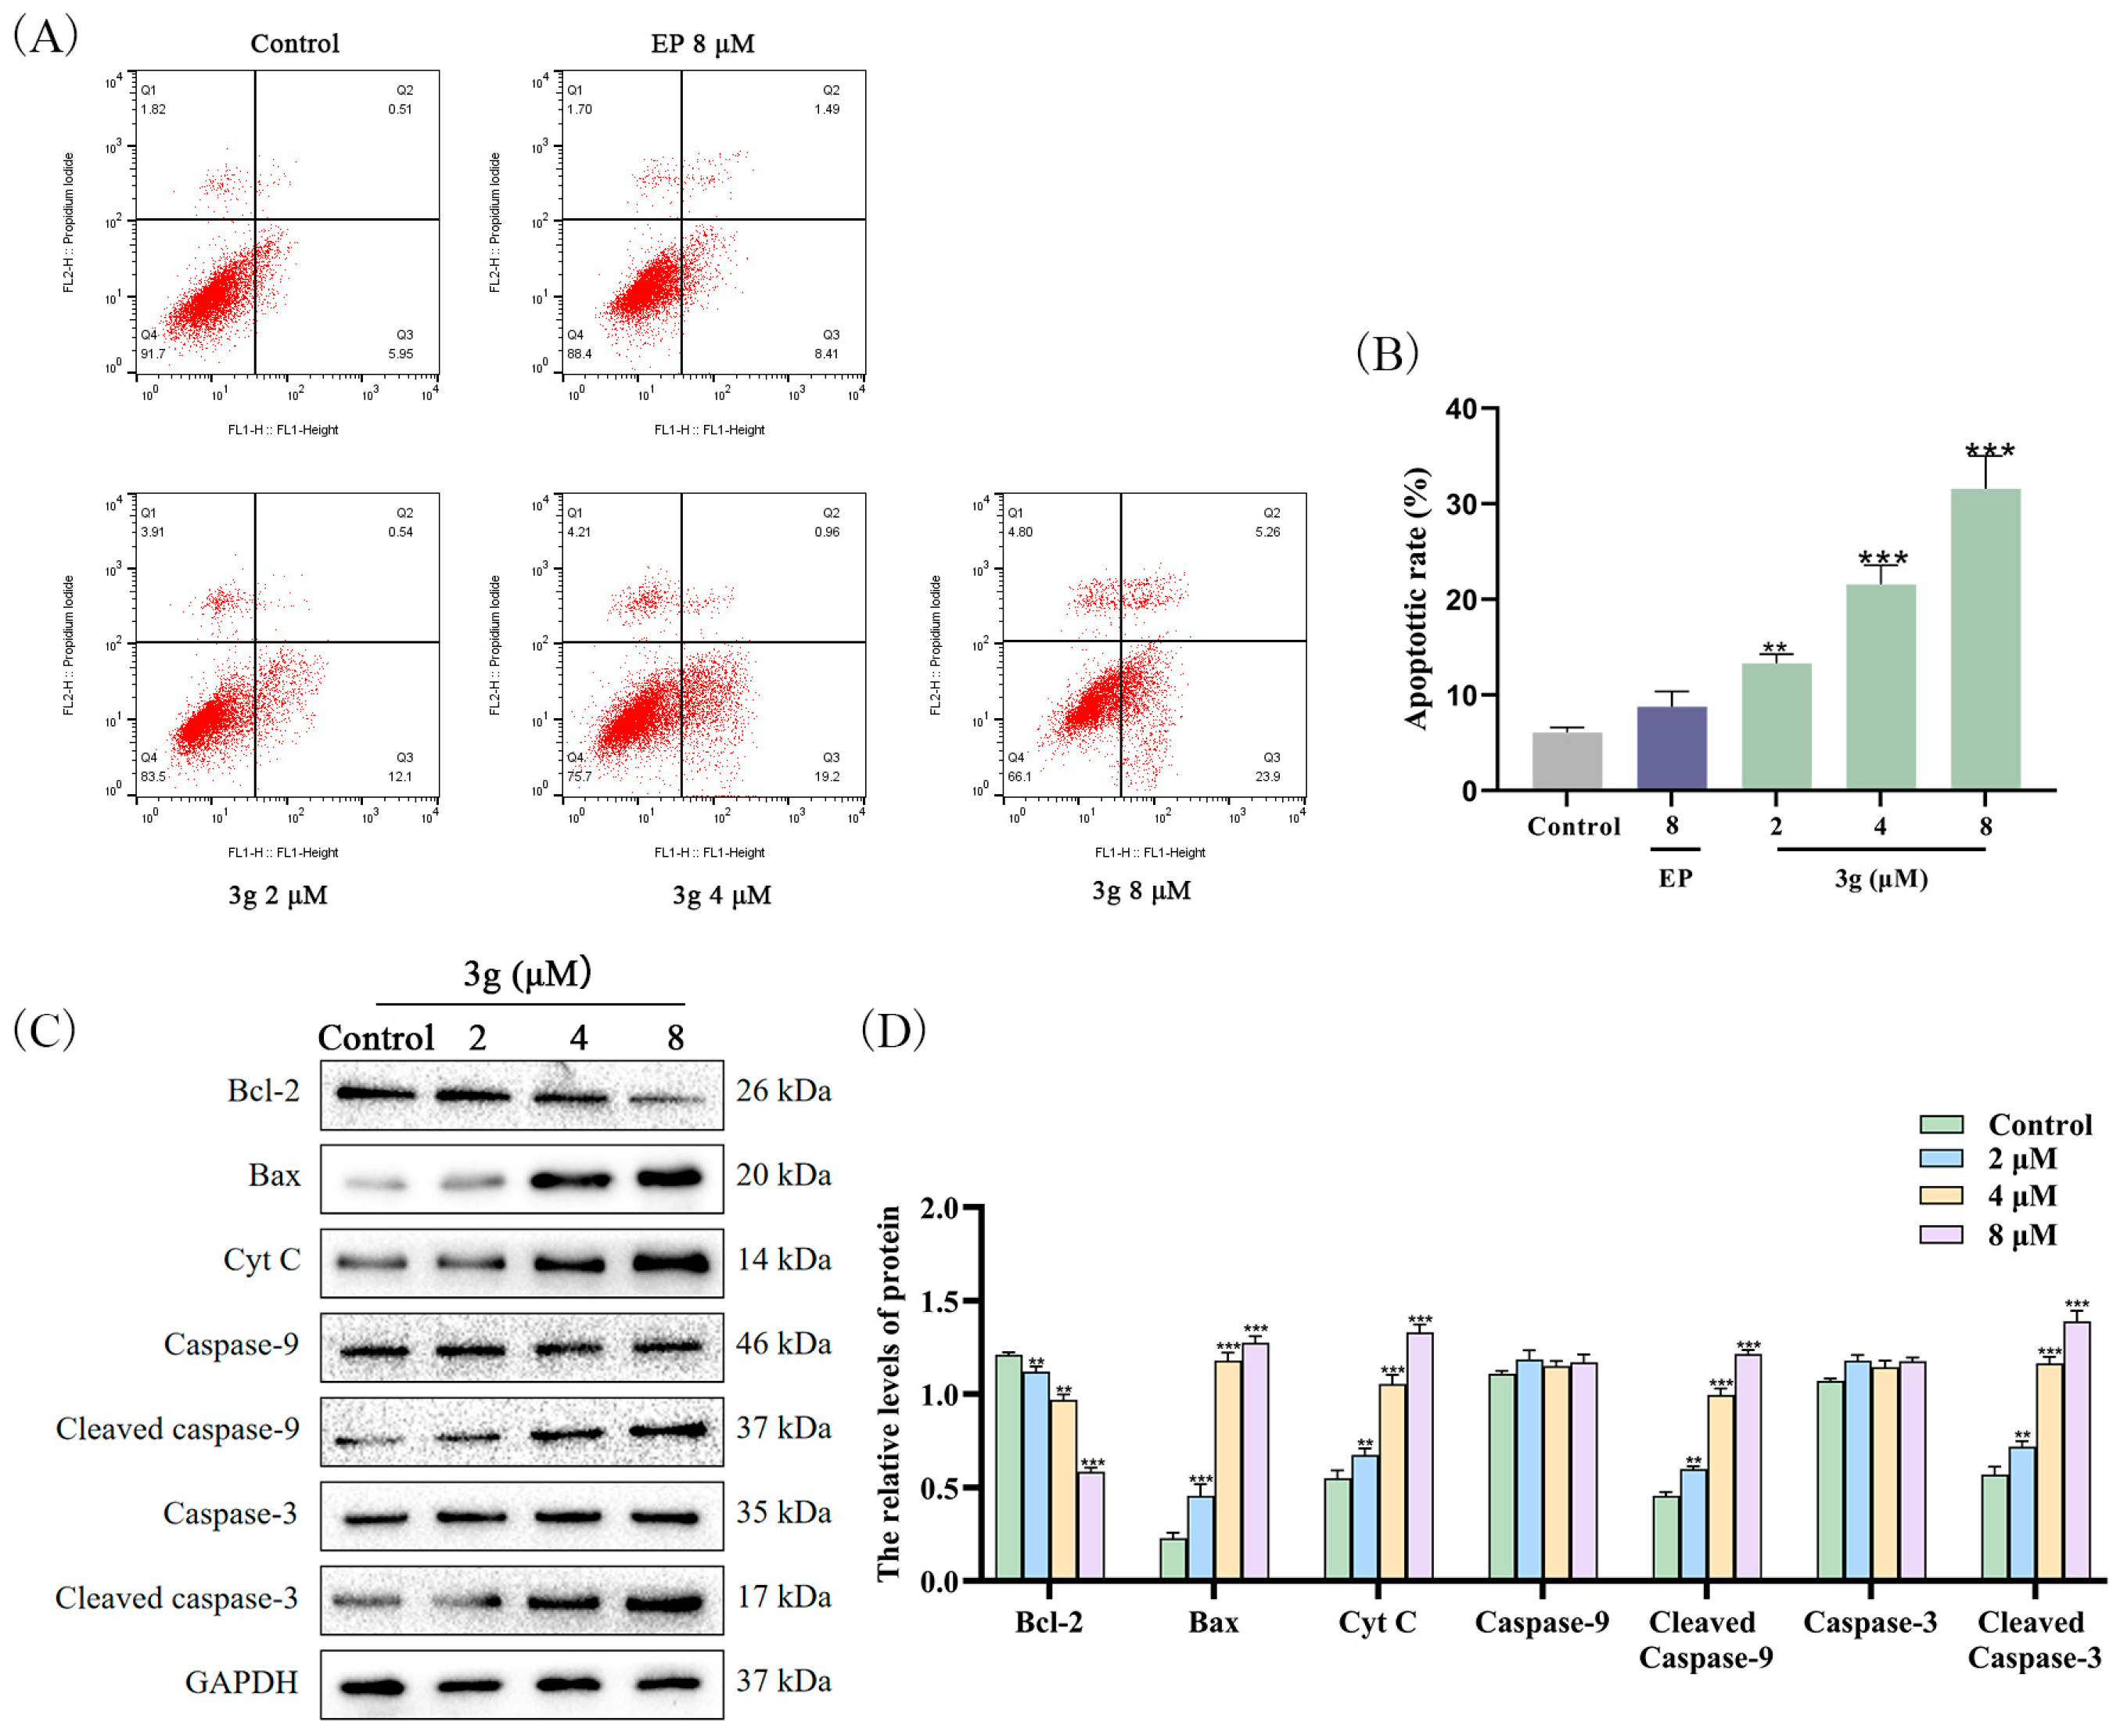
2.5. Compound 3g Induced Apoptosis in MDA-MB-231 Cells

To determine whether the decrease in MDA-MB-231 cell viability observed after 3g treatment was related to apoptosis, we treated MDA-MB-231 cells with 3g and assessed the changes in apoptosis. Annexin V-FITC/PI double staining showed that apoptosis of MDA-MB-231 cells increased significantly after 3g treatment (Figure 4A,B). Additionally, Western blot analysis revealed that the expression of B-cell lymphoma-2-associated X (Bax), cytochrome c (Cyt C), cleaved caspase-9, and cleaved caspase-3 was significantly upregulated and that 3g decreased the expression of B-cell lymphoma-2 (Bcl-2) (Figure 4C,D). These results suggest that 3g may induce apoptosis in MDA-MB-231 cells with overexpressed GLS1 by regulating the mitochondrial apoptotic pathway.

2.6. Compound 3g Inhibited Glutamate Production in MDA-MB-231 Cells

The content of glutamate in MDA-MB-231 cells was detected using Glutamate Assay Kit. This experiment was conducted in accordance with the manufacturer’s instructions. During the experiment, compound 3g reduced the production of glutamate in MDA-MB-231 cells in a dose-dependent manner (Figure 5). Compared with EP, 3g exhibited a more effective inhibitory effect on glutamate in MDA-MB-231 cells. These results suggest that 3g can effectively inhibit GLS1, thereby blocking the glutamine hydrolysis pathway and inducing cell death.

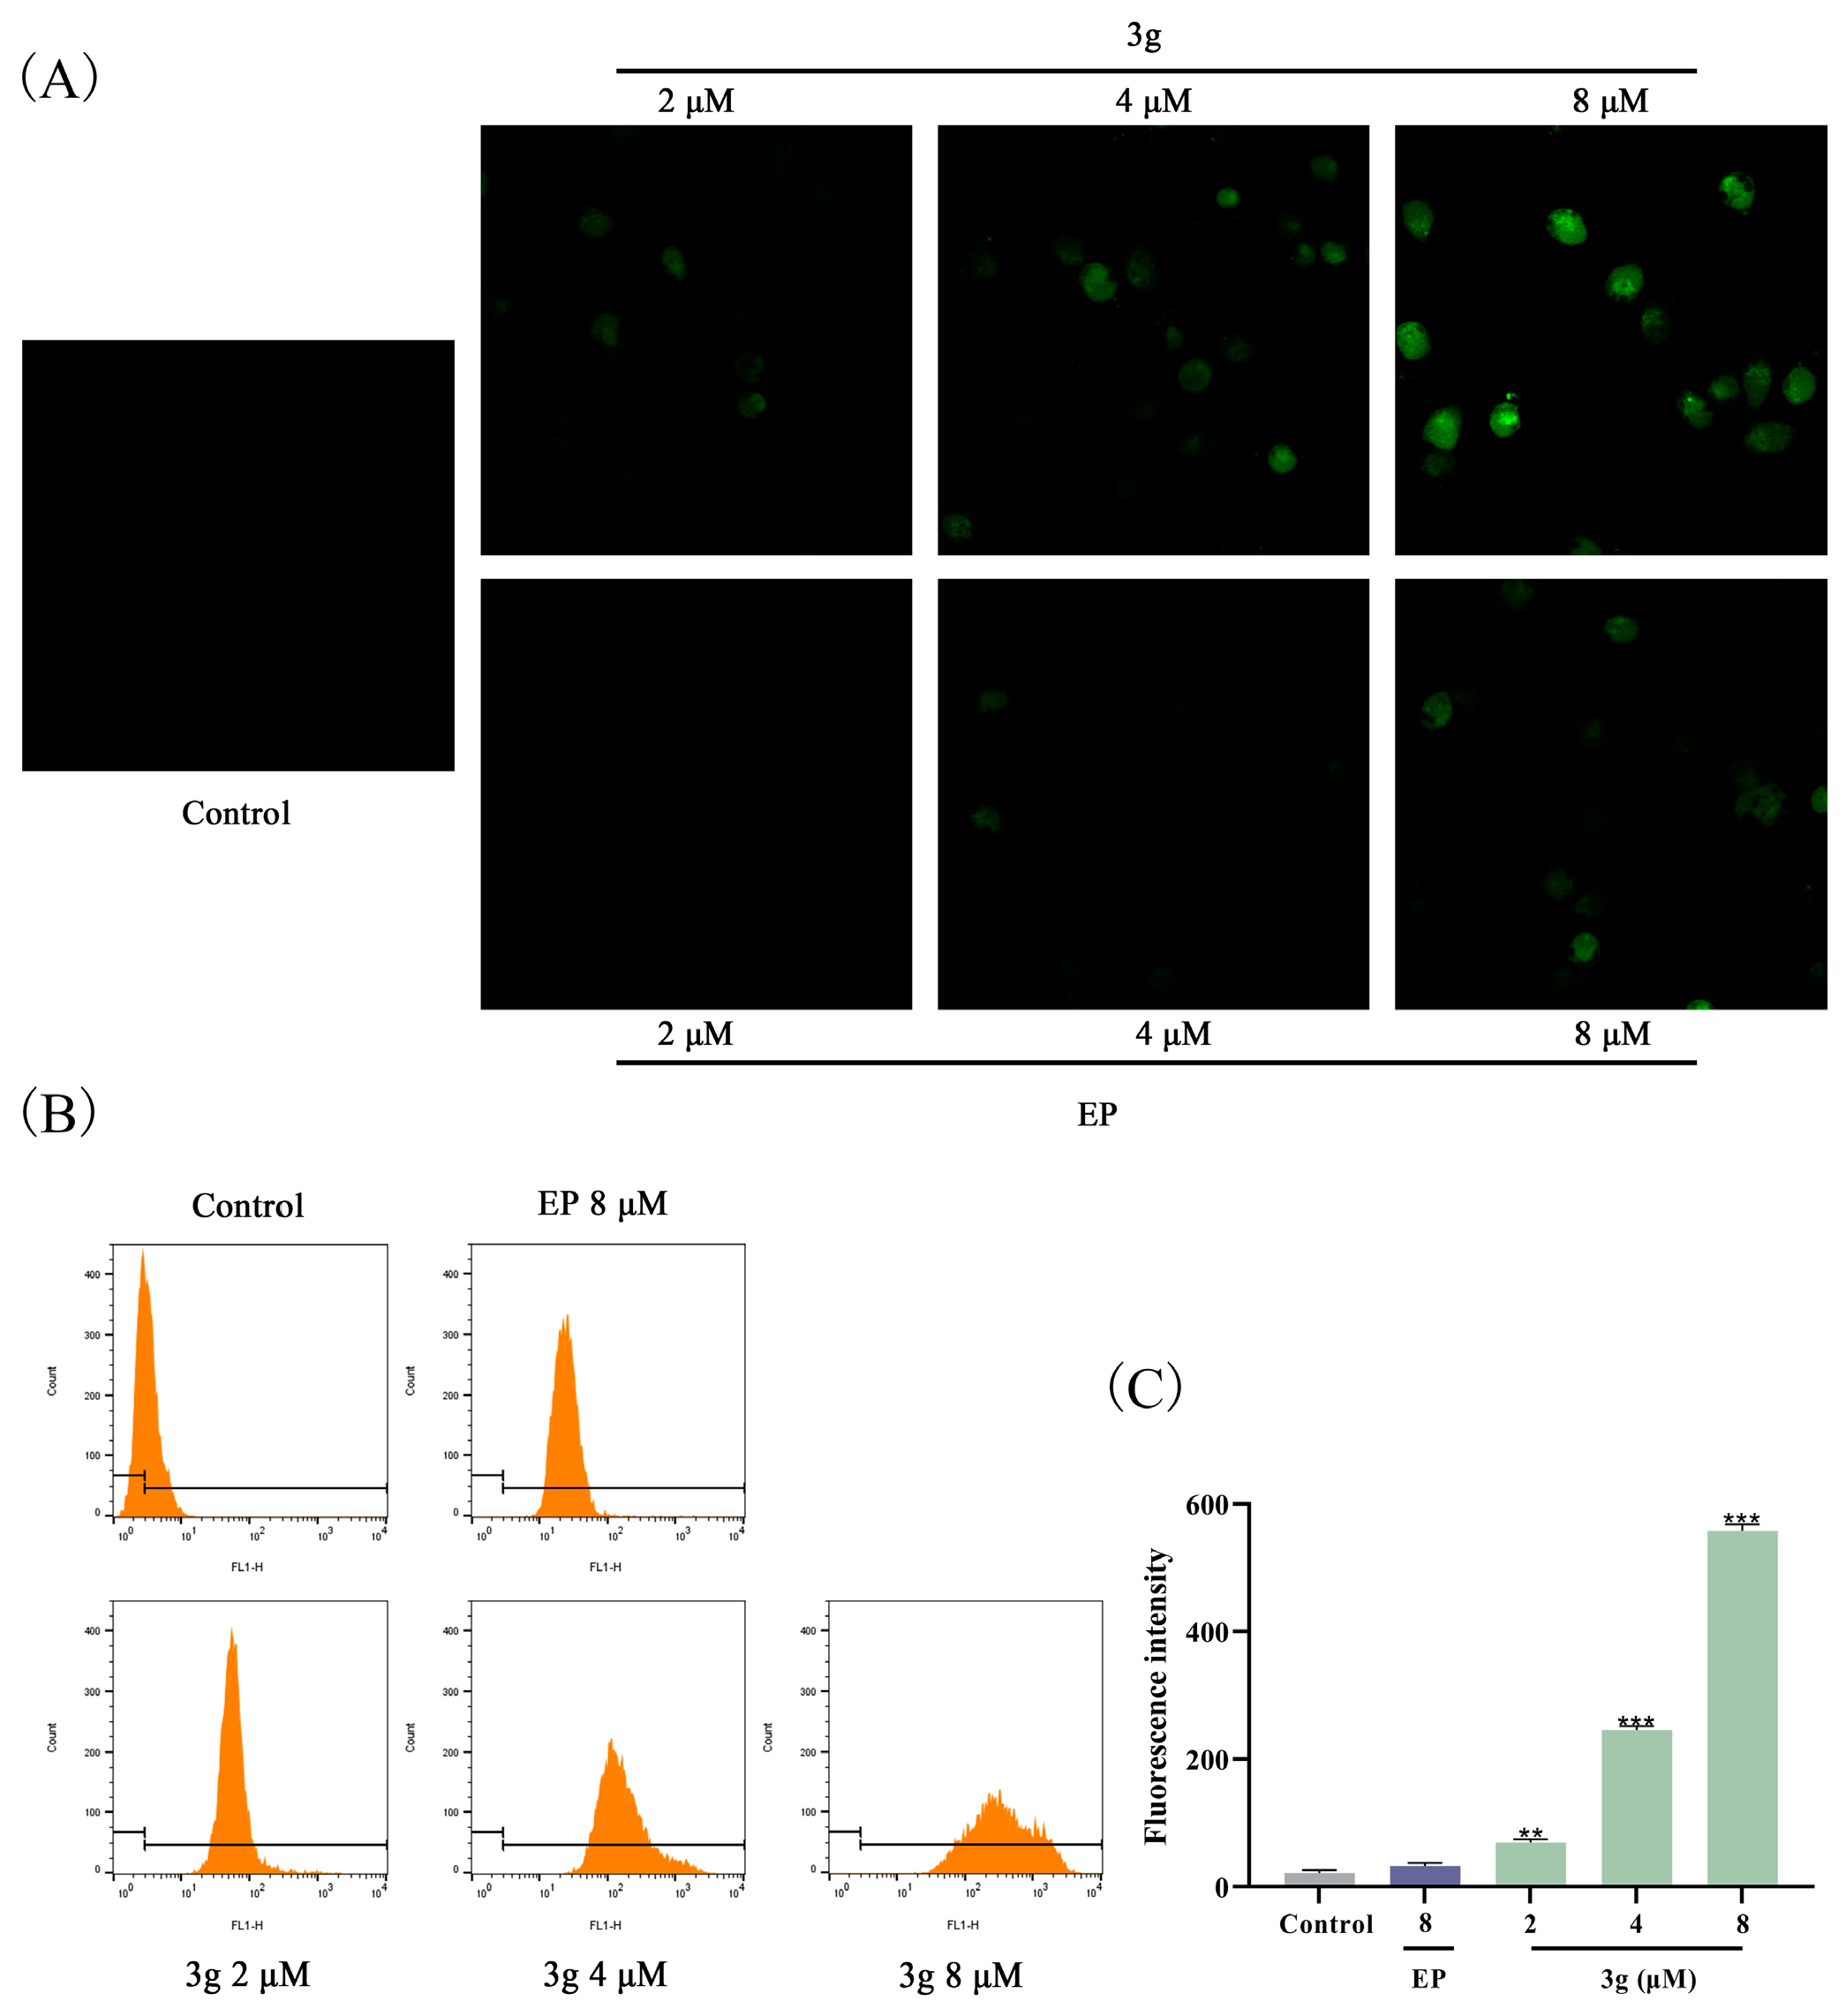
2.7. Compound 3g Induced ROS Generation in MDA-MB-231 Cells

Excessive ROS in tumor cells can induce tumor cell apoptosis. Nevertheless, the ROS levels in tumor cells were often influenced by glutamine. Thus, the regulation of glutamine metabolism was crucial for ROS homeostasis. In this study, laser confocal microscopy and flow cytometry were employed to detect the ROS level. As shown in Figure 6, 3g significantly elevated the intracellular ROS level in MDA-MB-231 cells in a dose-dependent manner, with stronger effects than those of EP. These results indicate that 3g, as a GLS1 inhibitor, can effectively inhibit glutamine hydrolysis, thereby leading to an increase in ROS.

2.8. Compound 3g Docked with GLS1 Molecule

GLS1 usually exists as a dimer or tetramer, where the tetramer is catalytically active and the dimer is inactive. The tetramer is structurally composed of four molecules with an asymmetric unit characterized by two sets of interfaces. In order to investigate the binding mode of compound 3g with GLS1, molecular docking studies were carried out based on the crystal structure of GLS1 (PDB: 3UO9), and it was found that 3g interacts with different reaction sites in the allosteric pocket of GLS1 (Figure 7). The amino acid residues TRY-394, PHE-322, and LEU-323 form hydrogen bonding connections with the amide and ester groups in compound 3g. This hydrogen bonding interaction drives the linker and substituent deep into the narrow cavity of the GLS1 tetramer, which in turn orients 4-methoxyaniline to the other reactive site to form a hydrogen bonding interaction with PHE-322. At the same time, the peroxy bridge in EP also forms a hydrogen bonding interaction with LYS-320. All these interactions help to stabilize the conformation and assembly of the ligand in the new site of the GLS1 allosteric pocket. Notably, the binding energy of the protein–ligand complex reached –10.79 kcal/mol, which was a good indication of the good inhibitory activity of compound 3g toward GLS1.

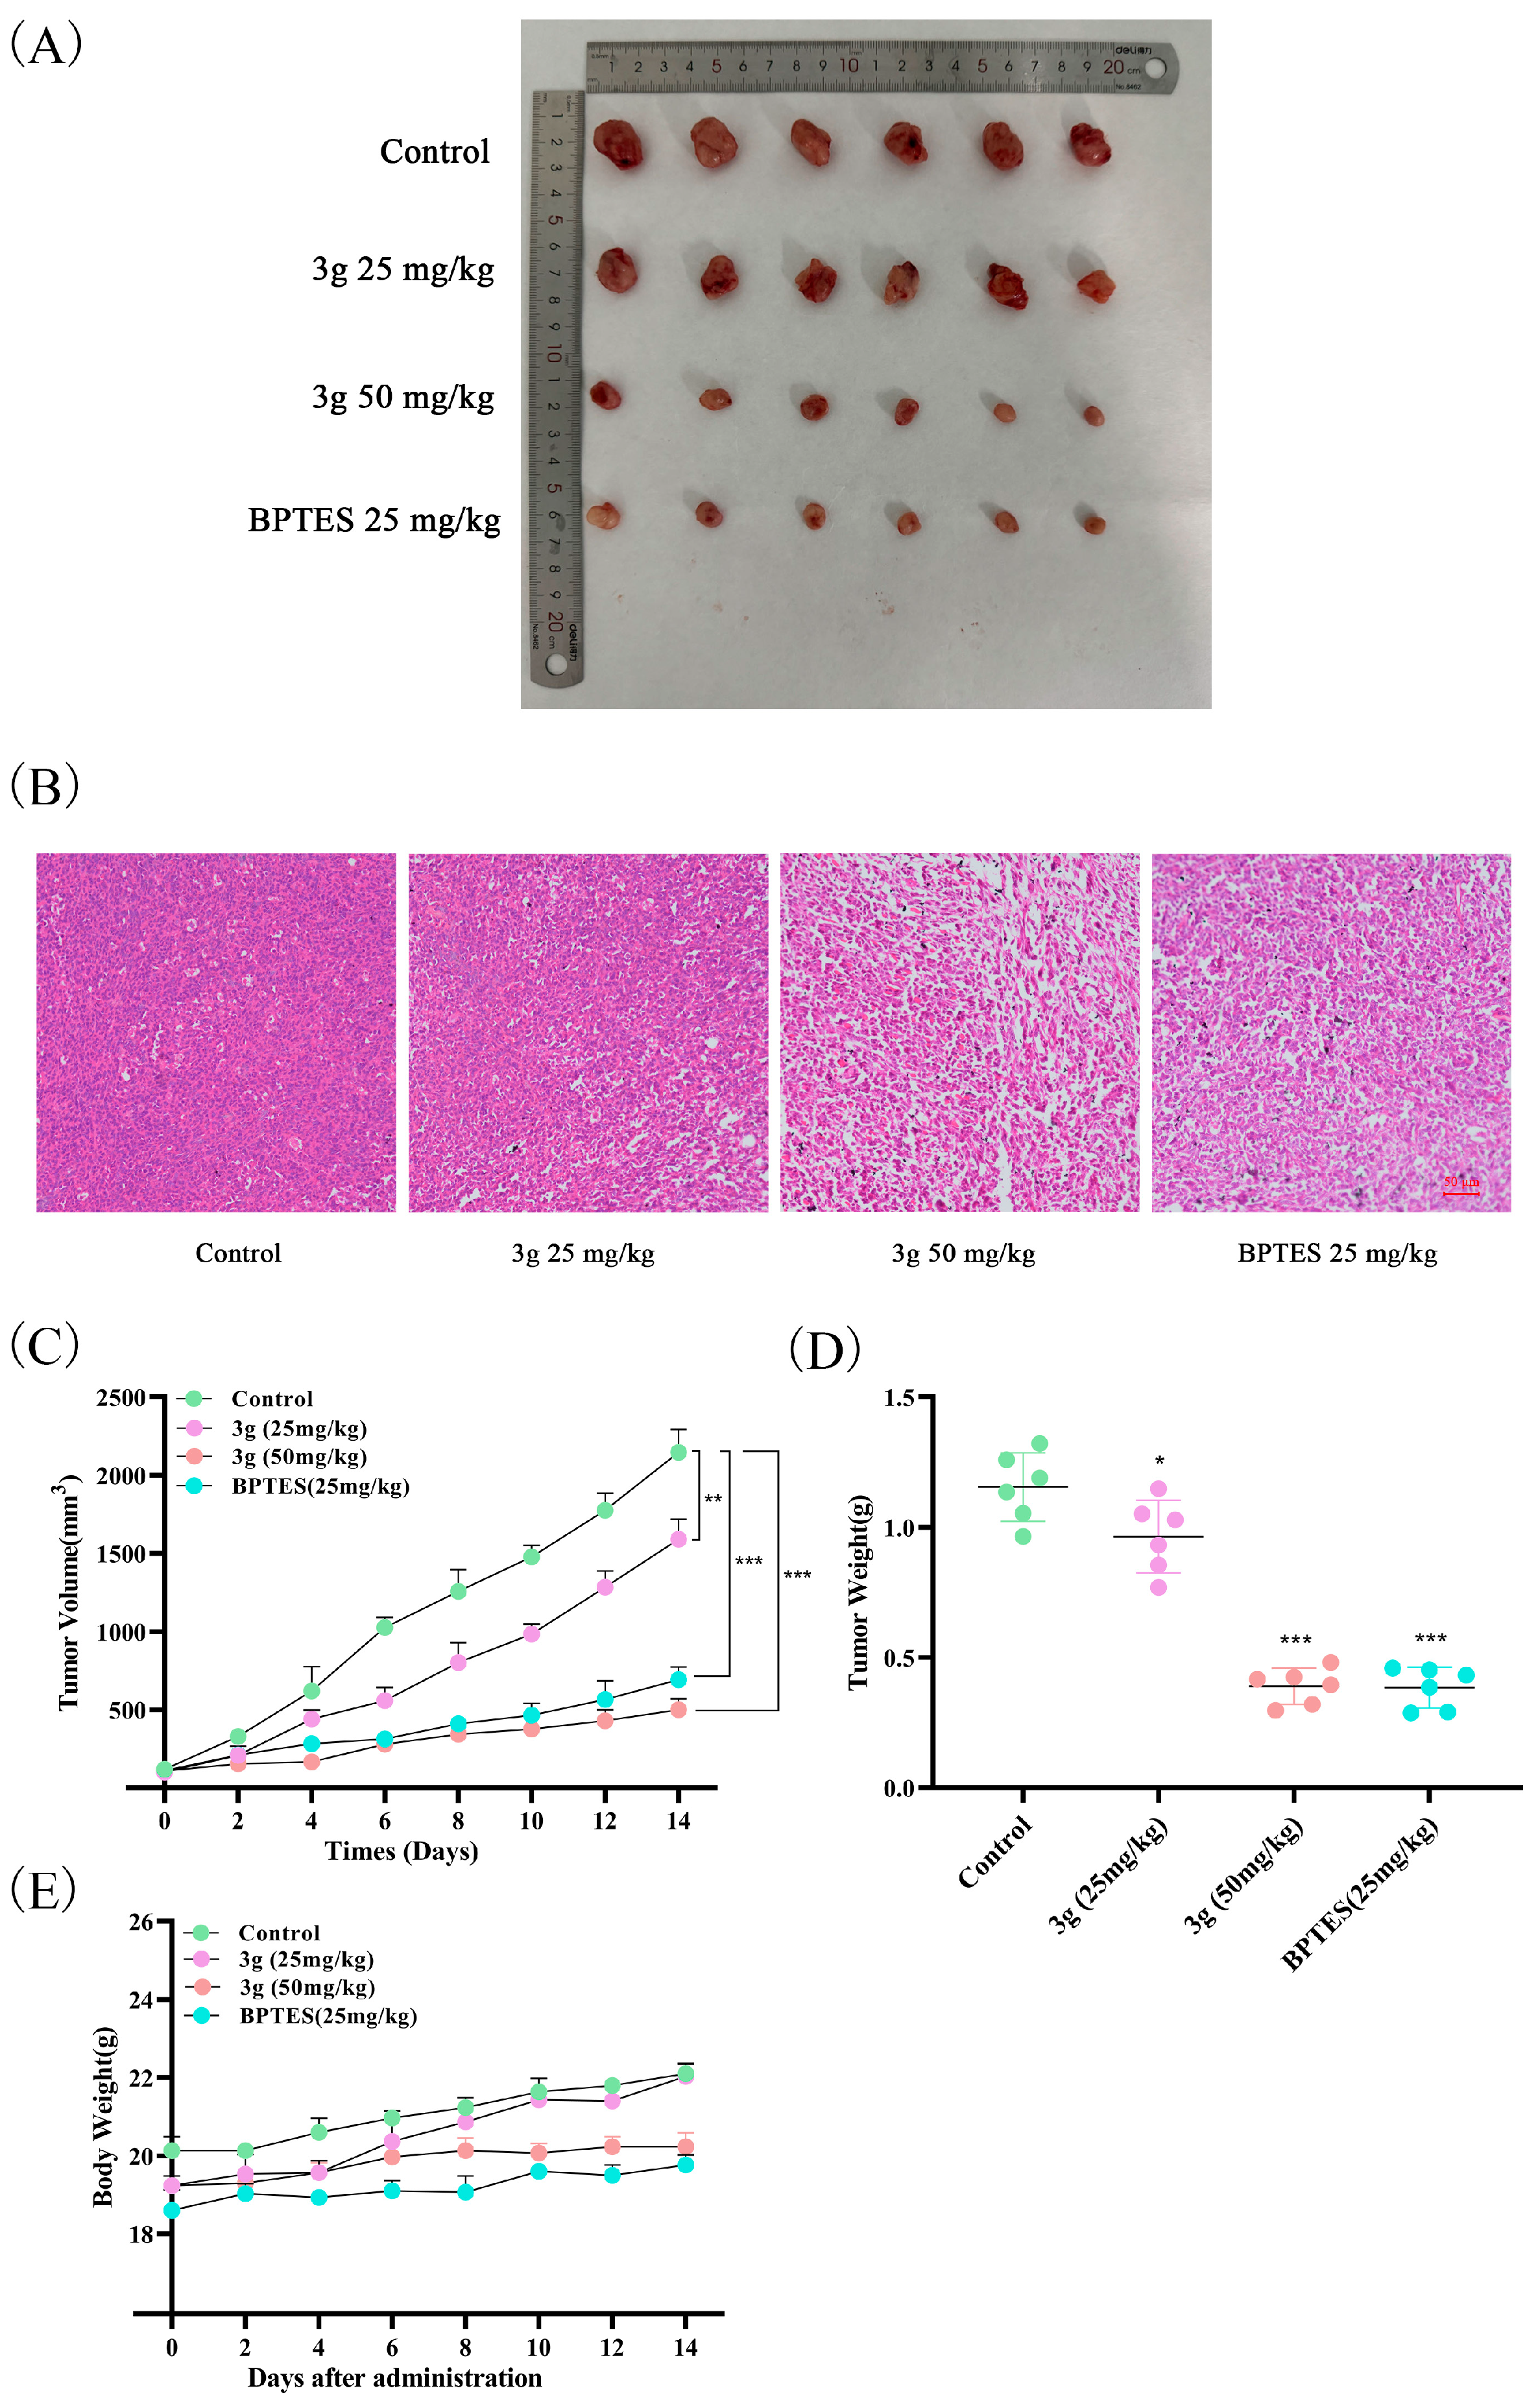
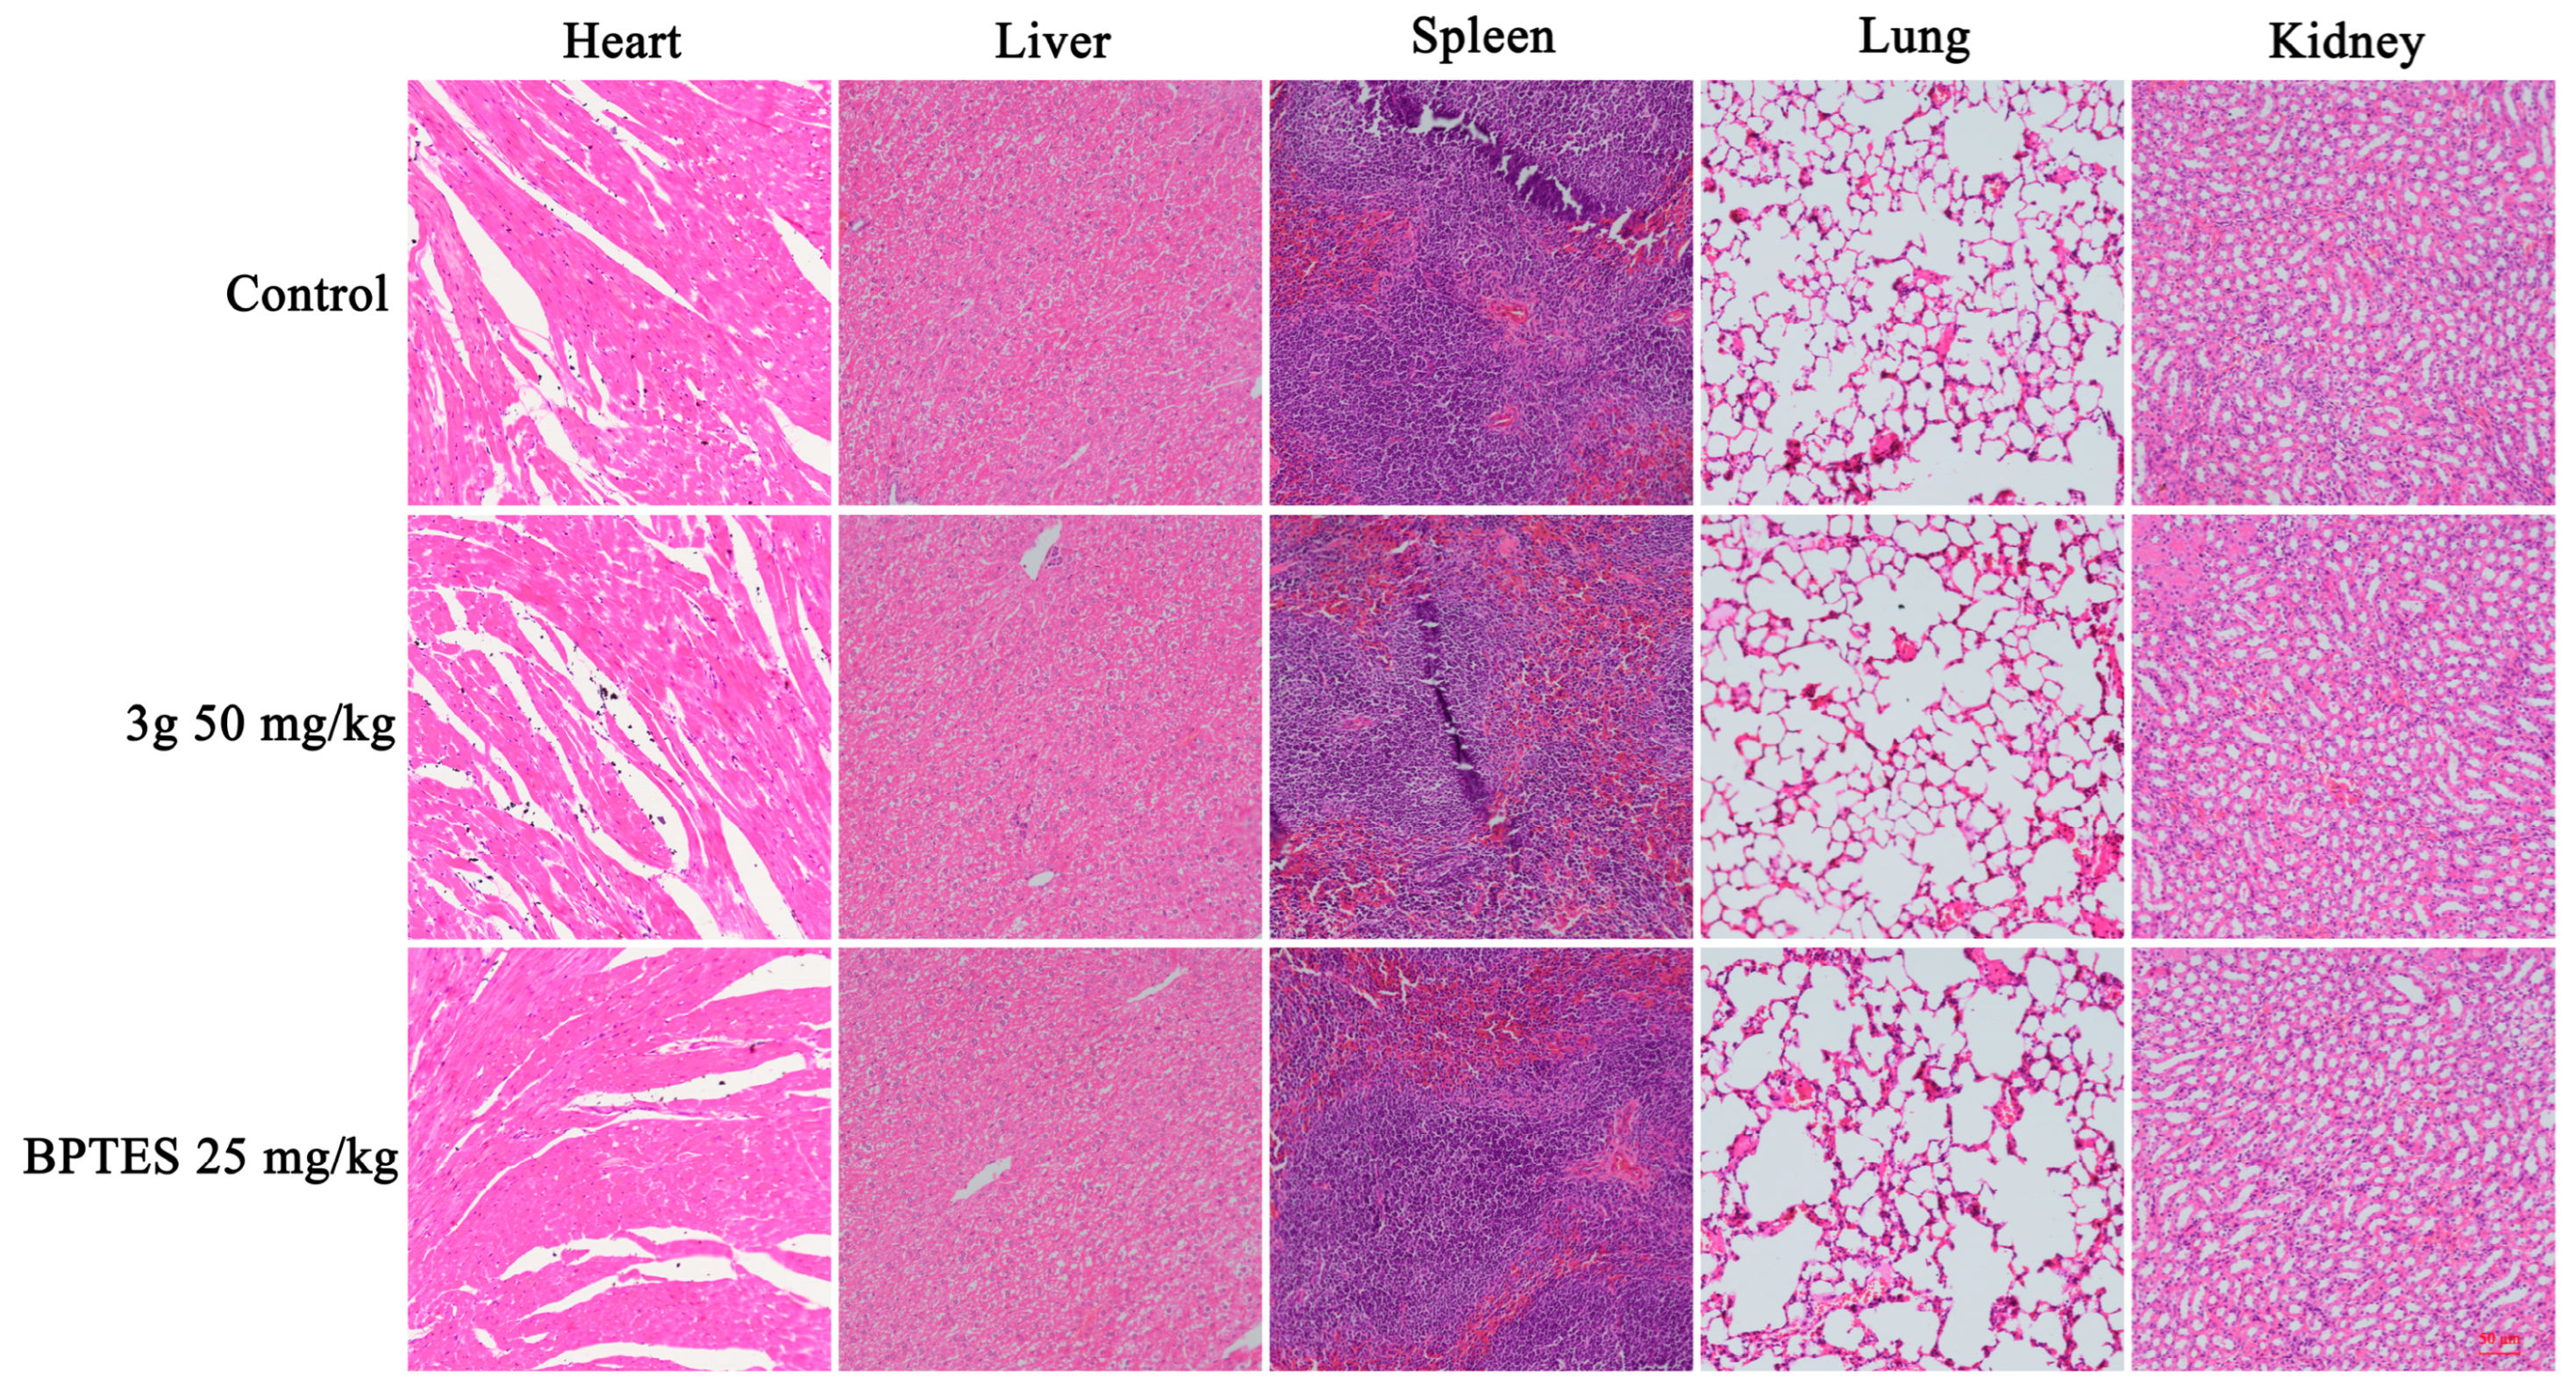
2.9. Compound 3g Inhibited Tumor Growth In Vivo

To more deeply investigate the antitumor activity of compound 3g in vivo, 4T1 cells were injected subcutaneously into BALB/c mice by us to successfully establish a mouse-transplanted tumor model. The mice were treated with 3g (25 and 50 mg/kg/2 days) and BPTES (25 mg/kg/2 days) until they were euthanized on the 14th day. Then, the mice’s organs were collected for histopathological analysis. The tumor growth in the 3g treatment group was effectively inhibited compared with that in the blank control group, as shown in Figure 8A,B. After 3g treatment, both the tumor volume and the tumor weight were significantly reduced (Figure 8C,D). Additionally, compound 3g had no significant effect on the body weights of the mice throughout the experimental treatment period, with no obvious signs of adverse reactions (Figure 8E). To explore the impact of 3g on organ damage, we used the HE staining method to observe the changes in the heart, liver, spleen, lungs, and kidneys. In the tumor-bearing mouse group treated with 3g, no histopathological changes were detected in these organs, clearly indicating the absence of significant toxicity under the current treatment method (Figure 9). These results fully demonstrate that 3g can effectively inhibit the proliferation of tumors in model mice without obvious toxicity to other organs.

3. Materials and Methods

3.1. Chemistry

All the reagents were procured from Hyclone Inc (Logan, UT, USA) and Aladdin (Shanghai, China), and they were used without prior purification. The separation and purification of all the reactions were conducted using silica gel column chromatography with a particle size of 300–400 mesh, and the progress was monitored by TLC plates coated with silica gel GF254. The 1H and 13C nuclear magnetic resonance (NMR) spectra were recorded on an Avance DRX400 spectrometer from Bruker (Beijing, China), operating at 600 MHz and 150 MHz, respectively. The reported chemical shift values are presented in terms of the chemical shift (δ) in parts per million (ppm). Mass spectrometry was performed on an Esquire 6000 mass spectrometer from Skyray Instrument Co., Ltd. (Jiangsu, China).

3.1.1. General Procedure to Prepare Intermediates 14

EP (500 mg, 1.1 mmol) was dissolved in anhydrous CH2Cl2 (10 mL), followed by the sequential addition of Et3N (0.6 mmol) and a mixture of SA, MA, GA, and PA (A, B, C, D, 3.5 mmol, 3 eq.). The reaction mixture was refluxed under nitrogen at room temperature for 24 h. Upon completion of the reaction, as monitored by thin-layer chromatography (TLC), the mixture was diluted with CH2Cl2 (50 mL), extracted with water, and washed with saturated sodium chloride solution. The organic layer was dried with anhydrous sodium sulfate, and the solvent was removed under reduced pressure. The resulting product was purified by silica gel column chromatography using a solvent system of n-hexane and ethyl acetate (50:1, v/v), yielding the desired pure compounds 14 (see Supplementary Materials).
  • Ergosterol peroxide-3-(4-oxobut-2-enoic acid) (1)
White solid (85%). 1H NMR (600 MHz, CDCl3) δ 6.54 (1H, d, J = 8.5 Hz, H-7), 6.45 (1H, d, J = 12.8 Hz, C=C), 6.33 (1H, d, J = 12.8 Hz, C=C), 6.24 (1H, d, J = 8.5 Hz, H-6), 5.24–5.20 (1H, m, H-22), 5.15 (2H, dt, J = 15.2, 7.7 Hz, H-23,H-3), 2.22 (1H, dd, J = 14.4, 6.1 Hz), 2.13–2.02 (4H, m), 1.98–1.95 (1H, m), 1.85 (1H, d, J = 6.4 Hz), 1.76 (1H, d, J = 9.8 Hz), 1.68 (1H, d, J = 14.9 Hz), 1.61–1.55 (2H, m), 1.53 (2H, d, J = 6.8 Hz), 1.47 (1H, q, J = 6.6 Hz), 1.38 (1H, d, J = 8.6 Hz), 1.24 (4H, dd, J = 11.0, 7.8 Hz), 1.00 (3H, d, J = 6.6 Hz, H-18), 0.91 (6H, d, J = 7.6 Hz, H-28, H-21), 0.82 (9H, t, J = 5.0 Hz, H-26, H-27, H-19); 13C NMR (150 MHz, CDCl3) δ 167.2, 164.2, 137.0, 135.2, 134.7, 132.4, 131.2, 129.5, 81.6, 79.6, 73.2, 56.2, 51.6, 51.0, 44.6, 42.8, 39.7, 39.3, 36.9, 34.2, 33.1, 32.8, 28.6, 25.9, 23.4, 20.9, 20.6, 20.0, 19.7, 18.1, 17.6, 12.9.
  • Ergosterol peroxide-3-(4-oxobutanoic acid) (2)
White solid (81%). 1H NMR (600 MHz, CDCl3) δ 6.51 (d, J = 8.5 Hz, 1H, H-7), 6.23 (d, J = 8.5 Hz, 1H, H-6), 5.22 (dd, J = 15.2, 7.7 Hz, 1H), 5.14 (dd, J = 15.2, 8.5 Hz, 1H), 5.01 (td, J = 11.5, 5.6 Hz, 1H), 2.68–2.65 (m, 2H, H-2′), 2.58 (t, J = 6.3 Hz, 2H, H-3′), 2.14–2.11 (m, 1H), 2.06–1.97 (m, 4H), 1.96–1.94 (m, 1H), 1.86–1.83 (m, 1H), 1.78–1.73 (m, 1H), 1.71–1.68 (m, 1H), 1.57 (d, J = 11.1 Hz, 2H), 1.51 (d, J = 9.6 Hz, 2H), 1.48–1.45 (m, 1H), 1.42 (q, J = 6.1, 5.3 Hz, 1H), 1.37 (d, J = 9.9 Hz, 1H), 1.26–1.22 (m, 4H), 1.00 (d, J = 6.6 Hz, 3H, H-18), 0.92–0.89 (m, 6H, H-28, H-21), 0.82 (dd, J = 6.9, 2.9 Hz, 9H, H-26, H-27, H-19); 13C NMR (150 MHz, CDCl3) δ 178.07, 171.20, 135.22, 135.08, 132.32, 130.91, 81.76, 79.42, 70.05, 56.17, 51.61, 51.00, 44.56, 42.78, 39.75, 39.30, 36.95, 34.24, 33.07, 29.72, 29.14, 28.98, 28.65, 26.17, 23.37, 20.89, 20.62, 19.96, 19.65, 18.08, 17.59, 12.89.
  • Ergosterol peroxide-3-(5-oxopentanoic acid) (3)
White solid (82%). 1H NMR (600 MHz, CDCl3) δ 6.51 (d, J = 8.5 Hz, 1H, H-7), 6.23 (d, J = 8.5 Hz, 1H, H-6), 5.22 (dd, J = 15.2, 7.6 Hz, 1H), 5.14 (dd, J = 15.3, 8.4 Hz, 1H), 5.00 (dt, J = 11.7, 6.1 Hz, 1H), 2.42 (d, J = 7.3 Hz, 2H, H-4′), 2.36 (t, J = 7.3 Hz, 2H, H-3′), 2.14–2.11 (m, 1H), 2.01 (t, J = 12.8 Hz, 4H), 1.95 (d, J = 7.2 Hz, 3H, H-2′), 1.85 (d, J = 6.8 Hz, 1H), 1.76–1.73 (m, 1H), 1.70 (d, J = 13.6 Hz, 1H), 1.57 (d, J = 11.5 Hz, 2H), 1.51 (d, J = 11.9 Hz, 2H), 1.47–1.45 (m, 1H), 1.39 (d, J = 5.2 Hz, 1H), 1.36 (s, 1H), 1.25 (s, 4H), 1.00 (d, J = 6.6 Hz, 3H), 0.91–0.89 (m, 6H), 0.84–0.81 (m, 9H); 13C NMR (150 MHz, CDCl3) δ 177.82, 171.92, 135.22, 135.08, 132.33, 130.94, 81.76, 79.42, 69.63, 56.18, 51.61, 51.01, 44.57, 42.78, 39.75, 36.96, 34.27, 33.44, 33.17, 33.07, 29.72, 28.65, 26.30, 23.38, 20.89, 20.63, 19.96, 19.65, 18.09, 17.58, 12.89.
  • Ergosterol peroxide-3-(2-carbonyl-benzoic acid) (4)
White solid (76%). 1H NMR (600 MHz, CDCl3) δ 7.80 (s, 1H), 7.64 (s, 1H), 7.48 (s, 2H), 6.44 (s, 1H), 6.17 (s, 1H), 5.22 (d, J = 7.7 Hz, 1H), 5.15 (dd, J = 15.1, 8.2 Hz, 2H), 2.23 (s, 1H), 2.02 (d, J = 9.2 Hz, 3H), 1.94 (d, J = 11.0 Hz, 2H), 1.85 (d, J = 6.7 Hz, 1H), 1.75 (d, J = 10.0 Hz, 2H), 1.58 (s, 2H), 1.49–1.45 (m, 3H), 1.38 (s, 1H), 1.34 (d, J = 2.9 Hz, 1H), 1.25 (s, 4H), 1.00 (d, J = 6.5 Hz, 3H, C-18), 0.92 (d, J = 6.8 Hz, 3H, C-28), 0.84–0.80 (m, 12H, C-21, C-26, C-27, C-19); 13C NMR (150 MHz, CDCl3) δ 167.08, 166.72, 134.21, 132.74, 131.29, 129.91, 129.59, 128.96, 128.76, 128.73, 127.83, 127.33, 80.89, 78.32, 64.56, 55.16, 50.61, 49.99, 43.52, 41.78, 38.73, 38.31, 35.90, 33.26, 32.04, 30.91, 27.63, 26.21, 22.31, 19.88, 19.63, 18.94, 18.64, 16.97, 16.60, 11.85.

3.1.2. General Procedure to Prepare Compounds 1ah, 2ah, 3ah, and 4ah

Intermediates 1, 2, 3, and 4 (100 mg, 0.2 mmol) were dissolved in 10 mL of DMF, and EDCI (0.2 mmol, 0.5 eq.), HOBt (0.1 mmol), and pyridine (py, 0.1 mmol) were added sequentially. The mixture was stirred at room temperature for 30 min, followed by the addition of an amine substituent (0.3 mmol, 1.2 eq.). The reaction was continued under nitrogen protection at room temperature with stirring for 12 to 48 h. After the completion of the reaction was confirmed by thin-layer chromatography (TLC), the mixture was extracted with water and ethyl acetate, and the aqueous layer was dewatered using saturated sodium chloride. The organic layer was dried with anhydrous sodium sulfate and the solvent was concentrated under reduced pressure. The target compounds 1a–h, 2a–h, 3a–h, and 4a–h were obtained through purification by silica gel column chromatography using a dichloromethane-methanol solvent system at a ratio of 100:1 (v/v).
  • Ergosterol peroxide-3-(4-((1,3,4-thiadiazol-2-yl)amino)-4-oxobut-2-enoate) (1a)
White solid (86%). 1H NMR (600 MHz, CDCl3) δ 8.78 (s, 1H, S-CH), 6.63 (d, J = 12.4 Hz, 1H, H-3′), 6.43 (d, J = 8.5 Hz, 1H, H-7), 6.36 (d, J = 12.4 Hz, 1H, H-2′), 6.12 (d, J = 8.5 Hz, 1H, H-6), 5.15–5.13 (m, 1H), 5.09–5.04 (m, 2H), 2.11–2.08 (m, 1H), 1.95 (d, J = 13.8 Hz, 4H), 1.89–1.87 (m, 1H), 1.78 (d, J = 6.7 Hz, 1H), 1.68 (d, J = 7.4 Hz, 1H), 1.64–1.61 (m, 1H), 1.51 (s, 2H), 1.45–1.42 (m, 2H), 1.40 (d, J = 6.5 Hz, 1H), 1.34–1.32 (m, 1H), 1.29 (s, 1H), 1.18 (s, 4H), 0.93 (d, J = 6.5 Hz, 3H, H-18), 0.84 (d, J = 6.8 Hz, 3H, H-28), 0.78 (s, 3H, H-21), 0.76–0.74 (m, 9H, H-26, H-27, H-19); 13C NMR (150 MHz, CDCl3) δ 163.88, 161.15, 158.59, 146.81, 134.16, 133.85, 131.30, 131.00, 130.15, 130.02, 80.60, 78.39, 70.52, 55.13, 50.52, 49.90, 43.52, 41.75, 38.71, 38.24, 35.90, 33.13, 32.04, 31.81, 27.61, 24.88, 22.33, 19.86, 19.59, 18.94, 18.62, 16.99, 16.56, 11.86; HRMS (ESI) m/z: calcd for C34H47N3O5S [M + Na]+: 632.3236, found: 632.3125.
  • Ergosterol peroxide-3-(4-(thiazol-2-ylamino)-4-oxobut-2-enoate) (1b)
White solid (81%). 1H NMR (600 MHz, CDCl3) δ 7.48 (s, 1H, N-CH), 7.01 (d, J = 3.5 Hz, 1H, S-CH), 6.55 (d, J = 12.8 Hz, 1H, H-3′), 6.50 (d, J = 8.5 Hz, 1H, H-7), 6.30 (d, J = 12.8 Hz, 1H, H-2′), 6.17 (d, J = 8.5 Hz, 1H, H-6), 5.22 (dd, J = 15.2, 7.6 Hz, 1H), 5.14 (dd, J = 15.1, 8.4 Hz, 2H), 2.13 (dd, J = 13.6, 5.3 Hz, 1H), 2.00 (d, J = 9.1 Hz, 4H), 1.94 (s, 1H), 1.86–1.83 (m, 1H), 1.74 (d, J = 9.1 Hz, 1H), 1.69 (d, J = 10.5 Hz, 1H), 1.59–1.55 (m, 2H), 1.49 (t, J = 5.3 Hz, 2H), 1.45 (d, J = 6.5 Hz, 1H), 1.40–1.37 (m, 1H), 1.35 (d, J = 7.3 Hz, 1H), 1.25 (s, 4H), 1.00 (d, J = 6.6 Hz, 3H, H-18), 0.91 (d, J = 6.8 Hz, 3H, H-28), 0.84–0.80 (m, 12H, H-21, H-26, H-27, H-19); 13C NMR (150 MHz, CDCl3) δ 164.90, 161.69, 158.40, 137.60, 135.73, 135.20, 134.82, 132.34, 131.07, 128.20, 113.94, 81.58, 79.43, 71.83, 56.17, 51.54, 50.91, 44.55, 42.79, 39.75, 39.26, 36.92, 34.11, 33.07, 32.80, 28.64, 25.90, 23.36, 20.89, 20.62, 19.97, 19.65, 17.97, 17.59, 12.88; HRMS (ESI) m/z: calcd for C35H48N2O5S [M + Na]+: 631.3284, found: 631.3183.
  • Ergosterol peroxide-3-(4-((5-fluorobenzo[d]thiazol-2-yl)amino)-4-oxobut-2-enoate) (1c)
Yellow solid (79%). 1H NMR (600 MHz, CDCl3) δ 7.73 (dd, J = 8.7, 5.1 Hz, 1H, H-Ar), 7.53 (d, J = 9.5 Hz, 1H, H-Ar), 7.08 (t, J = 7.6 Hz, 1H, H-Ar), 6.52 (d, J = 13.1 Hz, 2H, H-3′, H-7), 6.36 (d, J = 13.2 Hz, 1H, H-2′), 6.21 (d, J = 8.4 Hz, 1H, H-6), 5.22 (dd, J = 15.1, 7.8 Hz, 2H), 5.17–5.13 (m, 1H), 2.21 (dd, J = 13.6, 5.0 Hz, 1H), 2.10–2.01 (m, 4H), 1.96 (d, J = 10.0 Hz, 1H), 1.85 (d, J = 6.8 Hz, 1H), 1.75 (s, 1H), 1.62 (s, 1H), 1.61–1.56 (m, 2H), 1.51 (d, J = 11.9 Hz, 2H), 1.48–1.45 (m, 1H), 1.41–1.38 (m, 1H), 1.35 (d, J = 8.4 Hz, 1H), 1.25 (s, 4H), 1.00 (d, J = 6.6 Hz, 3H, H-18), 0.91 (d, J = 6.7 Hz, 3H, H-28), 0.88 (s, 3H, H-21), 0.82 (d, J = 10.1 Hz, 9H, H-26, H-27, H-19); 13C NMR (150 MHz, CDCl3) δ 165.54, 162.84, 161.70, 159.63, 136.46, 135.19, 134.73, 132.36, 131.17, 128.81, 127.62, 122.09, 112.63, 107.80, 107.64, 81.60, 79.47, 72.48, 56.18, 51.54, 50.92, 44.57, 42.80, 39.75, 39.27, 36.95, 34.16, 33.08, 32.86, 28.65, 26.02, 23.38, 20.90, 20.63, 19.98, 19.65, 18.01, 17.60, 12.90; HRMS (ESI) m/z: calcd for C39H49FN2O5S [M + Na]+: 699.3346, found: 699.3239.
  • Ergosterol peroxide-3-(4-((6-fluorobenzo[d]thiazol-2-yl)amino)-4-oxobut-2-enoate) (1d)
Yellow solid (77%). 1H NMR (600 MHz, CDCl3) δ 7.79 (dd, J = 8.9, 4.7 Hz, 1H, H-Ar), 7.50 (dd, J = 8.0, 2.6 Hz, 1H, H-Ar), 7.17 (td, J = 8.9, 2.6 Hz, 1H, H-Ar), 6.54–6.50 (m, 2H, H-3′, H-7), 6.35 (d, J = 13.2 Hz, 1H, H-2′), 6.20 (d, J = 8.5 Hz, 1H, H-6), 5.22 (dd, J = 15.2, 7.6 Hz, 2H), 5.15 (dd, J = 15.3, 8.4 Hz, 1H), 2.23–2.19 (m, 1H), 2.09–2.01 (m, 4H), 1.96 (d, J = 10.5 Hz, 1H), 1.85 (d, J = 6.7 Hz, 1H), 1.74 (d, J = 3.7 Hz, 1H), 1.64 (d, J = 8.9 Hz, 1H), 1.60–1.55 (m, 2H), 1.50 (d, J = 11.4 Hz, 2H), 1.48–1.45 (m, 1H), 1.40–1.38 (m, 1H), 1.36 (d, J = 10.4 Hz, 1H), 1.25 (s, 4H), 1.00 (d, J = 6.7 Hz, 3H, H-18), 0.91 (d, J = 6.8 Hz, 3H, H-28), 0.88 (s, 3H, H-21), 0.84–0.81 (m, 9H, H-26, H-27, H-19); 13C NMR (150 MHz, CDCl3) δ 165.57, 161.70, 158.91, 157.18, 145.20, 136.61, 135.19, 134.73, 133.27, 132.36, 131.16, 128.70, 122.25, 114.63, 107.66, 81.61, 79.47, 72.45, 56.18, 51.54, 50.92, 44.57, 42.79, 39.75, 39.27, 36.95, 34.16, 33.07, 32.86, 28.65, 26.01, 23.38, 20.90, 20.63, 19.98, 19.65, 18.01, 17.60, 12.89; HRMS (ESI) m/z: calcd for C39H49FN2O5S [M + Na]+: 699.3346, found: 699.3235.
  • Ergosterol peroxide-3-(4-oxo-4-(phenylamino)but-2-enoate) (1e)
White solid (77%). 1H NMR (600 MHz, CDCl3) δ 10.92 (s, 1H, H-N), 7.66 (d, J = 7.7 Hz, 2H, H-Ar), 7.34 (d, J = 7.7 Hz, 2H, H-Ar), 7.12 (d, J = 7.2 Hz, 1H, H-Ar), 6.52 (d, J = 8.5 Hz, 1H, H-7), 6.42 (d, J = 13.2 Hz, 1H, H-3′), 6.21 (d, J = 8.3 Hz, 1H, H-6), 6.15 (d, J = 13.3 Hz, 1H, H-2′), 5.22 (dd, J = 15.2, 7.6 Hz, 1H), 5.17–5.11 (m, 2H), 2.22 (dd, J = 13.6, 5.3 Hz, 1H), 2.06–2.00 (m, 4H), 1.97–1.95 (m, 1H), 1.85 (d, J = 6.6 Hz, 1H), 1.74 (d, J = 3.7 Hz, 1H), 1.64 (d, J = 3.9 Hz, 1H), 1.60–1.56 (m, 2H), 1.53–1.49 (m, 2H), 1.48–1.45 (m, 1H), 1.41–1.38 (m, 1H), 1.36 (d, J = 10.6 Hz, 1H), 1.25 (s, 4H), 1.00 (d, J = 6.6 Hz, 3H, H-18), 0.91 (d, J = 6.8 Hz, 3H, H-28), 0.88 (s, 3H, H-21), 0.84–0.81 (m, 9H, H-26, H-27, H-19); 13C NMR (150 MHz, CDCl3) δ 165.96, 161.68, 140.41, 137.91, 135.18, 134.83, 132.36, 131.09, 129.02, 125.45, 124.64, 124.56, 120.14, 120.02, 81.72, 79.53, 71.68, 56.20, 51.59, 51.03, 44.58, 42.79, 39.74, 39.28, 36.96, 34.27, 33.07, 32.91, 28.65, 26.06, 23.39, 20.89, 20.61, 19.98, 19.66, 18.03, 17.60, 12.90; HRMS (ESI) m/z: calcd for C38H51NO5 [M + Na]+: 624.3767, found: 624.3665.
  • Ergosterol peroxide-3-(4-((4-fluorophenyl)amino)-4-oxobut-2-enoate) (1f)
White solid (80%). 1H NMR (600 MHz, CDCl3) δ 11.10 (s, 1H, H-N), 7.63 (dd, J = 8.9, 4.8 Hz, 2H, H-Ar), 7.02 (t, J = 8.6 Hz, 2H, H-Ar), 6.53 (d, J = 8.5 Hz, 1H, H-7), 6.41 (d, J = 13.5 Hz, 1H, H-3′), 6.22 (d, J = 8.5 Hz, 1H, H-6), 6.16 (d, J = 13.4 Hz, 1H, H-2′), 5.22 (dd, J = 15.3, 7.7 Hz, 1H), 5.17–5.11 (m, 2H), 2.23 (dd, J = 13.6, 7.1 Hz, 1H), 2.08–1.99 (m, 4H), 1.95 (s, 1H), 1.85 (d, J = 6.6 Hz, 1H), 1.77–1.75 (m, 1H), 1.66 (d, J = 13.9 Hz, 1H), 1.61–1.55 (m, 2H), 1.52 (t, J = 5.4 Hz, 2H), 1.49–1.45 (m, 1H), 1.41–1.38 (m, 1H), 1.36 (d, J = 12.7 Hz, 1H), 1.25 (d, J = 9.7 Hz, 4H), 1.00 (d, J = 6.6 Hz, 3H, H-18), 0.92–0.89 (m, 6H, H-28, H-21), 0.84–0.81 (m, 9H, H-26, H-27, H-19); 13C NMR (150 MHz, CDCl3) δ 166.11, 161.47, 160.30, 158.69, 140.57, 135.17, 134.77, 134.00, 132.37, 131.15, 125.53, 121.68, 121.63, 115.72, 115.57, 81.72, 79.56, 71.81, 56.20, 51.59, 51.03, 44.59, 42.79, 39.73, 39.27, 36.97, 34.27, 33.07, 32.91, 28.65, 26.07, 23.39, 20.89, 20.61, 19.97, 19.65, 18.04, 17.59, 12.89; HRMS (ESI) m/z: calcd for C38H50FNO5 [M + Na]+: 642.3673, found: 642.3572.
  • Ergosterol peroxide-3-(4-((4-methoxyphenyl)amino)-4-oxobut-2-enoate) (1g)
White solid (85%). 1H NMR (600 MHz, CDCl3) δ 10.90 (s, 1H, H-N), 7.58 (d, J = 9.0 Hz, 2H, H-Ar), 6.87 (d, J = 8.9 Hz, 2H, H-Ar), 6.52 (d, J = 8.5 Hz, 1H, H-7), 6.42 (d, J = 13.4 Hz, 1H, H-3′), 6.22 (d, J = 8.5 Hz, 1H, H-6), 6.14 (d, J = 13.4 Hz, 1H, H-2′), 5.24–5.20 (m, 1H), 5.16–5.11 (m, 2H), 3.80 (s, 3H, H-OCH3), 2.22 (d, J = 9.4 Hz, 1H), 2.07–2.01 (m, 4H), 1.95 (s, 1H), 1.85 (d, J = 6.5 Hz, 1H), 1.75 (d, J = 6.7 Hz, 1H), 1.65 (s, 1H), 1.58 (d, J = 10.9 Hz, 2H), 1.52 (t, J = 5.3 Hz, 2H), 1.48–1.45 (m, 1H), 1.42 (d, J = 6.9 Hz, 1H), 1.36 (d, J = 10.5 Hz, 1H), 1.25 (s, 4H), 1.00 (d, J = 6.6 Hz, 3H, H-18), 0.90 (d, J = 5.3 Hz, 6H, H-28, H-21), 0.84–0.81 (m, 9H, H-26, H-27, H-19); 13C NMR (150 MHz, CDCl3) δ 166.06, 161.30, 156.54, 140.78, 135.18, 134.82, 132.37, 131.11, 125.12, 121.56, 114.17, 81.73, 79.54, 71.64, 56.20, 55.49, 51.59, 51.02, 44.59, 42.78, 39.74, 39.28, 36.97, 34.27, 33.07, 32.92, 28.65, 26.07, 23.39, 20.88, 20.61, 19.97, 19.65, 18.04, 17.59, 12.90; HRMS (ESI) m/z: calcd for C39H53NO6 [M + Na]+: 654.3873, found: 654.3770.
  • Ergosterol peroxide-3-(4-(naphthalen-2-ylamino)-4-oxobut-2-enoate) (1h)
White solid (87%). 1H NMR (600 MHz, CDCl3) δ 11.33 (s, 1H, H-N), 8.40 (s, 1H, H-Ar), 7.84–7.77 (m, 3H, H-Ar), 7.58 (dd, J = 8.8, 2.2 Hz, 1H, H-Ar), 7.46 (t, J = 7.7 Hz, 1H, H-Ar), 7.40 (t, J = 7.5 Hz, 1H, H-Ar), 6.52 (d, J = 8.5 Hz, 1H, H-7), 6.47 (d, J = 13.4 Hz, 1H, H-3′), 6.22–6.18 (m, 2H, H-6, H-2′), 5.24–5.20 (m, 1H), 5.16 (td, J = 15.3, 14.4, 6.9 Hz, 2H), 2.27–2.24 (m, 1H), 2.08–2.00 (m, 4H), 1.96 (d, J = 9.5 Hz, 1H), 1.85 (d, J = 6.7 Hz, 1H), 1.77–1.74 (m, 1H), 1.68 (d, J = 8.7 Hz, 1H), 1.59 (t, J = 9.6 Hz, 2H), 1.54–1.50 (m, 2H), 1.48–1.45 (m, 1H), 1.41 (dd, J = 11.4, 5.3 Hz, 1H), 1.36 (d, J = 10.5 Hz, 1H), 1.25 (s, 4H), 1.00 (d, J = 6.6 Hz, 3H, H-18), 0.91 (d, J = 6.9 Hz, 3H, H-28), 0.89 (s, 3H, H-21), 0.84–0.81 (m, 9H, H-26, H-27, H-19); 13C NMR (150 MHz, CDCl3) δ 166.17, 161.69, 140.93, 135.39, 135.18, 134.80, 133.93, 132.37, 131.13, 130.86, 128.78, 127.89, 127.57, 126.42, 125.42, 125.06, 120.01, 116.84, 81.74, 79.55, 71.83, 56.20, 51.60, 51.05, 44.59, 42.79, 39.74, 39.28, 36.97, 34.30, 33.08, 32.93, 28.66, 26.10, 23.40, 20.89, 20.61, 19.98, 19.66, 18.03, 17.59, 12.91; HRMS (ESI) m/z: calcd for C42H53NO5 [M + Na]+: 674.3924, found: 674.3822.
  • Ergosterol peroxide-3-(4-((1,3,4-thiadiazol-2-yl)amino)-4-oxobutanoate) (2a)
White solid (83%). 1H NMR (600 MHz, CDCl3) δ 13.38 (s, 1H, H-N), 8.80 (s, 1H, S-CH), 6.49 (d, J = 8.5 Hz, 1H, H-7), 6.18 (d, J = 8.5 Hz, 1H, H-6), 5.21 (dd, J = 15.2, 7.7 Hz, 1H), 5.16–5.12 (m, 1H), 5.00 (dt, J = 11.6, 6.1 Hz, 1H), 3.07 (q, J = 6.3 Hz, 2H, H-3′), 2.79 (t, J = 6.5 Hz, 2H, H-2′), 2.09 (dd, J = 12.9, 6.1 Hz, 1H), 2.03–1.95 (m, 4H), 1.94 (s, 1H), 1.85 (d, J = 6.7 Hz, 1H), 1.76–1.72 (m, 1H), 1.68–1.65 (m, 1H), 1.57–1.53 (m, 2H), 1.48 (d, J = 7.3 Hz, 2H), 1.45 (d, J = 6.5 Hz, 1H), 1.40 (t, J = 6.1 Hz, 1H), 1.37–1.33 (m, 1H), 1.27–1.18 (m, 4H), 0.99 (d, J = 6.5 Hz, 3H, H-18), 0.90 (d, J = 6.8 Hz, 3H, H-28), 0.85–0.80 (m, 12H, H-21, H-26, H-27, H-19); 13C NMR (150 MHz, CDCl3) δ 171.18, 170.69, 160.45, 147.42, 135.22, 135.03, 132.31, 130.93, 81.70, 79.39, 70.07, 56.17, 51.59, 50.97, 44.55, 42.78, 39.74, 39.29, 36.92, 34.21, 33.07, 30.87, 29.16, 28.64, 26.17, 23.35, 20.90, 20.62, 19.96, 19.65, 18.01, 17.58, 12.88; HRMS (ESI) m/z: calcd for C34H49N3O5S [M + Na]+: 634.3393, found: 634.3295.
  • Ergosterol peroxide-3-(4-oxo-4-(thiazol-2-ylamino)butanoate) (2b)
White solid (80%). 1H NMR (600 MHz, CDCl3) δ 7.50 (d, J = 3.6 Hz, 1H, N-CH), 6.99 (d, J = 3.6 Hz, 1H, S-CH), 6.50 (d, J = 8.5 Hz, 1H, H-7), 6.20 (d, J = 8.5 Hz, 1H, H-6), 5.22 (dd, J = 15.3, 7.6 Hz, 1H), 5.14 (dd, J = 15.3, 8.4 Hz, 1H), 5.02 (tt, J = 11.2, 5.1 Hz, 1H), 2.88 (q, J = 6.6, 6.2 Hz, 2H, H-3′), 2.80–2.74 (m, 2H, H-2′), 2.11 (dd, J = 14.6, 4.4 Hz, 1H), 2.04–1.95 (m, 4H), 1.94 (s, 1H), 1.85 (q, J = 6.8 Hz, 1H), 1.77–1.71 (m, 1H), 1.70–1.66 (m, 1H), 1.58–1.54 (m, 2H), 1.49 (d, J = 9.4 Hz, 2H), 1.47–1.43 (m, 1H), 1.42–1.37 (m, 1H), 1.36–1.31 (m, 1H), 1.26–1.19 (m, 4H), 0.99 (d, J = 6.5 Hz, 3H, H-18), 0.91 (d, J = 6.8 Hz, 3H, H-28), 0.86 (s, 3H, H-21), 0.84–0.80 (m, 9H, H-26, H-27, H-19); 13C NMR (150 MHz, CDCl3) δ 171.36, 169.73, 159.99, 136.25, 135.22, 135.04, 132.32, 130.93, 113.54, 81.72, 79.40, 70.16, 56.17, 51.59, 50.99, 44.56, 42.78, 39.75, 39.30, 36.94, 34.23, 33.07, 30.83, 29.72, 29.14, 28.65, 26.20, 23.37, 20.90, 20.62, 19.97, 19.65, 18.03, 17.59, 12.88; HRMS (ESI) m/z: calcd for C35H50N2O5S [M + H]+: 633.3440, found: 633.3346.
  • Ergosterol peroxide-3-(4-((5-fluorobenzo[d]thiazol-2-yl)amino)-4-oxobutanoate) (2c)
Yellow solid (85%). 1H NMR (600 MHz, CDCl3) δ 7.73 (dd, J = 8.7, 5.1 Hz, 1H, H-Ar), 7.47 (d, J = 9.6 Hz, 1H, H-Ar), 7.07 (td, J = 8.8, 2.5 Hz, 1H, H-Ar), 6.50 (d, J = 8.5 Hz, 1H, H-7), 6.20 (d, J = 8.5 Hz, 1H, H-6), 5.22 (dd, J = 15.2, 7.7 Hz, 1H), 5.14 (dd, J = 15.3, 8.5 Hz, 1H), 5.03 (td, J = 11.4, 5.6 Hz, 1H), 2.82–2.76 (m, 4H, H-3′, H-2′), 2.16–2.12 (m, 1H), 2.00 (q, J = 13.0, 12.5 Hz, 4H), 1.94 (s, 1H), 1.85 (d, J = 6.8 Hz, 1H), 1.76–1.72 (m, 1H), 1.70–1.67 (m, 1H), 1.58–1.55 (m, 2H), 1.51–1.48 (m, 2H), 1.47–1.45 (m, 1H), 1.41–1.38 (m, 1H), 1.34 (d, J = 11.6 Hz, 1H), 1.26–1.21 (m, 4H), 0.99 (d, J = 6.6 Hz, 3H, H-18), 0.91 (d, J = 6.7 Hz, 3H, H-28), 0.87 (s, 3H, H-21), 0.84–0.80 (m, 9H, H-26, H-27, H-19); 13C NMR (150 MHz, CDCl3) δ 171.64, 170.30, 162.85, 161.25, 160.45, 135.21, 135.00, 132.33, 130.95, 127.38, 122.23, 112.34, 107.22, 81.74, 79.43, 70.53, 56.17, 51.58, 50.97, 44.56, 42.78, 39.75, 39.28, 36.94, 34.23, 33.07, 31.20, 29.72, 29.15, 28.65, 26.19, 23.37, 20.89, 20.62, 19.96, 19.65, 18.04, 17.58, 12.88; HRMS (ESI) m/z: calcd for C39H51FN2O5S [M + Na]+: 701.3503, found: 701.3399.
  • Ergosterol peroxide-3-(4-((6-fluorobenzo[d]thiazol-2-yl)amino)-4-oxobutanoate) (2d)
Yellow solid (78%). 1H NMR (600 MHz, CDCl3) δ 7.65 (dd, J = 8.9, 4.6 Hz, 1H, H-Ar), 7.42 (dd, J = 8.0, 2.6 Hz, 1H, H-Ar), 7.09 (td, J = 8.8, 2.6 Hz, 1H, H-Ar), 6.43 (d, J = 8.5 Hz, 1H, H-7), 6.13 (d, J = 8.5 Hz, 1H, H-6), 5.15 (dd, J = 15.2, 7.7 Hz, 1H), 5.07 (dd, J = 15.3, 8.4 Hz, 1H), 4.96 (dt, J = 11.6, 6.1 Hz, 1H), 2.74–2.68 (m, 4H, H-3′, H-2′), 2.06 (dd, J = 13.9, 5.2 Hz, 1H), 1.95 (d, J = 12.8 Hz, 3H), 1.88 (d, J = 11.2 Hz, 2H), 1.79–1.76 (m, 1H), 1.67 (d, J = 10.7 Hz, 1H), 1.62 (d, J = 14.0 Hz, 1H), 1.51–1.49 (m, 2H), 1.42 (t, J = 6.6 Hz, 2H), 1.40–1.38 (m, 1H), 1.34–1.31 (m, 1H), 1.28 (d, J = 11.4 Hz, 1H), 1.19–1.13 (m, 4H), 0.92 (d, J = 6.6 Hz, 3H, H-18), 0.84 (d, J = 6.8 Hz, 3H, H-28), 0.80 (s, 3H, H-21), 0.77–0.73 (m, 9H, H-26, H-27, H-19); 13C NMR (150 MHz, CDCl3) δ 170.63, 169.16, 159.43, 157.81, 156.79, 143.56, 134.17, 133.95, 131.30, 129.94, 120.75, 113.73, 106.80, 80.69, 77.99, 69.49, 55.13, 50.97, 49.94, 43.52, 41.74, 38.71, 38.24, 35.90, 33.19, 32.03, 30.15, 28.12, 27.61, 25.17, 22.33, 19.84, 19.58, 18.93, 18.61, 17.00, 16.54, 11.85; HRMS (ESI) m/z: calcd for C39H51FN2O5S [M + Na]+: 701.3503, found: 701.3402.
  • Ergosterol peroxide-3-(4-oxo-4-(phenylamino)-4-oxobutanoate) (2e)
White solid (83%). 1H NMR (600 MHz, CDCl3) δ 7.78 (s, 1H, H-N), 7.49 (d, J = 7.8 Hz, 2H, H-Ar), 7.30 (t, J = 7.8 Hz, 2H, H-Ar), 7.08 (t, J = 7.4 Hz, 1H, H-Ar), 6.50 (d, J = 8.5 Hz, 1H, H-7), 6.20 (d, J = 8.5 Hz, 1H, H-6), 5.22 (dd, J = 15.2, 7.6 Hz, 1H), 5.14 (dd, J = 15.3, 8.4 Hz, 1H), 5.02 (dq, J = 11.3, 5.6, 5.1 Hz, 1H), 2.74–2.67 (m, 2H, H-3′), 2.64 (t, J = 7.0 Hz, 2H), H-2′, 2.13 (dd, J = 14.6, 4.3 Hz, 1H), 2.05–1.94 (m, 4H), 1.91 (s, 1H), 1.85 (q, J = 6.8 Hz, 1H), 1.77–1.72 (m, 1H), 1.69 (d, J = 13.7 Hz, 1H), 1.58 (t, J = 7.1 Hz, 2H), 1.52–1.48 (m, 2H), 1.48–1.43 (m, 1H), 1.41–1.37 (m, 1H), 1.37–1.31 (m, 1H), 1.26–1.19 (m, 4H), 1.00 (d, J = 6.6 Hz, 3H, H-18), 0.91 (d, J = 6.9 Hz, 3H, H-28), 0.87 (s, 3H, H-21), 0.84–0.80 (m, 9H, H-26, H-27, H-19); 13C NMR (150 MHz, CDCl3) δ 172.44, 169.93, 137.92, 135.21, 135.06, 132.33, 130.92, 128.99, 124.20, 119.81, 81.78, 79.45, 70.21, 56.18, 51.61, 51.02, 44.57, 42.78, 39.75, 39.29, 36.95, 34.27, 33.11, 33.07, 32.31, 29.90, 28.65, 26.23, 23.37, 20.89, 20.63, 19.97, 19.65, 18.06, 17.59, 12.89; HRMS (ESI) m/z: calcd for C38H53NO5 [M + Na]+: 626.3924, found: 626.3826.
  • Ergosterol peroxide-3-(4-((4-fluorophenyl)amino)-4-oxobutanoate) (2f)
White solid (81%). 1H NMR (600 MHz, CDCl3) δ 7.85 (s, 1H, H-N), 7.45 (dd, J = 8.9, 4.8 Hz, 2H, H-Ar), 6.98 (t, J = 8.6 Hz, 2H, H-Ar), 6.51 (d, J = 8.5 Hz, 1H, H-7), 6.21 (d, J = 8.5 Hz, 1H, H-6), 5.22 (dd, J = 15.2, 7.6 Hz, 1H), 5.14 (dd, J = 15.2, 8.4 Hz, 1H), 5.03 (tt, J = 11.2, 5.1 Hz, 1H), 2.71 (q, J = 5.8, 5.3 Hz, 2H, H-3′), 2.63 (t, J = 6.5 Hz, 2H, H-2′), 2.13 (dd, J = 13.7, 5.2 Hz, 1H), 2.04–1.95 (m, 4H), 1.92 (d, J = 12.6 Hz, 1H), 1.85 (q, J = 6.8 Hz, 1H), 1.78–1.73 (m, 1H), 1.70 (d, J = 13.6 Hz, 1H), 1.60–1.56 (m, 2H), 1.50 (t, J = 7.6 Hz, 2H), 1.48–1.43 (m, 1H), 1.42–1.38 (m, 1H), 1.37–1.31 (m, 1H), 1.29–1.15 (m, 4H), 1.00 (d, J = 6.5 Hz, 3H, H-18), 0.91 (d, J = 6.8 Hz, 3H, H-28), 0.88 (s, 3H, H-21), 0.84–0.81 (m, 9H, H-26, H-27, H-19); 13C NMR (150 MHz, CDCl3) δ 172.56, 169.91, 158.50, 135.19, 135.01, 133.95, 132.34, 130.97, 121.65, 121.60, 115.65, 115.50, 81.78, 79.48, 70.27, 56.18, 51.61, 51.03, 44.57, 42.78, 39.74, 39.29, 36.95, 34.27, 33.12, 33.07, 32.11, 29.85, 28.65, 26.23, 23.37, 20.89, 20.62, 19.97, 19.65, 18.06, 17.59, 12.88; HRMS (ESI) m/z: calcd for C38H52FNO5 [M + Na]+: 644.3830, found: 644.3722.
  • Ergosterol peroxide-3-(4-((4-methoxyphenyl)amino)-4-oxobutanoate) (2g)
White solid (87%). 1H NMR (600 MHz, CDCl3) δ 7.68 (s, 1H, H-N), 7.39 (d, J = 9.0 Hz, 2H, H-Ar), 6.83 (d, J = 8.9 Hz, 2H, H-Ar), 6.50 (d, J = 8.5 Hz, 1H, H-7), 6.21 (d, J = 8.4 Hz, 1H, H-6), 5.22 (dd, J = 15.2, 7.7 Hz, 1H), 5.14 (dd, J = 15.3, 8.4 Hz, 1H), 5.02 (tt, J = 11.2, 5.1 Hz, 1H), 3.78 (s, 3H, H-OCH3), 2.73–2.67 (m, 2H, H-3′), 2.62 (d, J = 6.6 Hz, 2H, H-2′), 2.15–2.11 (m, 1H), 2.04–1.94 (m, 4H), 1.91 (d, J = 3.2 Hz, 1H), 1.85 (q, J = 6.8 Hz, 1H), 1.77–1.72 (m, 1H), 1.71–1.67 (m, 1H), 1.57 (t, J = 9.2 Hz, 2H), 1.51–1.48 (m, 2H), 1.46 (dd, J = 13.2, 6.6 Hz, 1H), 1.41–1.37 (m, 1H), 1.37–1.31 (m, 1H), 1.29–1.14 (m, 4H), 1.00 (d, J = 6.6 Hz, 3H, H-18), 0.91 (d, J = 6.8 Hz, 3H, H-28), 0.88 (s, 3H, H-21), 0.84–0.80 (m, 9H, H-26, H-27, H-19); 13C NMR (150 MHz, CDCl3) δ 172.44, 169.73, 156.34, 135.21, 135.07, 132.33, 131.06, 130.91, 121.71, 114.12, 81.79, 79.44, 70.14, 56.18, 55.49, 51.62, 51.03, 44.57, 42.78, 39.75, 39.30, 36.95, 34.27, 33.12, 33.07, 32.07, 29.94, 28.65, 26.23, 23.37, 20.89, 20.63, 19.97, 19.65, 18.06, 17.59, 12.88; HRMS (ESI) m/z: calcd for C39H55NO6 [M + Na]+: 656.4029, found: 656.3922.
  • Ergosterol peroxide-3-(4-(naphthalen-2-ylamino)-4-oxobutanoate) (2h)
White solid (84%). 1H NMR (600 MHz, CDCl3) δ 8.19 (s, 1H, H-N), 7.96 (s, 1H, H-Ar), 7.76 (t, J = 7.1 Hz, 3H, H-Ar), 7.43 (t, J = 7.7 Hz, 2H, H-Ar), 7.38 (t, J = 7.4 Hz, 1H, H-Ar), 6.49 (d, J = 8.5 Hz, 1H, H-7), 6.19 (d, J = 8.5 Hz, 1H, H-6), 5.22 (dd, J = 15.3, 7.6 Hz, 1H), 5.14 (dd, J = 15.3, 8.4 Hz, 1H), 5.04 (dq, J = 11.3, 5.7, 5.2 Hz, 1H), 2.75 (q, J = 6.1, 5.4 Hz, 2H, H-3′), 2.70 (d, J = 7.0 Hz, 2H, H-2′), 2.15 (dd, J = 13.7, 3.4 Hz, 1H), 1.99 (ddd, J = 22.2, 16.8, 11.7 Hz, 4H), 1.93 (s, 1H), 1.85 (q, J = 6.8 Hz, 1H), 1.74 (dt, J = 13.4, 3.9 Hz, 1H), 1.70–1.67 (m, 1H), 1.57 (dd, J = 13.2, 10.2 Hz, 2H), 1.51–1.48 (m, 2H), 1.45 (dd, J = 13.2, 6.6 Hz, 1H), 1.41–1.37 (m, 1H), 1.36–1.32 (m, 1H), 1.27–1.17 (m, 4H), 0.99 (d, J = 6.6 Hz, 3H, H-18), 0.91 (d, J = 6.8 Hz, 3H, H-28), 0.87 (s, 3H, H-21), 0.84–0.80 (m, 9H, H-26, H-27, H-19); 13C NMR (150 MHz, CDCl3) δ 172.53, 170.13, 135.36, 135.21, 135.04, 133.86, 132.33, 130.93, 130.61, 128.75, 127.70, 127.54, 126.44, 124.92, 119.86, 116.51, 81.80, 79.46, 70.30, 56.17, 51.61, 51.02, 44.57, 42.78, 39.75, 39.29, 36.95, 34.27, 33.12, 33.07, 32.41, 29.93, 28.65, 26.24, 23.37, 20.89, 20.63, 19.97, 19.65, 18.05, 17.59, 12.88; HRMS (ESI) m/z: calcd for C42H55NO5 [M + Na]+: 676.4080, found: 676.3977.
  • Ergosterol peroxide-3-(5-((1,3,4-thiadiazol-2-yl)amino)-5-oxopentanoate) (3a)
White solid (78%). 1H NMR (600 MHz, CDCl3) δ 13.39 (s, 1H, H-N), 8.81 (s, 1H. S-CH), 6.50 (d, J = 8.5 Hz, 1H, H-7), 6.20 (d, J = 8.5 Hz, 1H, H-6), 5.22 (dd, J = 15.2, 7.6 Hz, 1H), 5.14 (dd, J = 15.3, 8.4 Hz, 1H), 5.00 (dt, J = 11.7, 6.1 Hz, 1H), 2.84 (t, J = 6.8 Hz, 2H, H-4′), 2.44 (t, J = 7.4 Hz, 2H, H-3′), 2.13 (q, J = 7.2 Hz, 3H, H-2′), 2.00 (t, J = 12.8 Hz, 4H), 1.94 (s, 1H), 1.85 (d, J = 6.7 Hz, 1H), 1.75 (d, J = 9.1 Hz, 1H), 1.68 (d, J = 13.6 Hz, 1H), 1.58–1.54 (m, 2H), 1.50 (d, J = 8.6 Hz, 2H), 1.47–1.45 (m, 1H), 1.42–1.39 (m, 1H), 1.35 (d, J = 9.5 Hz, 1H), 1.26–1.21 (m, 4H), 1.00 (d, J = 6.6 Hz, 3H, H-18), 0.91 (d, J = 6.8 Hz, 3H, H-28), 0.88 (s, 3H, H-21), 0.84–0.80 (m, 9H, H-26, H-27, H-19); 13C NMR (150 MHz, CDCl3) δ 171.87, 171.32, 160.48, 147.45, 135.21, 135.08, 132.32, 130.94, 81.77, 79.41, 69.60, 56.17, 51.60, 51.00, 44.57, 42.78, 39.75, 39.30, 36.95, 35.10, 34.28, 33.62, 33.15, 33.07, 29.72, 28.65, 26.28, 23.37, 20.89, 20.64, 19.97, 19.65, 18.09, 17.59, 12.88; HRMS (ESI) m/z: calcd for C35H51N3O5S [M + Na]+: 648.3549, found: 648.3449.
  • Ergosterol peroxide-3-(5-oxo-5-(thiazol-2-ylamino)pentanoate) (3b)
White solid (88%). 1H NMR (600 MHz, CDCl3) δ 7.47 (d, J = 3.7 Hz, 1H, H-N), 7.01 (d, J = 3.6 Hz, 1H, H-S), 6.50 (d, J = 8.5 Hz, 1H, H-7), 6.20 (d, J = 8.5 Hz, 1H, H-6), 5.22 (dd, J = 15.2, 7.7 Hz, 1H), 5.14 (dd, J = 15.3, 8.4 Hz, 1H), 5.00 (tt, J = 11.2, 5.1 Hz, 1H), 2.65 (t, J = 7.2 Hz, 2H, H-4′), 2.42 (t, J = 7.1 Hz, 2H, H-3′), 2.10 (q, J = 7.4 Hz, 3H, H-2′), 2.03–1.94 (m, 4H), 1.90 (d, J = 9.4 Hz, 1H), 1.85 (q, J = 6.7 Hz, 1H), 1.76 (td, J = 9.5, 4.5 Hz, 1H), 1.69–1.66 (m, 1H), 1.57 (dd, J = 19.0, 8.0 Hz, 2H), 1.50 (t, J = 7.6 Hz, 2H), 1.47–1.44 (m, 1H), 1.40–1.37 (m, 1H), 1.35 (d, J = 10.4 Hz, 1H), 1.27 (s, 4H), 1.00 (d, J = 6.6 Hz, 3H, H-18), 0.88 (d, J = 3.8 Hz, 9H, H-28, H-21, H-26), 0.83–0.81 (m, 6H, H-27, H-19); 13C NMR (150 MHz, CDCl3) δ 172.01, 170.49, 160.03, 136.22, 135.21, 135.05, 132.32, 130.93, 113.60, 81.74, 79.41, 69.65, 56.17, 51.61, 51.02, 44.56, 42.78, 39.75, 39.30, 36.94, 34.82, 34.28, 33.41, 33.17, 33.07, 29.72, 28.65, 26.30, 23.37, 20.88, 20.62, 19.96, 19.65, 18.06, 17.58, 12.88; HRMS (ESI) m/z: calcd for C36H52N2O5S [M + Na]+: 647.3597, found: 647.3501.
  • Ergosterol peroxide-3-(5-((5-fluorobenzo[d]thiazol-2-yl)amino)-5-oxopentanoate) (3c)
Yellow solid (86%). 1H NMR (600 MHz, CDCl3) δ 7.74 (dd, J = 8.8, 5.1 Hz, 1H, H-Ar), 7.44 (d, J = 7.1 Hz, 1H, H-Ar), 7.08 (td, J = 8.8, 2.4 Hz, 1H, H-Ar), 6.50 (d, J = 8.5 Hz, 1H, H-7), 6.21 (d, J = 8.5 Hz, 1H, H-6), 5.22 (dd, J = 15.2, 7.6 Hz, 1H), 5.14 (dd, J = 15.3, 8.4 Hz, 1H), 5.00 (dt, J = 11.6, 6.2 Hz, 1H), 2.59 (t, J = 7.3 Hz, 2H, H-4′), 2.40 (t, J = 7.1 Hz, 2H, H-3′), 2.12 (d, J = 8.6 Hz, 1H), 2.06 (t, J = 7.2 Hz, 2H, H-2′), 2.00 (t, J = 13.0 Hz, 4H), 1.93 (d, J = 9.5 Hz, 1H), 1.87–1.83 (m, 1H), 1.75 (d, J = 9.1 Hz, 1H), 1.69 (d, J = 13.5 Hz, 1H), 1.59–1.55 (m, 2H), 1.51 (d, J = 6.7 Hz, 2H), 1.48–1.45 (m, 1H), 1.39 (d, J = 5.3 Hz, 1H), 1.35 (d, J = 11.9 Hz, 1H), 1.25 (s, 4H), 1.00 (d, J = 6.6 Hz, 3H, H-18), 0.89 (d, J = 11.5 Hz, 6H, H-28, H-21), 0.84–0.81 (m, 9H, H-26, H-27, H-19); 13C NMR (150 MHz, CDCl3) δ 172.00, 170.90, 160.58, 135.21, 135.04, 132.33, 130.96, 122.33, 122.27, 112.57, 112.41, 107.21, 107.05, 81.75, 79.44, 69.85, 56.17, 51.59, 50.99, 44.57, 42.78, 39.75, 39.29, 36.95, 35.22, 34.27, 33.23, 33.15, 33.07, 29.72, 28.65, 26.28, 23.38, 20.89, 20.63, 19.97, 19.65, 18.08, 17.59, 12.89; HRMS (ESI) m/z: calcd for C40H53FN2O5S [M + Na]+: 715.3659, found: 715.3562.
  • Ergosterol peroxide-3-(5-((6-fluorobenzo[d]thiazol-2-yl)amino)-5-oxopentanoate) (3d)
Yellow solid (82%). 1H NMR (600 MHz, CDCl3) δ 7.69 (dd, J = 8.9, 4.6 Hz, 1H, H-Ar), 7.51 (dd, J = 8.0, 2.6 Hz, 1H, H-Ar), 7.18 (td, J = 8.9, 2.6 Hz, 1H, H-Ar), 6.51 (d, J = 8.5 Hz, 1H, H-7), 6.22 (d, J = 8.5 Hz, 1H, H-6), 5.22 (dd, J = 15.2, 7.6 Hz, 1H), 5.14 (dd, J = 15.3, 8.4 Hz, 1H), 5.00 (dt, J = 11.7, 6.1 Hz, 1H), 2.59 (t, J = 7.3 Hz, 2H, H-4′), 2.39 (t, J = 7.1 Hz, 2H, H-3′), 2.14–2.10 (m, 1H), 2.06 (t, J = 7.2 Hz, 2H, H-2′), 2.02–1.95 (m, 4H), 1.92 (d, J = 9.1 Hz, 1H), 1.85 (q, J = 6.7 Hz, 1H), 1.75 (d, J = 9.1 Hz, 1H), 1.69 (d, J = 13.6 Hz, 1H), 1.59–1.55 (m, 2H), 1.51 (d, J = 7.4 Hz, 2H), 1.48–1.45 (m, 1H), 1.41–1.38 (m, 1H), 1.35 (d, J = 11.8 Hz, 1H), 1.25 (s, 4H), 1.00 (d, J = 6.6 Hz, 3H, H-18), 0.91–0.88 (m, 6H, H-28, H-21), 0.84–0.81 (m, 9H, H-26, H-27, H-19); 13C NMR (150 MHz, CDCl3) δ 172.00, 170.87, 158.89, 158.23, 144.00, 135.21, 135.03, 132.78, 132.33, 130.97, 121.44, 114.91, 107.99, 81.75, 79.43, 69.85, 56.18, 51.60, 51.00, 44.57, 42.78, 39.75, 39.29, 36.95, 35.19, 34.27, 33.22, 33.17, 33.07, 29.72, 28.65, 26.30, 23.38, 20.89, 20.63, 19.97, 19.65, 18.08, 17.59, 12.89; HRMS (ESI) m/z: calcd for C40H53FN2O5S [M + Na]+: 715.3659, found: 715.3560.
  • Ergosterol peroxide-3-(5-oxo-5-(phenylamino)pentanoate) (3e)
White solid (81%). 1H NMR (600 MHz, CDCl3) δ 7.56–7.50 (m, 3H, H-N, H-Ar), 7.31 (t, J = 7.7 Hz, 2H, H-Ar), 7.09 (t, J = 7.4 Hz, 1H, H-Ar), 6.51 (d, J = 8.5 Hz, 1H, H-7), 6.22 (d, J = 8.5 Hz, 1H, H-6), 5.22 (dd, J = 15.2, 7.6 Hz, 1H), 5.14 (dd, J = 15.3, 8.4 Hz, 1H), 5.02 (dt, J = 11.8, 6.2 Hz, 1H), 2.41 (dt, J = 14.1, 7.2 Hz, 4H, H-4′, H-3′), 2.14–2.11 (m, 1H), 2.02 (dd, J = 13.5, 5.7 Hz, 6H, H-2′), 1.95 (s, 1H), 1.85 (d, J = 6.7 Hz, 1H), 1.75 (d, J = 9.1 Hz, 1H), 1.70 (d, J = 13.7 Hz, 1H), 1.57 (d, J = 17.8 Hz, 2H), 1.51 (d, J = 8.0 Hz, 2H), 1.48–1.45 (m, 1H), 1.42–1.38 (m, 1H), 1.35 (d, J = 11.8 Hz, 1H), 1.26–1.21 (m, 4H), 1.00 (d, J = 6.6 Hz, 3H, H-18), 0.92–0.89 (m, 6H, H-28, H-21), 0.84–0.81 (m, 9H, H-26, H-27, H-19); 13C NMR (150 MHz, CDCl3) δ 172.52, 170.62, 137.96, 135.21, 135.05, 132.34, 130.95, 129.00, 124.21, 119.77, 81.78, 79.46, 69.69, 56.18, 51.62, 51.03, 44.57, 42.78, 39.75, 39.30, 36.97, 36.43, 34.29, 33.39, 33.19, 33.07, 29.72, 28.65, 26.31, 23.38, 20.89, 20.63, 19.97, 19.65, 18.09, 17.59, 12.89; HRMS (ESI) m/z: calcd for C39H55NO5 [M + Na]+: 640.4080, found: 640.3985.
  • Ergosterol peroxide-3-(5-((4-fluorophenyl)amino)-5-oxopentanoate) (3f)
White solid (84%). 1H NMR (600 MHz, CDCl3) δ 7.65 (s, 1H, H-N), 7.48 (dd, J = 8.9, 4.8 Hz, 2H, H-Ar), 7.00 (t, J = 8.5 Hz, 2H, H-Ar), 6.51 (d, J = 8.5 Hz, 1H, H-7), 6.22 (d, J = 8.5 Hz, 1H, H-6), 5.22 (dd, J = 15.2, 7.6 Hz, 1H), 5.14 (dd, J = 15.3, 8.4 Hz, 1H), 5.01 (tt, J = 11.3, 5.1 Hz, 1H), 2.43–2.38 (m, 4H, H-4′, H-3′), 2.14–2.10 (m, 1H), 2.05–1.97 (m, 6H, H-2′), 1.95 (s, 1H), 1.85 (q, J = 6.8 Hz, 1H), 1.77–1.73 (m, 1H), 1.72–1.69 (m, 1H), 1.57 (d, J = 10.6 Hz, 2H), 1.51 (d, J = 9.3 Hz, 2H), 1.48–1.45 (m, 1H), 1.39 (d, J = 5.2 Hz, 1H), 1.35 (d, J = 12.9 Hz, 1H), 1.26–1.21 (m, 4H), 1.00 (d, J = 6.6 Hz, 3H, H-18), 0.92–0.89 (m, 6H, H-28, H-21), 0.83 (dd, J = 8.8, 5.6 Hz, 9H, H-26, H-27, H-19); 13C NMR (150 MHz, CDCl3) δ 172.59, 170.64, 160.10, 135.19, 135.02, 134.00, 132.35, 130.98, 121.64, 121.58, 115.66, 115.51, 81.79, 79.48, 69.74, 56.18, 51.61, 51.03, 44.57, 42.78, 39.74, 39.29, 36.97, 36.24, 34.29, 33.38, 33.18, 33.07, 29.72, 28.65, 26.31, 23.37, 20.89, 20.82, 19.97, 19.65, 18.08, 17.59, 12.88; HRMS (ESI) m/z: calcd for C39H54FNO5 [M + Na]+: 658.3986, found: 658.3886.
  • Ergosterol peroxide-3-(5-((4-(dimethylamino)phenyl)amino)-5-oxopentanoate) (3g)
White solid (78%). 1H NMR (600 MHz, CDCl3) δ 7.47 (s, 1H, H-N), 7.41 (d, J = 8.5 Hz, 2H, H-Ar), 6.84 (d, J = 8.8 Hz, 2H, H-Ar), 6.51 (d, J = 8.5 Hz, 1H, H-7), 6.22 (d, J = 8.5 Hz, 1H, H-6), 5.22 (dd, J = 15.2, 7.6 Hz, 1H), 5.14 (dd, J = 15.3, 8.4 Hz, 1H), 5.01 (dq, J = 11.8, 6.1, 5.7 Hz, 1H), 3.78 (s, 3H, H-OCH3), 2.39 (t, J = 7.1 Hz, 4H, H-4′, H-3′), 2.12 (dd, J = 14.3, 5.0 Hz, 1H), 2.05–1.97 (m, 6H, H-2′), 1.95 (s, 1H), 1.87–1.83 (m, 1H), 1.75 (d, J = 9.1 Hz, 1H), 1.70 (d, J = 13.8 Hz, 1H), 1.57 (d, J = 11.2 Hz, 2H), 1.51 (d, J = 9.2 Hz, 2H), 1.48–1.44 (m, 1H), 1.40 (t, J = 5.8 Hz, 1H), 1.35 (d, J = 12.9 Hz, 1H), 1.26–1.21 (m, 4H), 1.00 (d, J = 6.6 Hz, 3H, H-18), 0.92–0.88 (m, 6H, H-28, H-21), 0.84–0.81 (m, 9H, H-26, H-27, H-19); 13C NMR (150 MHz, CDCl3) δ 172.51, 170.43, 156.35, 135.21, 135.06, 132.33, 131.07, 130.94, 121.70, 114.12, 81.78, 79.45, 69.65, 56.18, 55.49, 51.61, 51.03, 44.57, 42.78, 39.75, 39.30, 36.96, 36.24, 34.29, 33.44, 33.19, 33.07, 29.72, 28.65, 26.31, 23.37, 20.92, 20.89, 19.97, 19.65, 18.08, 17.59, 12.88; HRMS (ESI) m/z: calcd for C40H57NO6 [M + Na]+: 670.4186, found: 670.4091.
  • Ergosterol peroxide-3-(5-(naphthalen-2-ylamino)-5-oxopentanoate) (3h)
White solid (82%). 1H NMR (600 MHz, CDCl3) δ 8.23 (s, 1H, H-N), 7.78–7.75 (m, 4H, H-Ar), 7.44 (t, J = 9.7 Hz, 2H, H-Ar), 7.39 (d, J = 7.6 Hz, 1H, H-Ar), 6.50 (d, J = 8.5 Hz, 1H, H-7), 6.21 (d, J = 8.5 Hz, 1H, H-6), 5.23–5.20 (m, 1H), 5.16–5.12 (m, 1H), 5.03 (dt, J = 11.7, 6.1 Hz, 1H), 2.47 (d, J = 7.3 Hz, 2H, H-4′), 2.43 (t, J = 7.0 Hz, 2H, H-3′), 2.13 (d, J = 8.6 Hz, 1H), 2.08–2.00 (m, 6H, H-2′), 1.94 (s, 1H), 1.85 (d, J = 6.8 Hz, 1H), 1.76–1.73 (m, 1H), 1.71 (s, 1H), 1.57 (d, J = 12.0 Hz, 2H), 1.50 (d, J = 6.4 Hz, 2H), 1.47–1.45 (m, 1H), 1.40 (dd, J = 11.6, 5.3 Hz, 1H), 1.35 (d, J = 12.1 Hz, 1H), 1.26–1.22 (m, 4H), 1.00 (d, J = 6.6 Hz, 3H, H-18), 0.91 (d, J = 6.8 Hz, 3H, H-28), 0.88 (s, 3H, H-21), 0.84–0.81 (m, 9H, H-26, H-27, H-19); 13C NMR (150 MHz, CDCl3) δ 172.57, 170.84, 135.41, 135.21, 135.05, 133.88, 132.34, 130.96, 130.61, 128.76, 127.70, 127.56, 126.48, 124.95, 119.84, 116.49, 81.79, 79.46, 69.73, 56.18, 51.61, 51.03, 44.57, 42.79, 39.75, 39.29, 36.97, 36.48, 34.30, 33.41, 33.20, 33.07, 29.72, 28.65, 26.33, 23.37, 20.89, 19.98, 19.66, 18.08, 17.59, 12.89; HRMS (ESI) m/z: calcd for C43H57NO5 [M + Na]+: 690.4237, found: 690.4139.
  • Ergosterol peroxide-3-(2-((1,3,4-thiadiazol-2-yl)carbamoyl)benzoate) (4a)
White solid (77%). 1H NMR (600 MHz, CDCl3) δ 8.77 (s, 1H, H-N), 8.01 (d, J = 7.6 Hz, 1H, S-CH), 7.64 (ddd, J = 29.0, 15.0, 7.4 Hz, 4H, H-Ar), 6.47 (d, J = 8.5 Hz, 1H, H-7), 6.10 (d, J = 8.5 Hz, 1H, H-6), 5.21 (d, J = 4.6 Hz, 1H), 5.16–5.12 (m, 2H), 2.12 (d, J = 8.3 Hz, 1H), 2.00–1.94 (m, 4H), 1.92 (s, 1H), 1.85 (s, 1H), 1.74 (d, J = 8.4 Hz, 1H), 1.69 (dd, J = 13.5, 3.8 Hz, 1H), 1.56 (s, 2H), 1.46 (s, 2H), 1.41–1.39 (m, 1H), 1.37 (s, 1H), 1.33 (s, 1H), 1.25 (s, 4H), 0.99 (s, 3H, H-18), 0.91 (d, J = 6.9 Hz, 3H, H-28), 0.83–0.80 (m, 9H, H-21, H-26, H-27), 0.72 (s, 3H, H-19); 13C NMR (150 MHz, CDCl3) δ 167.12, 165.13, 159.74, 147.49, 135.43, 135.22, 134.93, 132.32, 131.03, 130.94, 130.76, 130.70, 129.98, 128.07, 81.60, 79.39, 71.23, 56.19, 51.68, 51.07, 44.54, 42.78, 39.74, 39.27, 36.96, 34.11, 33.07, 32.81, 28.67, 25.91, 23.40, 20.89, 20.61, 19.96, 19.65, 18.19, 17.59, 12.87; HRMS (ESI) m/z: calcd for C38H49N3O5S [M + Na]+: 682.3393, found: 682.3285.
  • Ergosterol peroxide-3-(2-oxo-5-((thiazol-2-yl)carbamoyl)benzoate) (4b)
White solid (86%). 1H NMR (600 MHz, CDCl3) δ 8.13–8.11 (m, 1H, N-CH), 7.65 (td, J = 4.5, 2.0 Hz, 2H, H-Ar), 7.59–7.57 (m, 1H, S-CH), 6.77 (d, J = 3.7 Hz, 1H, H-Ar), 6.44 (d, J = 8.5 Hz, 1H, H-7), 6.09 (d, J = 3.6 Hz, 1H, H-Ar), 6.02 (d, J = 8.5 Hz, 1H, H-6), 5.21 (dd, J = 15.3, 7.7 Hz, 1H), 5.16–5.09 (m, 2H), 2.00 (dd, J = 13.2, 4.9 Hz, 2H), 1.92 (dt, J = 13.5, 3.4 Hz, 2H), 1.84 (q, J = 6.8 Hz, 2H), 1.78 (d, J = 12.0 Hz, 1H), 1.75–1.72 (m, 1H), 1.58 (s, 1H), 1.56–1.51 (m, 2H), 1.46–1.43 (m, 2H), 1.36 (d, J = 6.8 Hz, 1H), 1.33 (s, 1H), 1.25 (s, 1H), 1.24–1.09 (m, 4H), 0.99 (d, J = 6.6 Hz, 3H, H-18), 0.90 (d, J = 6.8 Hz, 3H, H-28), 0.83–0.78 (m, 9H, H-21, H-26, H-27), 0.61 (s, 3H, H-19); 13C NMR (150 MHz, CDCl3) δ 167.49, 164.50, 160.02, 136.59, 136.07, 135.21, 134.97, 132.53, 132.32, 130.86, 130.84, 130.36, 129.11, 128.11, 113.07, 81.54, 79.33, 71.06, 56.15, 51.54, 50.89, 44.53, 42.78, 39.74, 39.26, 36.84, 34.09, 33.07, 32.65, 28.63, 25.75, 23.32, 20.89, 20.61, 19.97, 19.65, 17.75, 17.59, 12.87; HRMS (ESI) m/z: calcd for C39H50N2O5S [M + Na]+: 681.3440, found: 681.3334.
  • Ergosterol peroxide-3-(2-((5-fluorobenzo[d]thiazol-2-yl)carbamoyl)benzoate) (4c)
Yellow solid (82%). 1H NMR (600 MHz, CDCl3) δ 7.91–7.89 (m, 1H, H-Ar), 7.70 (dd, J = 8.7, 5.1 Hz, 1H, H-Ar), 7.55–7.53 (m, 1H, H-Ar), 7.49–7.46 (m, 2H, H-Ar), 7.00 (t, J = 7.5 Hz, 1H, H-Ar), 6.50 (d, J = 9.4 Hz, 1H, H-Ar), 6.42 (d, J = 8.5 Hz, 1H, H-7), 5.99 (d, J = 8.5 Hz, 1H, H-6), 5.22–5.18 (m, 1H), 5.12 (dd, J = 15.3, 8.8 Hz, 2H), 2.13 (dd, J = 13.8, 5.1 Hz, 1H), 1.99–1.94 (m, 3H), 1.93–1.89 (m, 2H), 1.84 (d, J = 6.8 Hz, 1H), 1.72 (d, J = 9.5 Hz, 1H), 1.60 (d, J = 14.4 Hz, 1H), 1.51 (d, J = 7.1 Hz, 2H), 1.43 (d, J = 9.1 Hz, 2H), 1.34 (d, J = 8.7 Hz, 1H), 1.26 (s, 2H), 1.20–1.10 (m, 4H), 0.97 (d, J = 6.5 Hz, 3H, H-18), 0.90 (d, J = 6.8 Hz, 3H, H-28), 0.83–0.80 (m, 6H, H-21, H-26), 0.77 (s, 3H, H-27), 0.66 (s, 3H, H-19); 13C NMR (150 MHz, CDCl3) δ 167.87, 164.92, 161.64, 135.52, 135.21, 134.86, 132.48, 132.30, 130.88, 130.70, 129.55, 127.72, 126.72, 121.94, 121.88, 112.48, 112.32, 106.67, 106.50, 81.59, 79.33, 71.42, 56.14, 51.53, 50.89, 44.52, 42.77, 39.73, 39.23, 36.87, 34.12, 33.07, 32.73, 28.62, 25.96, 23.31, 20.87, 20.59, 19.96, 19.65, 17.73, 17.58, 12.86; HRMS (ESI) m/z: calcd for C43H51FN2O5S [M + H]+: 727.3503, found: 727.3580.
  • Ergosterol peroxide-3-(2-((6-fluorobenzo[d]thiazol-2-yl)carbamoyl)benzoate) (4d)
Yellow solid (80%). 1H NMR (600 MHz, CDCl3) δ 7.96–7.92 (m, 1H, N-H), 7.58–7.56 (m, 1H, H-Ar), 7.53–7.48 (m, 4H, H-Ar), 7.14 (dd, J = 8.9, 4.5 Hz, 1H, H-Ar), 7.00–6.98 (m, 1H, H-Ar), 6.43 (d, J = 8.5 Hz, 1H, H-7), 5.99 (d, J = 8.5 Hz, 1H, H-6), 5.22–5.19 (m, 1H), 5.17–5.10 (m, 2H), 2.15–2.12 (m, 1H), 1.98 (dd, J = 15.6, 7.8 Hz, 4H), 1.92 (s, 1H), 1.84 (d, J = 6.8 Hz, 1H), 1.73 (d, J = 8.8 Hz, 1H), 1.62 (d, J = 3.7 Hz, 1H), 1.59 (d, J = 12.7 Hz, 2H), 1.53 (d, J = 11.7 Hz, 2H), 1.47 (d, J = 6.3 Hz, 1H), 1.43 (s, 1H), 1.41 (s, 1H), 1.26 (s, 4H), 0.98 (d, J = 6.6 Hz, 3H, H-18), 0.90 (d, J = 6.9 Hz, 3H, H-28), 0.83–0.80 (m, 6H, H-21, H-26,), 0.77 (s, 3H, H-27), 0.64 (s, 3H, H-19); 13C NMR (150 MHz, CDCl3) δ 167.61, 165.00, 160.43, 158.80, 135.35, 135.20, 134.83, 132.53, 132.39, 132.32, 130.91, 130.76, 129.59, 127.80, 121.27, 114.76, 114.60, 107.67, 107.50, 81.61, 79.36, 71.46, 56.15, 51.54, 50.90, 44.53, 42.78, 39.73, 39.24, 36.87, 34.13, 33.07, 32.74, 28.62, 25.94, 23.32, 20.87, 20.59, 19.96, 19.65, 17.69, 17.58, 12.86; HRMS (ESI) m/z: calcd for C43H51FN2O5S [M + H]+: 727.3503, found: 727.3607.
  • Ergosterol peroxide-3-(2-oxo-5-((phenyl)carbamoyl)benzoate) (4e)
White solid (82%). 1H NMR (600 MHz, CDCl3) δ 7.97 (d, J = 7.9 Hz, 1H, H-N), 7.74 (s, 1H, H-Ar), 7.65 (d, J = 8.0 Hz, 2H, H-Ar), 7.58–7.50 (m, 3H, H-Ar), 7.35 (t, J = 7.9 Hz, 2H, H-Ar), 7.13 (t, J = 7.4 Hz, 1H, H-Ar), 6.42 (d, J = 8.5 Hz, 1H, H-7), 5.95 (d, J = 8.5 Hz, 1H, H-6), 5.21 (dd, J = 15.2, 7.6 Hz, 1H), 5.13 (dd, J = 15.5, 8.4 Hz, 2H), 2.00 (s, 1H), 1.99–1.91 (m, 4H), 1.85 (d, J = 6.2 Hz, 1H), 1.83–1.80 (m, 1H), 1.72 (d, J = 9.5 Hz, 1H), 1.59 (d, J = 14.0 Hz, 1H), 1.47–1.44 (m, 2H), 1.42 (d, J = 11.5 Hz, 2H), 1.36 (d, J = 7.6 Hz, 1H), 1.32 (d, J = 11.9 Hz, 1H), 1.25 (s, 1H), 1.17 (p, J = 12.9, 11.6 Hz, 4H), 0.98 (d, J = 6.6 Hz, 3H, H-18), 0.90 (d, J = 6.9 Hz, 3H, H-28), 0.82 (dd, J = 10.1, 6.8 Hz, 6H, H-21, H-26), 0.78 (s, 3H, H-27), 0.63 (s, 3H, H-19); 13C NMR (150 MHz, CDCl3) δ 167.65, 165.47, 138.42, 138.29, 135.21, 135.08, 132.32, 130.67, 129.80, 129.17, 128.76, 127.63, 124.36, 119.41, 81.70, 79.38, 71.17, 56.15, 51.50, 50.89, 44.52, 42.78, 39.72, 39.27, 36.86, 34.09, 33.07, 32.83, 28.62, 25.90, 23.29, 20.87, 20.61, 19.97, 19.65, 17.79, 17.59, 12.84; HRMS (ESI) m/z: calcd for C42H53NO5 [M + Na]+: 674.3924, found: 674.3822.
  • Ergosterol peroxide-3-(2-((4-fluorophenyl)carbamoyl)benzoate) (4f)
White solid (78%). 1H NMR (600 MHz, CDCl3) δ 7.94 (d, J = 7.8 Hz, 1H, N-H), 7.84 (s, 1H, H-Ar), 7.63 (dd, J = 8.8, 4.7 Hz, 2H, H-Ar), 7.58–7.54 (m, 2H, H-Ar), 7.50 (t, J = 6.7 Hz, 1H, H-Ar), 7.05 (t, J = 8.6 Hz, 2H, H-Ar), 6.45 (d, J = 8.5 Hz, 1H, H-7), 6.01 (d, J = 8.4 Hz, 1H, H-6), 5.21 (dd, J = 15.2, 7.6 Hz, 1H), 5.14 (dd, J = 15.3, 8.3 Hz, 2H), 2.05–2.02 (m, 1H), 1.99–1.92 (m, 4H), 1.86 (d, J = 6.5 Hz, 1H), 1.84 (d, J = 6.3 Hz, 1H), 1.73–1.70 (m, 1H), 1.62 (d, J = 10.3 Hz, 1H), 1.53–1.48 (m, 2H), 1.45 (d, J = 7.1 Hz, 2H), 1.38 (dd, J = 11.5, 5.0 Hz, 1H), 1.35 (s, 1H), 1.33 (d, J = 11.0 Hz, 1H), 1.25 (s, 4H), 0.99 (d, J = 6.5 Hz, 3H, H-18), 0.91 (d, J = 6.9 Hz, 3H, H-28), 0.82 (dd, J = 10.0, 6.7 Hz, 6H, H-21, H-26), 0.78 (s, 3H, H-27), 0.69 (s, 3H, H-19); 13C NMR (150 MHz, CDCl3) δ 167.52, 165.58, 160.18, 158.56, 138.06, 135.20, 134.95, 132.34, 132.29, 130.86, 130.58, 129.88, 128.82, 127.76, 121.25, 121.20, 115.84, 115.69, 81.72, 79.45, 71.22, 56.15, 51.50, 50.90, 44.54, 42.79, 39.71, 39.26, 36.89, 34.10, 33.07, 32.90, 28.62, 25.96, 23.31, 20.87, 20.60, 19.97, 19.65, 17.80, 17.59, 12.85; HRMS (ESI) m/z: calcd for C42H52FNO5 [M + Na]+: 692.3830, found: 692.3731.
  • Ergosterol peroxide-3-(2-((4-(dimethylamino)phenyl)carbamoyl)benzoate) (4g)
White solid (80%). 1H NMR (600 MHz, CDCl3) δ 7.92 (d, J = 7.7 Hz, 1H, H-N), 7.69 (s, 1H, H-Ar), 7.59–7.55 (m, 4H, H-Ar), 7.50–7.47 (m, 1H, H-Ar), 6.89 (d, J = 8.9 Hz, 2H, H-Ar), 6.44 (d, J = 8.5 Hz, 1H, H-7), 6.02 (d, J = 8.5 Hz, 1H, H-6), 5.21 (dd, J = 15.2, 7.7 Hz, 1H), 5.14 (dd, J = 15.7, 8.0 Hz, 2H), 3.81 (s, 3H, H-OCH3), 2.05 (dd, J = 13.8, 5.1 Hz, 1H), 1.97–1.88 (m, 4H), 1.86–1.83 (m, 1H), 1.73 (d, J = 9.4 Hz, 1H), 1.63–1.60 (m, 1H), 1.56 (d, J = 9.5 Hz, 1H), 1.50 (d, J = 7.7 Hz, 2H), 1.48–1.45 (m, 2H), 1.43 (s, 1H), 1.37 (d, J = 9.7 Hz, 1H), 1.33 (d, J = 9.9 Hz, 1H), 1.26–1.15 (m, 4H), 0.99 (d, J = 6.6 Hz, 3H, H-18), 0.91 (d, J = 6.8 Hz, 3H, H-28), 0.84–0.81 (m, 6H, H-21, H-26), 0.79 (s, 3H, H-27), 0.68 (s, 3H, H-19); 13C NMR (150 MHz, CDCl3) δ 167.34, 165.70, 156.42, 138.32, 135.21, 135.06, 132.32, 132.22, 131.65, 130.73, 130.50, 129.73, 127.72, 121.14, 114.29, 81.73, 79.39, 71.16, 56.15, 51.55, 50.94, 44.54, 42.78, 39.73, 39.27, 36.88, 34.15, 33.07, 32.86, 28.63, 25.93, 23.32, 20.88, 20.61, 19.97, 19.65, 17.79, 17.59, 12.86; HRMS (ESI) m/z: calcd for C43H55NO6 [M + Na]+: 704.4029, found: 704.3925.
  • Ergosterol peroxide-3-(2-(naphthalen-2-ylcarbamoyl)benzoate) (4h)
White solid (83%). 1H NMR (600 MHz, CDCl3) δ 8.43 (s, 1H, H-N), 7.99 (d, J = 7.8 Hz, 1H, H-Ar), 7.86 (s, 1H, H-Ar), 7.81 (d, J = 9.8 Hz, 3H, H-Ar), 7.61 (d, J = 4.4 Hz, 2H, H-Ar), 7.53–7.47 (m, 3H, H-Ar), 7.42 (d, J = 7.4 Hz, 1H, H-Ar), 6.34 (d, J = 8.5 Hz, 1H, H-7), 5.79 (d, J = 8.5 Hz, 1H, H-6), 5.22–5.18 (m, 1H), 5.15–5.10 (m, 2H), 2.02 (d, J = 8.4 Hz, 1H), 1.94–1.84 (m, 4H), 1.83 (d, J = 7.1 Hz, 1H), 1.70 (d, J = 9.3 Hz, 1H), 1.54 (d, J = 5.9 Hz, 1H), 1.52 (s, 1H), 1.46 (d, J = 6.6 Hz, 2H), 1.35 (d, J = 12.1 Hz, 2H), 1.32 (d, J = 4.8 Hz, 1H), 1.29 (s, 1H), 1.25 (s, 1H), 1.18–1.03 (m, 4H), 0.96 (d, J = 6.5 Hz, 3H, H-18), 0.90 (d, J = 6.8 Hz, 3H, H-28), 0.83–0.80 (m, 6H, H-21, H-26), 0.74 (s, 3H, H-27), 0.47 (s, 3H, H-19); 13C NMR (150 MHz, CDCl3) δ 167.74, 165.58, 138.22, 135.73, 135.20, 134.90, 133.95, 132.36, 132.30, 130.71, 130.61, 129.92, 128.99, 128.87, 127.75, 127.70, 127.58, 126.66, 125.11, 119.47, 116.25, 81.64, 79.33, 71.24, 56.12, 51.50, 50.87, 44.50, 42.78, 39.71, 39.22, 36.77, 34.09, 33.07, 32.82, 28.60, 25.91, 23.25, 20.86, 20.58, 19.96, 19.64, 17.58, 17.49, 12.83; HRMS (ESI) m/z: calcd for C46H55NO5 [M + Na]+: 724.4080, found: 724.3981.

3.2. GLS1 Enzyme Assay

MDA-MB-231 cells were cultured for 24 h and then incubated with different concentrations of 3g or 0.1%DMSO for 48 h and washed with PBS 1–2 times. The cells were then collected, subjected to ultrasound in an ice bath for 5 min, and centrifuged at 4 °C and 1200 g for 15 min. Next, the GLS1 activity in human GLS1 was evaluated according to the manufacturer’s guidelines using a GLS1 screening kit (Sangon Biotech #D799306, Shanghai, China) in a 96-well plate (Corning # 351172, New York, NY, USA).

3.3. Cell Proliferation Assay

The MDA-MB-231 cell line was purchased from the Shanghai Cell Bank of the Chinese Academy of Sciences (Shanghai, China). Cells containing 10% fetal bovine serum (FBS; WISENT, Nanjing, China) were cultured in an L-15 culture medium (L-15, BOSTER, Wuhan, China) in an incubator at 37 °C. The cells were then inoculated into 96-well plates at a density of 5 × 10³/well, cultured in 100 μL L-15 medium for 24 h, and incubated with the compound to be tested for 48 h. Next, 20 μL of MTT (5 mg/mL) solution was added and incubated at 37 °C for 4 h away from light. A resorption culture medium was then supplemented with 150 μL DMSO per well. The absorbance was measured at 570 nm using an enzymometer (SAFIRE2, Tecan, Swiss Confederation, Männedorf, Switzerland). The cytotoxic activity was presented in terms of half the inhibition rate.

3.4. Colony Formation Assay

MDA-MB-231 cells (1000 cells/well) were seeded into a 6-well plate with 2 mL L–15 culture medium and incubated at 37 °C for 24 h. Following this process, different concentrations of 3g or EP were added and incubated for an additional 24 h before the culture medium was replaced. The cells then continued to be cultured for two weeks, with the culture medium being changed twice a week. After two weeks, the cell colonies were washed with PBS, fixed using a 4% paraformaldehyde solution (Beyotime, Shanghai, China), and subsequently stained with a 0.05% crystal violet solution (Beyotime, Shanghai, China).

3.5. Apoptosis Assays

An Annexin V FITC/PI apoptosis detection kit (Keygen Company, Nanjing, China) was employed to identify apoptotic cells. Briefly, MDA-MB-231 cells were subjected to treatment with varying concentrations of 3g or 0.1% DMSO and incubated at 37 °C for 48 h. Subsequently, the cells were harvested and resuspended in PBS at a concentration of 1 × 10⁵ cells/mL. Following centrifugation at 2000 rpm/min for 5 min, 500 μL binding buffer, 5 μL Annexin V FITC, and 5 μL propidium iodide (PI) were added. The mixture was then incubated at room temperature in the absence of light for 20 min. Finally, the samples were analyzed using FACSCalibur flow cytometry (Becton, Dickinson and Company, Franklin Lakes, USA).

3.6. Western Blot Analysis

MDA-MB-231 cells were subjected to treatment with different concentrations of 3g or 0.1% DMSO for 48 h. Subsequently, the cells were gathered, and the total protein was extracted by adding protease inhibitors and phosphatase inhibitors along with 1 × RIPA lysis buffer (Beyotime Company). The quantification of the extracted protein was carried out using a BCA kit (ComWin Biotech Company, Beijin, China). The extracted total protein, with an amount of 20 μg/well, underwent SDS–polyacrylamide gel electrophoresis (SDS-PAGE, provided by BioRad Laboratories located in Hercules, CA, USA). The protein was then wet-transferred to a PVDF membrane. Next, GLS1, Bcl-2, Bax, Cyt C, caspase-9, cleaved caspase-9, caspase-3, cleaved caspase-3, and GAPDH were incubated at 4 °C overnight. Subsequently, the secondary isotype-specific antibody, which was labeled with horseradish peroxidase, was obtained from Cell Signaling Technology. The color was developed with an ECL luminescent solution (Meilun Biotech Company, Dalian, China) and detected using a gel imager (ChemiDoc MP, BioRad Laboratories, CA, USA).

3.7. Determination of Intracellular Glutamate Levels

MDA-MB-231 cells were cultured for 24 h, incubated with different concentrations of 3g or 0.1% DMSO for 48 h, and washed with PBS 1–2 times. Then, the collected cells were lysed with an extraction buffer, crushed in an ultrasonic ice bath for 5 min at 8000 g, and centrifuged at room temperature for 10 min. Then, the cells were tested according to a CheKineTM glutamate detection kit (KTB1440, Abbkine Scientific Company, Wuhan, China).

3.8. ROS Assay

MDA-MB-231 cells were inoculated in 24-well plates at a density of 8 × 10³ cells per well and incubated with different concentrations of 3 g or 0.1% DMSO for 48 h. The cells were washed with PBS 1–2 times. The cells were then incubated at 37 °C for 20 min with reference to a DCFH-DA fluorescent probe kit (Keygen Company, Nanjing, China) and washed with a serum-free medium 1–2 times. The ROS levels were observed via laser confocal microscopy (LSM710, Zeiss, Oberkochen, Germany) or detected with flow cytometry (FACS Calibur, Becton, Dickinson and Company, Franklin Lakes, NJ, USA).

3.9. Molecular Docking

The crystal structure of human GLS1 (PDB ID: 3UO9) was retrieved from the PDB protein database. The ligand molecules were then sketched using the Chemdraw 19.0 software (CambridgeSoft Corporation, Cambridge, MA, USA). Then, the MM2 field minimum energy was quantified, and the mol2 structure file was derived. Molecular docking was performed with the Autodock 1.5.7 software (Scripps Software), with the docking results visualized using the PyMOL 2.6.0 software (DeLano Sciences, South San Francisco, CA, USA).

3.10. In Vivo Model

All the animal testing procedures were carried out in accordance with the National Institutes of Health guidelines concerning the care and use of laboratory animals. The relevant animal testing content received authorization from the Experimental Animal Ethics Committee of Qiqihar Medical College (approval number: QMU-AECC-2022-43). Female BALB/c mice that were three weeks old were procured from the Laboratory Animal Science Department of Harbin Medical University, which was located in Harbin, China. Logarithmic 4T1 cells were collected and suspended in PBS, and each mouse was inoculated subcutaneously with 100 μL of PBS containing 1 × 10⁶ cells. When the tumor reached a size of about 100 mm3, the tumor-bearing mice were randomly divided into a blank control group, positive control group (BPTES, 25 mg/kg), and treatment group (3g, 25 mg/kg, or 50 mg/kg). An intraperitoneal injection was administered every two days, and the tumor and mouse weights were recorded. After 14 days, the mice were humanely euthanized. Subsequently, the tumors and internal organs from each group were collected. These were then fixed using 4% paraformaldehyde to prepare them for the subsequent experiments.

4. Conclusions

In this study, a series of potential EP-based GLS1 inhibitors was designed, synthesized, and evaluated. These EP derivatives exhibit high antiproliferative activities against MDA-MB-231 cells that overexpress GLS1. Compound 3g offered higher GLS1-inhibitory effects than EP, with similar inhibitory activities compared to BPTES on GLS1. Compound 3g reduced the glutamate levels by blocking the glutamine hydrolysis pathway and further triggered the production of ROS, thereby activating the mitochondrial apoptosis pathway and promoting cell apoptosis. In molecular docking, 3g bound to GLS1, indicating its good binding capabilities and significantly lower binding energy than EP. In addition, 3g effectively inhibited tumor growth in model mice without significant toxicity. Therefore, as a natural GLS1 inhibitor, 3g has good application prospects in the treatment of breast cancer and is worthy of further development.

Supplementary Materials

The following supporting information can be downloaded at https://www.mdpi.com/article/10.3390/molecules29184375/s1.

Author Contributions

Conceptualization, Y.L. and M.B.; data curation, R.L., H.Z., S.D., X.G. and W.R.; formal analysis, J.W., C.H. and R.L.; methodology, Y.L. and M.B.; software, H.Z. and J.Z.; validation, Y.H. and H.W.; writing—original draft, R.L. and H.Z; writing—review and editing, M.B. All authors have read and agreed to the published version of the manuscript.

Funding

This work was supported by the Heilongjiang Provincial Natural Science Foundation of China (Grant No. LH2022H113).

Institutional Review Board Statement

Not applicable.

Informed Consent Statement

Not applicable.

Data Availability Statement

The data will be provided upon request.

Conflicts of Interest

The authors reported no potential conflicts of interest.

References

  1. Wolf, A.; Agnihotri, S.; Guha, A. Targeting metabolic remodeling in glioblastoma multiforme. Oncotarget 2010, 1, 552–562. [Google Scholar] [CrossRef] [PubMed]
  2. Zhong, X.; He, Z.; Yin, L.; Fan, Y.; Tong, Y.; Kang, Y.; Bi, Q. Glutamine metabolism in tumor metastasis: Genes, mechanisms and the therapeutic targets. Heliyon 2023, 9, e20656. [Google Scholar] [CrossRef]
  3. Bergers, G.; Fendt, S.M. The metabolism of cancer cells during metastasis. Nat. Rev. Cancer. 2021, 21, 162–180. [Google Scholar] [CrossRef] [PubMed]
  4. Cruzat, V.; Macedo Rogero, M.; Noel Keane, K.; Curi, R.; Newsholme, P. Glutamine: Metabolism and Immune Function, Supplementation and Clinical Translation. Nutrients 2018, 10, 1564. [Google Scholar] [CrossRef] [PubMed]
  5. Jin, J.; Byun, J.K.; Choi, Y.K.; Park, K.G. Targeting glutamine metabolism as a therapeutic strategy for cancer. Exp. Mol. Med. 2023, 55, 706–715. [Google Scholar] [CrossRef]
  6. Erickson, J.W.; Cerione, R.A. Glutaminase: A hot spot for regulation of cancer cell metabolism? Oncotarget 2010, 1, 734–740. [Google Scholar] [CrossRef]
  7. Leone, R.D.; Zhao, L.; Englert, J.M.; Sun, I.M.; Oh, M.H.; Sun, I.H.; Arwood, M.L.; Bettencourt, I.A.; Patel, C.H.; Wen, J.; et al. Glutamine blockade induces divergent metabolic programs to overcome tumor immune evasion. Science 2019, 366, 1013–1021. [Google Scholar] [CrossRef]
  8. Zhu, L.; Zhu, X.; Wu, Y. Effects of Glucose Metabolism, Lipid Metabolism, and Glutamine Metabolism on Tumor Microenvironment and Clinical Implications. Biomolecules 2022, 12, 580. [Google Scholar] [CrossRef]
  9. Sullivan, L.B.; Gui, D.Y.; Hosios, A.M.; Bush, L.N.; Freinkman, E.; Vander Heiden, M.G. Supporting Aspartate Biosynthesis Is an Essential Function of Respiration in Proliferating Cells. Cell 2015, 162, 552–563. [Google Scholar] [CrossRef]
  10. Li, B.; Cao, Y.; Meng, G.; Qian, L.; Xu, T.; Yan, C.; Luo, O.; Wang, S.; Wei, J.; Ding, Y.; et al. Targeting glutaminase 1 attenuates stemness properties in hepatocellular carcinoma by increasing reactive oxygen species and suppressing Wnt/beta-catenin pathway. EBioMedicine 2019, 39, 239–254. [Google Scholar] [CrossRef]
  11. Liao, J.; Liu, P.P.; Hou, G.; Shao, J.; Yang, J.; Liu, K.; Lu, W.; Wen, S.; Hu, Y.; Huang, P. Regulation of stem-like cancer cells by glutamine through β-catenin pathway mediated by redox signaling. Mol. Cancer 2017, 16, 51. [Google Scholar] [CrossRef] [PubMed]
  12. Zhou, X.; An, B.; Lin, Y.; Ni, Y.; Zhao, X.; Liang, X. Molecular mechanisms of ROS-modulated cancer chemoresistance and therapeutic strategies. Biomed. Pharmacother. 2023, 165, 115036. [Google Scholar] [CrossRef] [PubMed]
  13. Wu, S.; Fukumoto, T.; Lin, J.; Nacarelli, T.; Wang, Y.; Ong, D.; Liu, H.; Fatkhutdinov, N.; Zundell, J.A.; Karakashev, S.; et al. Targeting glutamine dependence through GLS1 inhibition suppresses ARID1A-inactivated clear cell ovarian carcinoma. Nat. Cancer 2021, 2, 189–200. [Google Scholar] [CrossRef] [PubMed]
  14. Wise, D.R.; Thompson, C.B. Glutamine addiction: A new therapeutic target in cancer. Trends Biochem. Sci. 2010, 35, 427–433. [Google Scholar] [CrossRef] [PubMed]
  15. Katt, W.P.; Cerione, R.A. Glutaminase regulation in cancer cells: A druggable chain of events. Drug Discov. Today 2014, 19, 450–457. [Google Scholar] [CrossRef]
  16. Gameiro, P.A.; Yang, J.; Metelo, A.M.; Pérez-Carro, R.; Baker, R.; Wang, Z.; Arreola, A.; Rathmell, W.K.; Olumi, A.; López-Larrubia, P.; et al. In vivo HIF-mediated reductive carboxylation is regulated by citrate levels and sensitizes VHL-deficient cells to glutamine deprivation. Cell Metab. 2013, 17, 372–385. [Google Scholar] [CrossRef]
  17. Jiang, B.; Zhang, J.; Zhao, G.; Liu, M.; Hu, J.; Lin, F.; Wang, J.; Zhao, W.; Ma, H.; Zhang, C.; et al. Filamentous GLS1 promotes ROS-induced apoptosis upon glutamine deprivation via insufficient asparagine synthesis. Mol. Cell 2022, 82, 1821–1835. [Google Scholar] [CrossRef]
  18. Li, C.Q.; Lei, H.M.; Hu, Q.Y.; Li, G.H.; Zhao, P.J. Recent Advances in the Synthetic Biology of Natural Drugs. Front. Bioeng. Biotechnol. 2021, 9, 691152. [Google Scholar] [CrossRef]
  19. Bu, M.; Yang, B.B.; Hu, L. Natural Endoperoxides as Drug Lead Compounds. Curr. Med. Chem. 2016, 23, 383–405. [Google Scholar] [CrossRef]
  20. Wu, S.J.; Lu, T.M.; Lai, M.N.; Ng, L.T. Immunomodulatory activities of medicinal mushroom Grifola frondosa extract and its bioactive constituent. Am. J. Chin. Med. 2013, 41, 131–144. [Google Scholar] [CrossRef]
  21. Duan, C.; Ge, X.; Wang, J.; Wei, Z.; Feng, W.H.; Wang, J. Ergosterol peroxide exhibits antiviral and immunomodulatory abilities against porcine deltacoronavirus (PDCoV) via suppression of NF-κB and p38/MAPK signaling pathways in vitro. Int. Immunopharmacol. 2021, 93, 107317. [Google Scholar] [CrossRef] [PubMed]
  22. Martínez-Montemayor, M.M.; Ling, T.; Suárez-Arroyo, I.J.; Ortiz-Soto, G.; Santiago-Negrón, C.L.; Lacourt-Ventura, M.Y.; Valentín-Acevedo, A.; Lang, W.H.; Rivas, F. Identification of Biologically Active Ganoderma lucidum Compounds and Synthesis of Improved Derivatives That Confer Anti-cancer Activities in vitro. Front. Pharmacol. 2019, 10, 115. [Google Scholar] [CrossRef] [PubMed]
  23. Govindharaj, M.; Arumugam, S.; Nirmala, G.; Bharadwaj, M.; Murugiyan, K. Effect of Marine Basidiomycetes Fulvifomes sp.-Derived Ergosterol Peroxide on Cytotoxicity and Apoptosis Induction in MCF-7 Cell Line. J. Fungi. 2019, 5, 16. [Google Scholar] [CrossRef] [PubMed]
  24. Tan, W.; Pan, M.; Liu, H.; Tian, H.; Ye, Q.; Liu, H. Ergosterol peroxide inhibits ovarian cancer cell growth through multiple pathways. Onco Targets Ther. 2017, 10, 3467–3474. [Google Scholar] [CrossRef]
  25. He, L.; Shi, W.; Liu, X.; Zhao, X.; Zhang, Z. Anticancer Action and Mechanism of Ergosterol Peroxide from Paecilomyces cicadae Fermentation Broth. Int. J. Mol. Sci. 2018, 19, 3935. [Google Scholar] [CrossRef] [PubMed]
  26. Kang, J.H.; Jang, J.E.; Mishra, S.K.; Lee, H.J.; Nho, C.W.; Shin, D.; Jin, M.; Kim, M.K.; Choi, C.; Oh, S.H. Ergosterol peroxide from Chaga mushroom (Inonotus obliquus) exhibits anti-cancer activity by down-regulation of the β-catenin pathway in colorectal cancer. J. Ethnopharmacol. 2015, 173, 303–312. [Google Scholar] [CrossRef]
  27. Kobori, M.; Yoshida, M.; Ohnishi-Kameyama, M.; Shinmoto, H. Ergosterol peroxide from an edible mushroom suppresses inflammatory responses in RAW264.7 macrophages and growth of HT29 colon adenocarcinoma cells. Br. J. Pharmacol. 2007, 150, 209–219. [Google Scholar] [CrossRef]
  28. Yang, Y.; Luo, X.; Yasheng, M.; Zhao, J.; Li, J.; Li, J. Ergosterol peroxide from Pleurotus ferulae inhibits gastrointestinal tumor cell growth through induction of apoptosis via reactive oxygen species and endoplasmic reticulum stress. Food Funct. 2020, 11, 4171–4184. [Google Scholar] [CrossRef]
  29. Wu, H.Y.; Yang, F.L.; Li, L.H.; Rao, Y.K.; Ju, T.C.; Wong, W.T.; Hsieh, C.Y.; Pivkin, M.V.; Hua, K.F.; Wu, S.H. Ergosterol peroxide from marine fungus Phoma sp. induces ROS-dependent apoptosis and autophagy in human lung adenocarcinoma cells. Sci. Rep. 2018, 8, 17956. [Google Scholar] [CrossRef]
  30. Bu, M.; Li, H.; Wang, H.; Wang, J.; Lin, Y.; Ma, Y. Synthesis of Ergosterol Peroxide Conjugates as Mitochondria Targeting Probes for Enhanced Anticancer Activity. Molecules 2019, 24, 3307. [Google Scholar] [CrossRef]
  31. Bu, M.; Cao, T.; Li, H.; Guo, M.; Yang, B.B.; Zeng, C.; Hu, L. Synthesis of 5α,8α-Ergosterol Peroxide 3-Carbamate Derivatives and a Fluorescent Mitochondria-Targeting Conjugate for Enhanced Anticancer Activities. ChemMedChem 2017, 12, 466–474. [Google Scholar] [CrossRef] [PubMed]
  32. Ren, W.K.; Wu, J.L.; Wang, J.F.; Wang, H.J.; Han, Y.L.; Lin, Y.; Bu, M. Mitochondria-Targeted Ergosterol Peroxide Derivatives: Synthesis, Anticancer Properties and Their Preliminary Mechanism of Inhibiting MCF-7 Cell Proliferation. J. Braz. Chem. Soc. 2023, 34, 1420–1431. [Google Scholar] [CrossRef]
  33. Shapiro, R.A.; Clark, V.M.; Curthoys, N.P. Inactivation of rat renal phosphate-dependent glutaminase with 6-diazo-5-oxo-L-norleucine. Evidence for interaction at the glutamine binding site. J. Biol. Chem. 1979, 254, 2835–2838. [Google Scholar] [CrossRef]
  34. Shapiro, R.A.; Clark, V.M.; Curthoys, N.P. Covalent interaction of L-2-amino-4-oxo-5-chloropentanoic acid with rat renal phosphate-dependent glutaminase. Evidence for a specific glutamate binding site and of subunit heterogeneity. J. Biol. Chem. 1978, 253, 7086–7090. [Google Scholar] [CrossRef]
  35. Yuneva, M.O.; Fan, T.W.; Allen, T.D.; Higashi, R.M.; Ferraris, D.V.; Tsukamoto, T.; Matés, J.M.; Alonso, F.J.; Wang, C.; Seo, Y.; et al. The metabolic profile of tumors depends on both the responsible genetic lesion and tissue type. Cell Metab. 2012, 15, 157–170. [Google Scholar] [CrossRef]
  36. Newcomb, R.W.; Newocmb, M. Selective Inhibition of Glutaminase by BisThiadiazoles. U.S. Patent 6451828B1, 17 September 2002. [Google Scholar]
  37. Robinson, M.M.; McBryant, S.J.; Tsukamoto, T.; Rojas, C.; Ferraris, D.V.; Hamilton, S.K.; Hansen, J.C.; Curthoys, N.P. Novel mechanism of inhibition of rat kidney-type glutaminase by bis-2-(5-phenylacetamido-1,2,4-thiadiazol-2-yl)ethyl sulfide (BPTES). Biochem. J. 2007, 406, 407–414. [Google Scholar] [CrossRef]
  38. Shukla, K.; Ferraris, D.V.; Thomas, A.G.; Stathis, M.; Duvall, B.; Delahanty, G.; Alt, J.; Rais, R.; Rojas, C.; Gao, P.; et al. Design, synthesis, and pharmacological evaluation of bis-2-(5-phenylacetamido-1,2,4-thiadiazol-2-yl)ethyl sulfide 3 (BPTES) analogs as glutaminase inhibitors. J. Med. Chem. 2012, 55, 10551–10563. [Google Scholar] [CrossRef]
  39. Zimmermann, S.C.; Wolf, E.F.; Luu, A.; Thomas, A.G.; Stathis, M.; Poore, B.; Nguyen, C.; Le, A.; Rojas, C.; Slusher, B.S.; et al. Allosteric Glutaminase Inhibitors Based on a 1,4-Di(5-amino-1,3,4-thiadiazol-2-yl)butane Scaffold. ACS Med. Chem. Lett. 2016, 7, 520–524. [Google Scholar] [CrossRef] [PubMed]
  40. Zhou, W.X.; Chen, C.; Liu, X.Q.; Li, Y.; Lin, Y.L.; Wu, X.T.; Kong, L.Y.; Luo, J.G. Discovery and optimization of withangulatin A derivatives as novel glutaminase 1 inhibitors for the treatment of triple-negative breast cancer. Eur. J. Med. Chem. 2021, 210, 112980. [Google Scholar] [CrossRef]
  41. Vagia, E.; Mahalingam, D.; Cristofanilli, M. The Landscape of Targeted Therapies in TNBC. Cancers 2020, 12, 916. [Google Scholar] [CrossRef]
  42. Yin, L.; Duan, J.J.; Bian, X.W.; Yu, S.C. Triple-negative breast cancer molecular subtyping and treatment progress. Breast Cancer Res. 2020, 22, 61. [Google Scholar] [CrossRef] [PubMed]
  43. MacDonald, I.; Nixon, N.A.; Khan, O.F. Triple-Negative Breast Cancer: A Review of Current Curative Intent Therapies. Curr. Oncol. 2022, 29, 4768–4778. [Google Scholar] [CrossRef] [PubMed]
  44. Kim, M.J.; Kim, D.H.; Jung, W.H.; Koo, J.S. Expression of metabolism-related proteins in triple-negative breast cancer. Int. J. Clin. Exp. Pathol. 2013, 7, 301–312. [Google Scholar] [PubMed]
  45. Ju, Y.; Ben-David, Y.; Rotin, D.; Zacksenhaus, E. Inhibition of eEF2K synergizes with glutaminase inhibitors or 4EBP1 depletion to suppress growth of triple-negative breast cancer cells. Sci. Rep. 2021, 11, 9181. [Google Scholar] [CrossRef]
Figure 1. Design of GLS1 inhibitors based on the EP and BPTES binding groups.
Molecules 29 04375 g001
Scheme 1. Synthesis of EP derivatives (1ah, 2ah, 3ah, and 4ah). Reagents and conditions: (i) Et3N, CH2Cl2, SA (A), MA (B), GA (C), or PA (D), reflux, 24 h, 76–85%; and (ii) R2-H, HOBT·H2O, EDCI·HCl, pyridine, DMF, room temperature, 12–48 h, 77–88%.
Molecules 29 04375 sch001
Figure 2. The inhibitory effect of compound 3g on GLS1 activity in MDA-MB-231 cells. (A) A GLS1 inhibitor screening kit was utilized to detect the GLS1 levels of EP, 3g, and BPTES. (B) After treating MDA-MB-231 cells with different concentrations of 3g for 48 h, the expression of the GLS1 protein was detected by Western blot. (C) Quantitative analysis. The data are expressed as the mean ± SD (n = 3), *** p < 0.001, compared with the control group.
Molecules 29 04375 g002
Figure 3. Compound 3g inhibited the proliferation of MDA-MB-231 cells. (A) Compound 3g inhibited the colony formation of MDA-MB-231 cells. (B) Clonogenic suppression expressed as a percentage relative to the vehicle-treated controls. Data represent the mean ± SD (n = 3), ** p < 0.01, *** p < 0.001, compared with the control group.
Molecules 29 04375 g003
Figure 4. Compound 3g induced apoptosis of MDA-MB-231 cells. (A) MDA-MB-231 cells were treated with different concentrations of 3g for 48 h; then, the cells were fixed and stained with Annexin V-FITC/PI and analyzed via flow cytometry. Annexin V-FITC and PI data are expressed as percentages (%) for each quadrant. (B) The apoptosis rate was quantitatively detected. (C) Western blot analysis. MDA-MB-MB-231 cells were treated with different concentrations of 3g for 48 h, and the protein expressions of Bcl-2, Bax, Cyt C, caspase-9, cleaved caspase-9, caspase-3, and cleaved caspase-3 were detected via Western blot. (D) Quantitative analysis. Data represent the means ± SD (n = 3), ** p < 0.01, *** p < 0.001, compared with the control group.
Molecules 29 04375 g004
Figure 5. The effect of compound 3g and EP on the glutamate levels in MDA-MB-231 cells. MDA-MB-231 cells were treated with different concentrations of 3g (2, 4, and 8 μM) and EP for 48 h. The changes in the glutamate levels of MDA-MB-231 cells were detected by using a glutamate kit. Data represent the means ± SD (n = 3), ** p < 0.01, *** p < 0.001, compared with the control group.
Molecules 29 04375 g005
Figure 6. Compound 3g induced an increase in the ROS levels in MDA-MB-231 cells. MDA-MB-231 cells were subjected to treatment with 3g and EP at different concentrations for 48 h. (A) Fluorescence microscopy image of intracellular ROS production in MDA-MB-231 cells stained with DCFH-DA (green). (B) Quantification of ROS levels by flow cytometry. (C) Quantitative analysis. Data represent the means ± SD (n = 3), ** p < 0.01, *** p < 0.001, compared with the control group.
Molecules 29 04375 g006
Figure 7. The eutectic structure of compound 3g with GLS1 (PDB ID: 3UO9). (A) Modeled and enlarged close-up of the surface mosaic of the GLS1 tetramer and 3g binding. (B) Close-up of the 3g interactions in the GLS1 allosteric binding pocket. Here, 3g is rendered as a rod and colored according to the atom type. Green denotes carbon, blue denotes nitrogen, and red denotes oxygen. The key residual atoms in GLS1 that interacted with the compound are denoted in cyan. The red dashed lines indicate hydrogen bonds, and the numbers are the hydrogen bond lengths.
Molecules 29 04375 g007
Figure 8. Compound 3g inhibited the growth of 4T1 cells in vivo. (A) Tumor images of 4T1 tumor-bearing mice treated with 3g or BPTES; and (B) tumor HE staining. Scale = 50 μm. (C) Changes in the tumor volume; (D) tumor weight; and (E) body weight of 4T1 tumor-bearing mice. Data represent the mean ± SD (n = 6), * p < 0.05, ** p < 0.01, *** p < 0.001, compared with the control group. Scale = 50 μm.
Molecules 29 04375 g008
Figure 9. The effect of compound 3g on organ damage in model mice. The hearts, livers, spleens, lungs, and kidneys of the mice were harvested and sectioned for HE staining. Scale bars = 50 μm.
Molecules 29 04375 g009
Table 1. Antiproliferative activities of EP derivatives 1a–h, 2a–h, 3a–h, and 4a–h against four tumor cell lines.
CompoundIC50 a (μM)
A549HepG2MCF-7MDA-MB-231
1a12.45 ± 0.848.89 ± 0.418.44 ± 0.8211.61 ± 1.54
1b16.76 ± 1.3310.97 ± 0.829.07 ± 0.5217.66 ± 1.71
1c12.88 ± 0.9111.35 ± 0.7615.35 ± 1.2219.89 ± 1.08
1d17.28 ± 1.1213.31 ± 1.0510.85 ± 1.3212.73 ± 0.26
1e10.01 ± 0.6115.17 ± 1.0311.61 ± 0.9611.69 ± 0.57
1f13.99 ± 0.878.99 ± 0.678.03 ± 0.689.24 ± 0.41
1g15.96 ± 1.4211.53 ± 0.879.05 ± 0.4910.10 ± 0.85
1h17.93 ± 1.2112.09 ± 1.119.27 ± 0.389.05 ± 1.02
2a18.40 ± 1.4010.98 ± 0.937.66 ± 1.0116.83 ± 0.95
2b16.23 ± 1.179.83 ± 0.766.39 ± 0.2817.10 ± 0.83
2c14.08 ± 0.989.78 ± 0.8113.45 ± 1.0316.55 ± 0.72
2d9.86 ± 1.649.51 ± 0.7312.93 ± 0.7814.79 ± 1.27
2e17.13 ± 1.2218.17 ± 0.717.40 ± 0.285.19 ± 0.69
2f13.42 ± 0.7115.76 ± 1.2710.93 ± 0.848.11 ± 0.76
2g10.28 ± 0.3812.20 ± 1.155.38 ± 0.386.02 ± 0.71
2h14.88 ± 1.1012.63 ± 1.0814.74 ± 1.3414.00 ± 0.79
3a9.73 ± 0.4210.66 ± 0.825.16 ± 0.937.06 ± 0.35
3b11.69 ± 0.8213.06 ± 1.229.47 ± 0.756.92 ± 0.28
3c11.38 ± 0.7911.87 ± 1.0711.04 ± 0.6211.99 ± 0.72
3d9.09 ± 0.6414.67 ± 0.358.39 ± 0.3410.79 ± 0.53
3e10.52 ± 0.7914.91 ± 1.1311.55 ± 0.664.78 ± 0.41
3f11.08 ± 0.939.79 ± 1.018.09 ± 0.717.19 ± 0.39
3g13.52 ± 1.1415.48 ± 0.634.57 ± 0.623.20 ± 0.29
3h9.30 ± 0.6613.84 ± 1.308.65 ± 0.734.98 ± 0.84
4a7.07 ± 0.478.08 ± 0.648.20 ± 0.6810.19 ± 0.62
4b12.80 ± 1.0810.95 ± 0.7612.64 ± 0.9415.77 ± 1.26
4c11.69 ± 1.0211.40 ± 0.9810.71 ± 0.477.32 ± 0.58
4d8.99 ± 0.8115.32 ± 1.3110.56 ± 0.5211.31 ± 0.44
4e12.58 ± 0.9918.54 ± 1.1815.40 ± 1.219.07 ± 0.93
4f18.79 ± 0.649.02 ± 0.879.64 ± 0.5113.39 ± 1.24
4g17.62 ± 1.3915.59 ± 0.849.49 ± 0.248.16 ± 0.80
4h10.13 ± 1.1614.29 ± 1.5511.39 ± 0.4214.57 ± 0.47
EP14.95 ± 1.2718.05 ± 1.7119.42 ± 1.5017.26 ± 1.05
BPTES49.08 ± 11.6060.23 ± 8.3521.26 ± 6.899.10 ± 0.26
Cisplatin11.64 ± 0.386.29 ± 0.304.23 ± 0.2410.37 ± 0.34
a IC50: the concentration of a compound that inhibits cell growth by 50%. All data in the table above are averages of three independent experiments ± SD.
Disclaimer/Publisher’s Note: The statements, opinions and data contained in all publications are solely those of the individual author(s) and contributor(s) and not of MDPI and/or the editor(s). MDPI and/or the editor(s) disclaim responsibility for any injury to people or property resulting from any ideas, methods, instructions or products referred to in the content.

