
The Influence of Ag Addition and Different SiO2 Precursors on the Structure of Silica Thin Films Synthesized by the Sol–Gel Method


Abstract
1. Introduction
2. Results
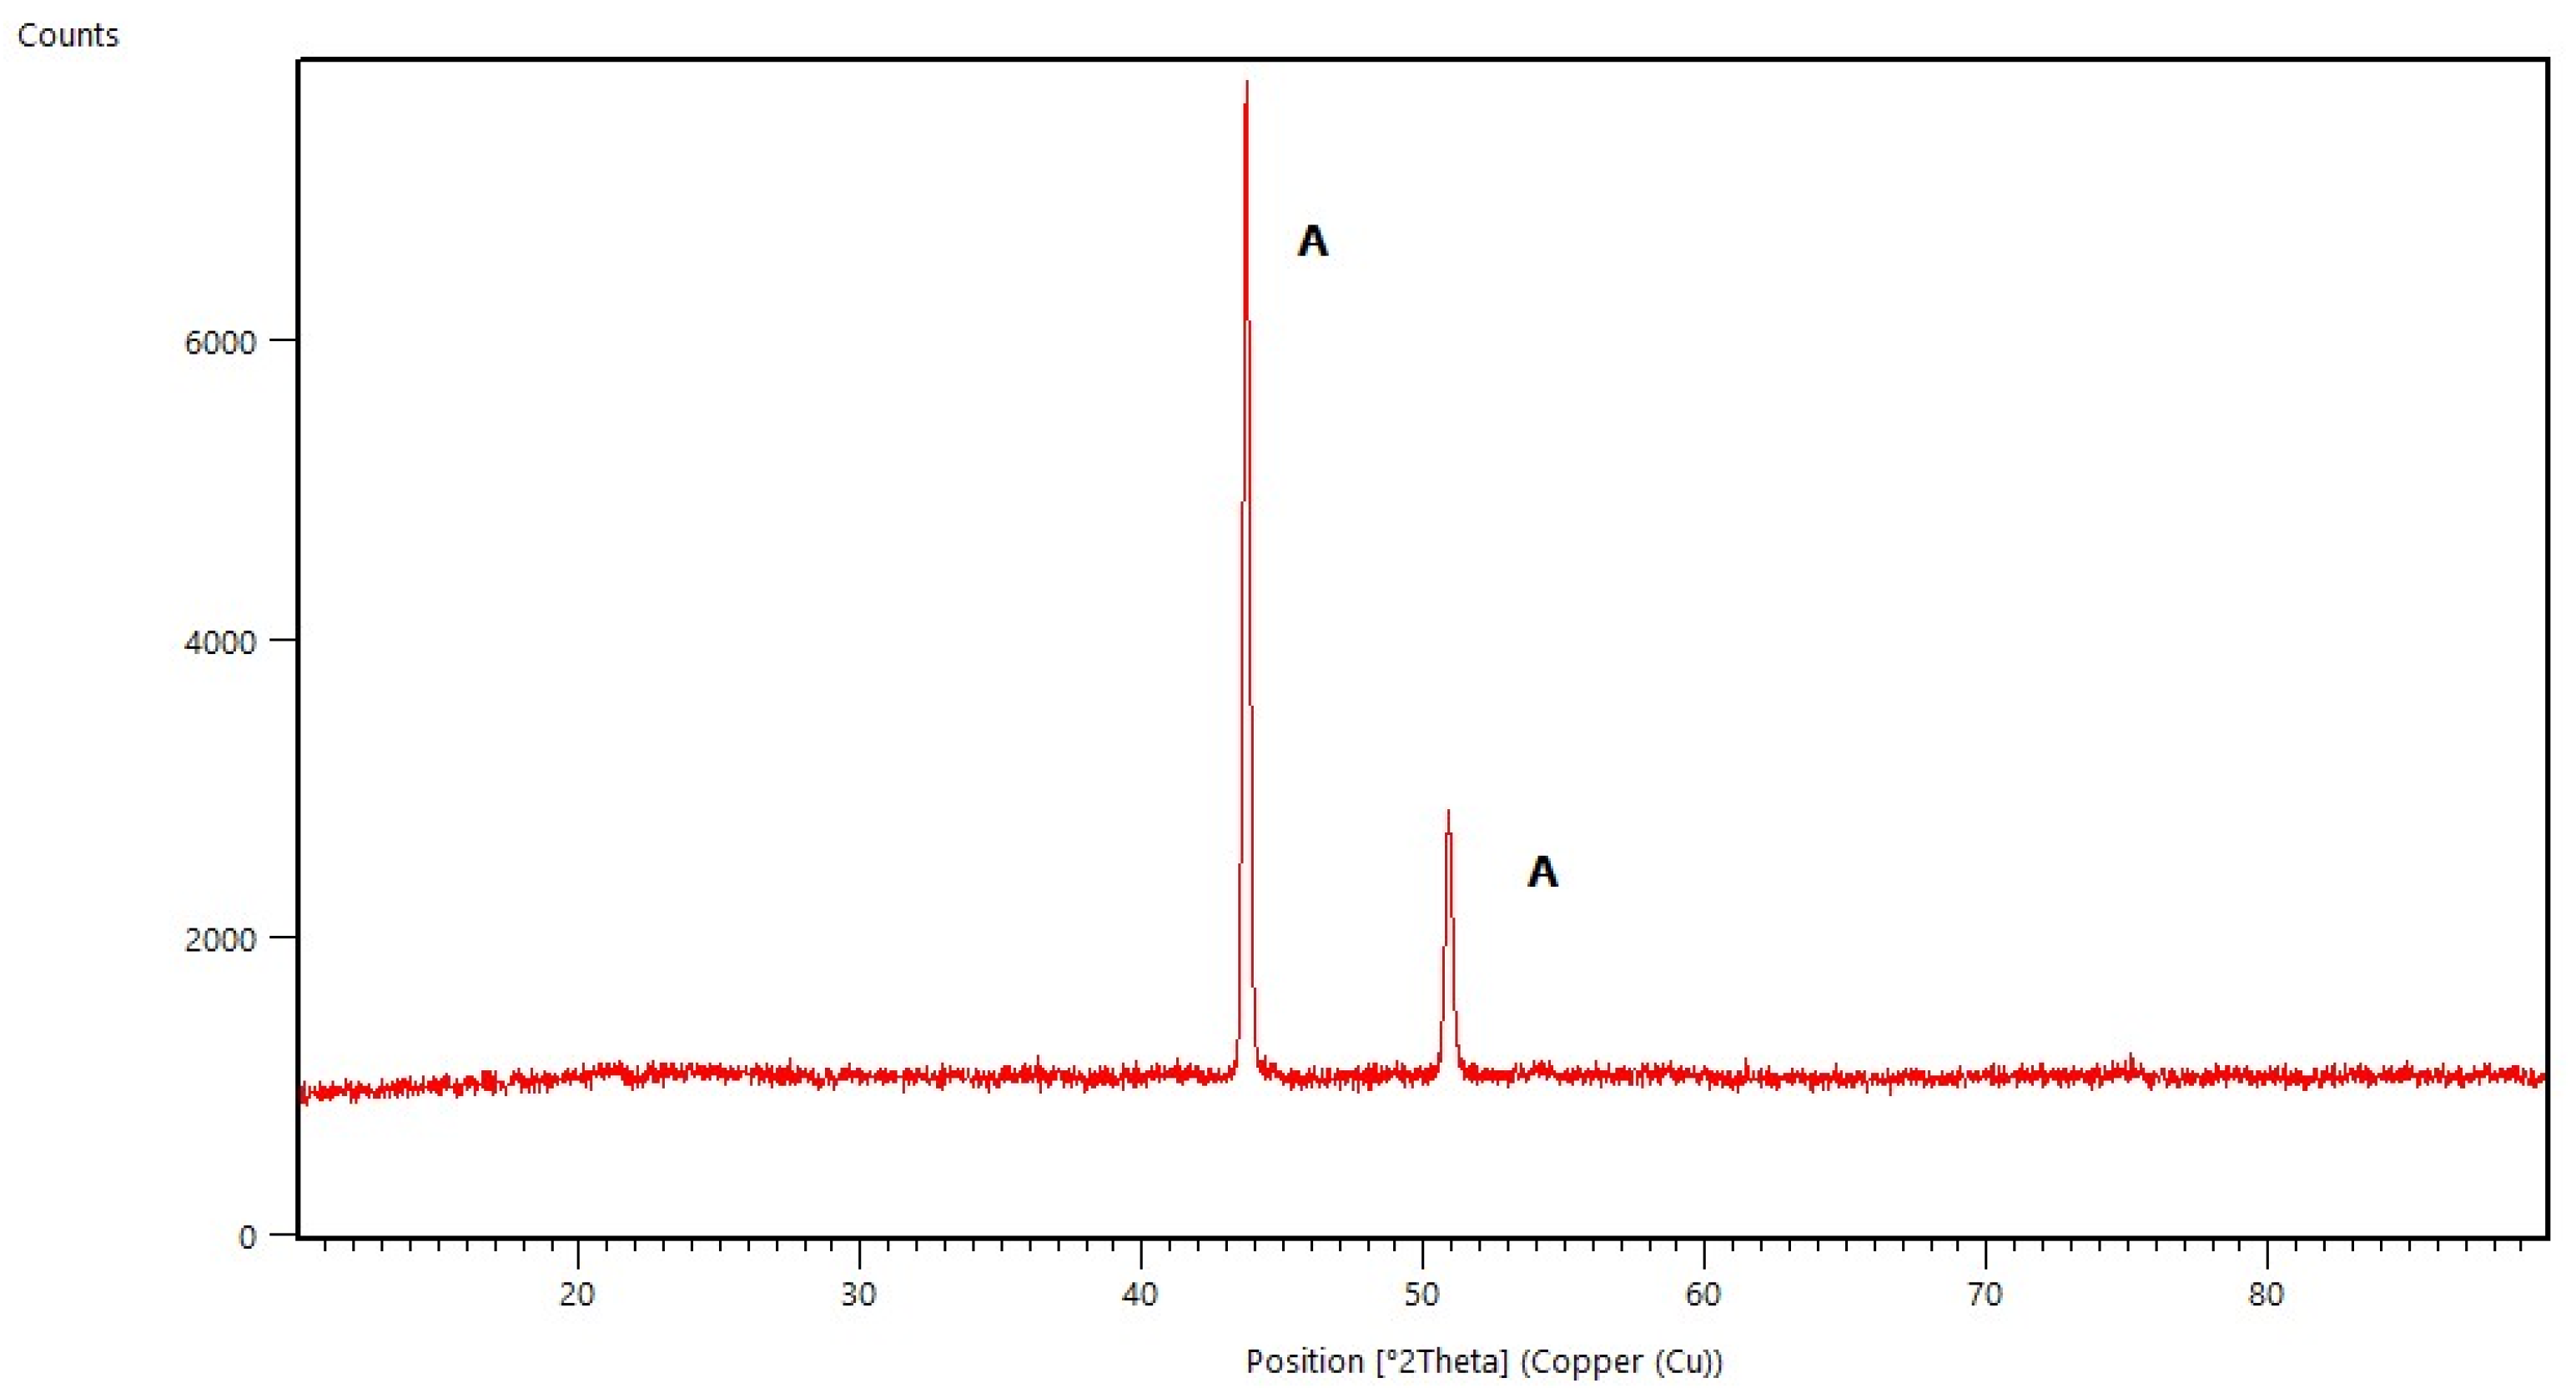
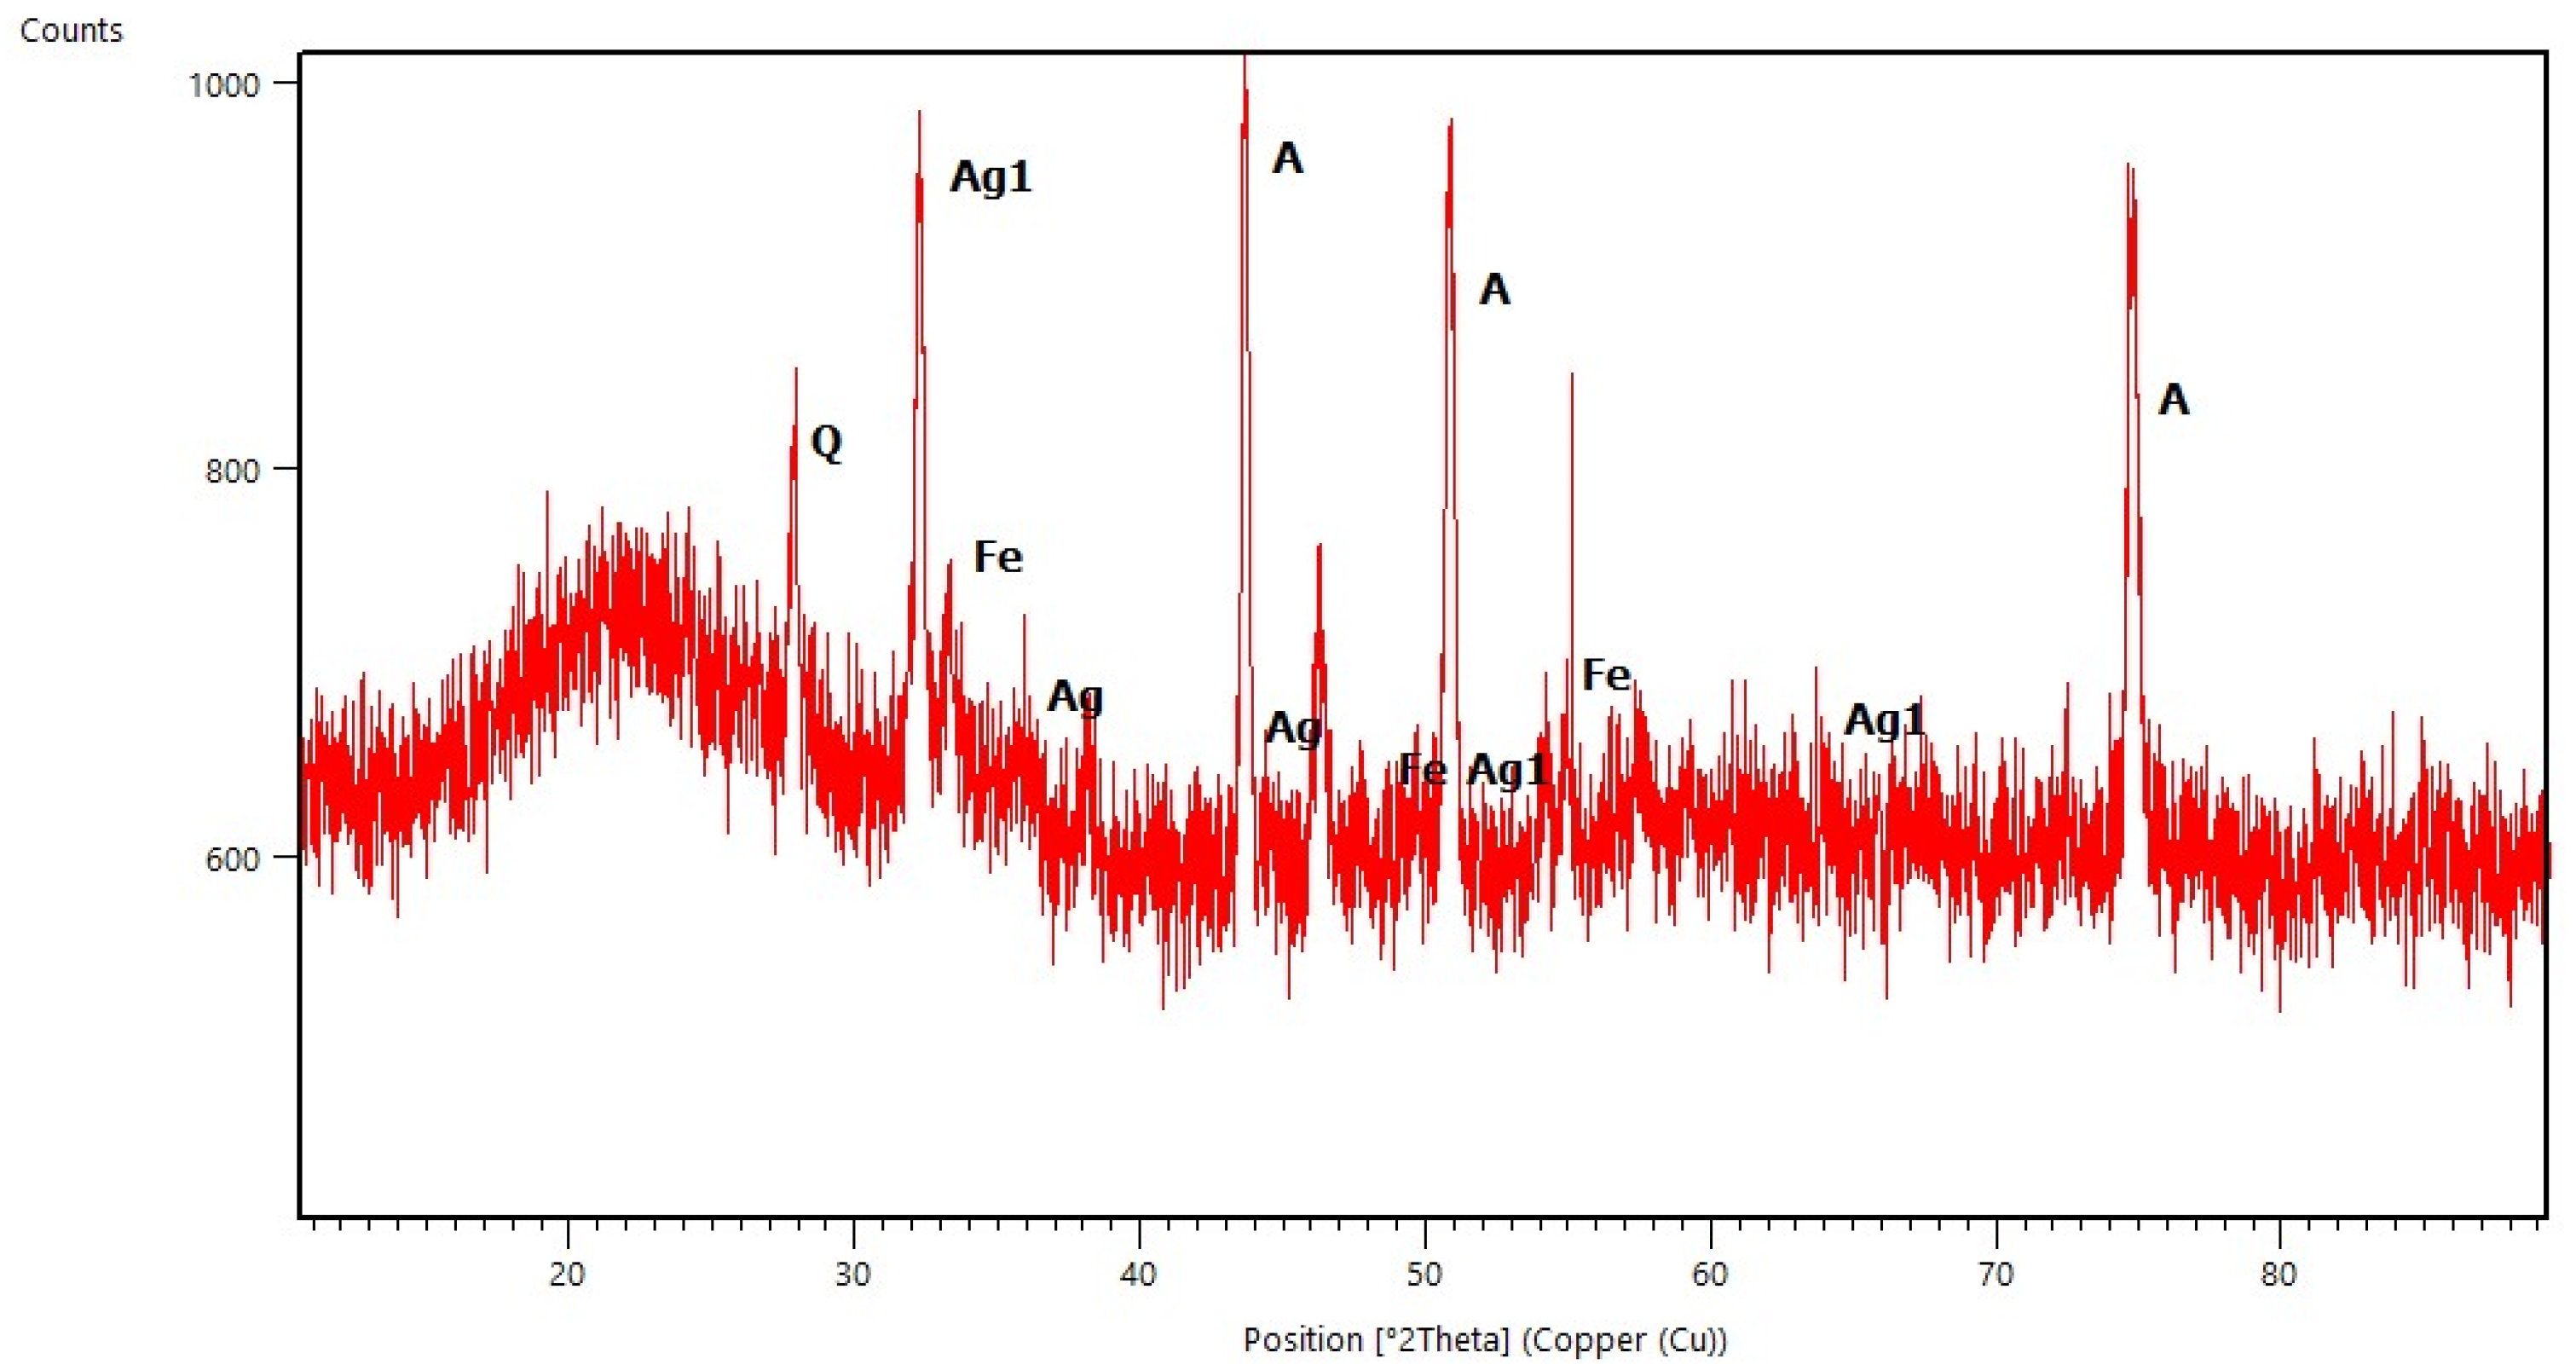
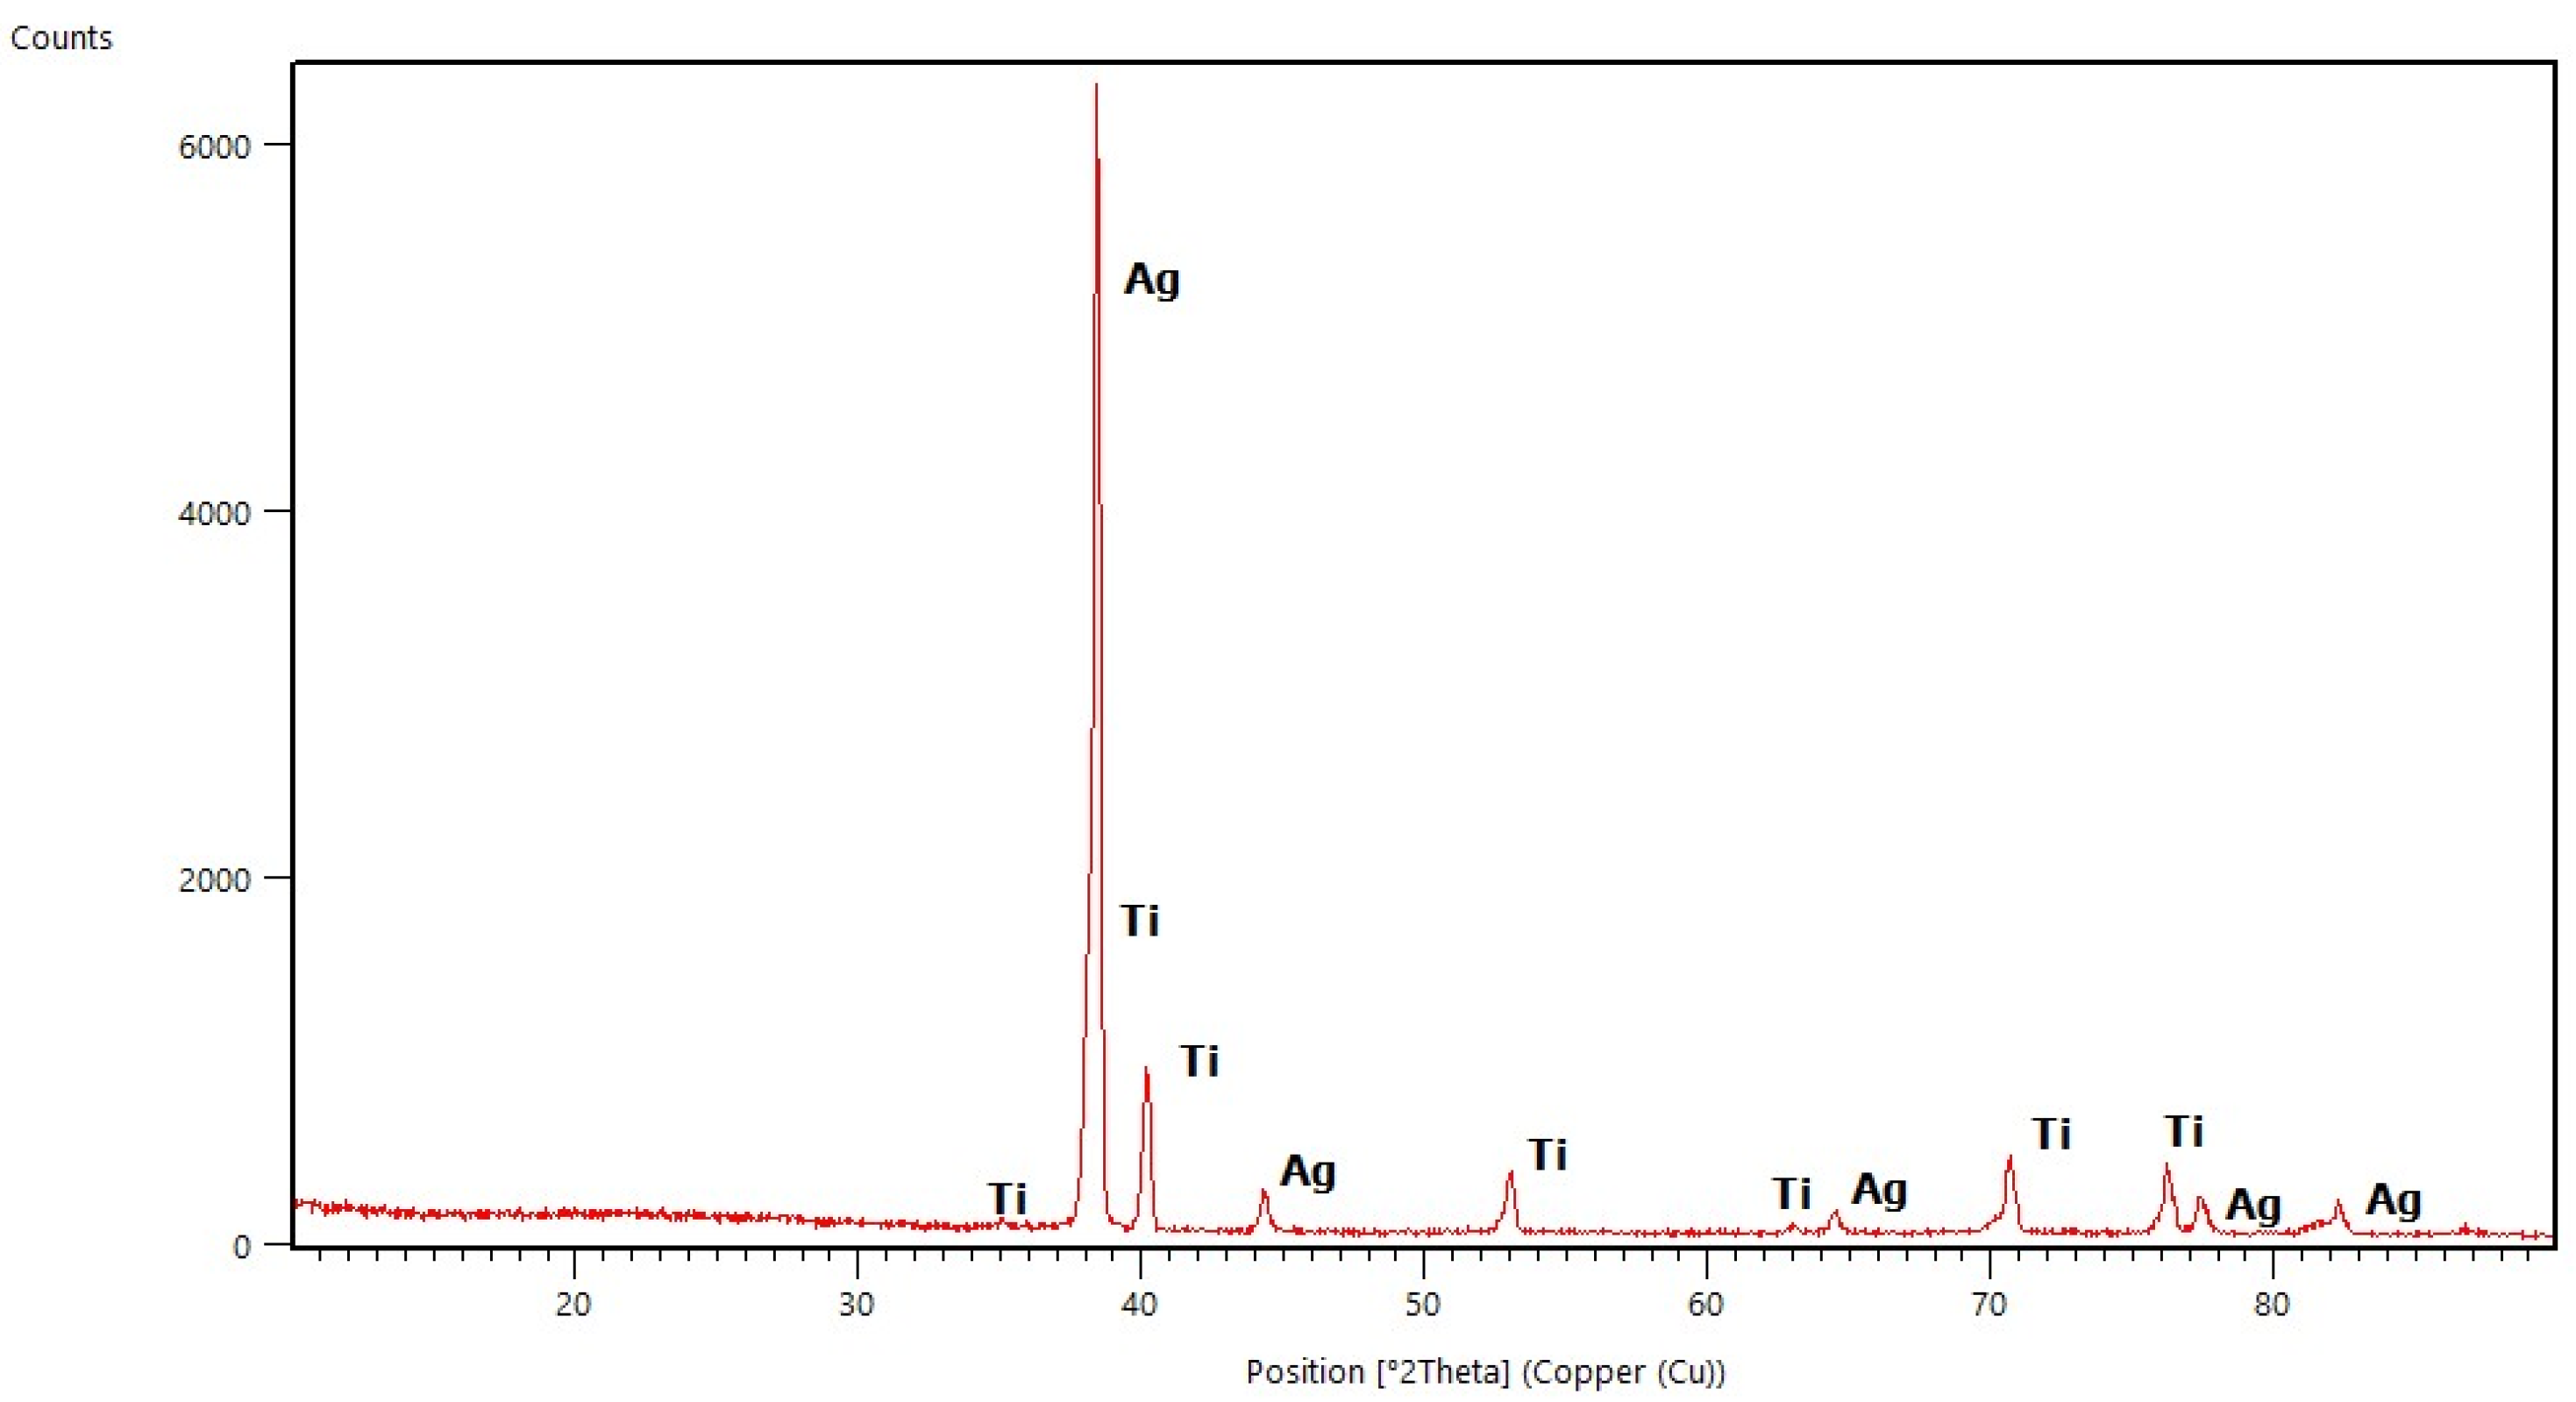
2.1. X-ray Diffraction Studies
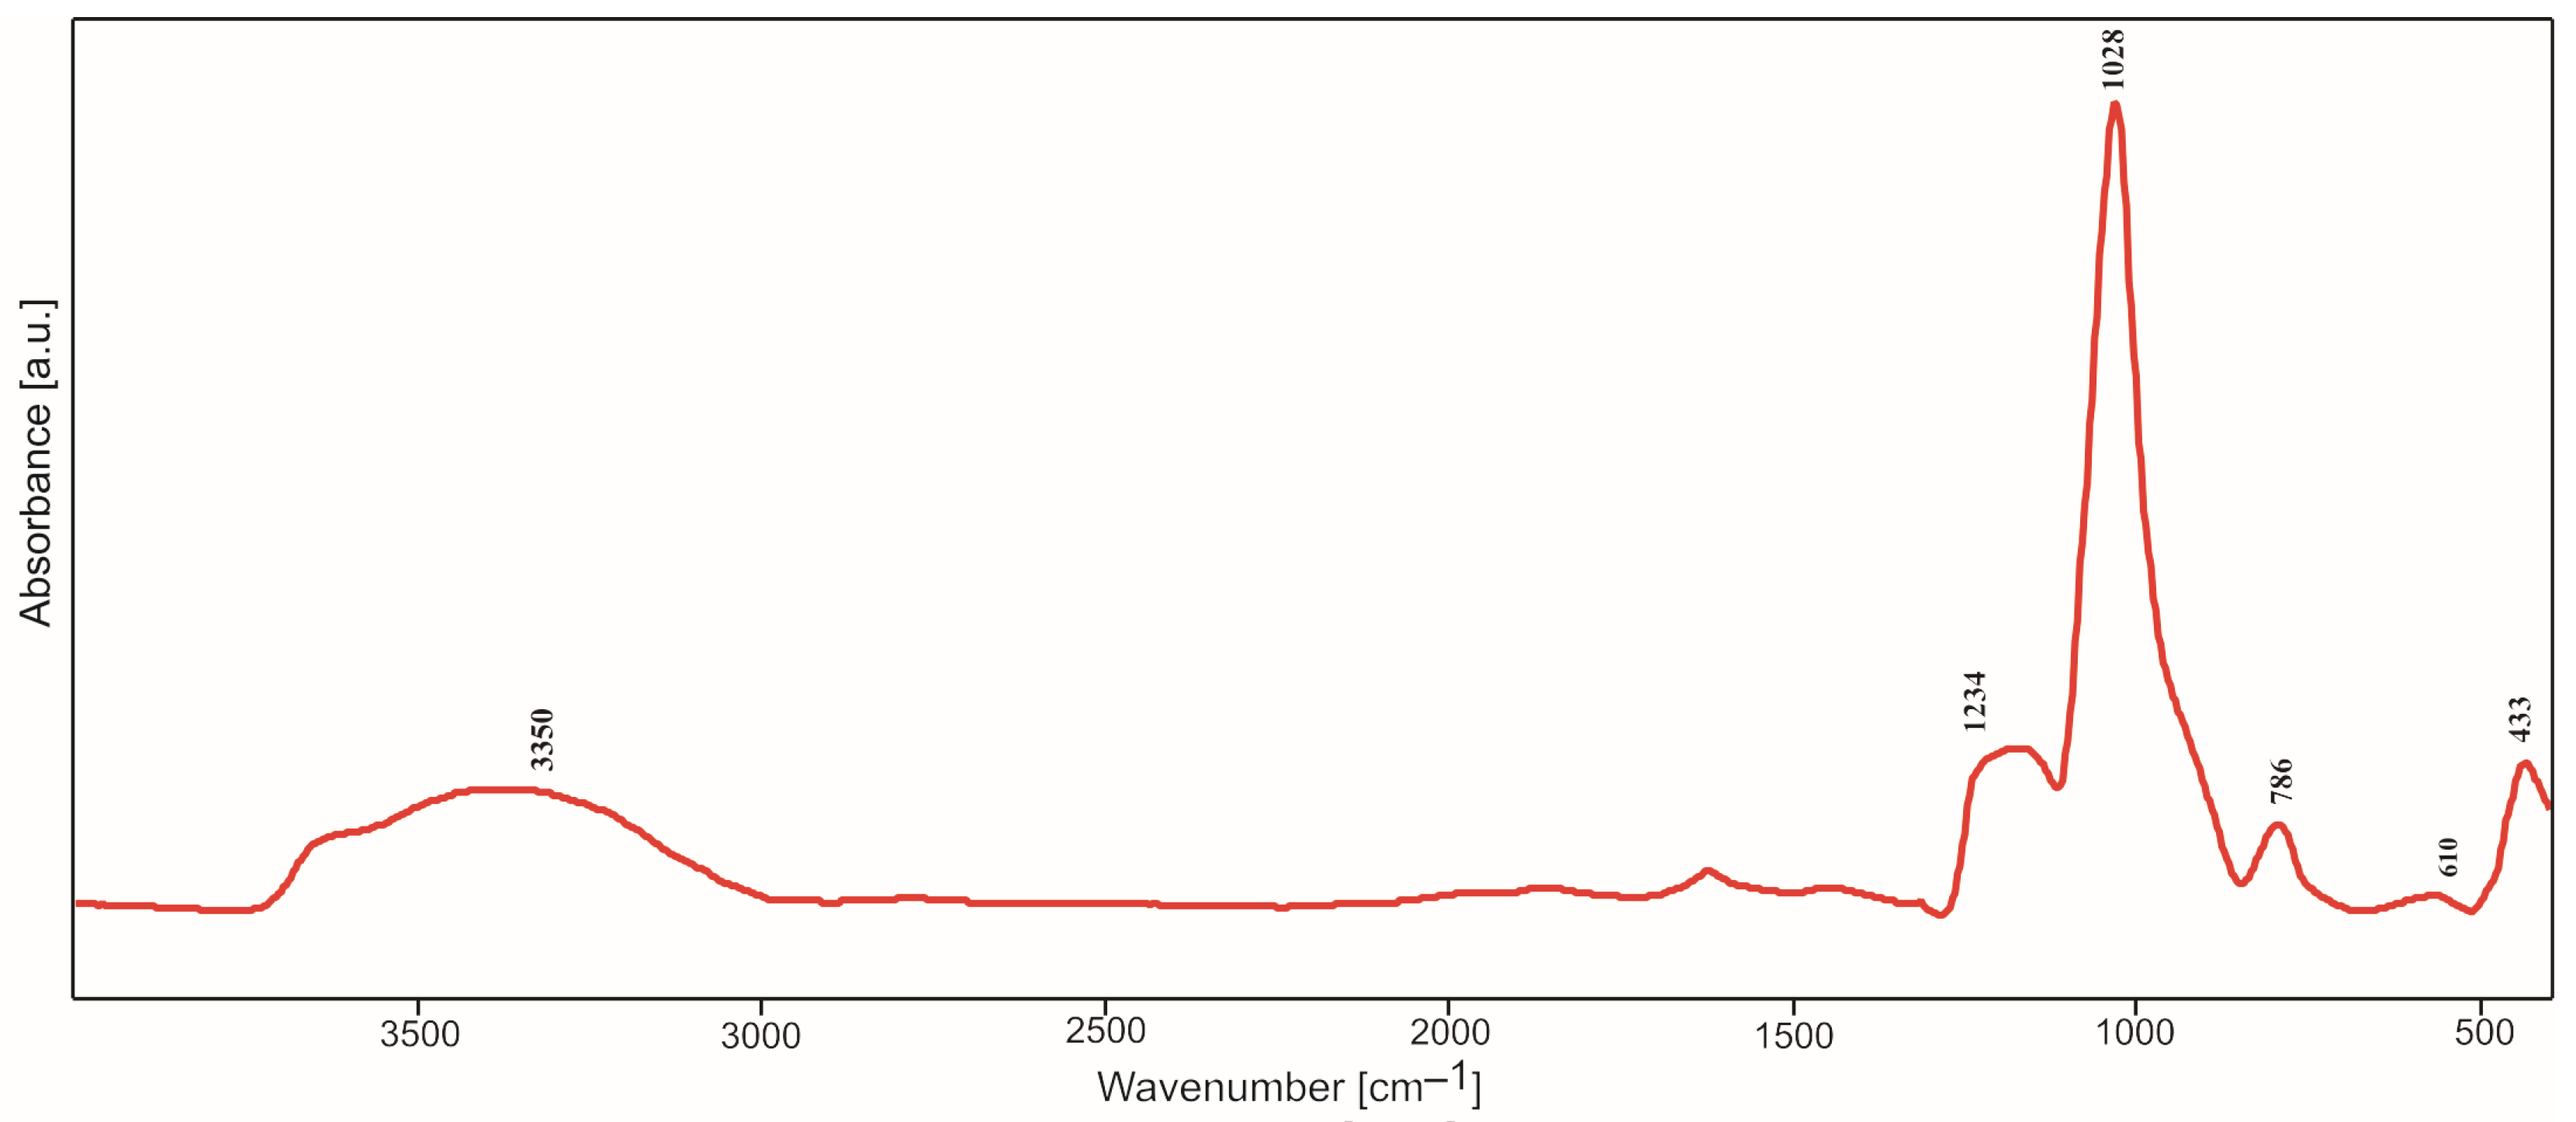
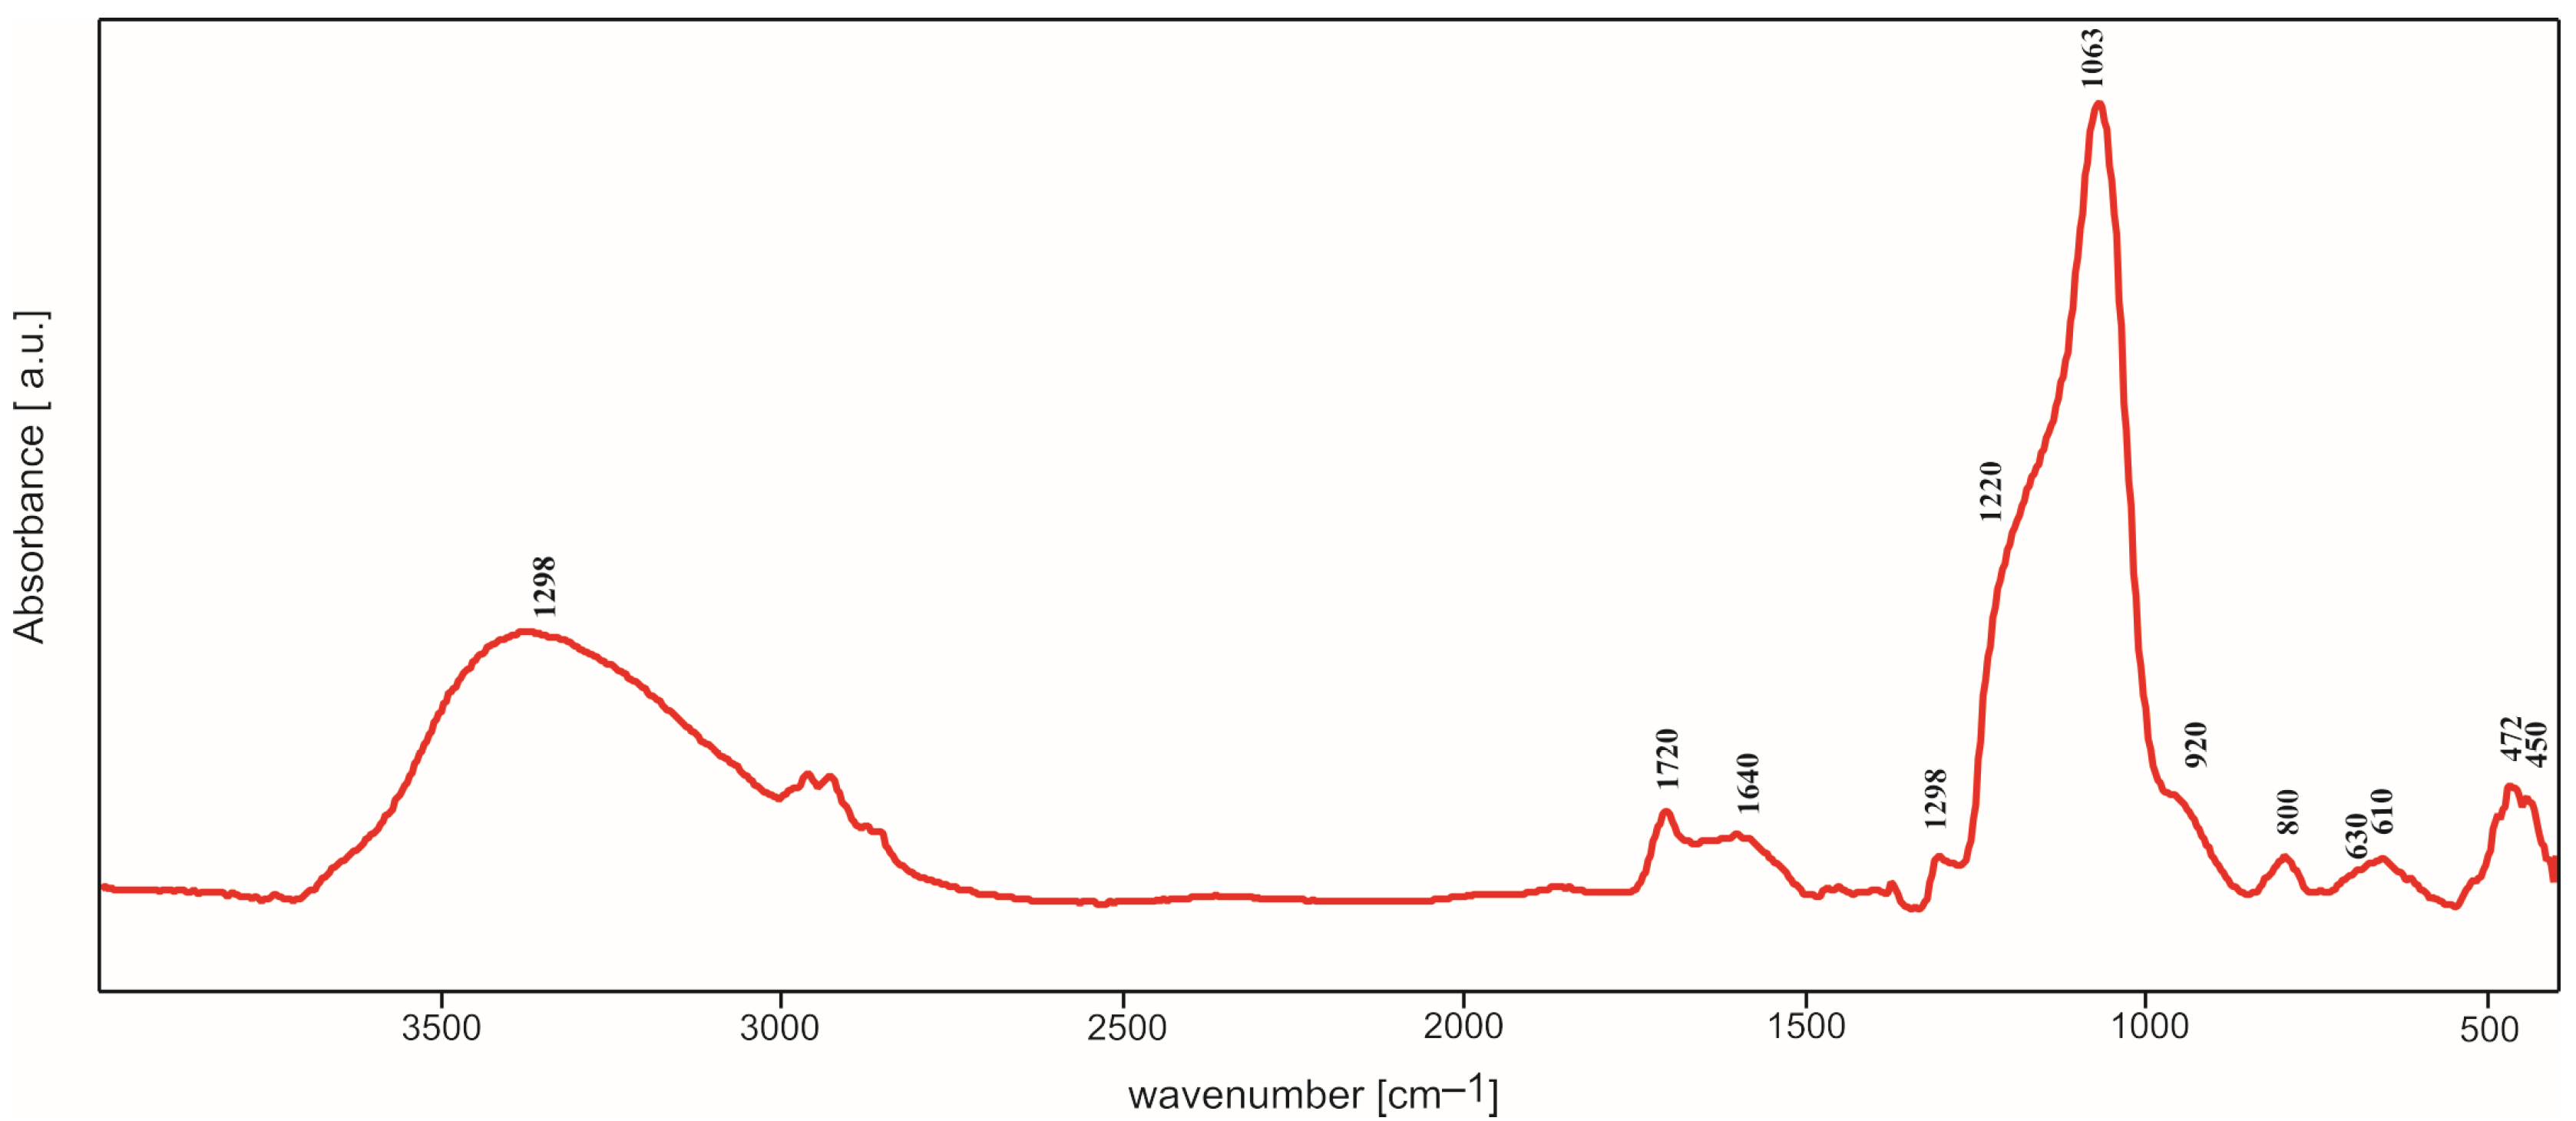
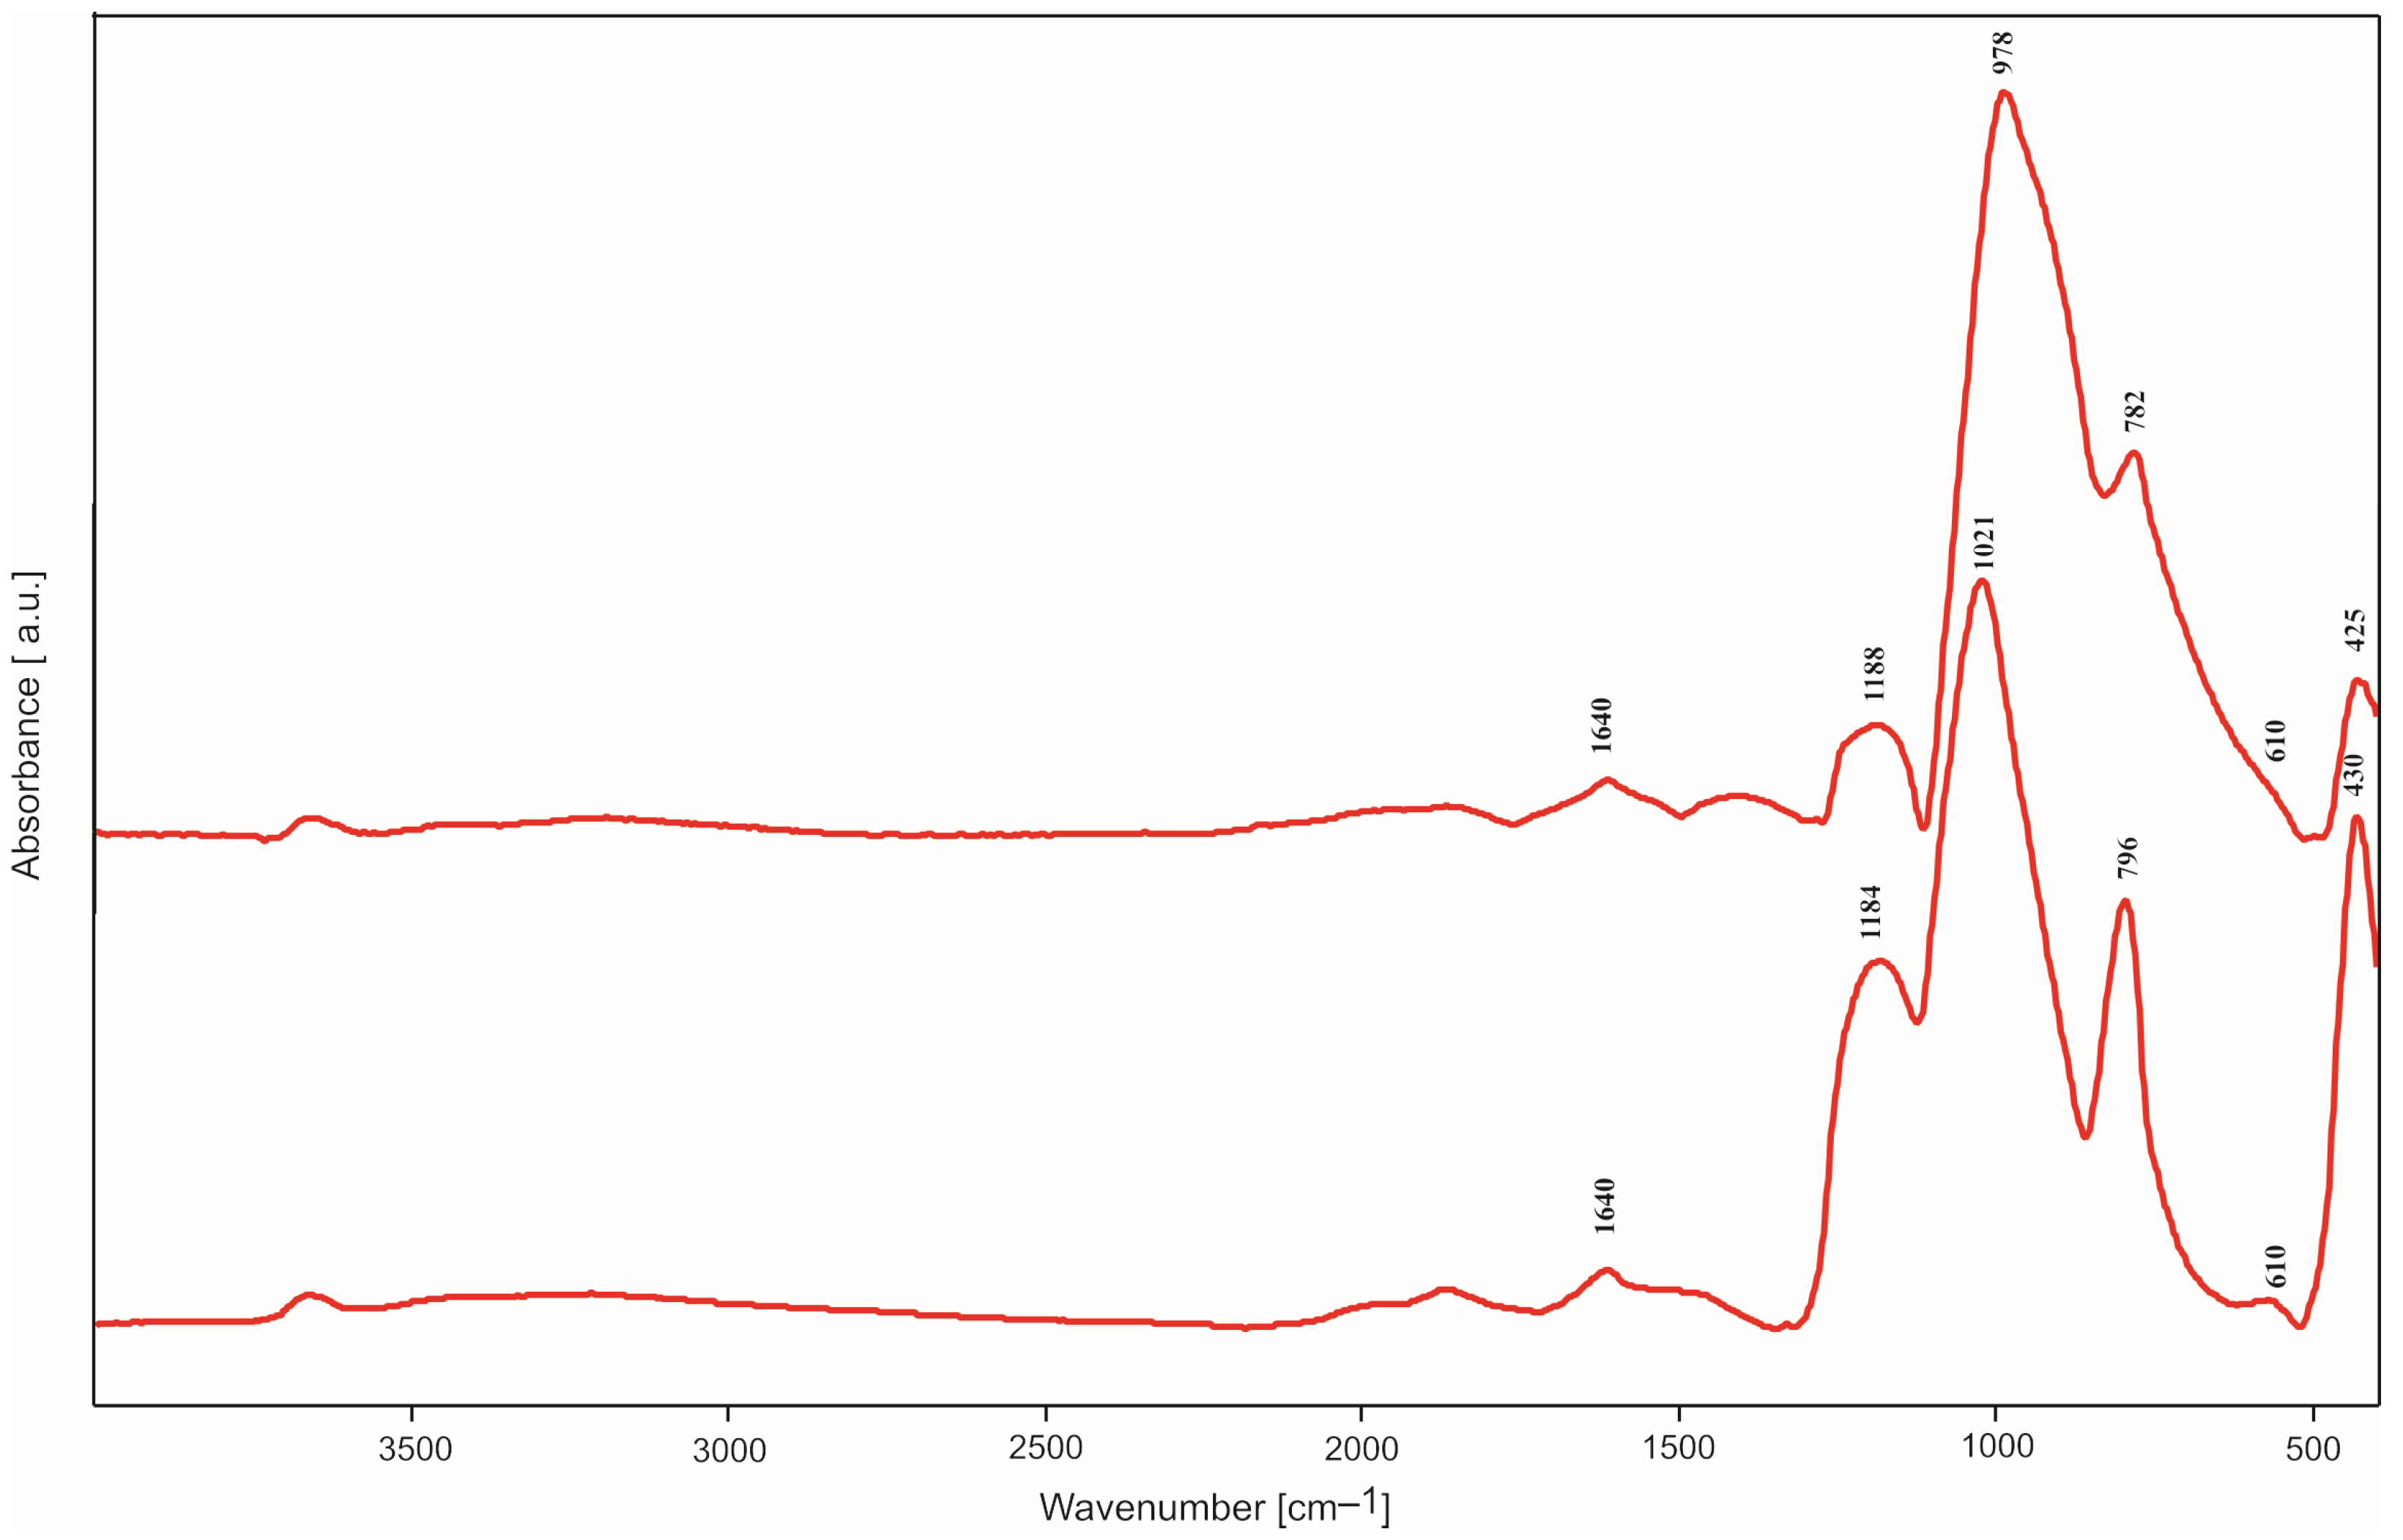
2.2. IR Spectroscopy Studies
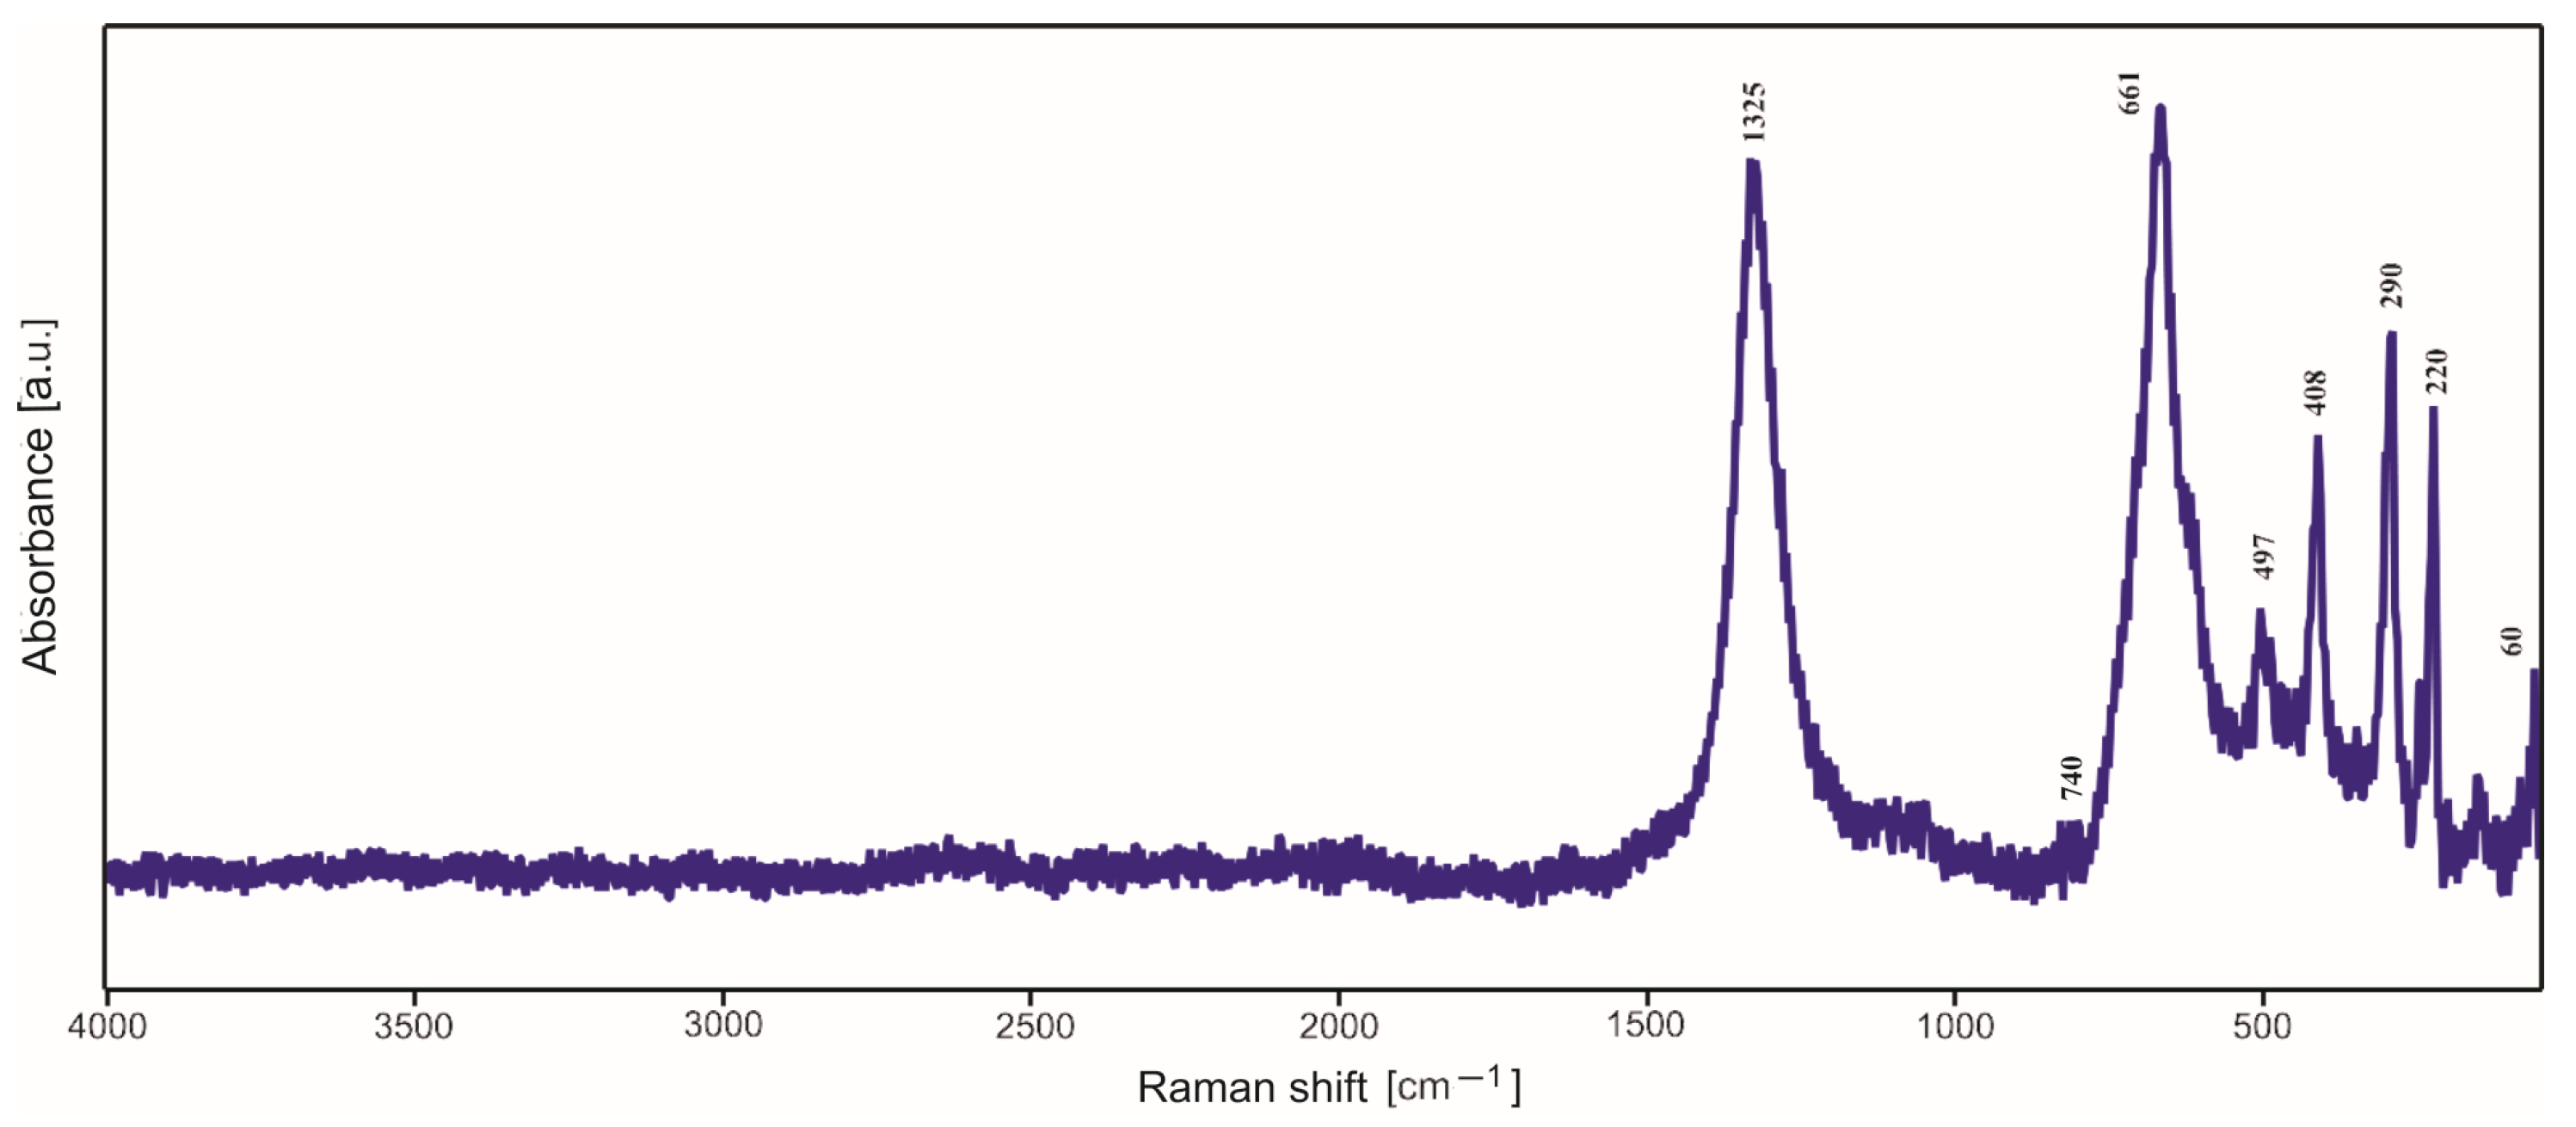
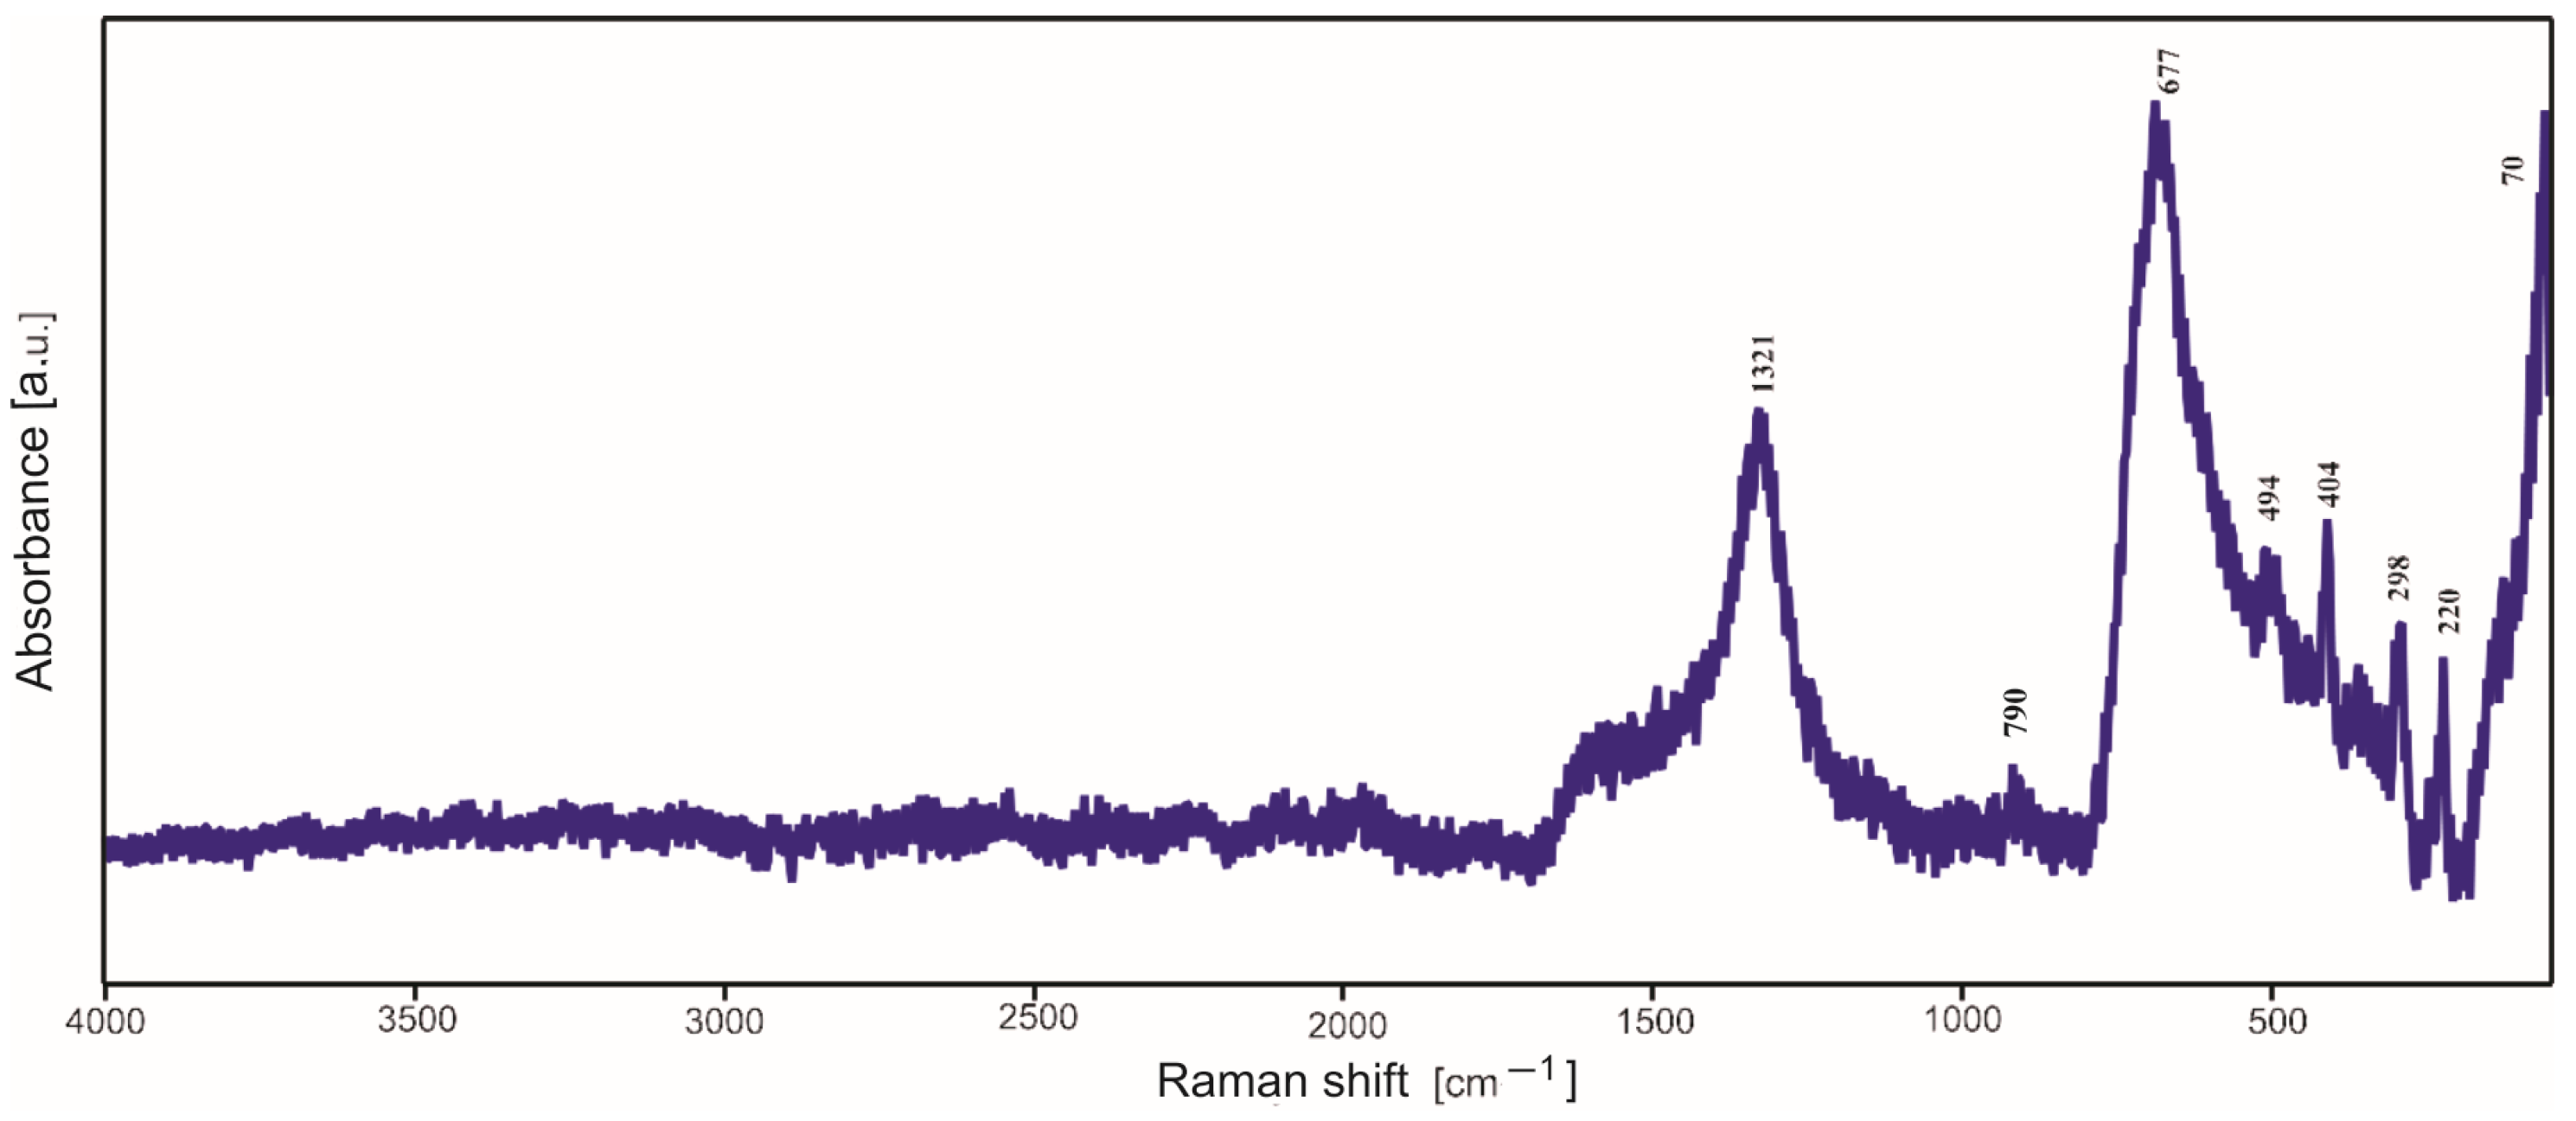
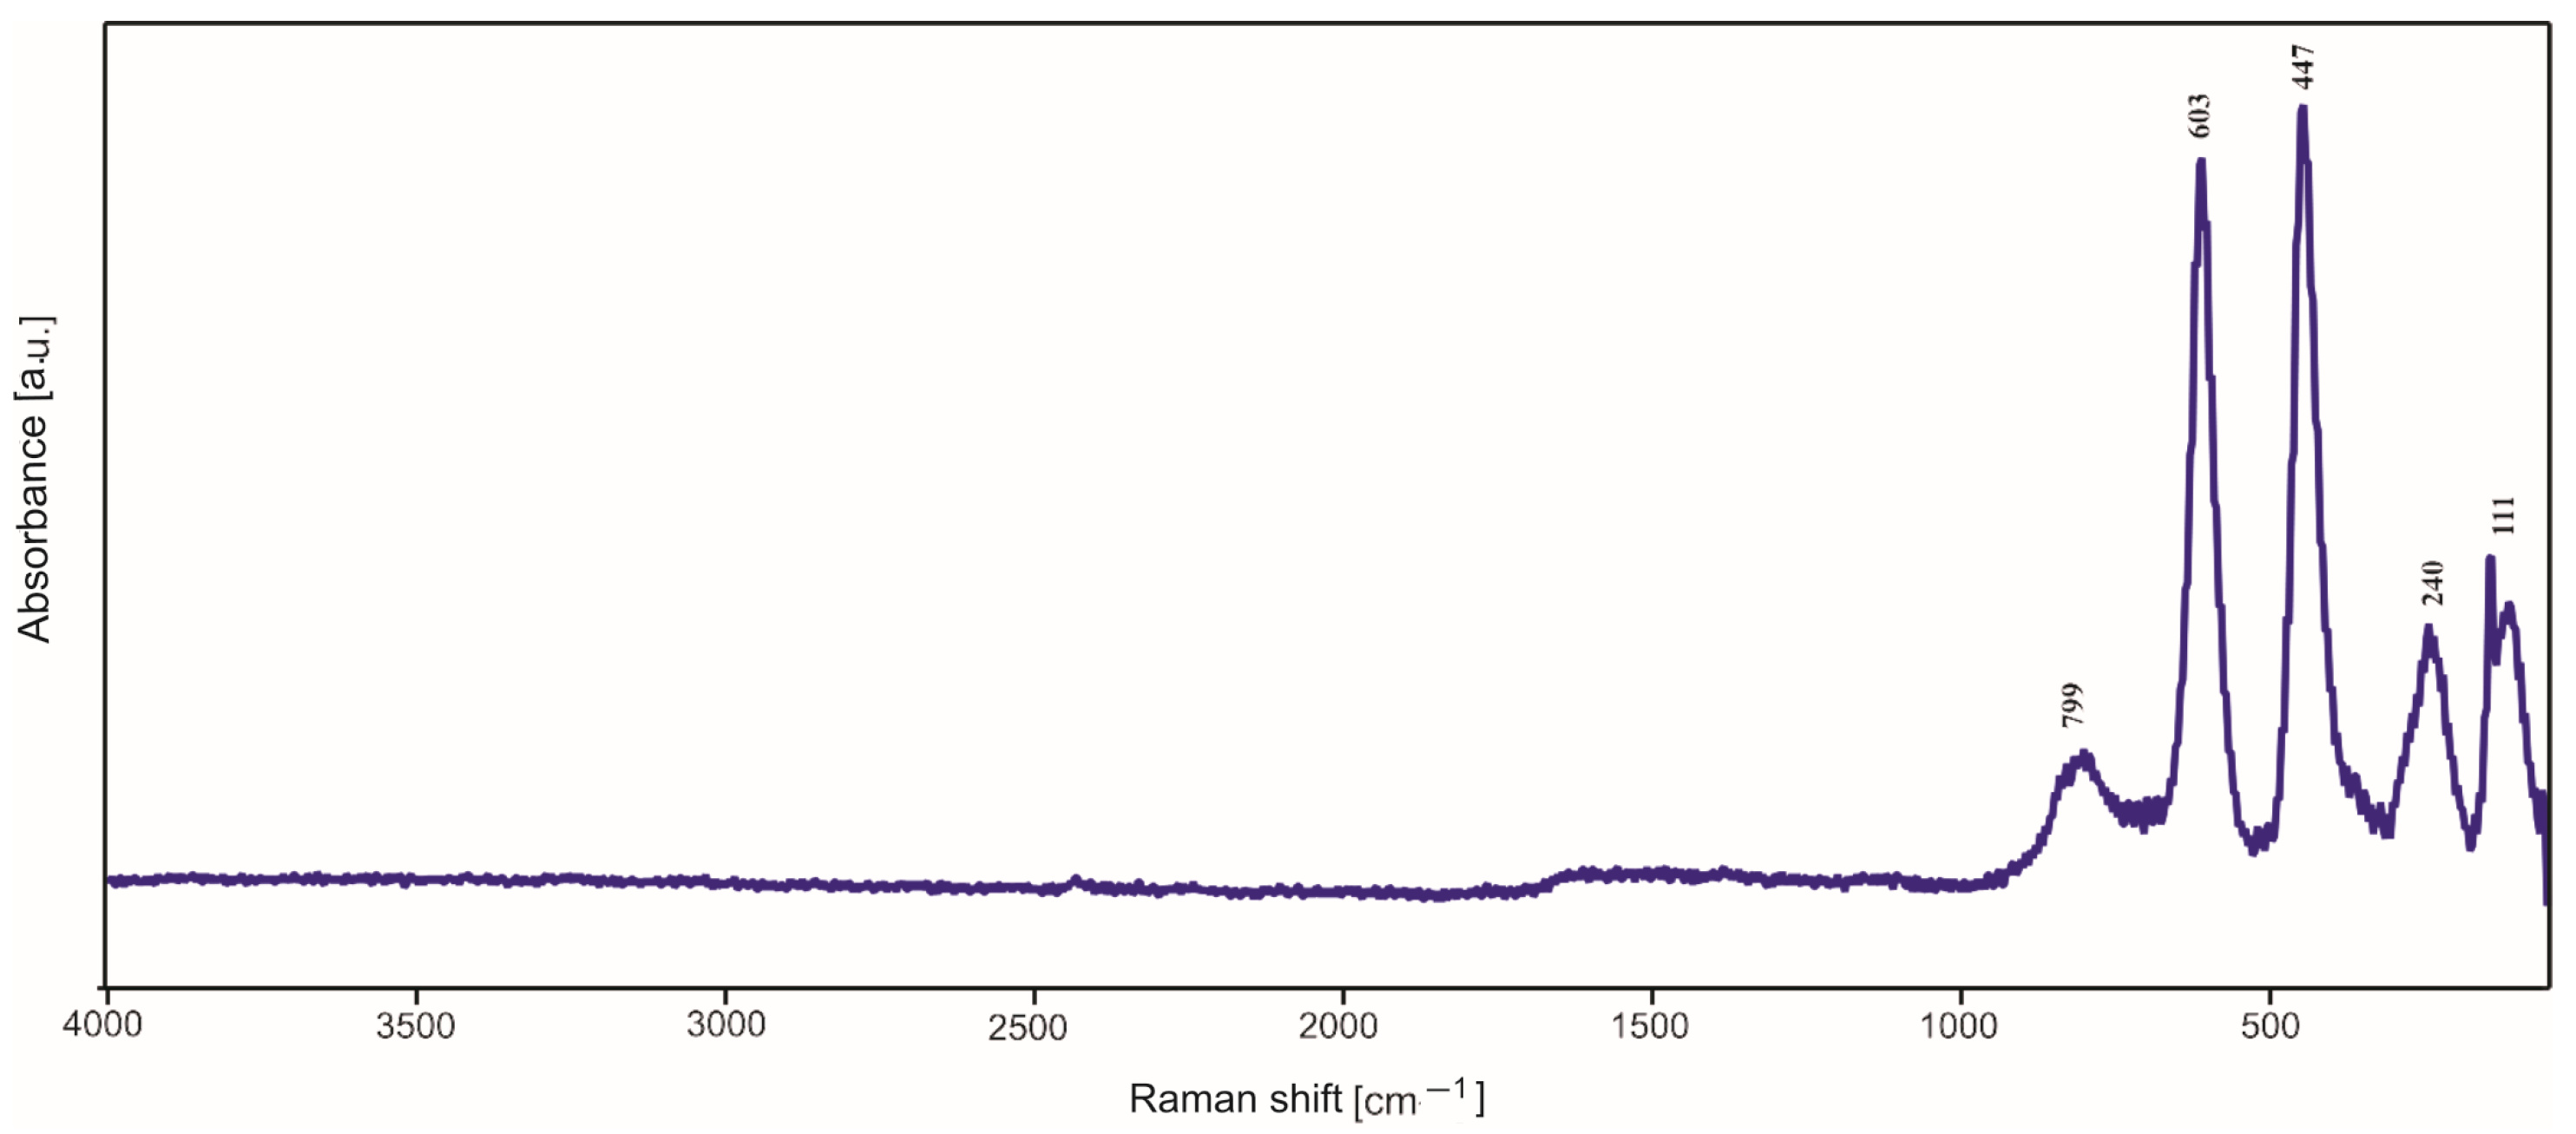
2.3. Raman Spectroscopy Studies
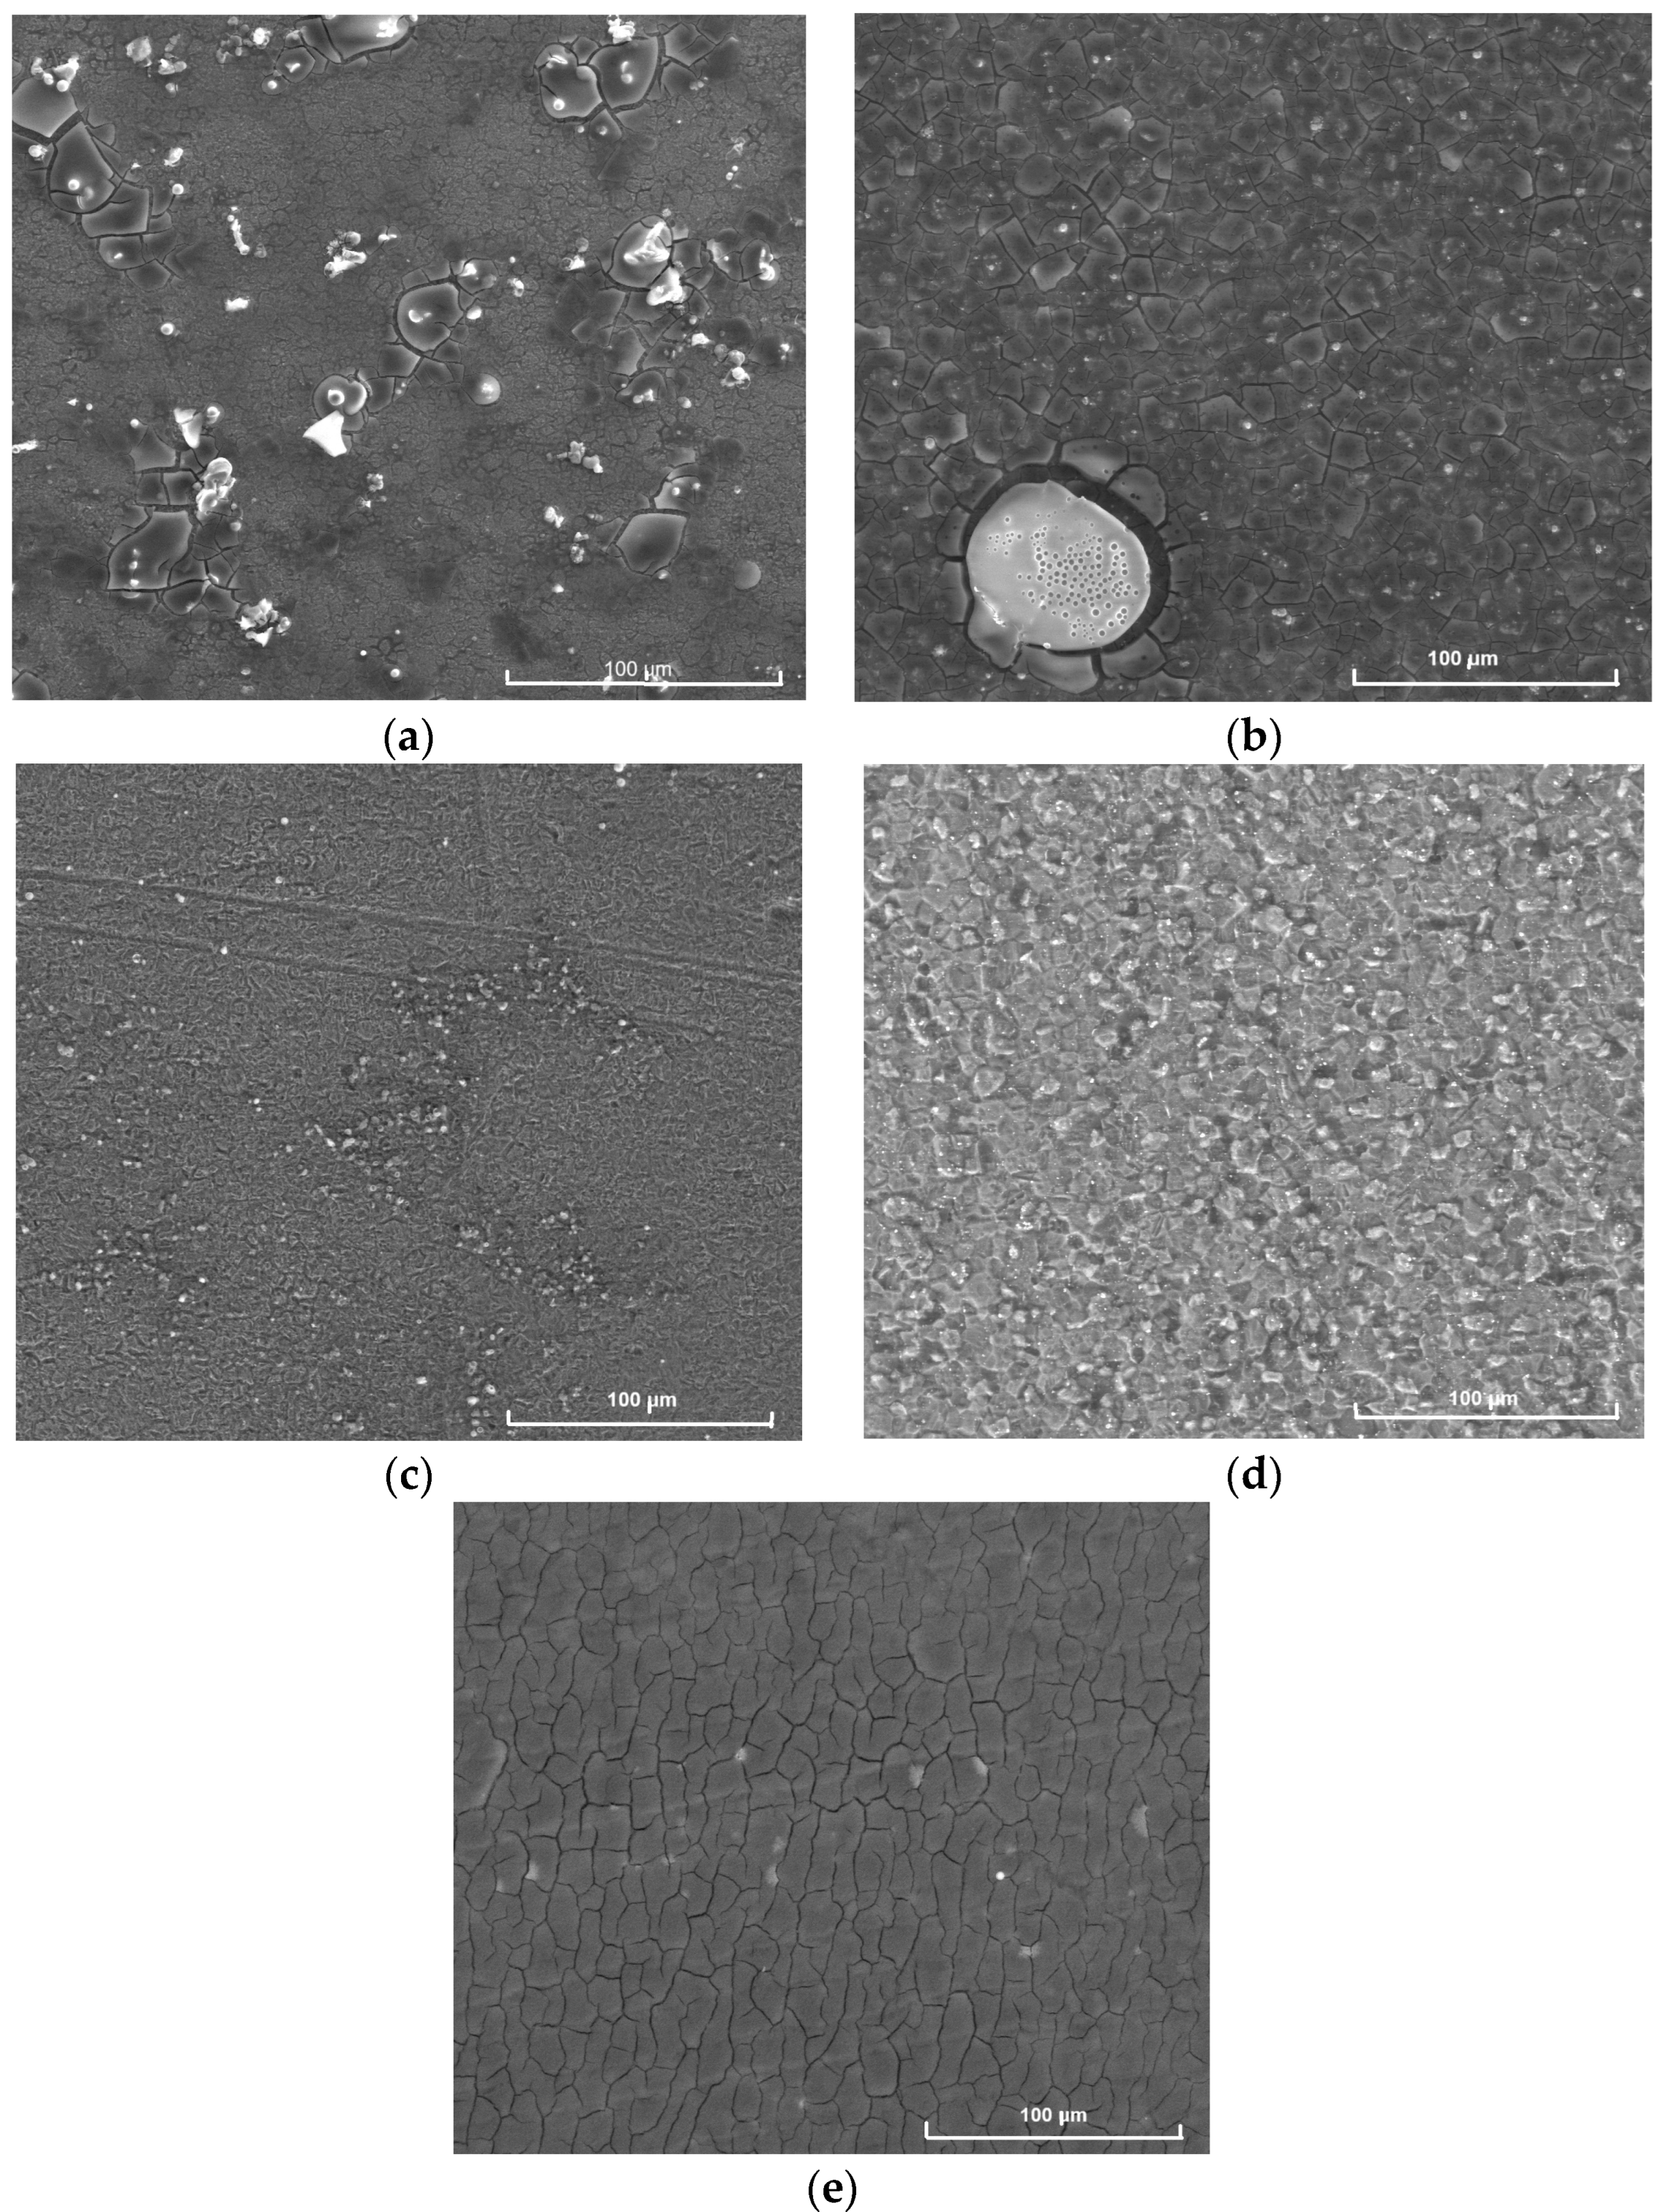
2.4. SEM Studies
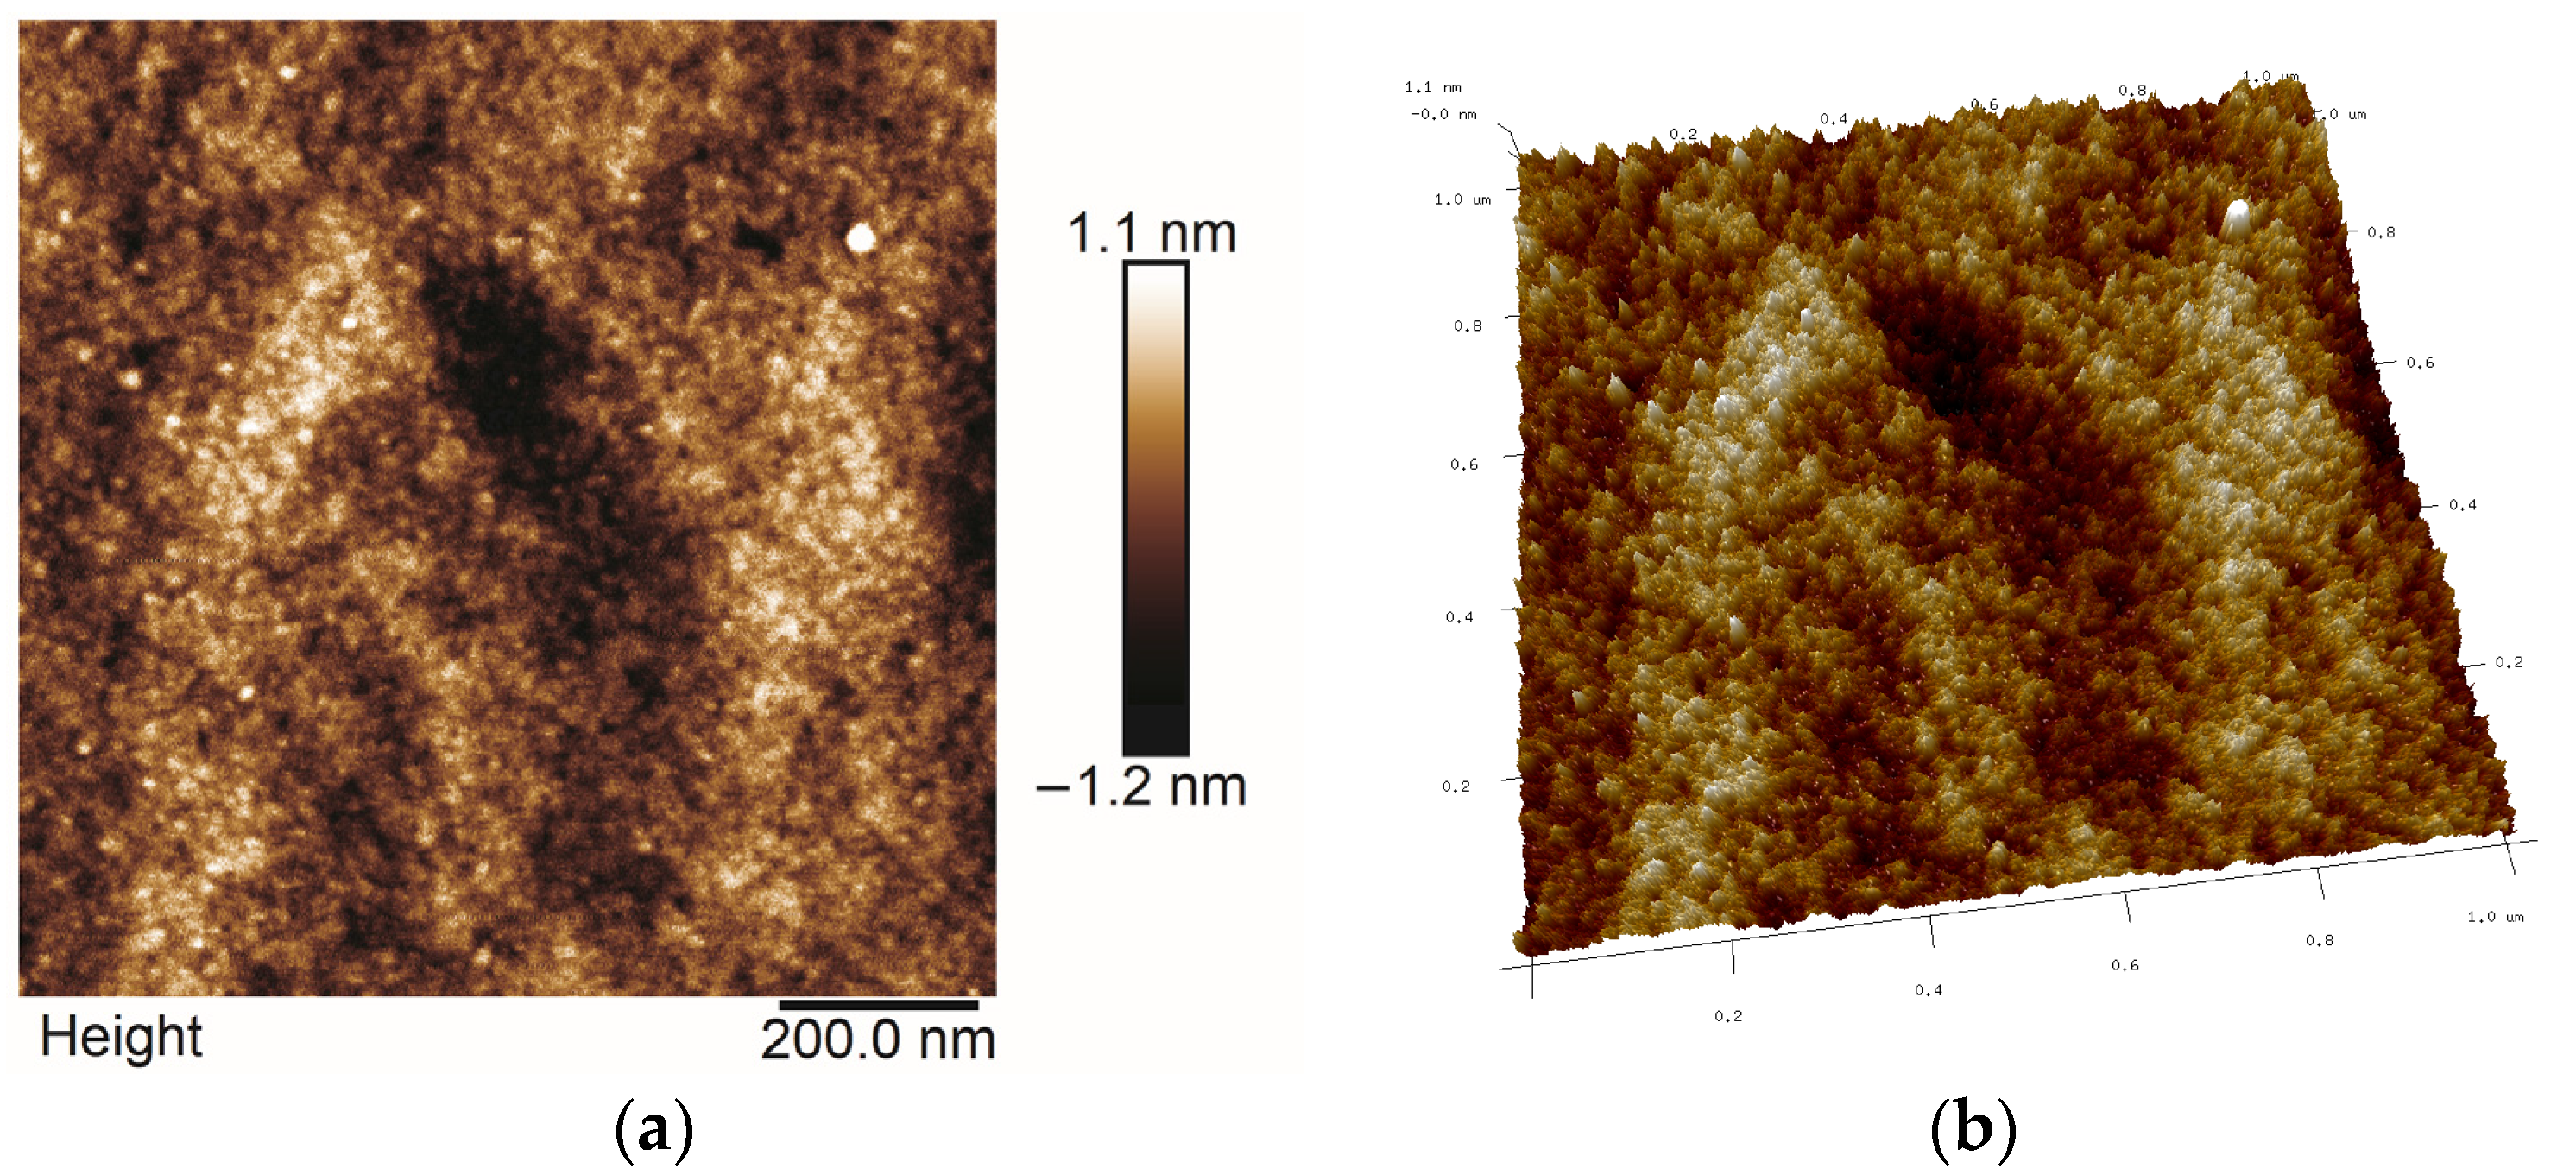
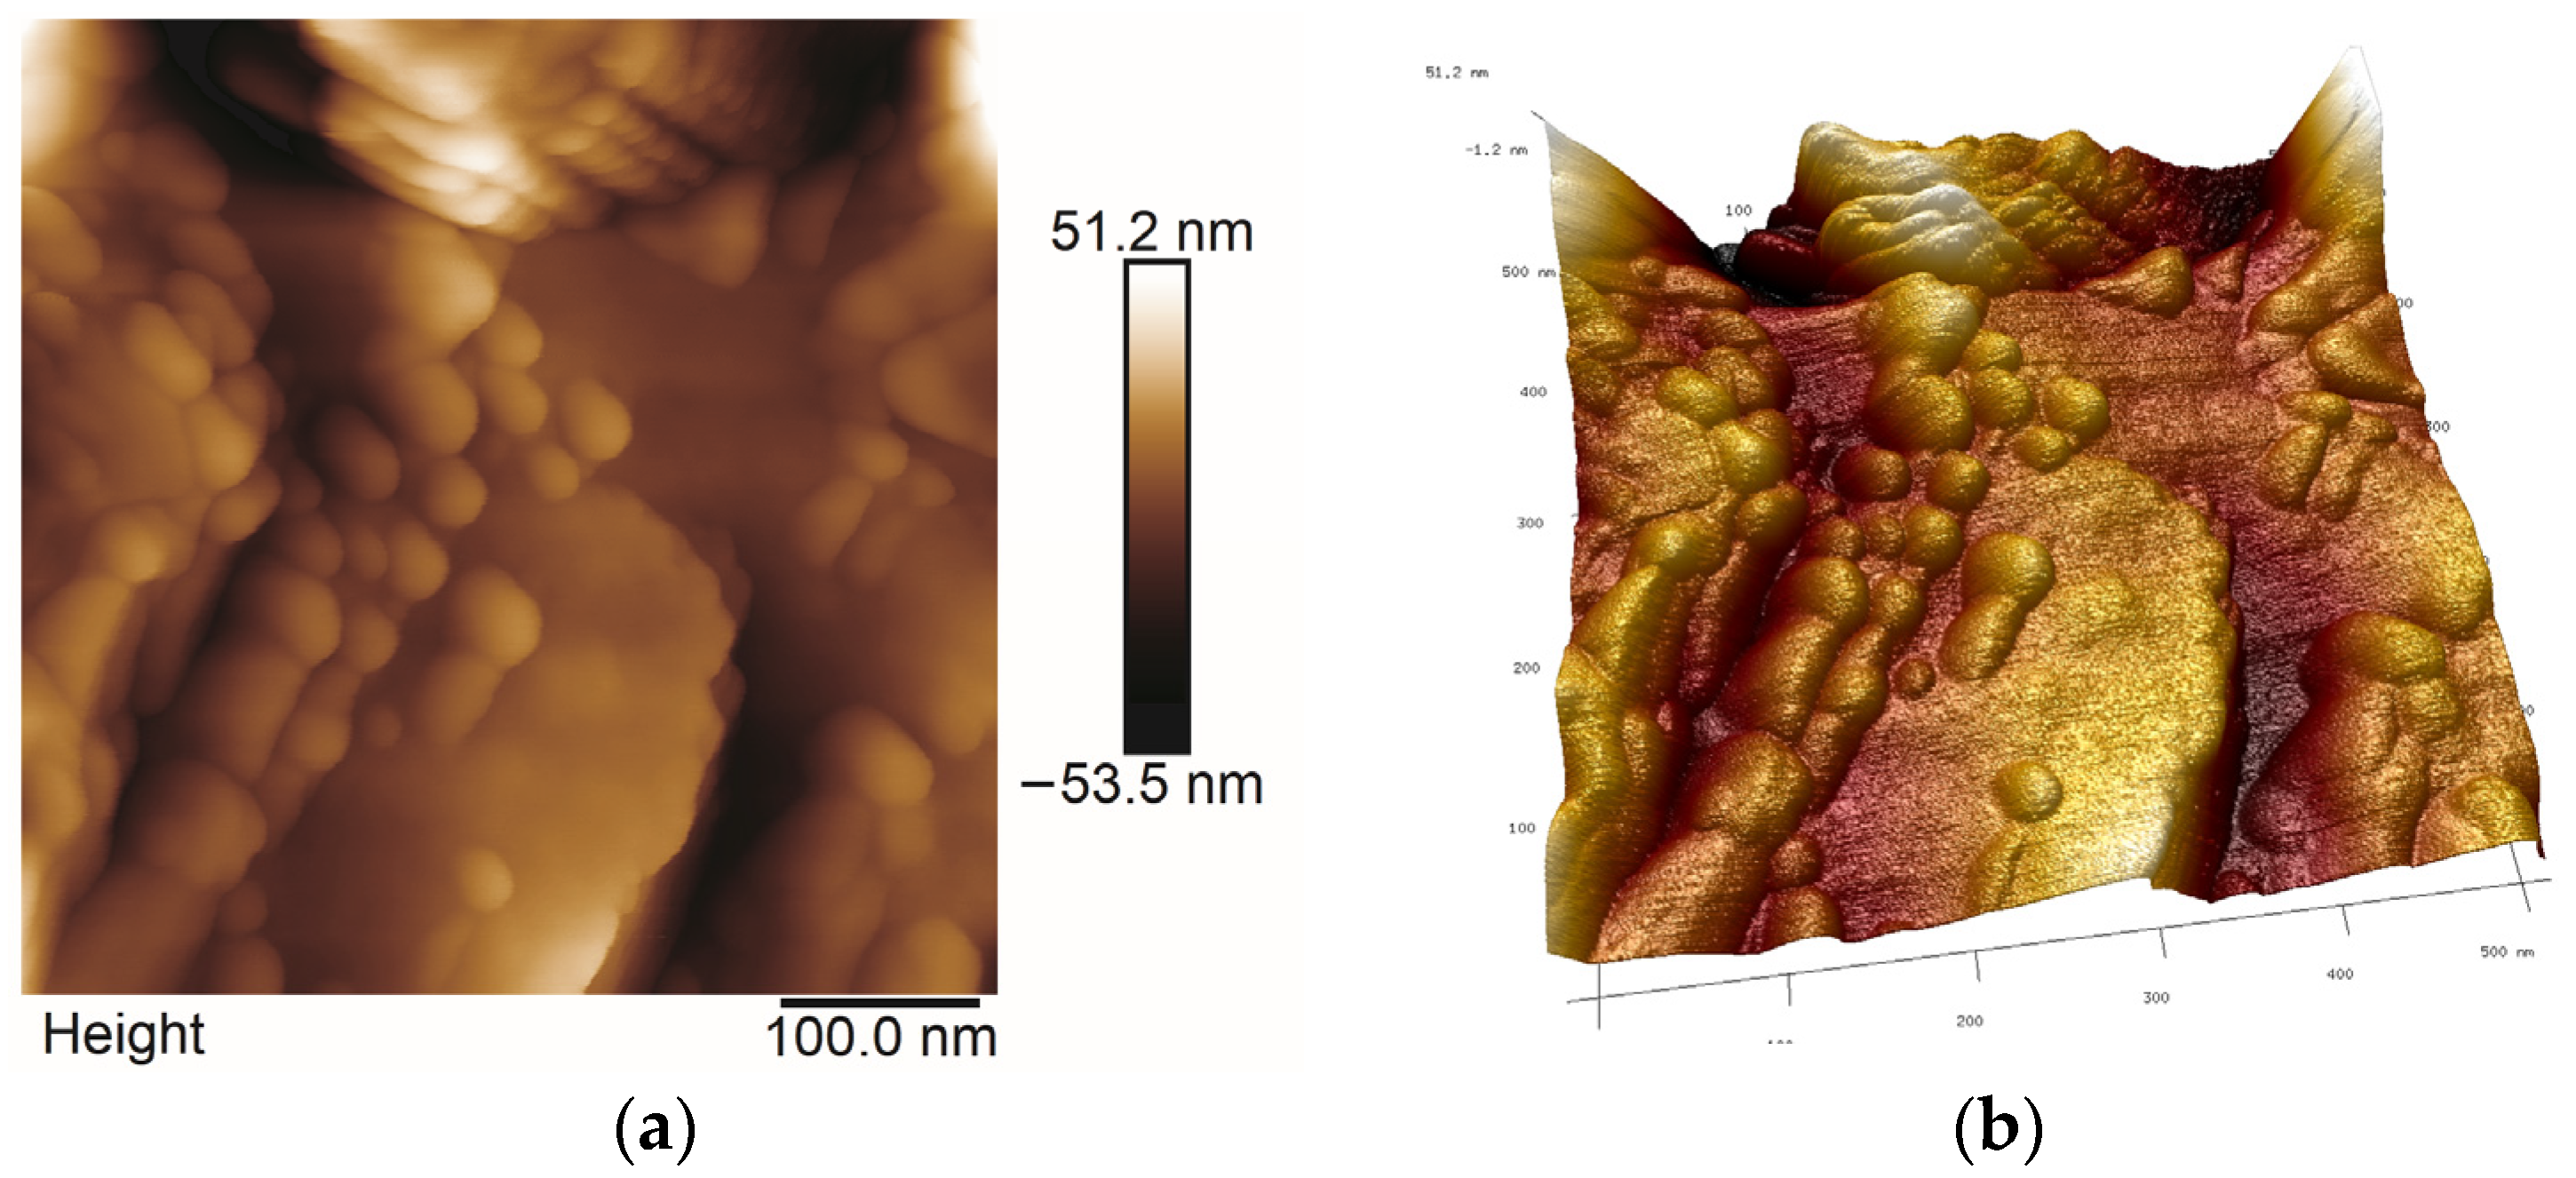
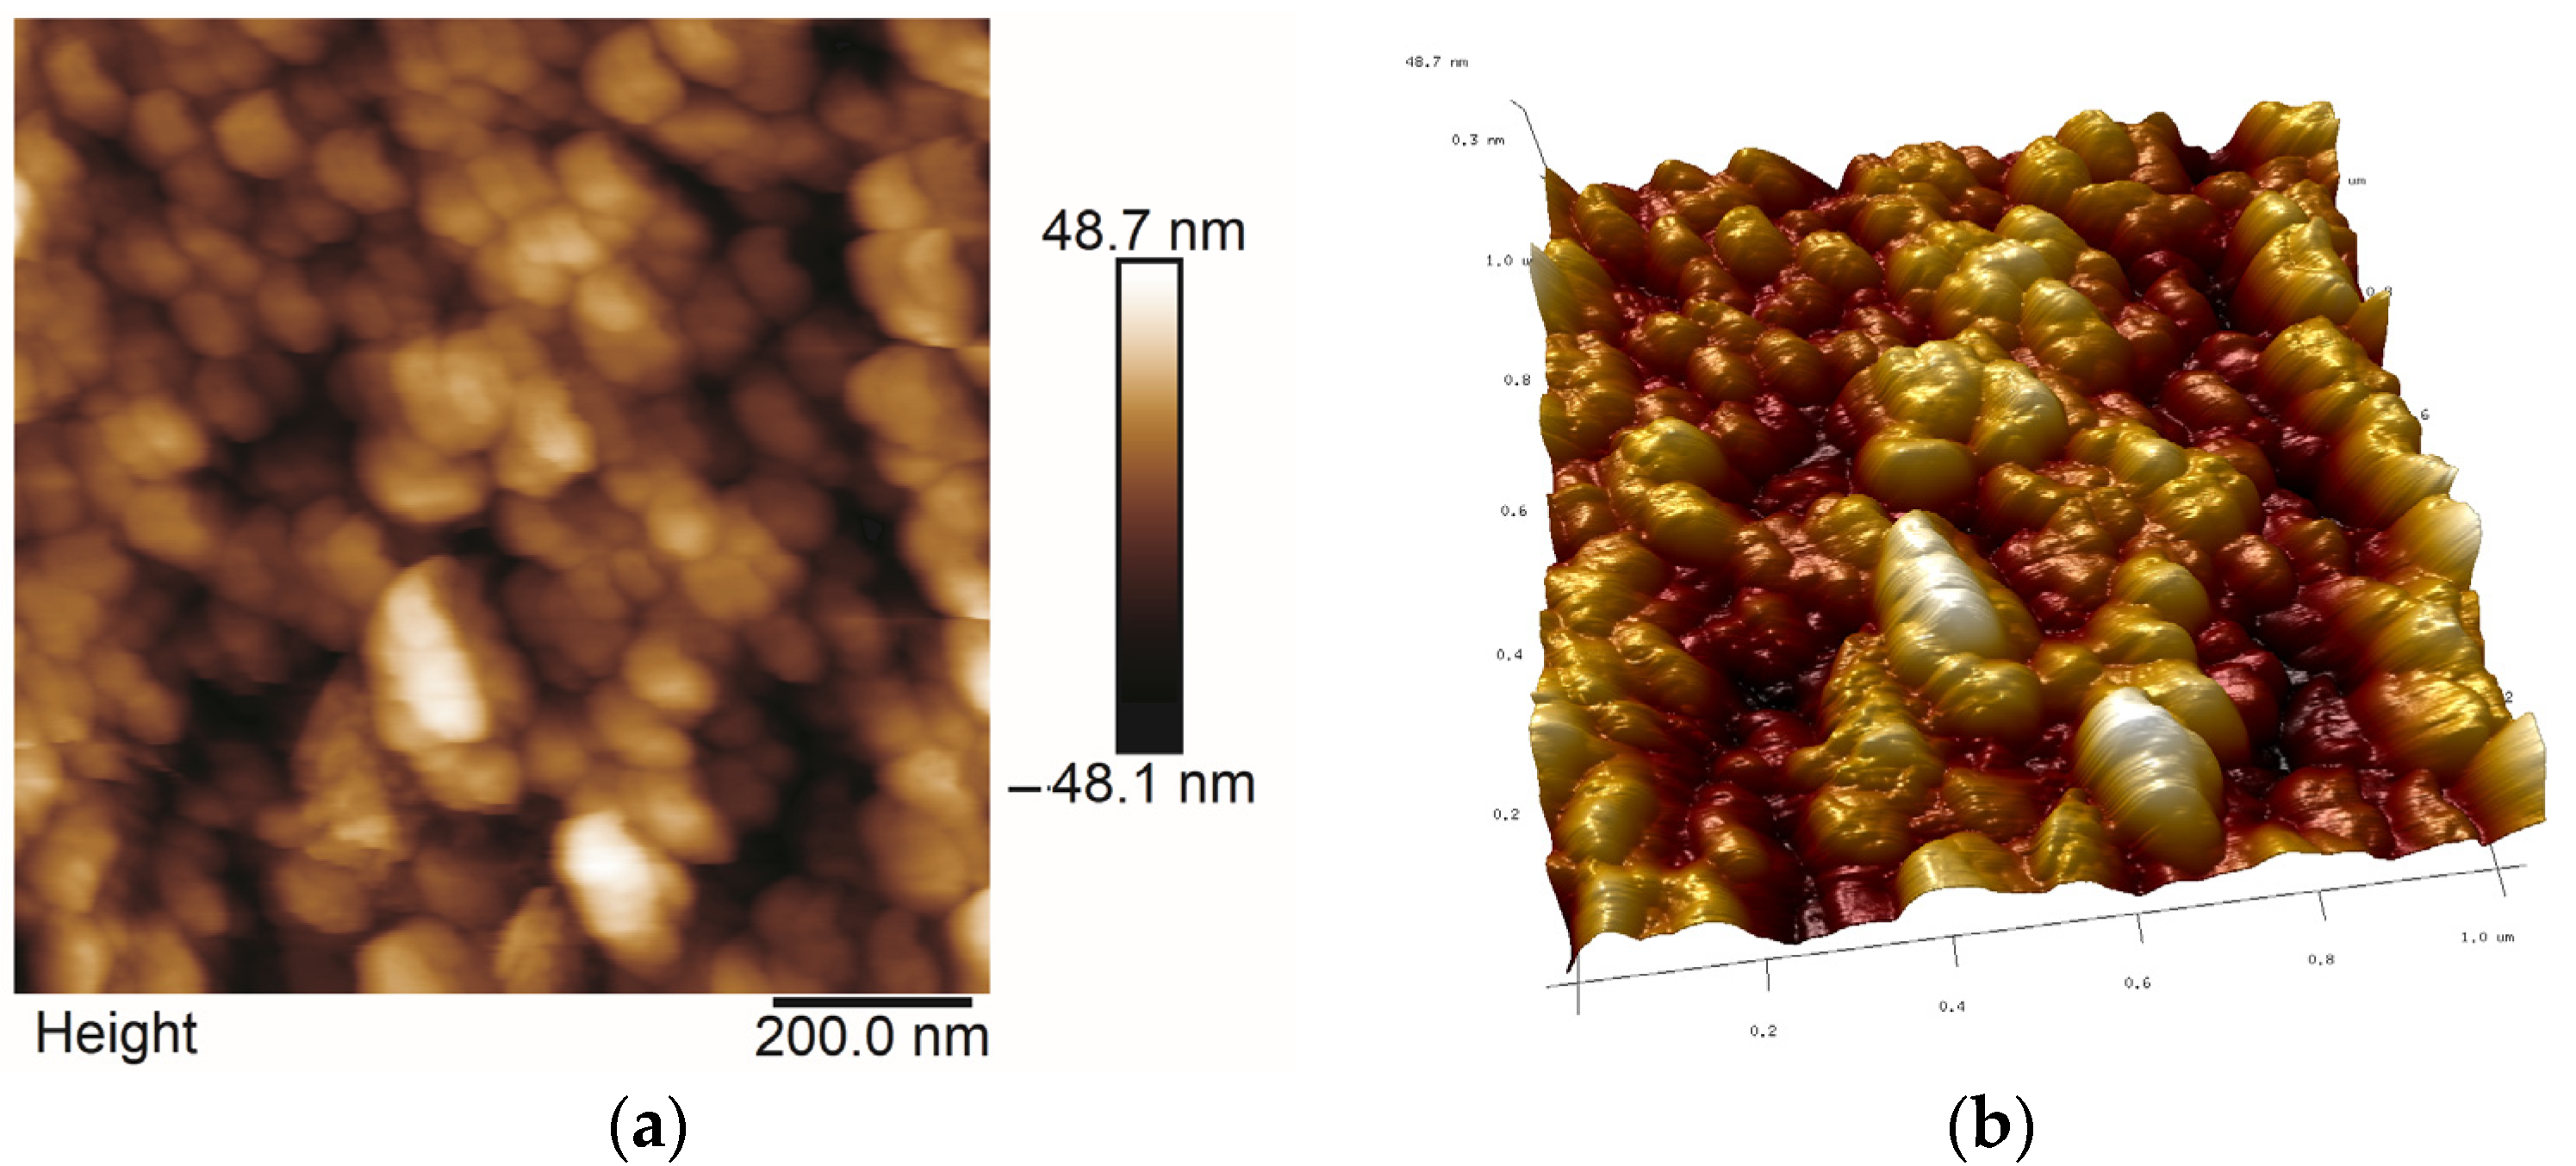
2.5. AFM Studies
2.6. Wetting Angle Value Measurements
3. Discussion
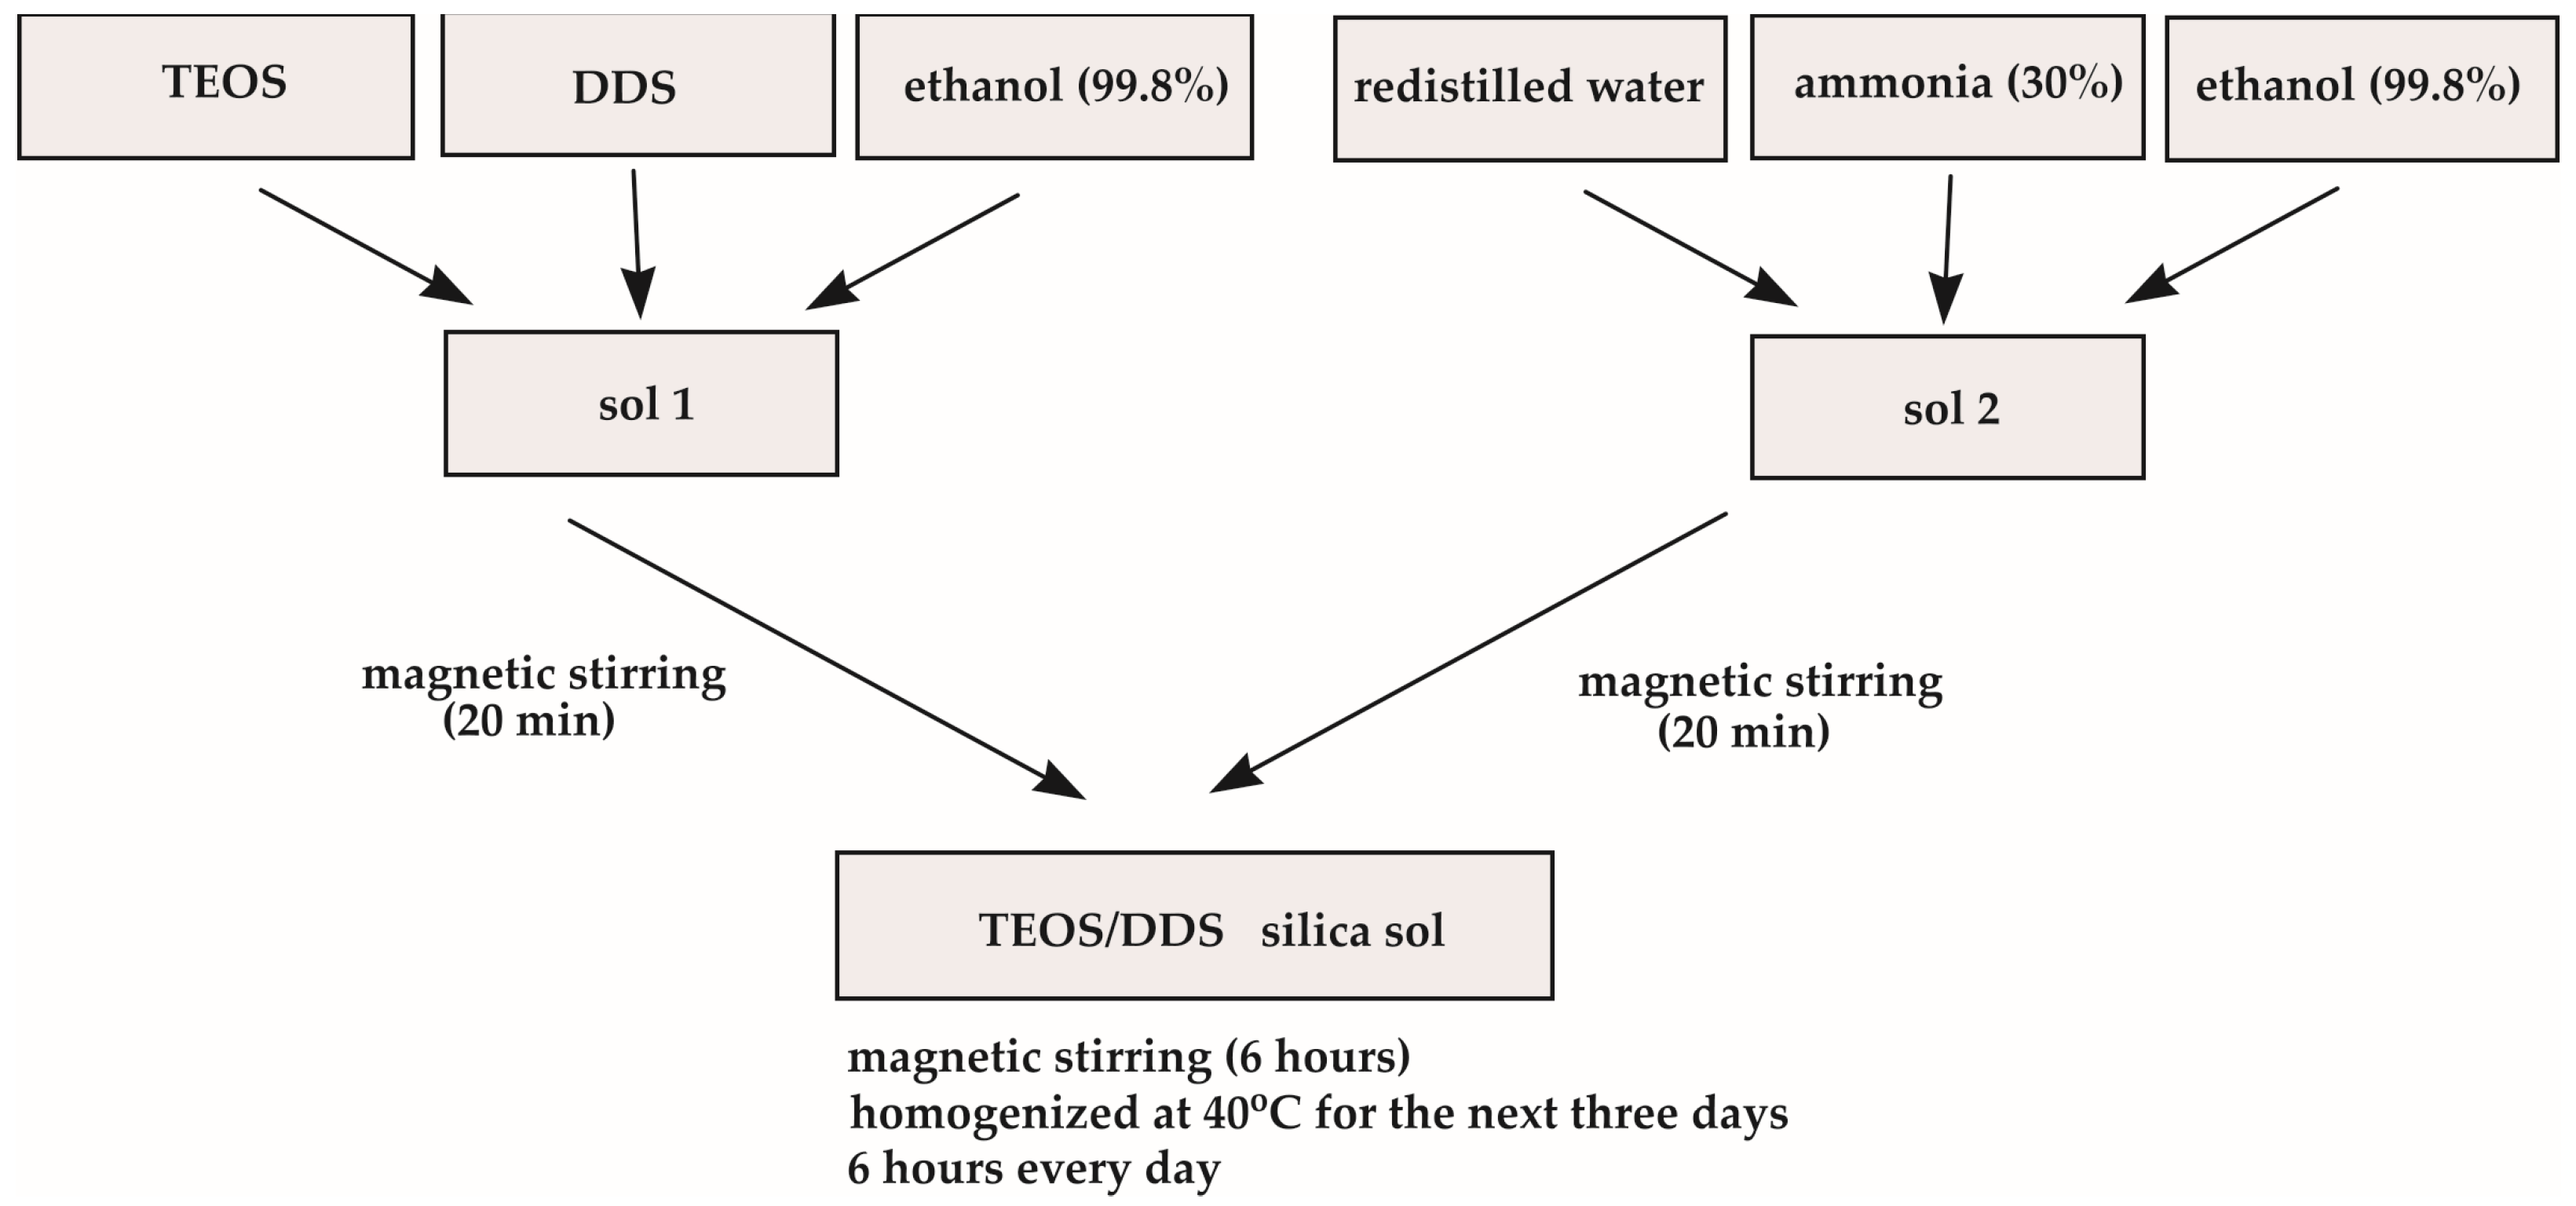
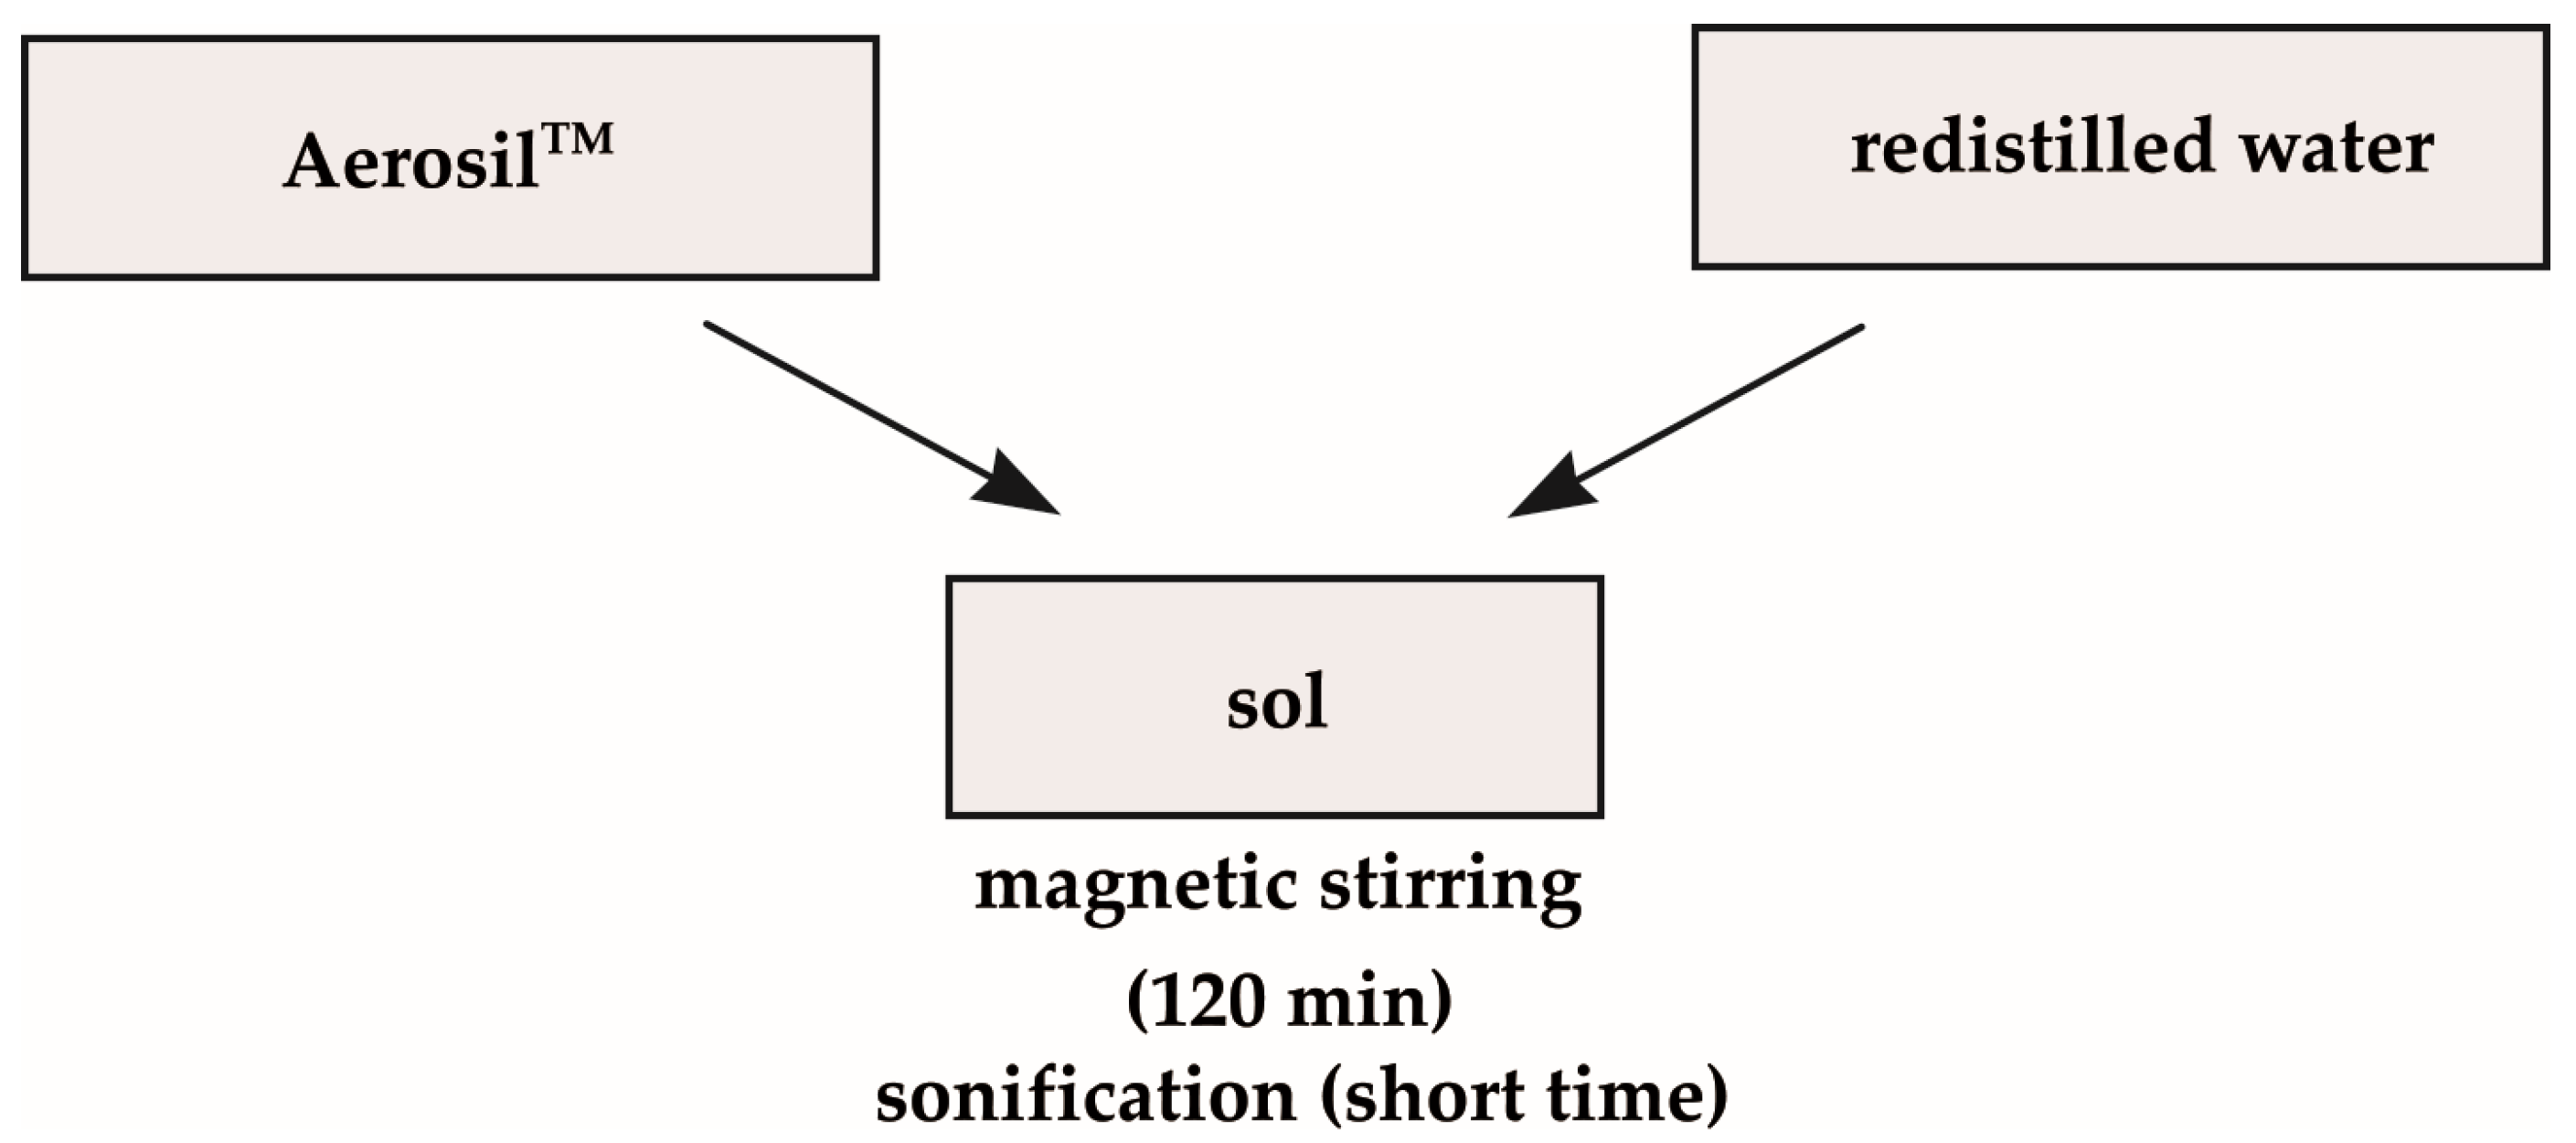
4. Materials and Methods
- β—the full width at half maximum, β = βobs − βstand, [rad];
- λ—the wavelength of radiation applied (CuKα), λ = 0.15406 [nm];
- θ—the peak position [°];
- k—Scherrer constant, k = 0.9;
- Dhkl—the average crystallite size perpendicular to the plane, which gave the reflection [nm].
Author Contributions
Funding
Institutional Review Board Statement
Informed Consent Statement
Data Availability Statement
Acknowledgments
Conflicts of Interest
References
- Brinker, C.J.; Scherer, G.W. Sol-Gel Science; Academic Press: London, UK, 1990. [Google Scholar]
- Helsch, G.; Mös, A.; Deubener, J.; Höland, M. Thermal resistance of nanoporous antireflective coatings on silica glass for solar tower receivers. Sol. Energy Mater. Sol. Cells 2010, 94, 2191–2196. [Google Scholar] [CrossRef]
- Shang, M.; Cao, L.; Liu, M.; Luo, X.; Ren, H.; Ye, X.; Tang, Y.; Jiang, X. Study on the preparation and properties of novel silics microporous antireflective coating by sol-gel process. Spectr. Spectr. Anal. 2013, 33, 872–876. [Google Scholar]
- Chaikin, Y.; Kedem, O.; Raz, J.; Vaskevich, A. Rubinstein, Stabilization of metal nanoparticle films on glass surfaces using ultrathin silica coatings. Anal. Chem. 2013, 85, 10022–10027. [Google Scholar] [CrossRef]
- Kawashita, M.; Tsunejama, S.; Miyaji, F.; Kokubo, T.; Kozuka, H.; Yamamoto, K. Antibacterial silver-containing silica glass prepared by sol-gel method. Biomaterials 2000, 21, 393–398. [Google Scholar] [CrossRef] [PubMed]
- Baheiraei, N.; Moztarzadeh, F.; Hedayati, M. Preparation and antibacterial activity of Ag/SiO2 thin film on glazed ceramic tiles by sol-gel method. Ceram. Int. 2012, 38, 2921–2925. [Google Scholar] [CrossRef]
- Jeon, H.-J.; Yi, S.C.; Oh, S.-G. Preparation and antibacterial effects of Ag-SiO2 thin films by sol-gel method. Biomaterials 2003, 24, 4921–4928. [Google Scholar] [CrossRef]
- Na, M.; Park, H.; Ahn, M.; Lee, H.; Chang, J. Synthesis of organic-inorganic hybrid sols with nano silica particles and organoalkoxysilanes for transparent and high-thermal-resistance coating films using sol-gel reaction. J. Nanosci. Technol. 2010, 10, 6992–6995. [Google Scholar] [CrossRef]
- Grygier, D.; Dudziński, W.; Wiktorczyk, T.; Hainmann, K. Effect of silica precursors-type on mechanical properties of sol-gel coatings. Acta Bioeng. Biomech. 2008, 10, 27–35. [Google Scholar] [PubMed]
- Borba, A.; Vareda, J.P.; Durães, L.; Portugal, A.; Simões, P.N. Spectroscopic characterization of silica aerogels prepared using several precursors—Effect on the formation of molecular clusters. N. J. Chem. 2017, 41, 6742–6759. [Google Scholar] [CrossRef]
- Adamczyk, A.; Rokita, M. The structural studies of Ag containing TiO2-SiO2 gels and thin films deposited on steel. J. Mol. Str. 2016, 1114, 171–180. [Google Scholar] [CrossRef]
- Handke, M.; Mozgawa, W.; Nocuń, M. Specific features of the IR spectra of silicate glasses. J. Mol. Str. 1994, 325, 129–136. [Google Scholar] [CrossRef]
- Wang, F.; Liu, J.; Yang, H.; Luo, Z.; Lv, W.; Li, C.; Qing, S. Spherical particles from tetraorthosilicate (TEOS) sol-gel process with dimethyldiethoxysilane (DDS) and diphenyldiethoxysilane (DPDS) addition. J. Non-Cryst. Solids 2008, 354, 5047–5052. [Google Scholar] [CrossRef]
- De, G.; Licciulli, A.; Massaro, C.; Tapfer, L.; Catalano, M.; Battaglin, G.; Meneghini, C.; Mazzoldi, P. Silver nanocrystals in silica by sol-gel processing. J. Non-Cryst Solids 1996, 194, 225–234. [Google Scholar] [CrossRef]
- Zhang, Y.; Wu, D.; Sun, Y. Sol-gel of methyl modified optical silica coatings and gels from DDS and TEOS. J. Sol-Gel Sci. Technol. 2005, 33, 19–24. [Google Scholar] [CrossRef]
- Capozzi, C.A.; Pye, L.D.; Condrate, R.A., Sr. Vibrational spectral/structural changes from the hydrolysis/polycondensation of methyl-modified silicates. I. comparisons for single monomer condensates. Mater. Lett. 1992, 15, 130–136. [Google Scholar] [CrossRef]
- Mahltig, B.; Fiedler, D.; Böttcher, H. Antimicrobial Sol-Gel Coatings. J. Sol-Gel Sci. Technol. 2004, 32, 219–222. [Google Scholar] [CrossRef]
- Varghese, S.; Elfakhri, S.; Sheel, D.W.; Sheel, P.; Bolton, F.J.; Foster, H.A. Novel antibacterial silver- silica surface coatings prepared by chemical vapour deposition for infection control. J. Appl. Microb. 2013, 115, 1107–1116. [Google Scholar] [CrossRef]
- Hwang, S.H.; Shin, D.H.; Yun, J.; Kim, C.; Choi, M.; Jang, J. SiO2/TiO2 Hollow Nanoparticles Decorated with Ag Nanoparticles: Enhanced Visible Light Absorption and Improved Light Scattering in Dye-Sensitized Solar Cells. Chem. Eur. J. 2014, 20, 4439–4446. [Google Scholar] [CrossRef]
- Yoshinaga, I.; Yamada, N.; Katayama, S. Effect of Inorganic Components on Thermal Stability of Methylsiloxane-Based Inorganic/Organic Hybrids. J. Sol-Gel Sci. Technol. 2005, 35, 21–26. [Google Scholar] [CrossRef]
- Mah, S.K.; Chung, I.J. Effects of dimethylodietoxysilane addition on tetraethylorthosilicate sol-gel process. J. Non-Cryst. Solids 1995, 183, 252–259. [Google Scholar] [CrossRef]
- Wang, F.; Liu, J.; Luo, Z. Effects of dimethylodiethoxysilane addition on the sol-gel process of tetraethylorthosilicate. J. Non-Cryst. Solids 2007, 353, 321–326. [Google Scholar] [CrossRef]


| Sample | Dhkl (Average Crystallites Size) [nm] |
|---|---|
| basic TEOS/Ag on steel | 20.5 |
| basic TEOS/Ag on titanium | 24.0 |
| TEOS/DDS/Ag on steel | 15.2 |
| TEOS/DDS/Ag on titanium | 20.5 |
| AerosilTM/Ag on titanium | 23.5 |
| Sample | Elements | |||||||||||||
|---|---|---|---|---|---|---|---|---|---|---|---|---|---|---|
| Thin Film | Substrate | |||||||||||||
| O | Si | Ag | Ti | Cr | Fe | Ni | ||||||||
| Wt% | At% | Wt% | At% | Wt% | At% | Wt% | At% | Wt% | At% | Wt% | At% | Wt% | At% | |
| TEOS/steel | 24.72 | 47.72 | 18.82 | 20.70 | - | - | - | - | 11.18 | 6.64 | 41.29 | 22.84 | 4.00 | 2.10 |
| TEOS/Ag/Ti | 45.03 | 66.66 | 21.75 | 18.34 | 5.20 | 1.14 | 28.02 | 13.86 | - | - | - | - | - | - |
| TEOS/DDS/ steel | 10.63 | 28.39 | 3.55 | 5.40 | - | - | - | - | 14.96 | 12.30 | 62.83 | 48.07 | 8.02 | 5.84 |
| TEOS/DDS/Ag/Ti | 24.86 | 49.22 | 4.72 | 5.33 | 3.03 | 0.89 | 67.39 | 44.56 | - | - | - | - | - | - |
| AerosilTM/Ag/Ti | 49.27 | 69.35 | 24.25 | 19.44 | 4.77 | 1.00 | 21.71 | 10.21 | - | - | - | - | - | - |
| Sample | Ra [nm] | Rq [nm] | Rmax [nm] |
|---|---|---|---|
| basic TEOS on steel | 0.335 | 0.263 | 4.65 |
| TEOS/DDS on steel | 20.9 | 27.9 | 210 |
| TEOS/DDS/Ag on titanium | 9.93 | 13.4 | 127 |
| TEOS/DDS/Ag on steel | 17.3 | 0.224 | 169 |
| AerosilTM on titanium | 10.5 | 13.2 | 92.2 |
| AerosilTM/Ag on steel | 44.1 | 55.8 | 345 |
| Sample | Substrate | Wetting Angle [°] | Standard Deviation [°] |
|---|---|---|---|
| Basic TEOS | steel | 53.53 | 6.96 |
| Basic TEOS/Ag | steel | 58.73 | 8.94 |
| Basic TEOS/Ag | titanium | 86.38 | 7.35 |
| TEOS/DDS/Ag | steel | 41.75 | 14.31 |
| TEOS/DDS/Ag | titanium | 106.18 | 4.53 |
| AerosilTM | steel | Not measurable | |
| AerosilTM | titanium | Not measurable | |
| - | steel | 89.94 | 7.19 |
| - | titanium | 75.74 | 12.03 |
| Sample/sol | Steel | Titanium | Ag Addition Ag:Si Ratio [mol] |
|---|---|---|---|
| basic | x | - | - |
| basic | - | x | - |
| basic | x | - | 1:12 |
| basic | - | x | 1:12 |
| TEOS/DDS | x | - | - |
| TEOS/DDS | - | x | - |
| TEOS/DDS | x | - | 1:70 |
| TEOS/DDS | - | x | 1:70 |
| Aerosil | x | - | - |
| Aerosil | - | x | - |
| Aerosil | x | - | 1:85 |
| Aerosil | - | x | 1:85 |
Disclaimer/Publisher’s Note: The statements, opinions and data contained in all publications are solely those of the individual author(s) and contributor(s) and not of MDPI and/or the editor(s). MDPI and/or the editor(s) disclaim responsibility for any injury to people or property resulting from any ideas, methods, instructions or products referred to in the content. |
© 2024 by the authors. Licensee MDPI, Basel, Switzerland. This article is an open access article distributed under the terms and conditions of the Creative Commons Attribution (CC BY) license (https://creativecommons.org/licenses/by/4.0/).
Share and Cite
Adamczyk, A.; Brylewski, T.; Szymczak, P. The Influence of Ag Addition and Different SiO2 Precursors on the Structure of Silica Thin Films Synthesized by the Sol–Gel Method. Molecules 2024, 29, 4592. https://doi.org/10.3390/molecules29194592
Adamczyk A, Brylewski T, Szymczak P. The Influence of Ag Addition and Different SiO2 Precursors on the Structure of Silica Thin Films Synthesized by the Sol–Gel Method. Molecules. 2024; 29(19):4592. https://doi.org/10.3390/molecules29194592
Chicago/Turabian StyleAdamczyk, Anna, Tomasz Brylewski, and Patryk Szymczak. 2024. "The Influence of Ag Addition and Different SiO2 Precursors on the Structure of Silica Thin Films Synthesized by the Sol–Gel Method" Molecules 29, no. 19: 4592. https://doi.org/10.3390/molecules29194592
APA StyleAdamczyk, A., Brylewski, T., & Szymczak, P. (2024). The Influence of Ag Addition and Different SiO2 Precursors on the Structure of Silica Thin Films Synthesized by the Sol–Gel Method. Molecules, 29(19), 4592. https://doi.org/10.3390/molecules29194592