
Petroleum Pitch-Derived Porous Carbon Materials as Metal-Free Catalyst for Dry Reforming of Methane

 and
and 
Abstract
:1. Introduction
2. Results and Discussion
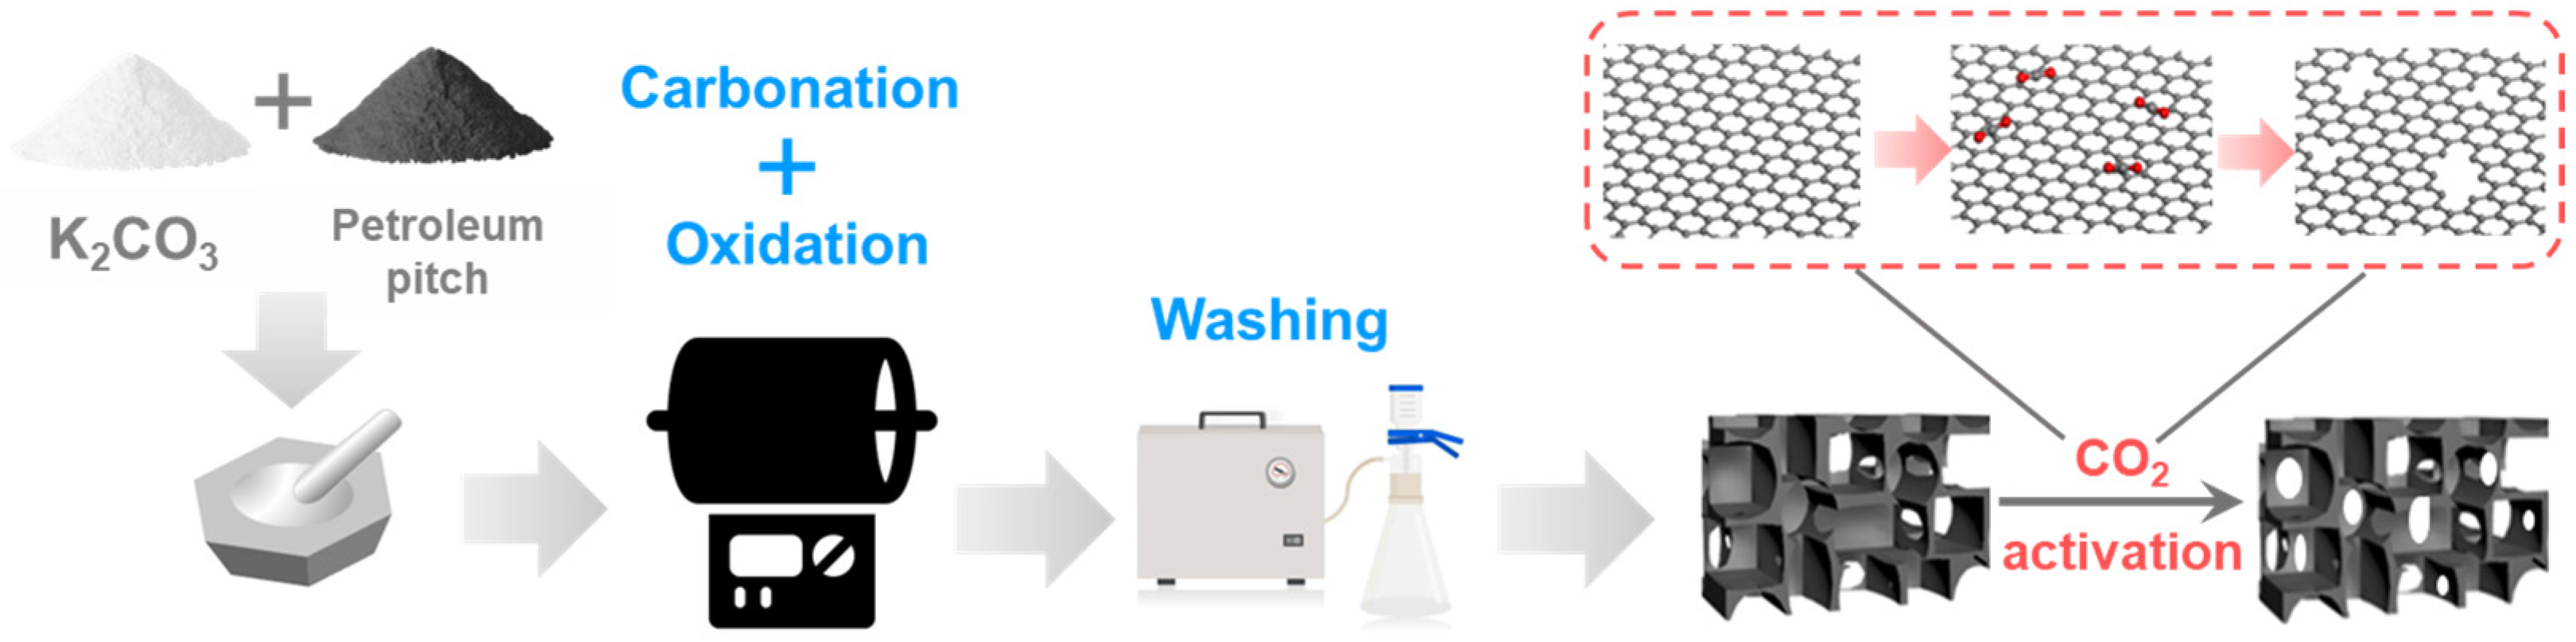
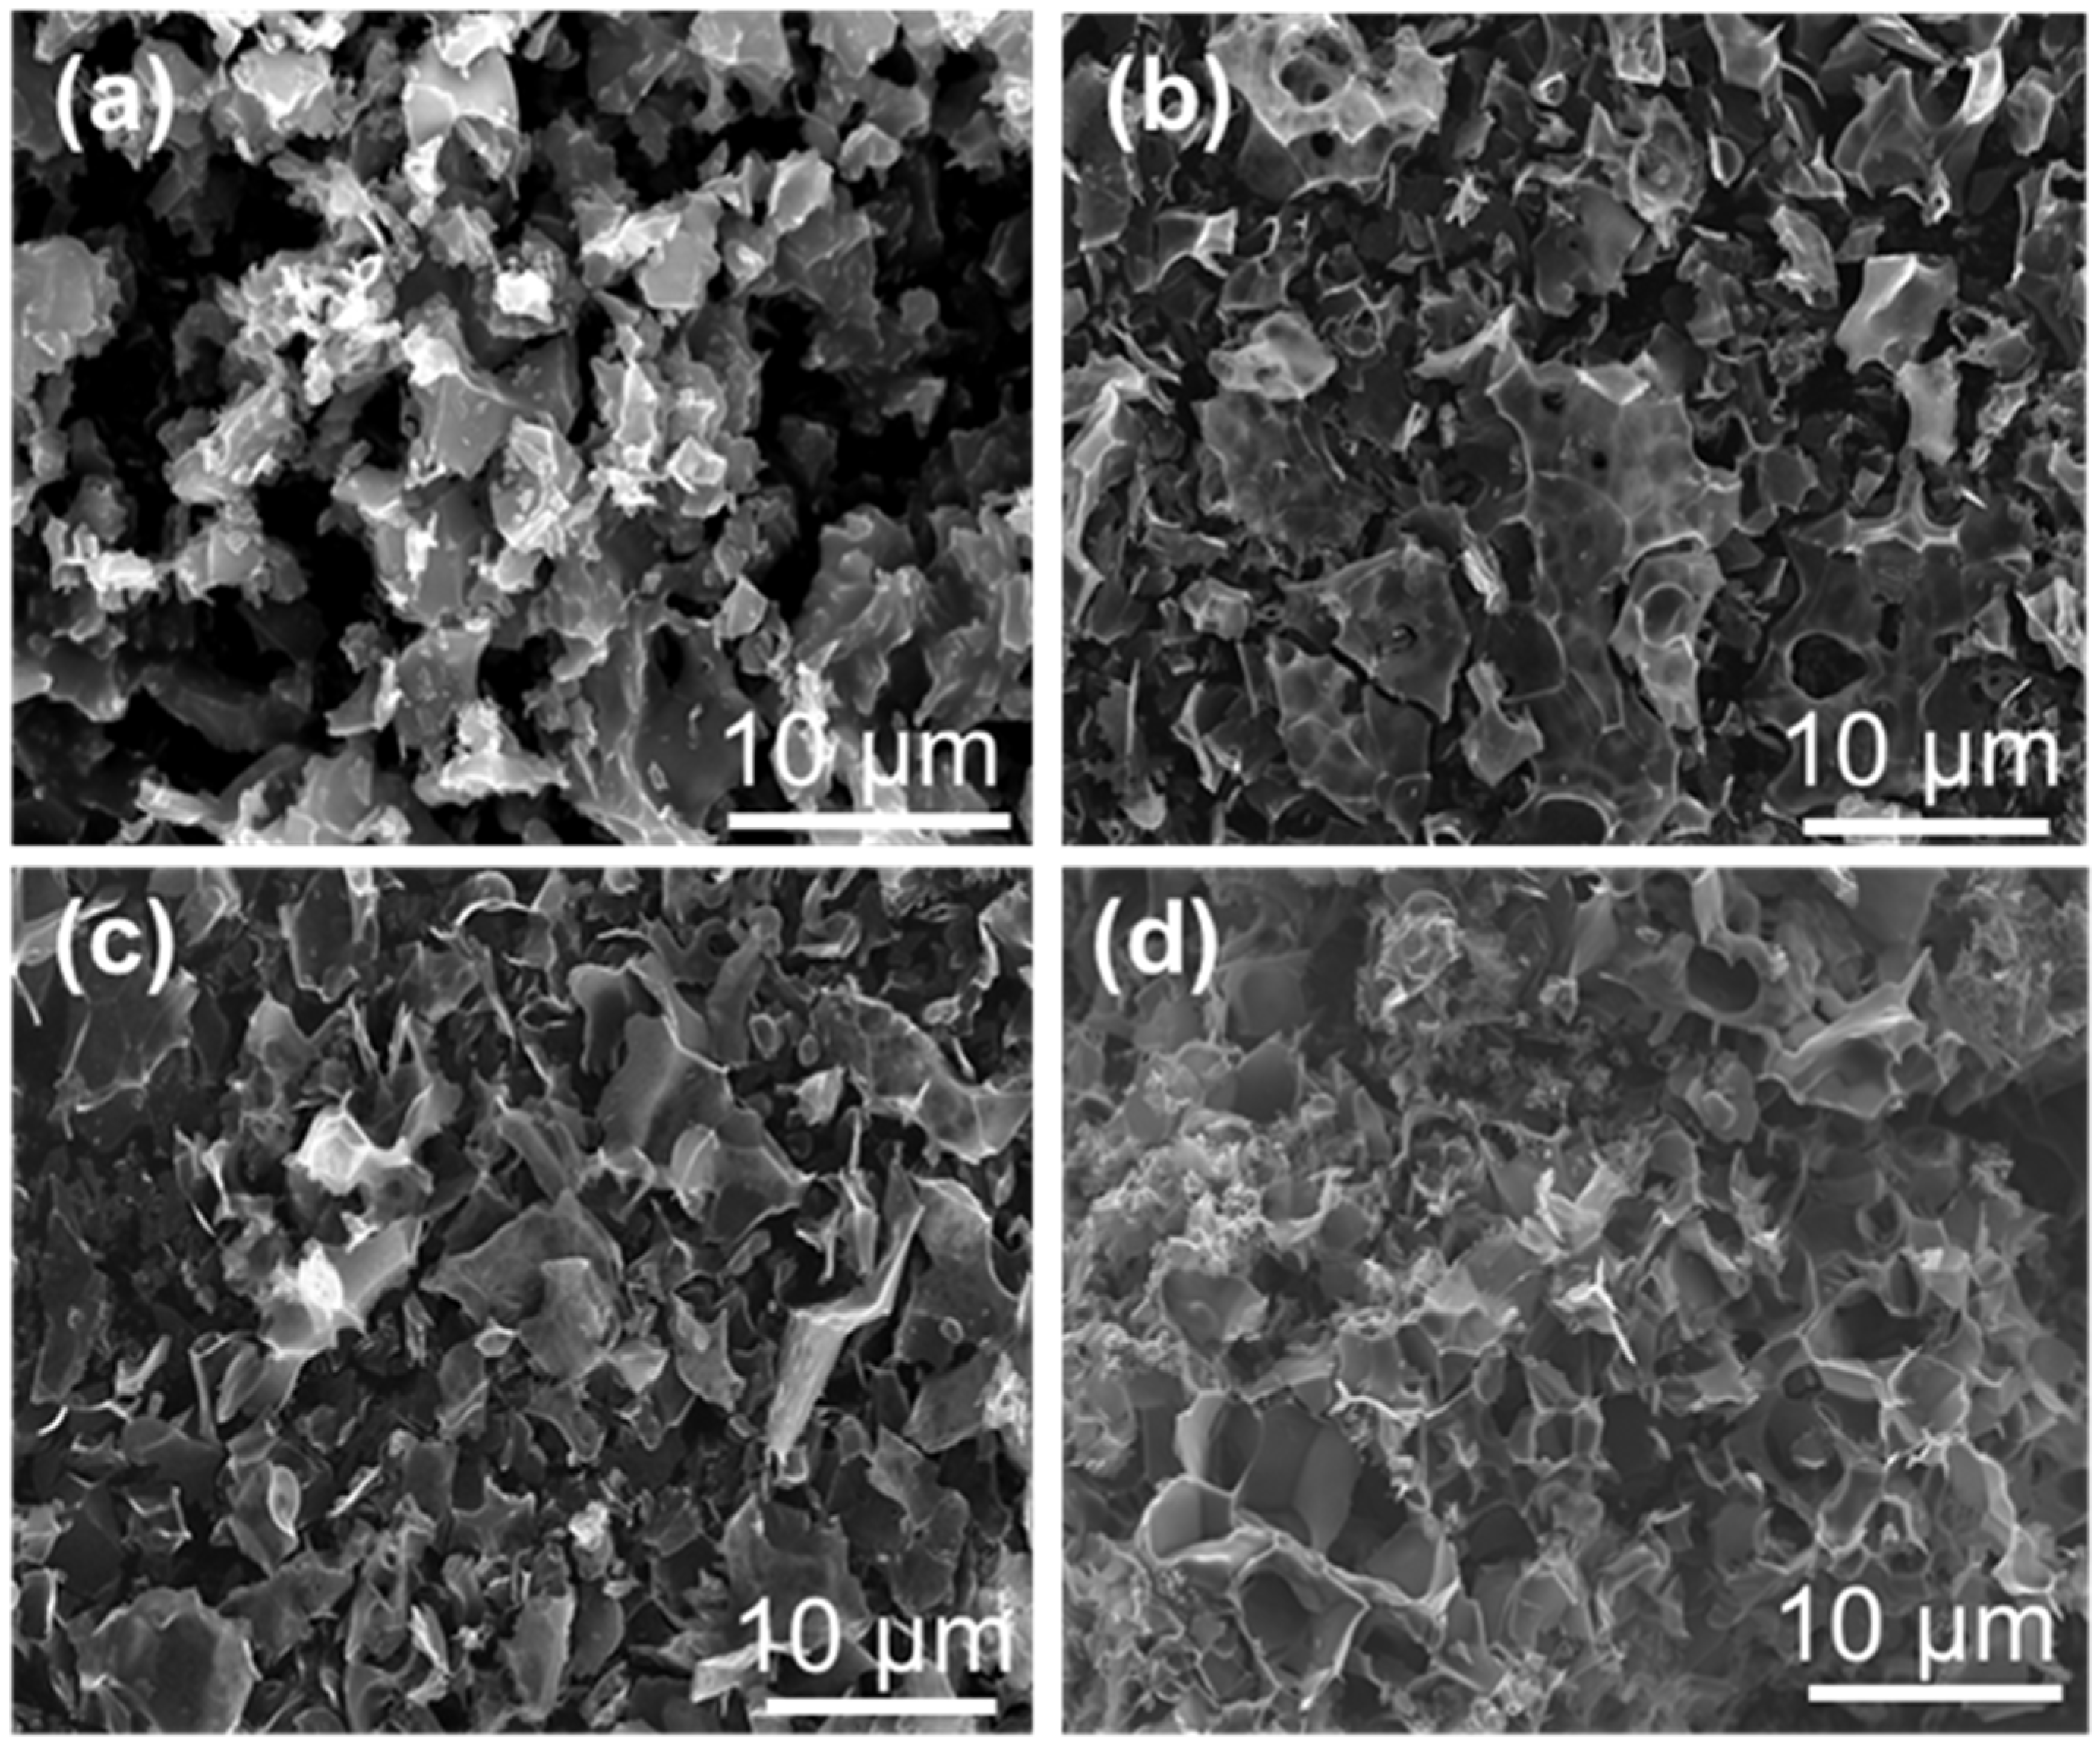
2.1. Preparation and Structural Characterization of K2CO3-Activated Catalysts
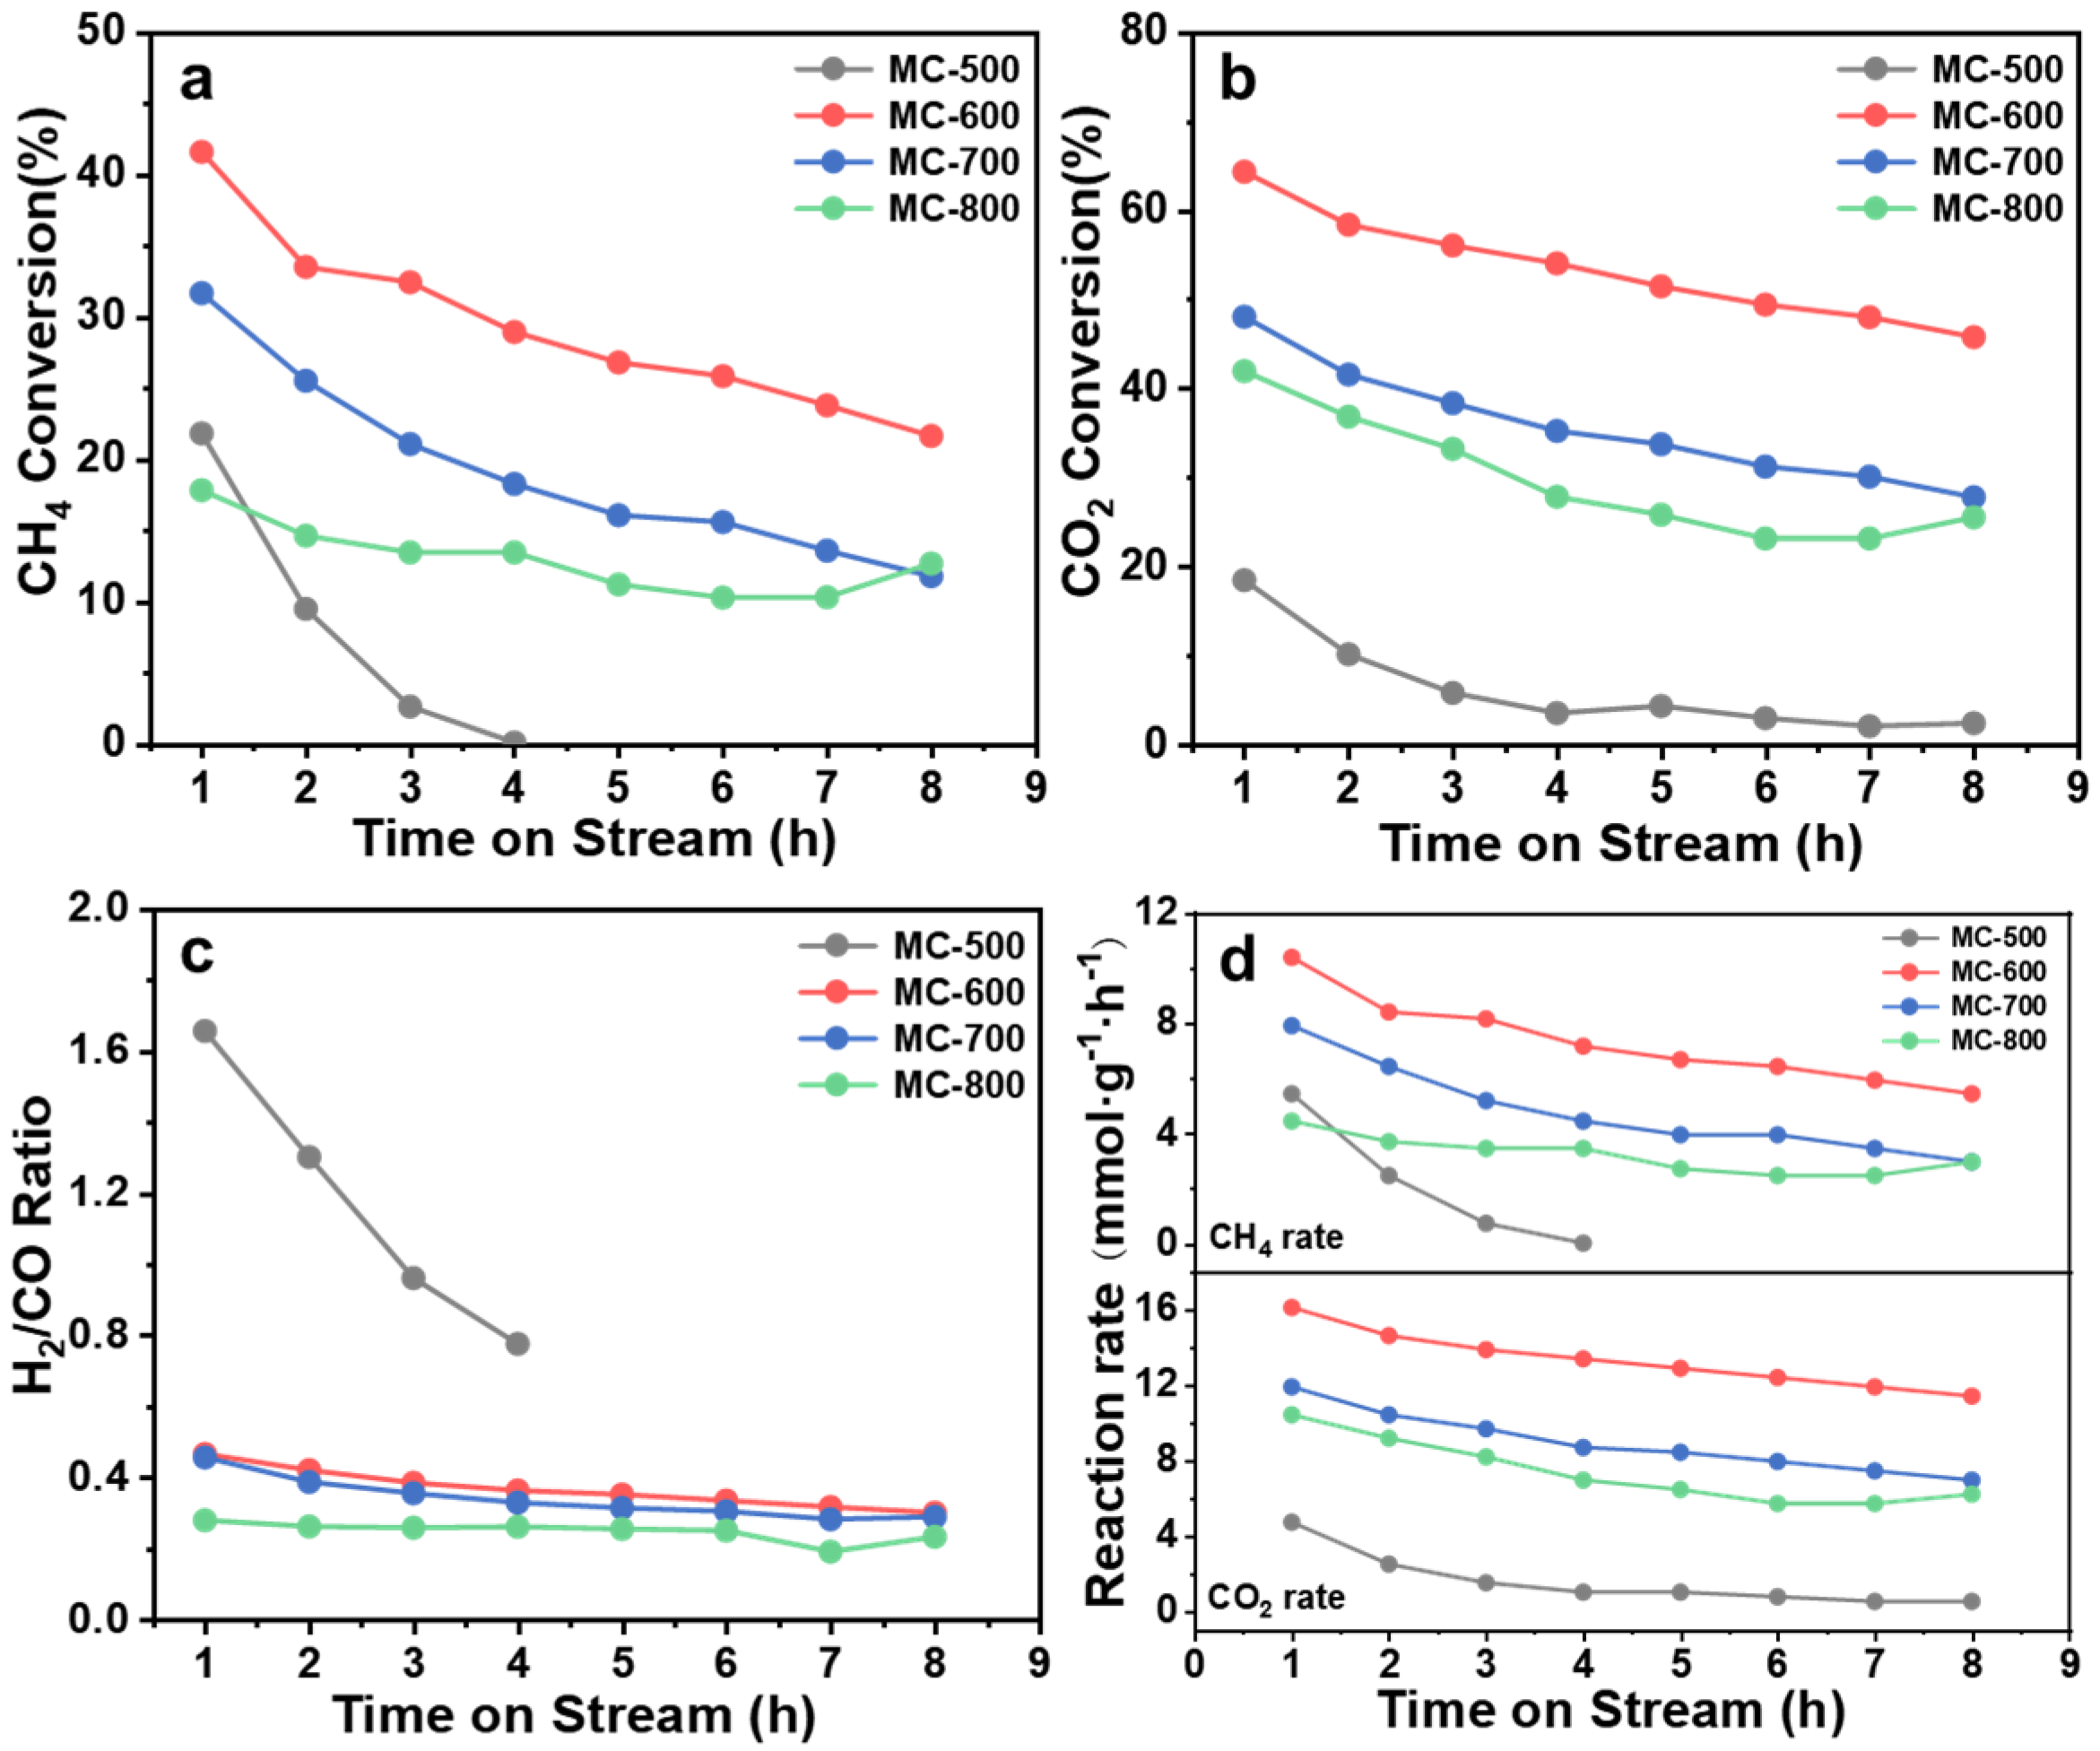
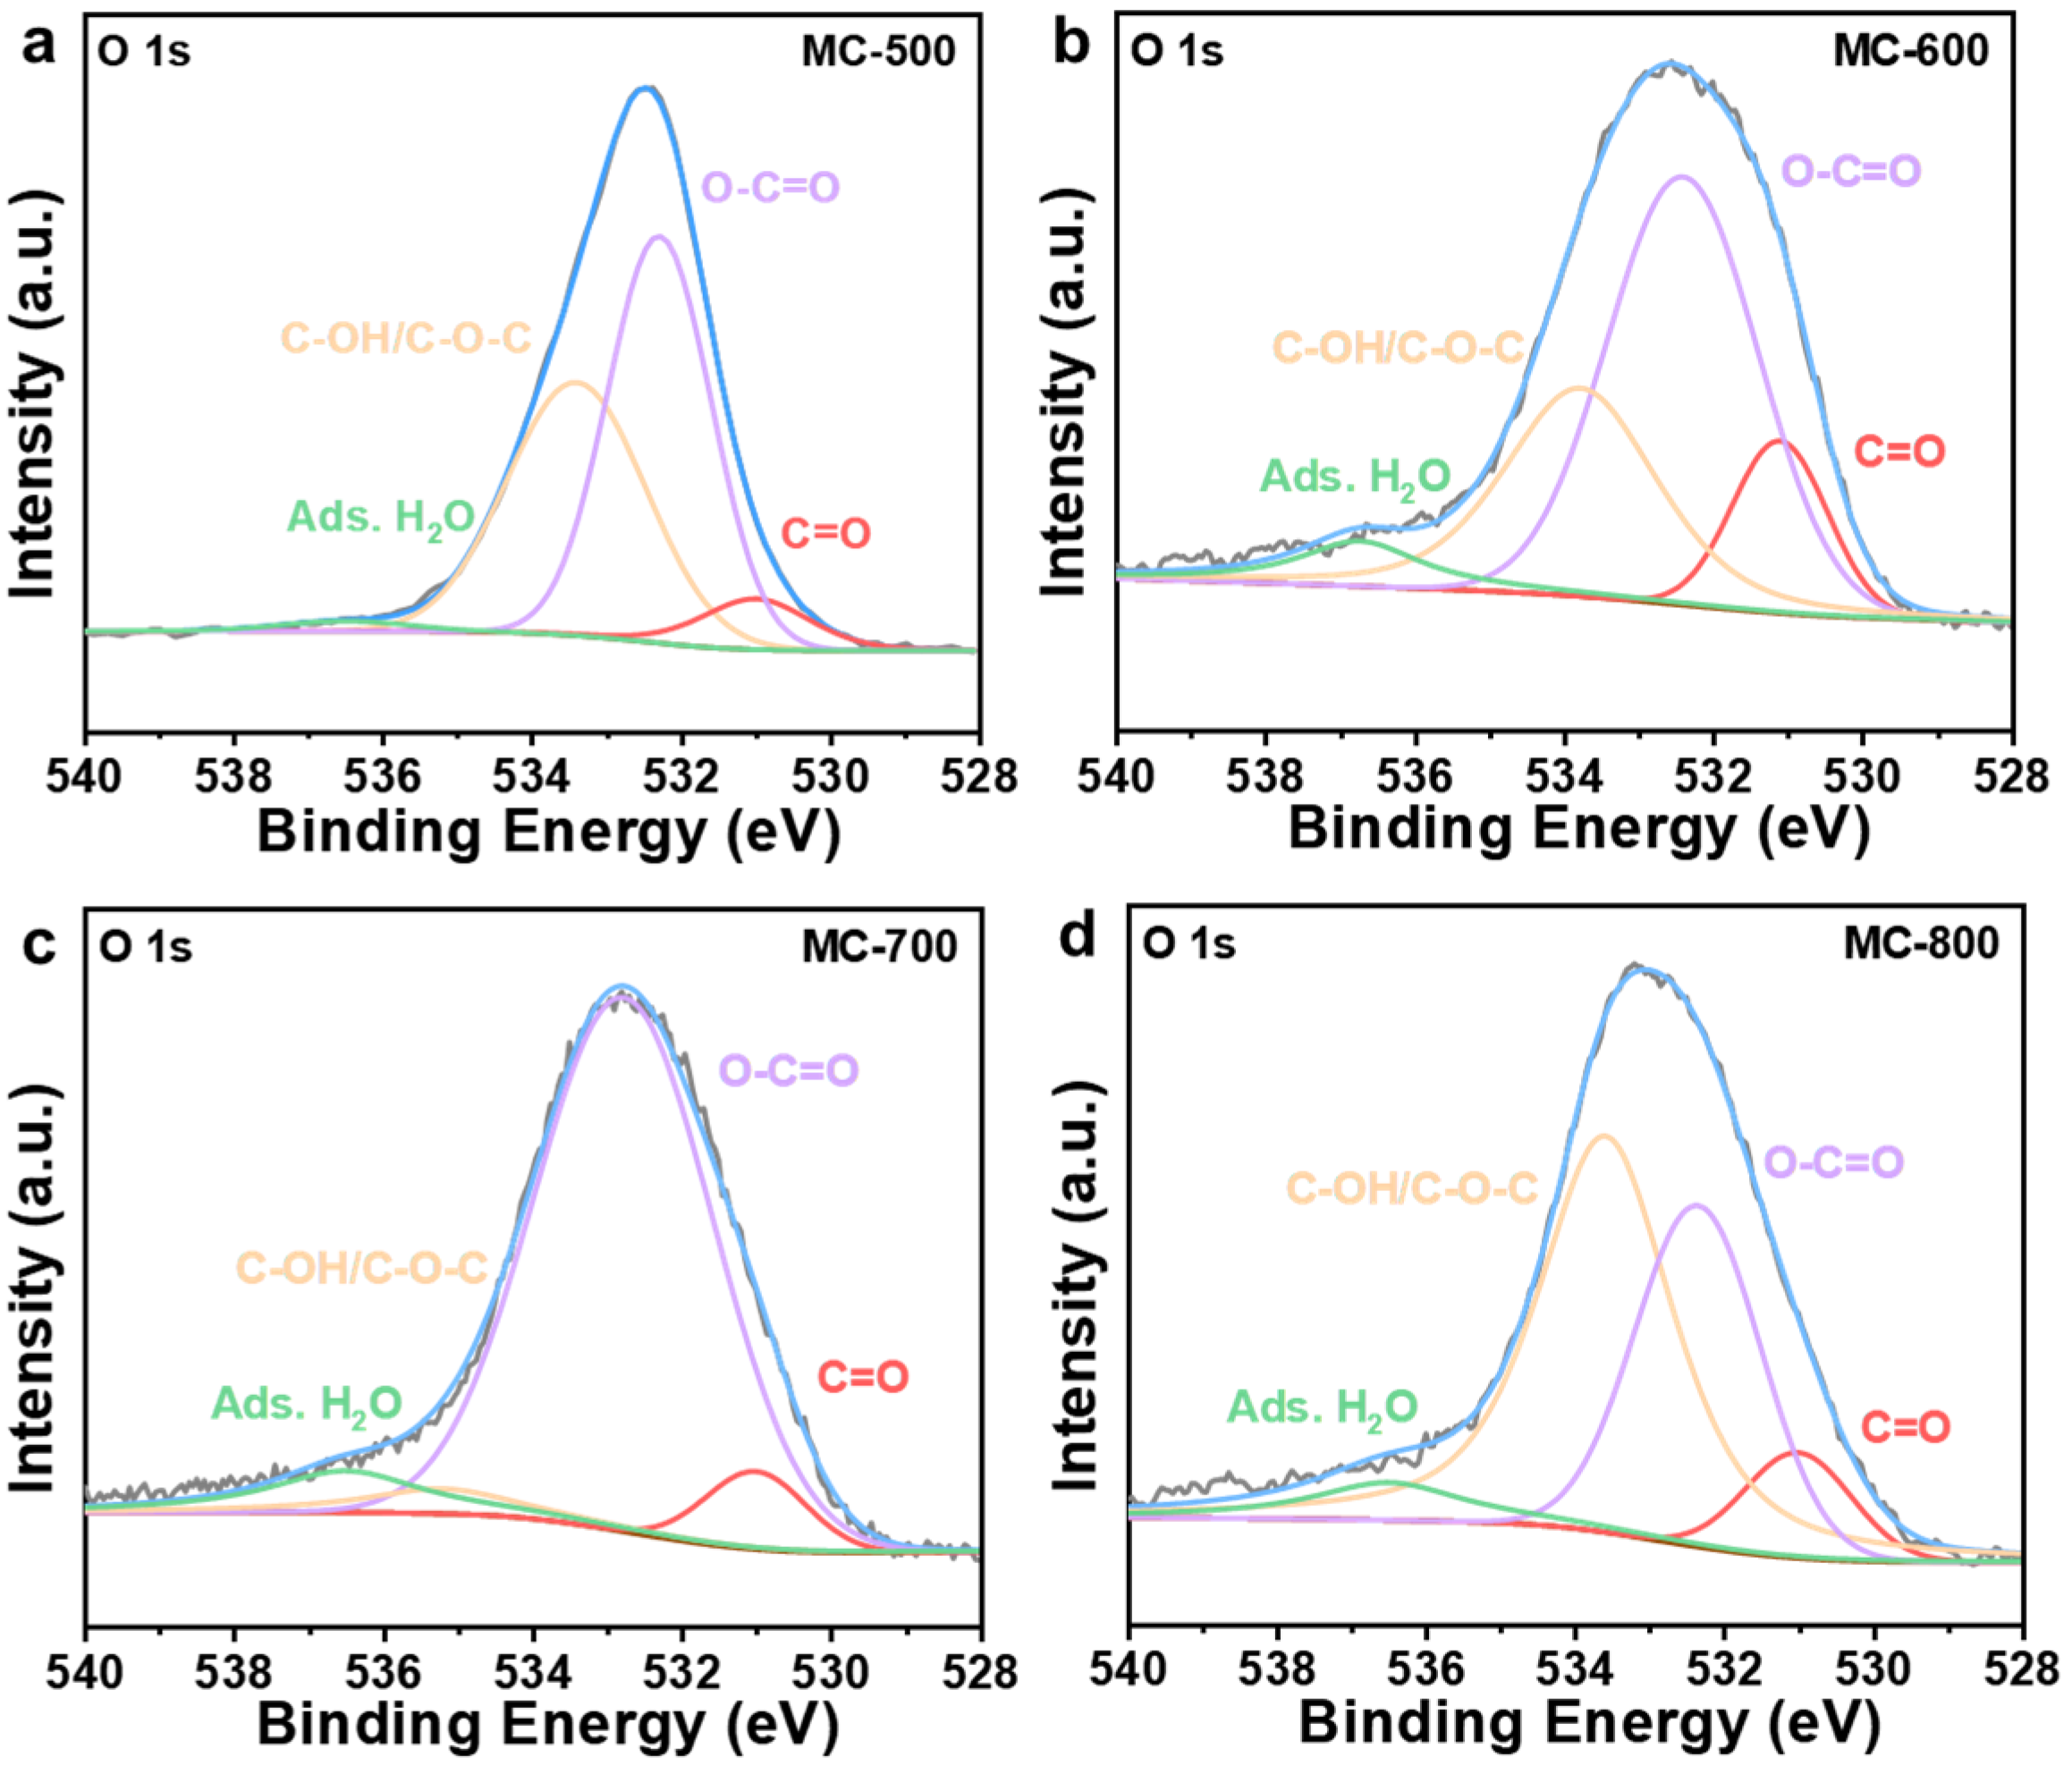
2.2. Structure–Function Relationship of the K2CO3-Activated Catalysts
2.3. Preparation and Structural Characterization of CO2-Activated Catalysts
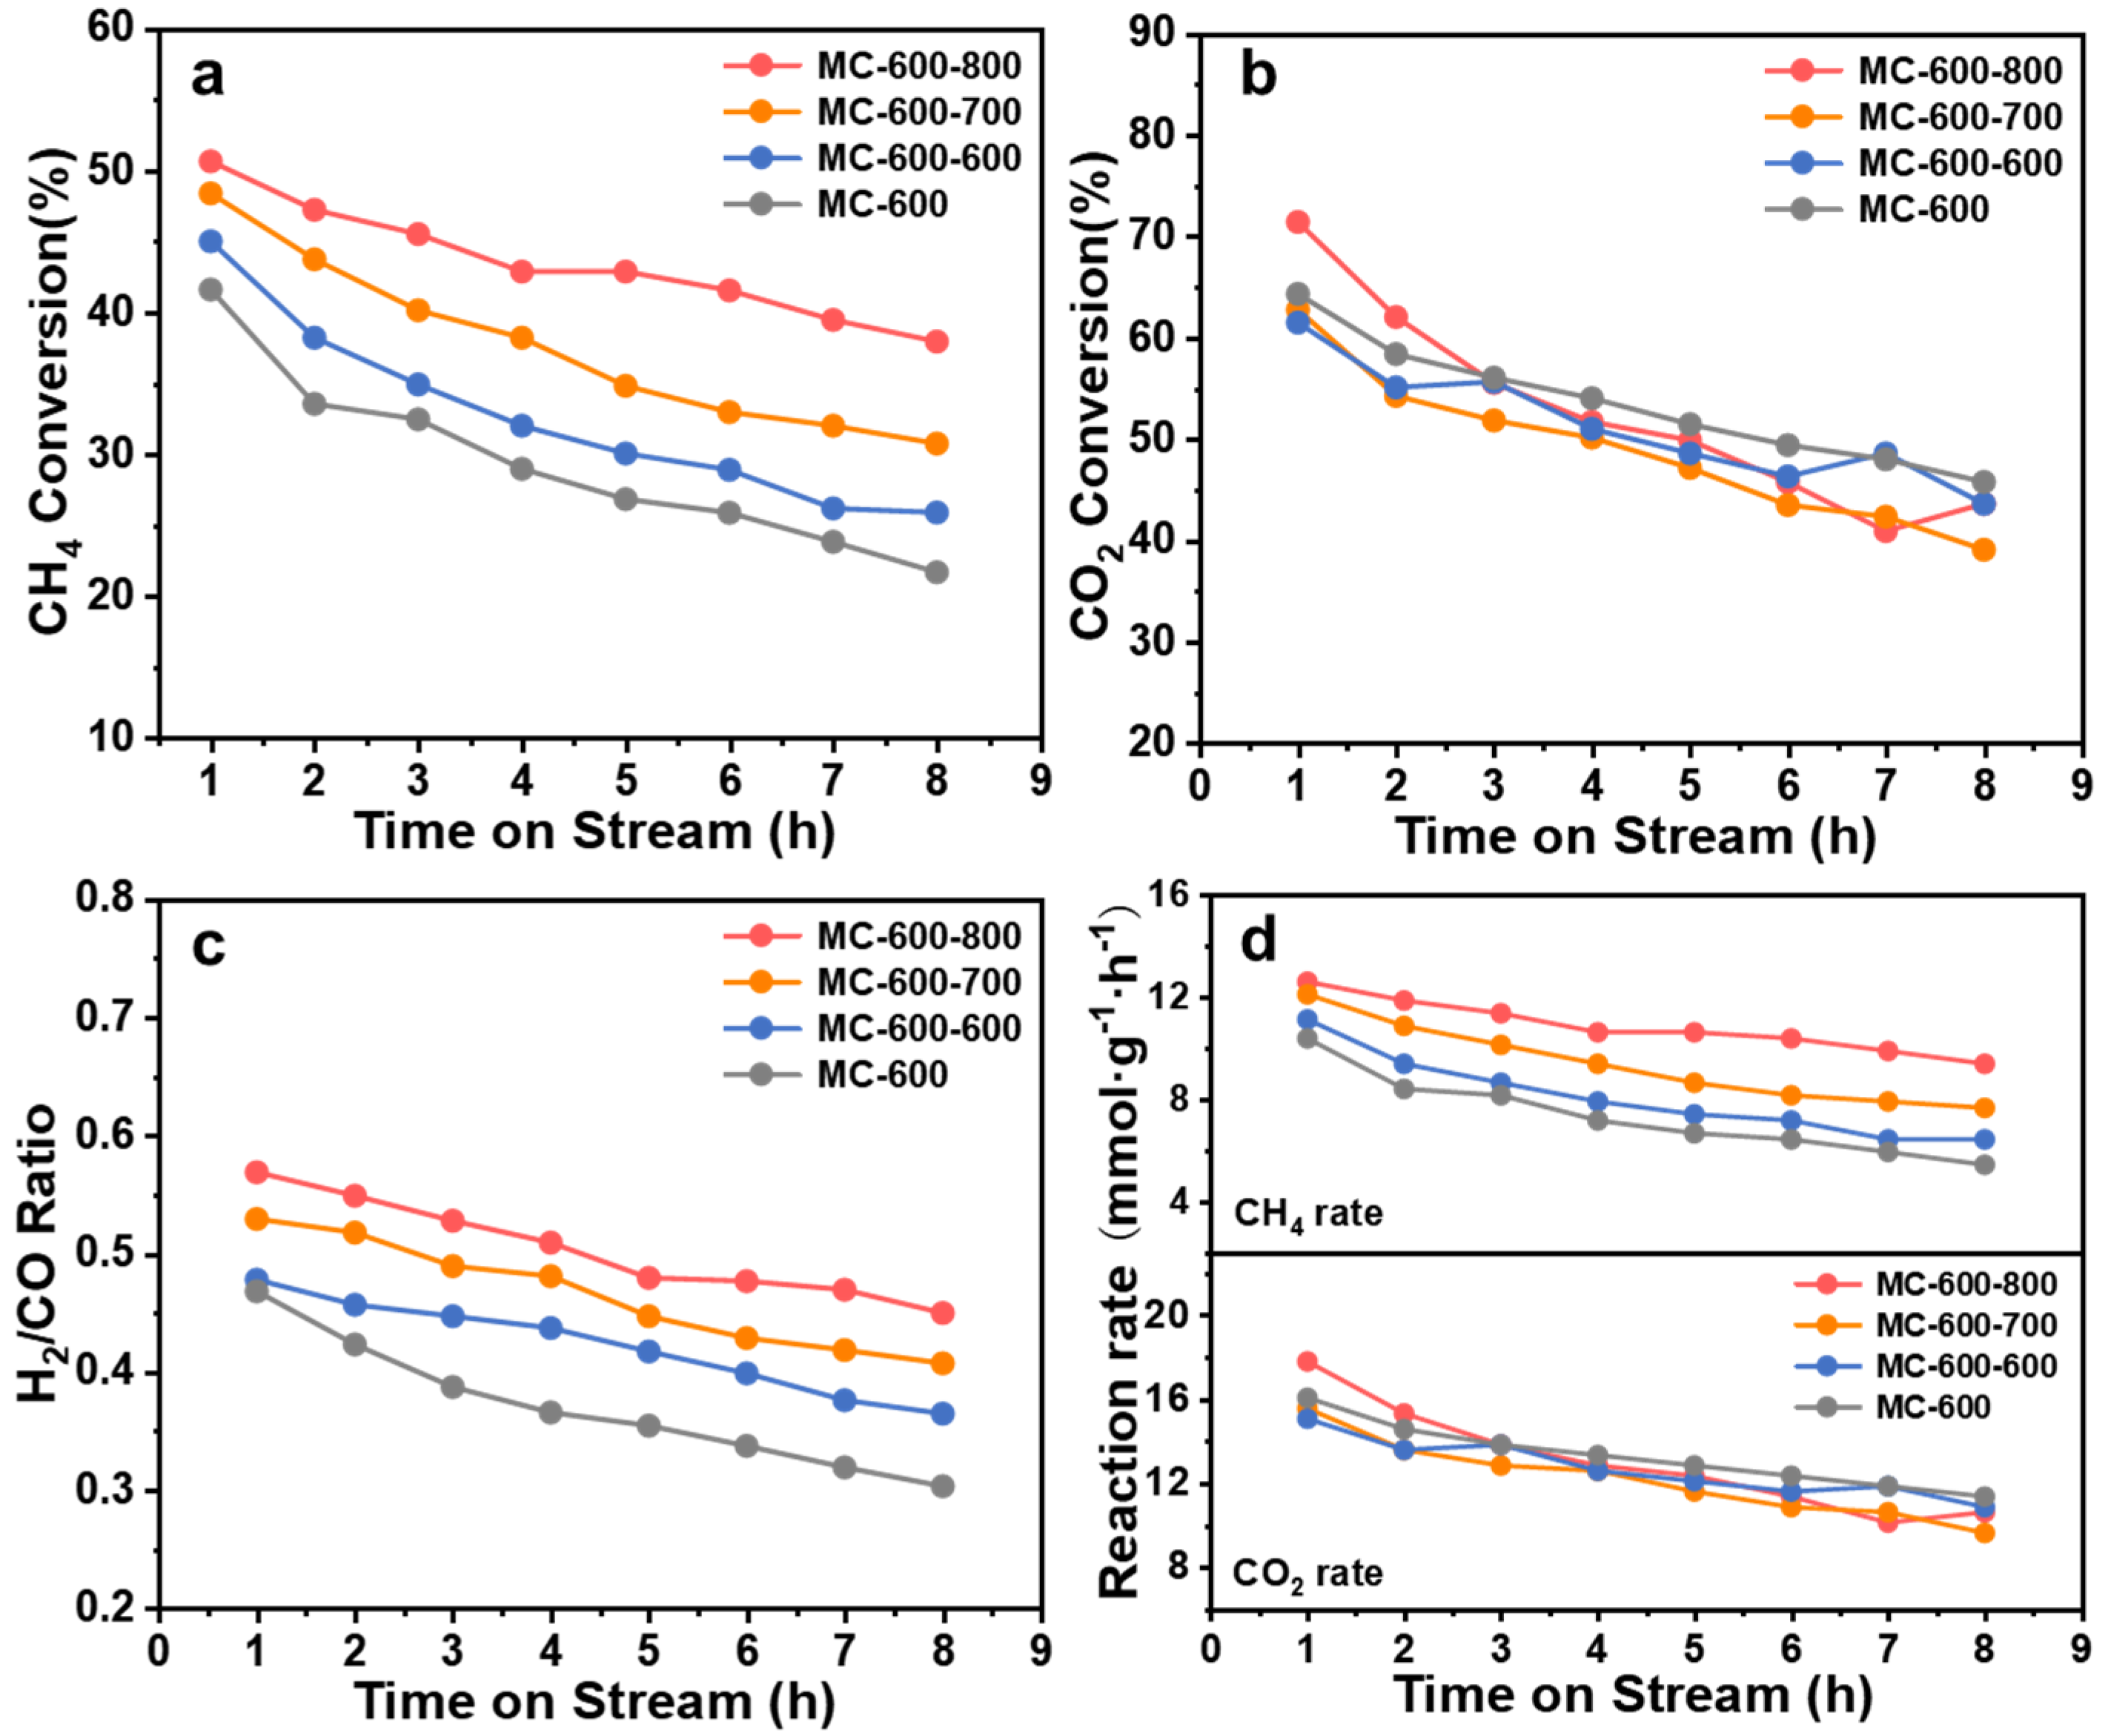
2.4. Structure–Function Relationship of CO2-Activated Catalysts
3. Materials and Methods
3.1. Materials
3.2. Catalyst Preparation
3.2.1. Preparation of K2CO3-Activated Catalysts
3.2.2. Preparation of CO2-Activated Catalysts
3.3. Catalytic Activity Evaluation
3.4. Catalyst Characterization
3.5. Computational Details
4. Conclusions
Author Contributions
Funding
Institutional Review Board Statement
Informed Consent Statement
Data Availability Statement
Conflicts of Interest
Abbreviations
| AC | Activated carbon |
| CMD | Catalytic methane decomposition |
| CNT | Carbon nanotube |
| CB | Carbon black |
| DRM | Dry reforming of methane |
| DFT | Density-functional theory |
| FT-IR | Fourier transform infrared |
| GHSV | gas hourly space velocity |
| NLDFT | Non localized density functional theory |
| POM | Partial oxidation of methane |
| RWGS | Reverse water gas shift reaction |
| SRM | Steam reforming of methane |
| SEM | Scanning electron microscopy |
| XPS | X-ray photoelectron spectroscopy |
| XRD | X-ray diffraction |
References
- Ronald, M.; Isa, Y. Decomposition of methane to carbon and hydrogen: A catalytic perspective. Energy Technol. 2019, 7, 1800593. [Google Scholar]
- Li, L.; MD Dostagir, N.H.; Shrotri, A.; Fukuoka, A.; Kobayashi, H. Partial oxidation of methane to syngas via formate intermediate found for a ruthenium-rhenium bimetallic catalyst. ACS Catal. 2021, 11, 3782–3789. [Google Scholar] [CrossRef]
- Palmer, C.; Upham, D.; Smart, S.; Gordon, M.; Metiu, H.; McFarland, E. Dry reforming of methane catalysed by molten metal alloys. Nat. Catal. 2020, 3, 83–89. [Google Scholar] [CrossRef]
- Zhang, J.; Li, X.; Chen, H.; Qi, M.; Zhang, G.; Hu, H.; Ma, X. Hydrogen production by catalytic methane decomposition: Carbon materials as catalysts or catalyst supports. Int. J. Hydrogen Energy 2017, 42, 19755–19775. [Google Scholar] [CrossRef]
- Li, Z.; Lin, Q.; Li, M.; Cao, J.; Liu, F.; Pan, H.; Wang, Z.; Kawi, S. Recent advances in process and catalyst for CO2 reforming of methane. Renew. Sustain. Energy Rev. 2020, 134, 110312. [Google Scholar] [CrossRef]
- Wang, W.; Zeng, C.; Tsubaki, N. Recent advancements and perspectives of the CO2 hydrogenation reaction. Green Carbon 2023, 1, 133–145. [Google Scholar] [CrossRef]
- Li, L.; Yan, K.; Chen, J.; Feng, T.; Wang, F.; Wang, J.; Song, Z.; Ma, C. Fe-rich biomass derived char for microwave-assisted methane reforming with carbon dioxide. Sci. Total Environ. 2019, 657, 1357–1367. [Google Scholar] [CrossRef]
- Wang, Y.; Sun, J.; Tsubaki, N. Clever nanomaterials fabrication techniques encounter sustainable C1 catalysis. Acc. Chem. Res. 2023, 56, 2341–2353. [Google Scholar] [CrossRef]
- Liu, X.; Dai, L. Carbon-based metal-free catalysts. Nat. Rev. Mater. 2016, 1, 16064. [Google Scholar] [CrossRef]
- Moliner, R.; Suelves, I.; Lázaro, M.; Moreno, O. Thermocatalytic decomposition of methane over activated carbons: Influence of textural properties and surface chemistry. Int. J. Hydrogen Energy 2005, 30, 293–300. [Google Scholar] [CrossRef]
- Li, Y.; Xiao, R.; Jin, B.; Zhang, H. Experimental study of the reforming of methane with carbon dioxide over coal char. Int. J. Chem. React. Eng. 2008, 6, A16. [Google Scholar] [CrossRef]
- Samuel, J.; Ok, S. Petroleum asphaltene-based activated nanoporous carbon for CO2 capture and H2 storage. Ind. Eng. Chem. Res. 2023, 62, 9939–9950. [Google Scholar] [CrossRef]
- Suelves, I.; Pinilla, J.; Lázaro, M.; Moliner, R. Carbonaceous materials as catalysts for decomposition of methane. Chem. Eng. J. 2008, 140, 432–438. [Google Scholar] [CrossRef]
- Zhang, F.; Liu, T.; Hou, G.; Kou, T.; Guan, R.; Li, Y. Hierarchically porous carbon foams for electric double layer capacitors. Nano Res. 2016, 9, 2875–2888. [Google Scholar] [CrossRef]
- Xu, C.; Gu, Q.; Li, S.; Ma, L.; Zhou, Y.; Zhang, X.; Jiang, C.; Pham-Huu, C.; Liu, Y. Heteroatom-doped monolithic carbocatalysts with improved sulfur selectivity and impurity tolerance for H2S selective oxidation. ACS Catal. 2021, 11, 8591–8604. [Google Scholar] [CrossRef]
- Kim, Y.S.; Hanif, M.A.; Song, H.; Kim, S.; Cho, Y.; Ryu, S.K.; Kim, H.G. Wood-Derived graphite: A sustainable and cost-effective material for the wide range of industrial applications. Crystals 2024, 14, 309. [Google Scholar] [CrossRef]
- Pope, C. X-Ray Diffraction and the bragg equation. J. Chem. Educ. 1997, 74, 129–131. [Google Scholar] [CrossRef]
- Guo, J.; Lou, H.; Zheng, X. The deposition of coke from methane on a Ni/MgAl2O4 catalyst. Carbon 2007, 45, 1314–1321. [Google Scholar] [CrossRef]
- Dobele, G.; Volperts, A.; Plavniece, A.; Zhurinsh, A.; Upskuviene, D.; Balciunaite, A.; Niaura, G.; Colmenares-Rausseo, L.C.; Tamasauskaite-Tamasiunaite, L.; Norkus, E. Thermochemical Activation of Wood with NaOH, KOH and H3PO4 for the Synthesis of Nitrogen-Doped Nanoporous Carbon for Oxygen Reduction Reaction. Molecules 2024, 29, 2238. [Google Scholar] [CrossRef] [PubMed]
- Gnawali, C.L.; Shrestha, L.K.; Hill, J.P.; Renzhi, M.; Ariga, K.; Adhikari, M.P.; Rajbhandari, R.; Pokharal, B.P. Nanoporous activated carbon material from Terminalia chebula seed for supercapacitor application. C 2023, 9, 109. [Google Scholar] [CrossRef]
- Han, C.; Zhu, X.; Chen, B.; Wang, X. A strategy of constructing the Ni@ silicalite-1 catalyst structure with high activity and resistance to sintering and carbon deposition for dry reforming of methane. Fuel 2024, 355, 129548. [Google Scholar] [CrossRef]
- Hussain, I.; Jalil, A.; Mamat, C.; Siang, T.; Rahman, A.; Azami, M.; Adnan, R. New insights on the effect of the H2/CO ratio for enhancement of CO methanation over metal-free fibrous silica ZSM-5: Thermodynamic and mechanistic studies. Energy Convers. Manag. 2019, 199, 112056. [Google Scholar] [CrossRef]
- Tang, S.; Cao, Z. Site-dependent catalytic activity of graphene oxides towards oxidative dehydrogenation of propane. Phys. Chem. Chem. Phys. 2012, 14, 16558–16565. [Google Scholar] [CrossRef]
- Zhang, G.; Qu, J.; Su, A.; Zhang, Y.; Xu, Y. Towards understanding the carbon catalyzed CO2 reforming of methane to syngas. J. Ind. Eng. Chem. 2015, 21, 311–317. [Google Scholar] [CrossRef]
- Song, Y.; Liu, G.; Yuan, Z. N-, P-and B-doped mesoporous carbons for direct dehydrogenation of propane. RSC Adv. 2016, 6, 94636–94642. [Google Scholar] [CrossRef]
- O’Connor, E.; Long, R.D.; Cherkaoui, K.; Thomas, K.; Chalvet, F.; Povey, I.M.; Pemble, M.E.; Hurley, P.K.; Brennan, B.; Hughes, G.; et al. In situ H2S passivation of In0.53Ga0.47As/InP metal-oxide-semiconductor capacitors with atomic-layer deposited HfO2 gate dielectric. Appl. Phys. Lett. 2008, 92, 022902. [Google Scholar] [CrossRef]
- Bae, E.; Hun Kang, Y.; Jang, K.S.; Yun Cho, S. Enhancement of thermoelectric properties of PEDOT: PSS and tellurium-PEDOT: PSS hybrid composites by simple chemical treatment. Sci. Rep. 2016, 6, 18805. [Google Scholar]
- Hu, Z.; Zhao, H.; Chen, C.; Yuan, Z. Castanea mollissima shell-derived porous carbons as metal-free catalysts for highly efficient dehydrogenation of propane to propylene. Catal. Today 2018, 316, 214–222. [Google Scholar] [CrossRef]
- Dolgov, A.; Lopaev, D.; Lee, C.J.; Zoethout, E.; Medvedev, V.; Yakushev, O.; Bijkerk, F. Characterization of carbon contamination under ion and hot atom bombardment in a tin-plasma extreme ultraviolet light source. Appl. Surf. Sci. 2015, 353, 708–713. [Google Scholar] [CrossRef]
- Zhang, J.; Su, D.; Blume, R.; Schlögl, R.; Wang, R.; Yang, X.; Gajovic’, A. Surface chemistry and catalytic reactivity of a nanodiamond in the steam-free dehydrogenation of ethylbenzene. Angew. Chem. Int. Ed. 2010, 122, 8822–8826. [Google Scholar] [CrossRef]
- Zheng, A.; Chu, Y.; Li, S.; Su, D.; Deng, F. Insight into the activation of light alkanes over surface-modified carbon nanotubes from theoretical calculations. Carbon 2014, 77, 122–129. [Google Scholar] [CrossRef]
- Zhou, J.; Sui, Z.; Zhu, J.; Li, P.; Chen, D.; Dai, Y.; Yuan, W. Characterization of surface oxygen complexes on carbon nanofibers by TPD, XPS and FT-IR. Carbon 2007, 45, 785–796. [Google Scholar] [CrossRef]
- Phothong, K.; Tangsathitkulchai, C.; Lawtae, P. The analysis of pore development and formation of surface functional groups in bamboo-based activated carbon during CO2 activation. Molecules 2021, 26, 5641. [Google Scholar] [CrossRef] [PubMed]
- Pan, S.; Yin, J.; Zhu, X.; Guo, X.; Hu, P.; Yan, X.; Lang, W.; Guo, Y. P-modified microporous carbon nanospheres for direct propane dehydrogenation reactions. Carbon 2019, 152, 855–864. [Google Scholar] [CrossRef]
- Sakina, F.; Baker, R. Metal-and halogen-free synthesis of ordered mesoporous carbon materials. Microporous Mesoporous Mater. 2019, 289, 109622. [Google Scholar] [CrossRef]
- Kim, S.; Jeong, S.; Park, K.; Lee, K.; Kim, H. Effect of oxygen-containing functional groups in metal-free carbon catalysts on the decomposition of methane. Catal. Commun. 2021, 148, 106167. [Google Scholar] [CrossRef]
- Pal, N.; Bhattacharyya, A. Probing the “universal” amorphization of crystalline sulfur in its mixture with ultrahigh surface area porous carbon. J. Phys. Chem. C. 2023, 127, 5713–5719. [Google Scholar] [CrossRef]
- Ashok, J.; Pati, S.; Hongmanorom, P.; Zhang, T.; Chen, J.; Kawi, S. A review of recent catalyst advances in CO2 methanation processes. Catal. Today 2020, 356, 471–489. [Google Scholar] [CrossRef]
- He, T.; Sun, Z.; Wu, J.; Xu, Z.; Zhang, D.; Han, D. Catalytic performance of coal char for the methane reforming process. Chem. Eng. Technol. 2015, 38, 68–74. [Google Scholar] [CrossRef]
- Haghighi, M.; Sun, Z.; Wu, J.; Bromly, J.; Wee, H.; Ng, E.; Wang, Y.; Zhang, D. On the reaction mechanism of CO2 reforming of methane over a bed of coal char. Proc. Combust. Inst. 2007, 31, 1983–1990. [Google Scholar] [CrossRef]
- Tan, Y.; Wang, S.; Li, L.; Meng, B.; Chen, J.; Yang, Z.; Yan, K.; Qin, X. Application of microwave heating for methane dry reforming catalyzed by activated carbon. Chem. Eng. Process 2019, 145, 107662. [Google Scholar] [CrossRef]
- Li, L.; Wang, H.; Jiang, X.; Song, Z.; Zhao, X.; Ma, C. Microwave-enhanced methane combined reforming by CO2 and H2O into syngas production on biomass-derived char. Fuel 2016, 185, 692–700. [Google Scholar] [CrossRef]
- Atuchin, V.V.; Kesler, V.G.; Sapozhnikov, V.K.; Yakovenchuk, V.N. X-ray photoelectron spectrometry and binding energies of Be 1s and O 1s core levels in clinobarylite, BaBe2Si2O7, from Khibiny massif, Kola peninsula. Mater. Charact. 2008, 59, 1329–1334. [Google Scholar] [CrossRef]
- Liu, Q.; Wang, S.; Zheng, Y.; Luo, Z.; Cen, K. Mechanism study of wood lignin pyrolysis by using TG-FTIR analysis. J. Anal. Appl. Pyrol 2008, 82, 170–177. [Google Scholar] [CrossRef]
- Zhang, M.; Bai, Y.; Men, X.; Song, X.; Lv, P.; Wang, J.; Su, W.; Lu, G.; Yu, G. Evolution of oxygen-containing functional groups on coal char surface during gasification in H2O/CO2. J. Energy Inst. 2024, 114, 101622. [Google Scholar] [CrossRef]
- Streletskiy, O.A.; Zavidovskiy, I.A.; Nuriahmetov, I.F.; Khaidarov, A.A.; Pavlikov, A.V.; Minnebaev, K.F. The field-effect transistor based on a polyyne-polyene structure obtained via PVDC dehydrochlorination. J. Compos. Sci 2023, 7, 264. [Google Scholar] [CrossRef]
- Cheng, Z.; Wang, Y.; Jin, D.; Liu, J.; Wang, W.; Gu, Y.; Ni, W.; Feng, Z.; Wu, M. Petroleum pitch-derived porous carbon as a metal-free catalyst for direct propane dehydrogenation to propylene. Catal. Today 2023, 410, 164–174. [Google Scholar] [CrossRef]
- Wu, Z.; Yang, B.; Miao, S.; Liu, W.; Xie, J.; Lee, S.; JPellin, M.; Xiao, D.; Su, D.; Ma, D. Lattice strained Ni-Co alloy as a high-performance catalyst for catalytic dry reforming of methane. ACS Catal. 2019, 9, 2693–2700. [Google Scholar] [CrossRef]
- Wang, Y.; Wang, W.; He, R.; Li, M.; Zhang, J.; Cao, F.; Liu, J.; Lin, S.; Gao, X.; Yang, G.; et al. Carbon-based electron buffer layer on ZnOx-Fe5C2-Fe3O4 boosts ethanol synthesis from CO2 hydrogenation. Angew. Chem. 2023, 135, e202311786. [Google Scholar]
- Kresse, G.; Furthmüller, J. Efficiency of ab-initio total energy calculations for metals and semiconductors using a plane-wave basis set. Comp. Mater. Sci. 1996, 6, 15–50. [Google Scholar] [CrossRef]
- Kresse, G.; Furthmüller, J. Efficient iterative schemes for ab initio total-energy calculations using a plane-wave basis set. Phys. Rev. B 1996, 54, 11169. [Google Scholar] [CrossRef] [PubMed]
- Perdew, J.P.; Burke, K.; Ernzerhof, M. Generalized gradient approximation made simple. Phys. Rev. Lett 1996, 77, 3865. [Google Scholar] [CrossRef] [PubMed]
- White, J.A.; Bird, D.M. Implementation of gradient-corrected exchange-correlation potentials in Car-Parrinello total-energy calculations. Phys. Rev. B 1994, 50, 4954. [Google Scholar] [CrossRef] [PubMed]
- Grimme, S.; Antony, J.; Ehrlich, S.; Krieg, H. A consistent and accurate ab initio parametrization of density functional dispersion correction (DFT-D) for the 94 elements H-Pu. J. Chem. Phys. 2010, 132, 154104. [Google Scholar] [CrossRef] [PubMed]
- Henkelman, G.; Jónsson, H. Improved tangent estimate in the nudged elastic band method for finding minimum energy paths and saddle points. J. Chem. Phys. 2000, 113, 9978–9985. [Google Scholar] [CrossRef]
- Henkelman, G.; Jónsson, H. A dimer method for finding saddle points on high dimensional potential surfaces using only first derivatives. J. Chem. Phys. 1999, 111, 7010–7022. [Google Scholar] [CrossRef]


| Catalysts | C=O Relative Content Percentage (%) | O=C-O Relative Content Percentage (%) | C-OH/C-O-C Relative Content Percentage (%) | Adsorbed Water (%) |
|---|---|---|---|---|
| MC-500 | 7.16 | 49.80 | 41.54 | 1.50 |
| MC-600 | 12.90 | 50.79 | 29.66 | 6.65 |
| MC-700 | 6.52 | 80.43 | 4.89 | 8.16 |
| MC-800 | 8.53 | 32.58 | 52.24 | 6.65 |
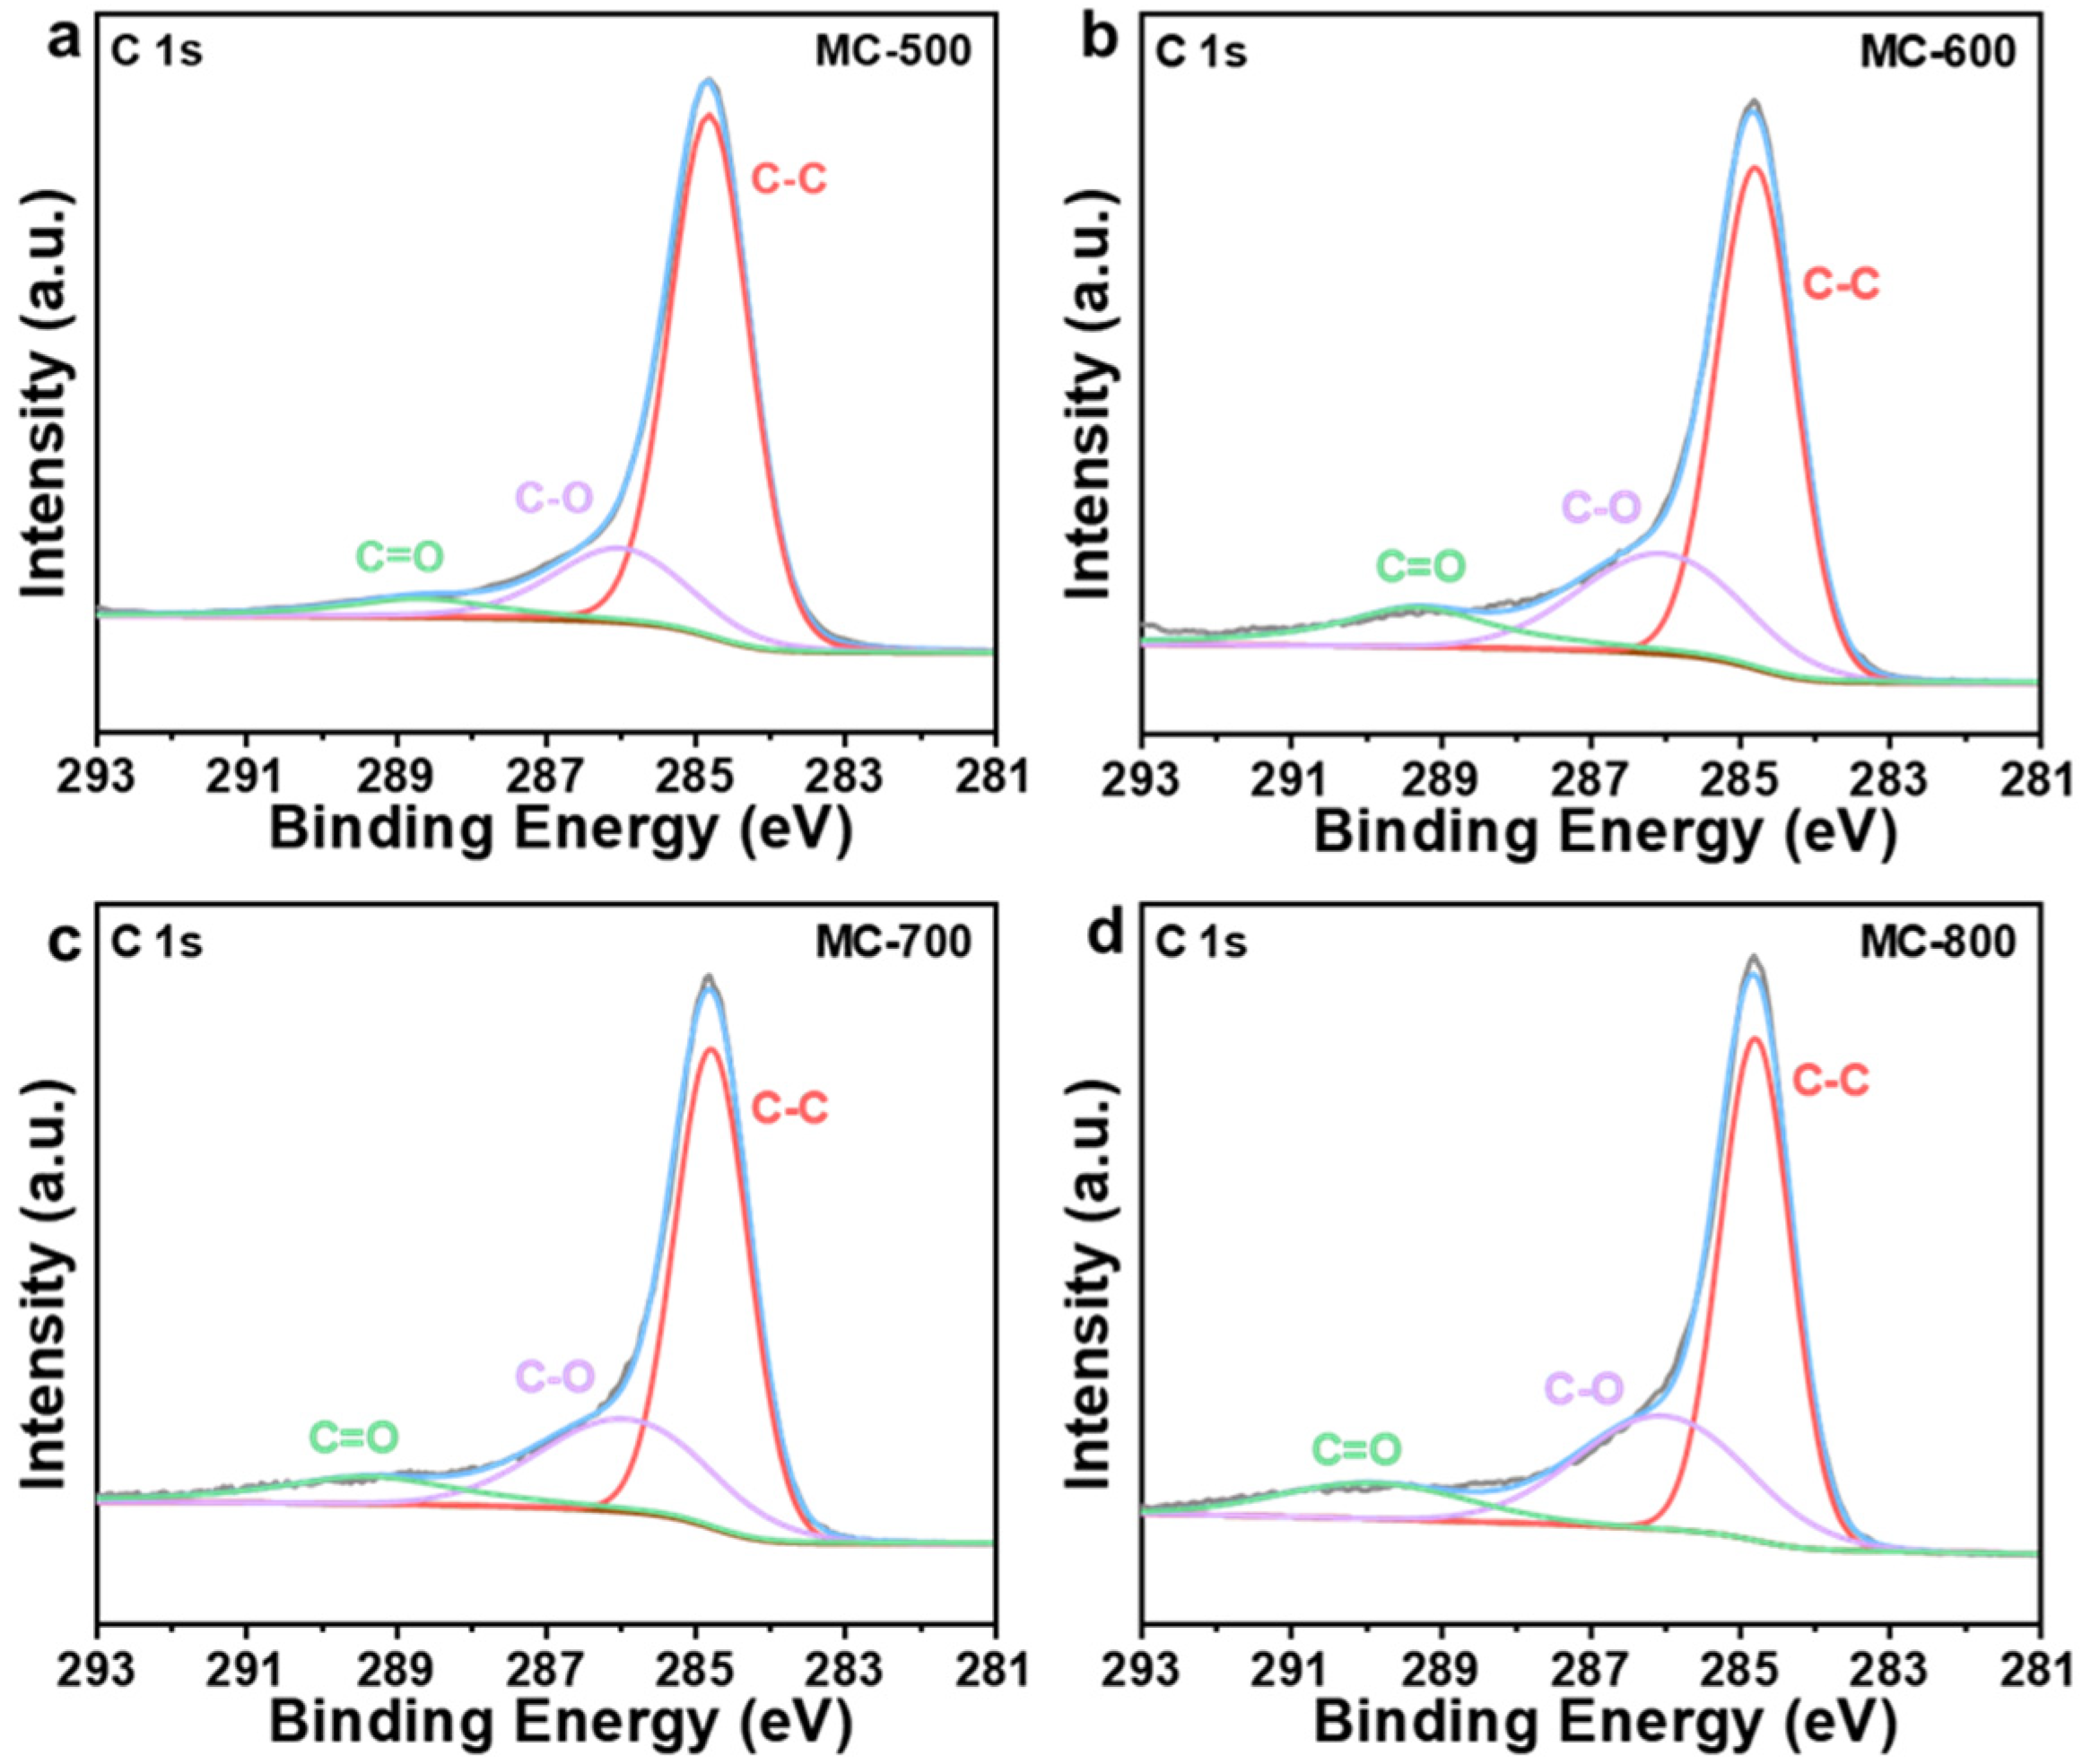
| Catalysts | C-C Bonds Relative Content Percentage (%) | C-O Bonds Relative Content Percentage (%) | C=O Bonds Relative Content Percentage (%) |
|---|---|---|---|
| MC-500 | 73.21 | 19.44 | 7.35 |
| MC-600 | 60.71 | 25.14 | 14.15 |
| MC-700 | 60.77 | 26.97 | 12.26 |
| MC-800 | 57.96 | 31.10 | 10.94 |
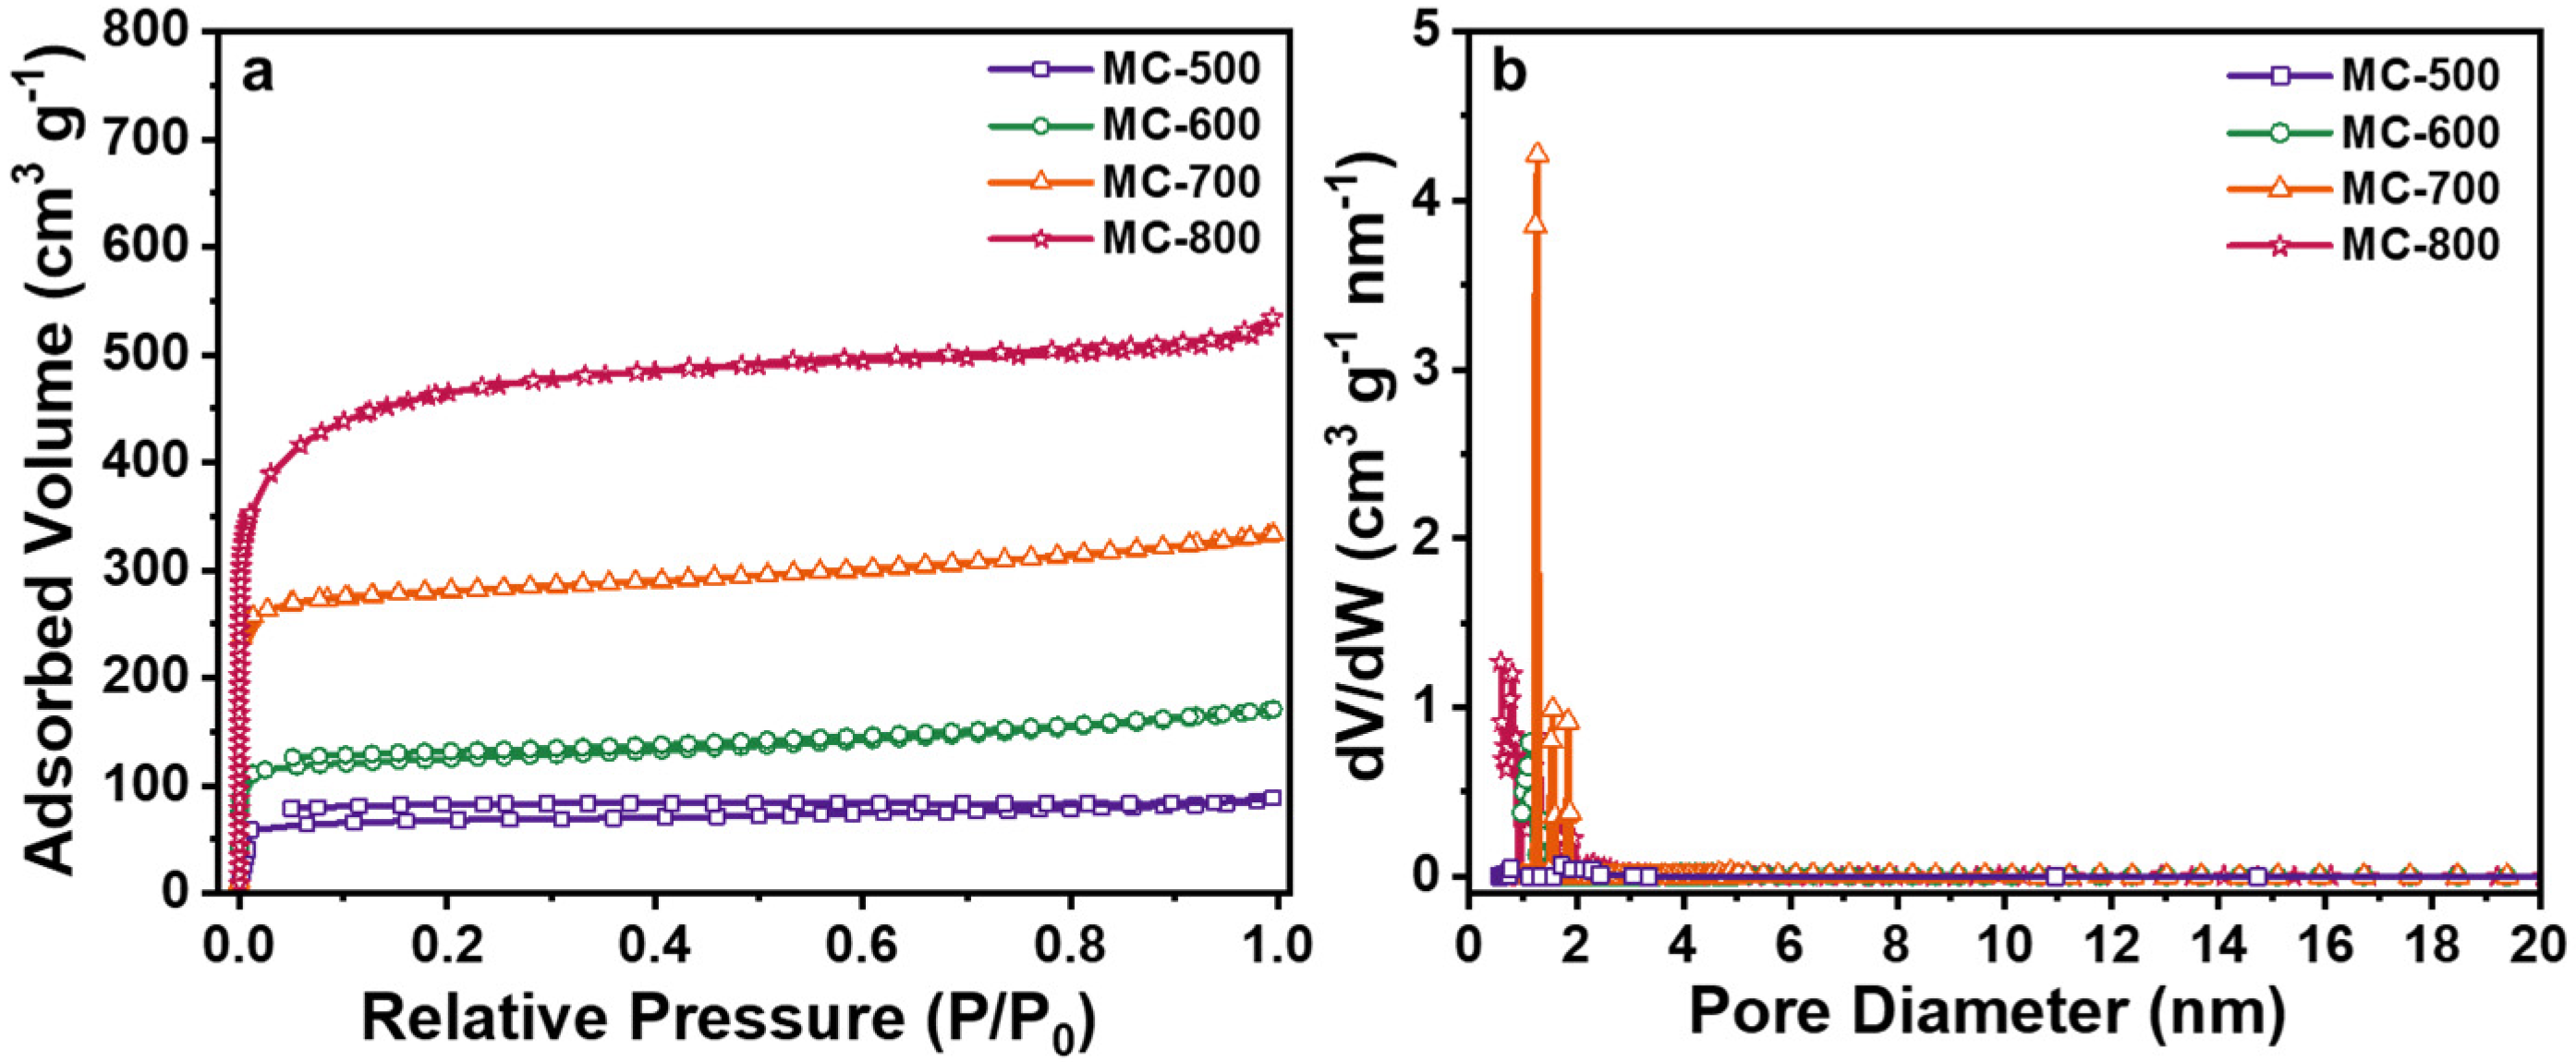
| Catalysts | (m2 g−1) | (m2 g−1) | (cm3 g−1) | (cm3 g−1) | (nm) |
|---|---|---|---|---|---|
| MC-500 | 214 | 170 | 0.13 | 0.09 | 2.40 |
| MC-600 | 384 | 293 | 0.26 | 0.15 | 2.76 |
| MC-700 | 849 | 721 | 0.52 | 0.38 | 2.43 |
| MC-800 | 1748 | 1707 | 0.83 | 0.74 | 1.90 |
| Catalysts | T °C | Reaction Gas Composition | GHSV (mL gcat.−1 h−1) | CH4 Conv. (%) | H2/CO Ratio | Reaction Rate (mmolCH4 gcat.−1 h−1) | Ref. |
|---|---|---|---|---|---|---|---|
| Coal char | 1050 | CH4/CO2/N2 = 1/1/8 | 3750 | 52.7 | 0.75 | 8.15 | [11] |
| Char | 952 | CH4/CO2/N2 = 1/1/8 | 1154 | ~50.0 | ~0.57 | 2.38 | [40] |
| WAC | 838 | CH4/CO2/N2 = 1/1/3 | 6000 | ~53.0 | ~1.56 | 26.22 | [41] |
| bio-char | 800 | CH4/(CO2+ steam) = 1/1 | 1200 | ~93.5 | ~2.00 | 23.13 | [42] |
| Fe-C2 | 800 | CH4/CO2/N2 = 1/1/2 | 2400 | ~97.0 | ~1.00 | 23.99 | [7] |
| MC-600-800 | 800 | CH4/CO2/N2 = 1/1/8 | 6000 | 50.7 | 0.57 | 12.62 | This Work |
| Catalysts | C=O Relative Content Percentage (%) | O=C-O Relative Content Percentage (%) | C-OH/C-O-C Relative Content Percentage (%) | Adsorbed Water (%) |
|---|---|---|---|---|
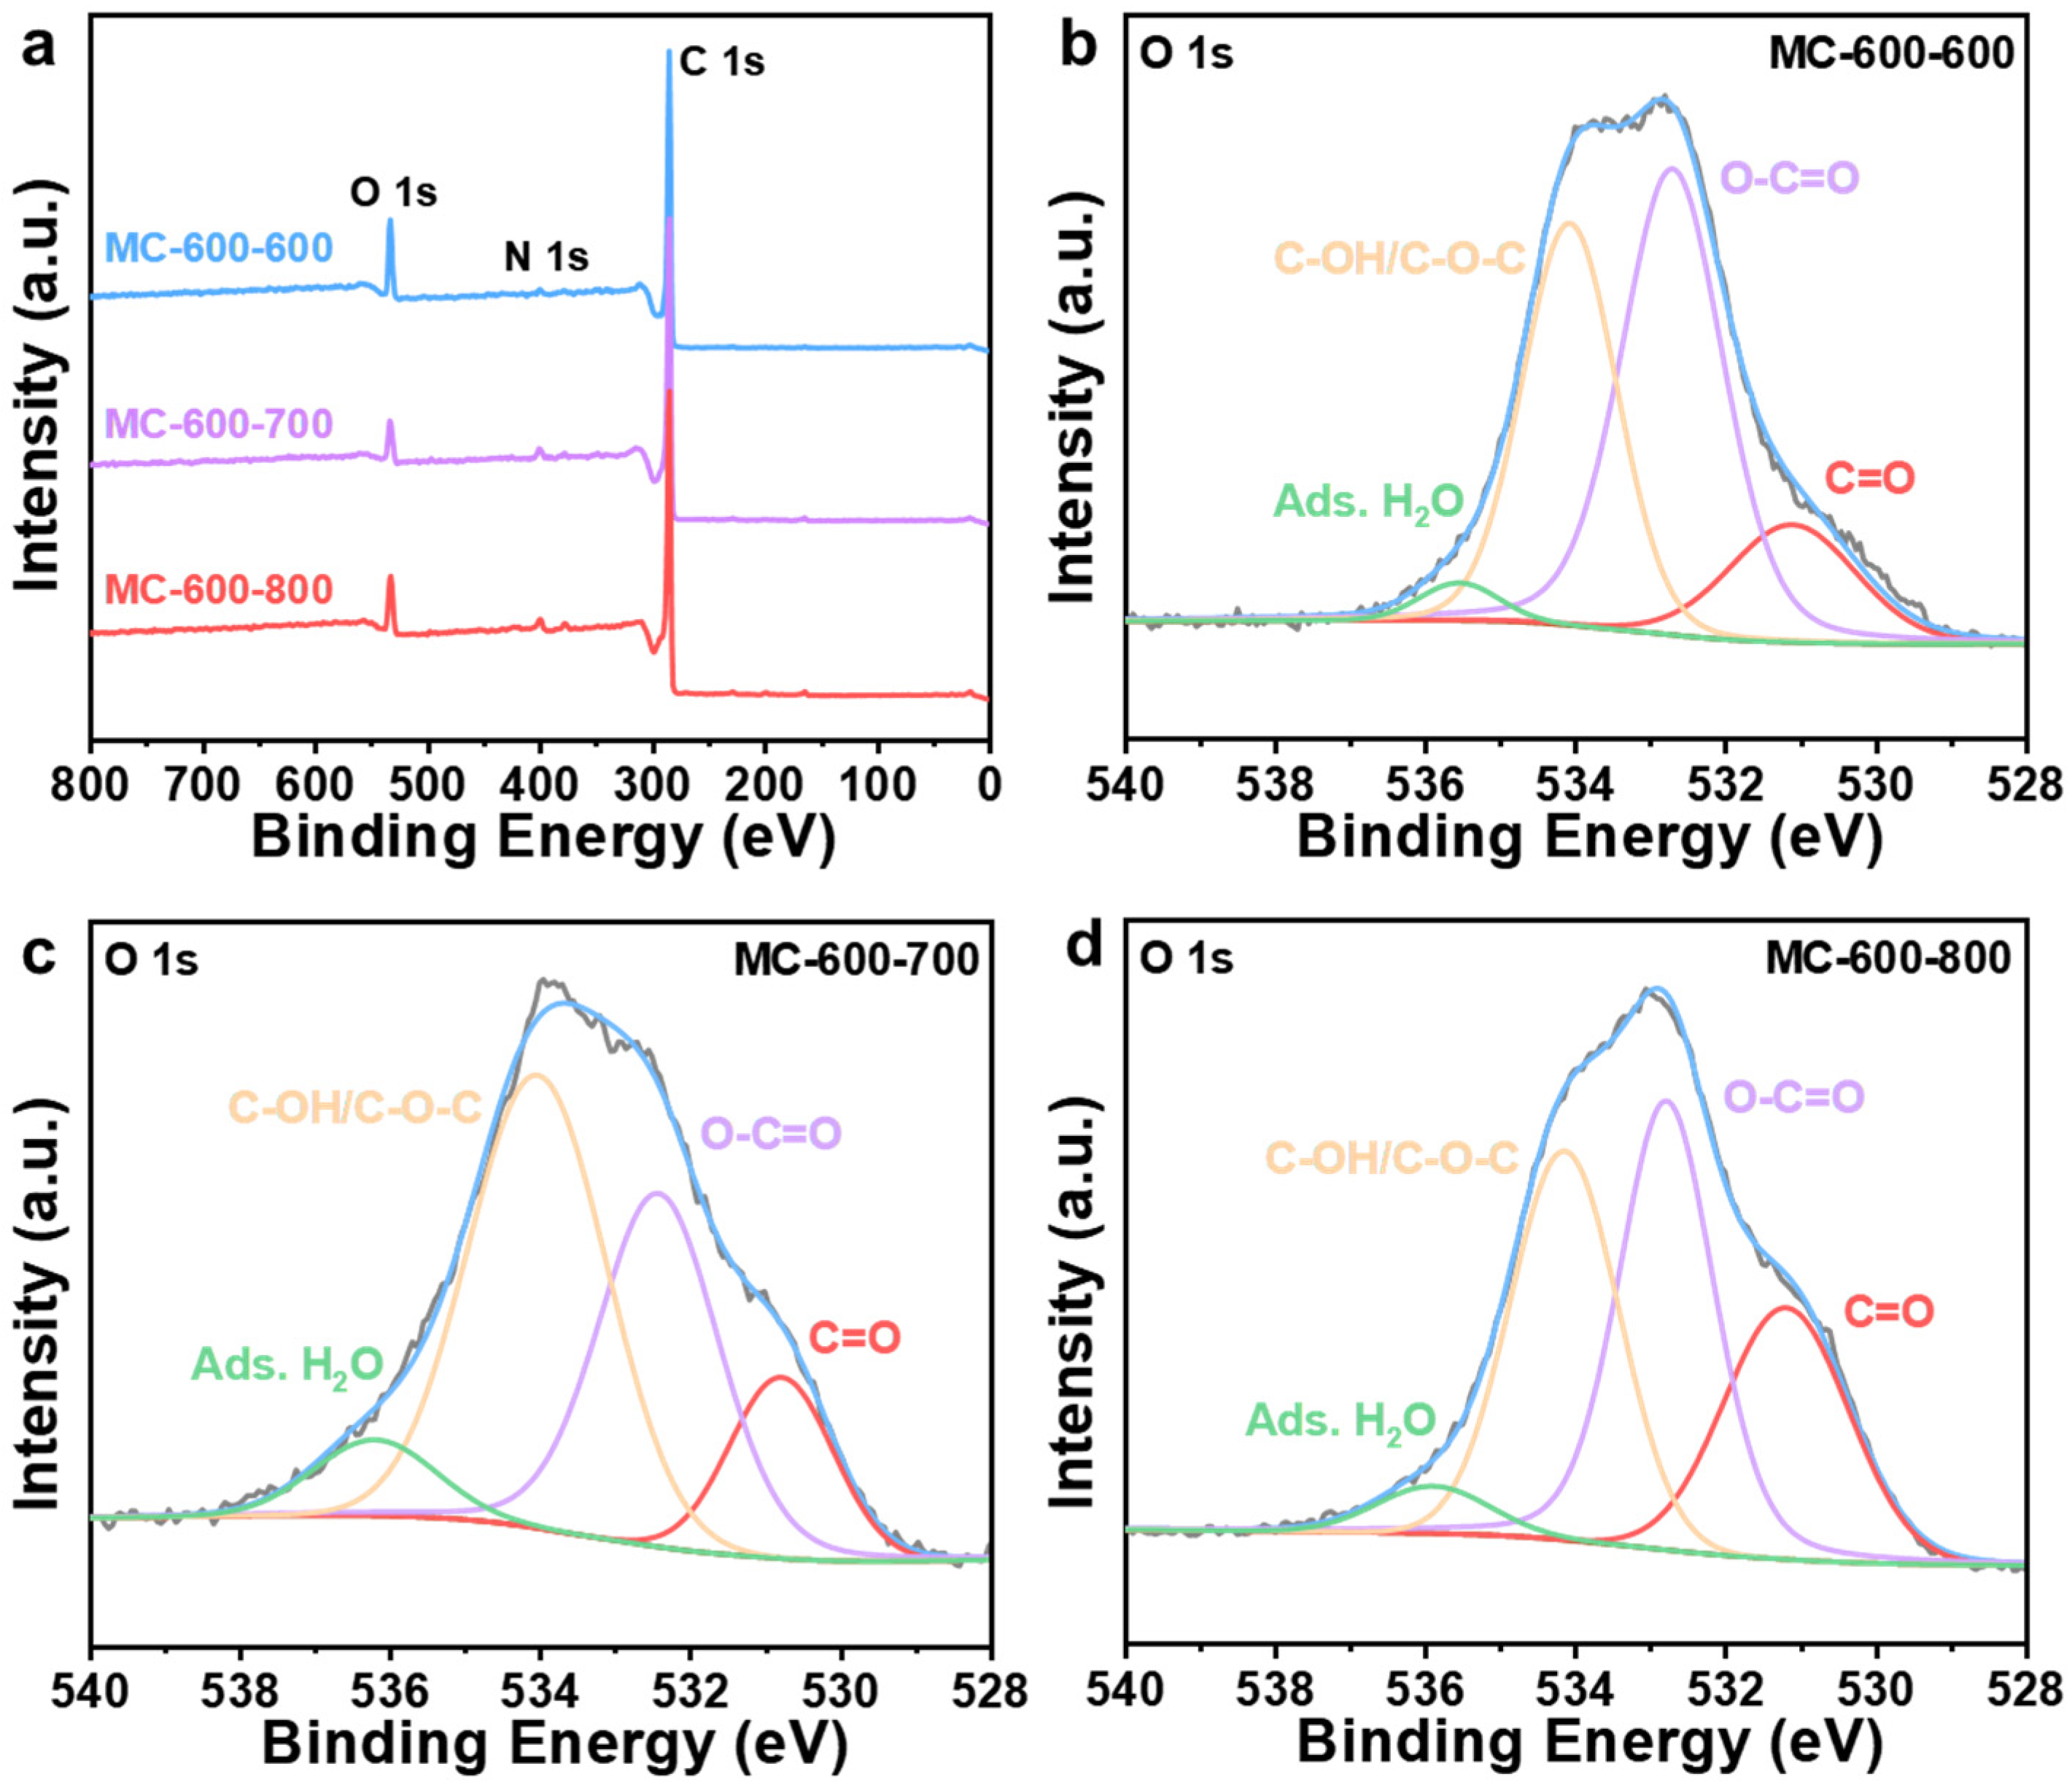
| MC-600-600 | 14.15 | 47.58 | 35.61 | 2.67 |
| MC-600-700 | 14.13 | 33.91 | 45.18 | 6.78 |
| MC-600-800 | 24.88 | 37.54 | 33.36 | 4.21 |
| Catalysts | C-C Bonds Relative Content Percentage (%) | C-O Bonds Relative Content Percentage (%) | C=O Bonds Relative Content Percentage (%) |
|---|---|---|---|
| MC-600-600 | 66.30 | 27.33 | 6.37 |
| MC-600-700 | 60.58 | 28.77 | 10.65 |
| MC-600-800 | 51.92 | 35.01 | 13.07 |
| Catalysts | C=O Relative Content Percentage (%) | O=C-O Relative Content Percentage (%) | C-OH/C-O-C Relative Content Percentage (%) | Adsorbed Water (%) |
|---|---|---|---|---|
| Spent MC-600 | 9.30 | 55.80 | 24.30 | 10.60 |
| Spent MC-600-600 | 11.60 | 40.03 | 27.09 | 21.28 |
| Spent MC-600-700 | 12.41 | 35.25 | 42.06 | 10.28 |
| Spent MC-600-800 | 24.43 | 37.57 | 24.42 | 13.58 |
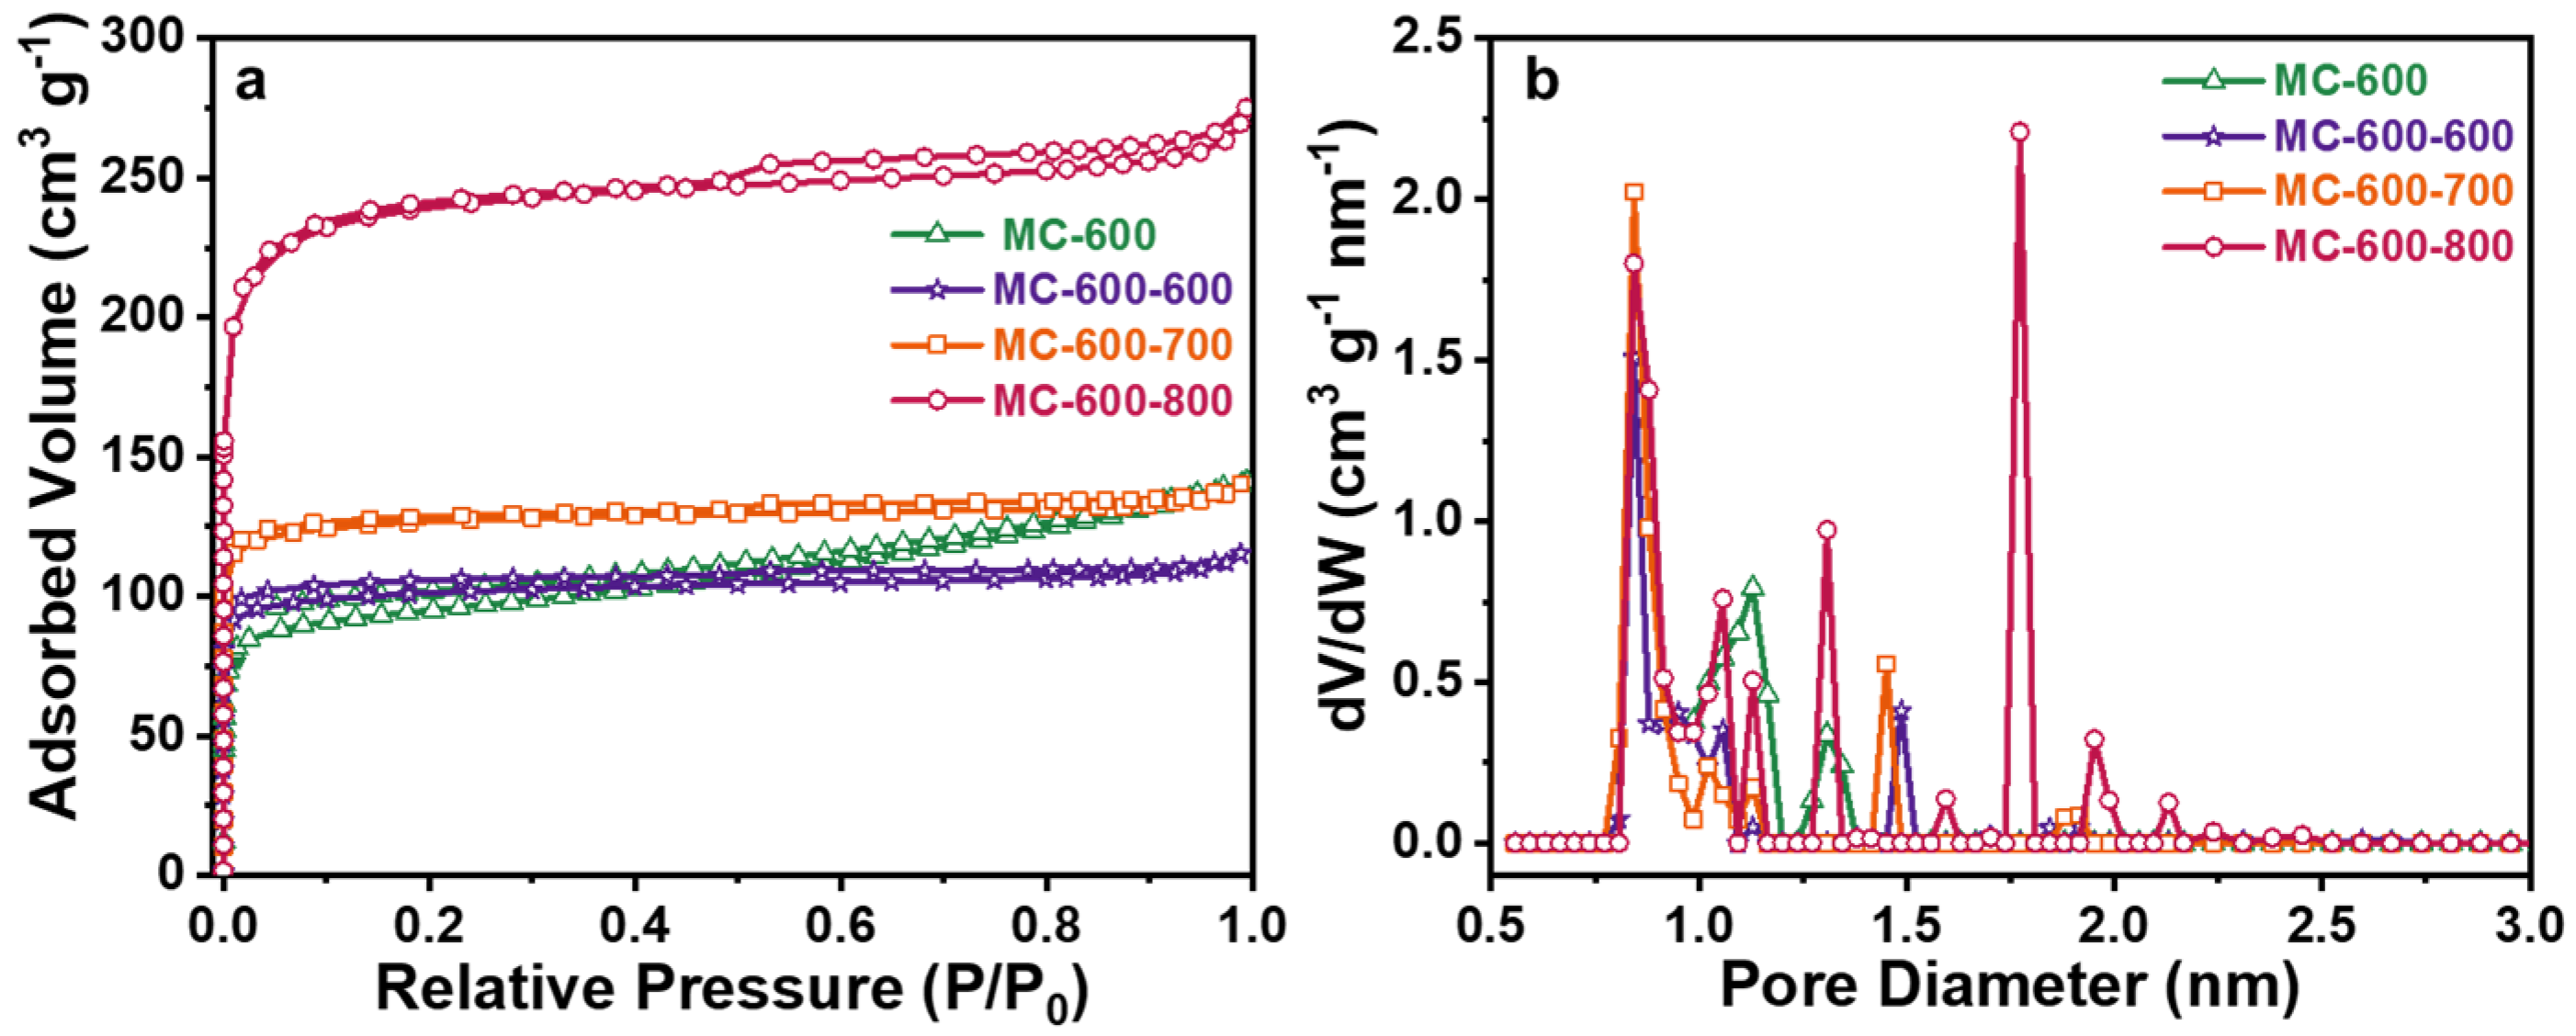
| Catalysts | (m2 g−1) | (m2 g−1) | (cm3 g−1) | (cm3 g−1) | (nm) |
|---|---|---|---|---|---|
| MC-600 | 384 | 293 | 0.26 | 0.15 | 2.76 |
| MC-600-600 | 398 | 390 | 0.18 | 0.16 | 1.80 |
| MC-600-700 | 500 | 494 | 0.22 | 0.20 | 1.74 |
| MC-600-800 | 917 | 897 | 0.43 | 0.37 | 1.86 |
Disclaimer/Publisher’s Note: The statements, opinions and data contained in all publications are solely those of the individual author(s) and contributor(s) and not of MDPI and/or the editor(s). MDPI and/or the editor(s) disclaim responsibility for any injury to people or property resulting from any ideas, methods, instructions or products referred to in the content. |
© 2024 by the authors. Licensee MDPI, Basel, Switzerland. This article is an open access article distributed under the terms and conditions of the Creative Commons Attribution (CC BY) license (https://creativecommons.org/licenses/by/4.0/).
Share and Cite
Huo, K.; Sun, Y.; Jiang, H.; Lin, S.; Fang, H.; Cheng, Z.; Cao, S.; Li, L.; Wang, Y.; Wu, M. Petroleum Pitch-Derived Porous Carbon Materials as Metal-Free Catalyst for Dry Reforming of Methane. Molecules 2024, 29, 4642. https://doi.org/10.3390/molecules29194642
Huo K, Sun Y, Jiang H, Lin S, Fang H, Cheng Z, Cao S, Li L, Wang Y, Wu M. Petroleum Pitch-Derived Porous Carbon Materials as Metal-Free Catalyst for Dry Reforming of Methane. Molecules. 2024; 29(19):4642. https://doi.org/10.3390/molecules29194642
Chicago/Turabian StyleHuo, Kaixuan, Yu Sun, Hu Jiang, Shiyuan Lin, Haiqiu Fang, Zhinian Cheng, Shaochen Cao, Liangjun Li, Yang Wang, and Mingbo Wu. 2024. "Petroleum Pitch-Derived Porous Carbon Materials as Metal-Free Catalyst for Dry Reforming of Methane" Molecules 29, no. 19: 4642. https://doi.org/10.3390/molecules29194642
APA StyleHuo, K., Sun, Y., Jiang, H., Lin, S., Fang, H., Cheng, Z., Cao, S., Li, L., Wang, Y., & Wu, M. (2024). Petroleum Pitch-Derived Porous Carbon Materials as Metal-Free Catalyst for Dry Reforming of Methane. Molecules, 29(19), 4642. https://doi.org/10.3390/molecules29194642