Article

The Effect of Solvents on the Crystal Morphology of Isosorbide Mononitrate and Its Molecular Mechanisms

1
School of Chemistry and Chemical Engineering, Shandong University, Jinan 250100, China
2
National Engineering and Technology Research Center of Chirality Pharmaceutical, Linyi 276006, China
3
Lunan Pharmaceutical Group Co., Ltd., Linyi 273400, China
4
Library of Linyi University, Linyi University, Linyi 276000, China
*
Author to whom correspondence should be addressed.
Molecules 2024, 29(2), 367; https://doi.org/10.3390/molecules29020367
Submission received: 4 December 2023 / Revised: 21 December 2023 / Accepted: 9 January 2024 / Published: 11 January 2024
(This article belongs to the Special Issue Advances in Molecular Dynamics and Molecular Modeling)

Abstract

:
In this work, the modified attachment energy model was used to predict the crystal morphology of isosorbide mononitrate (ISMN) in the dichloromethane (CH2Cl2) solvent system and dichloromethane-n-hexane (CH2Cl2-C6H14) mixed solvent system. The solvent effect can significantly affect the crystal morphology, which can profoundly impact both the drug’s physicochemical properties and the subsequent technological treatment process. In addition, the interactions between solvent molecules and crystal faces were investigated using molecular dynamics simulation, and radial distribution function (RDF) analysis was performed to determine the types of interactions. The structural parameter S was introduced to characterize the roughness of each crystal surface; the change in the CH2Cl2 diffusion coefficient before and after the addition of C6H14 was analyzed using mean square displacement (MSD). The calculation results of the modified attachment energy from the two solvent systems revealed that C6H14 could accelerate crystal growth, while the crystal morphology was not greatly affected, which is of some significance as a guide for the industrial crystallization process.

1. Introduction

In the pharmaceutical industry, crystallization is a key step in controlling the crystal habit, which affects the solubility [1], dissolution rate [2], and bioavailability of the drug [3]. At the same time, crystallization is also a key factor affecting postprocessing procedures, such as fluidity [4], stability [5,6], and tableting performance [7,8]. Ren et al. investigated the differences in solubility and dissolution rate of five different crystal habits of ticagrelor (TICA) type II crystals (TICA-A, TICA-B, TICA-C, TICA-D, and TICA-E) in hydrochloric acid solution at pH = 1.2 [9]. Phan et al. prepared two different crystal habits of sorafenib tosylate (Sor-Tos) and investigated their dissolution rates in water and gastric juice pH = 1.2 acid solution [10]. Due to the poor mobility of fine needle-like crystals and the tendency to clog and agglomerate during the formulation process, Pu et al. avoided the formation of needle-like crystals of the glycopeptide vancomycin by controlling the pH and salt concentration [11]. The crystal morphology of ISMN is needle-like, with poor fluidity and low packing density, which brings inconvenience to the subsequent process treatment process [12]. After chemical synthesis of ISMN, the product is purified and refined by solution crystallization [13], and in the process of solution crystallization, different solvents have a large effect on the crystal morphology due to the different sensitivity of crystal faces to solvents [14]. The study of the molecular mechanism of ISMN crystal habit manipulation is important for improving the crystallization process and enhancing product properties.
As a vasodilator, ISMN has broad market prospects because of its pharmacokinetic advantages [15], such as no first-pass effect, high bioavailability, and long duration of action. At present, studies on ISMN mainly focus on pharmacokinetics and synthesis routes [16], but there are few studies on its crystallization and its influence mechanism. Cao et al. investigated the solid–liquid equilibrium behavior of 5-ISMN in different solvent systems and its nucleation behavior in the metastable region, revealing the influence of solvents on the nucleation behavior of 5-ISMN [12]. In this work, the crystal morphology of 5-ISMN in CH2Cl2 and mixed solvent (CH2Cl2-C6H14) was investigated, and the mechanism of the solvent effect on the crystal morphology of 5-ISMN was explained at the molecular level.
With the development of molecular simulation technology, the research method of studying the effect of solvent on crystal morphology by observing crystals cultured from experiments has become a thing of the past. Molecular simulation mainly includes molecular dynamics methods and Monte Carlo methods, which have been widely used in various fields. Song et al. used molecular dynamics simulations for solvent selection to achieve crystal morphology regulation of propionamide [17], and Chen et al. used the Monte Carlo method to predict the adsorption capacity of water molecules on the surface of ammonium dinitramide (ADN) crystals [18]. Additionally, HABIT software can be used for crystal morphology prediction, such as HABIT98 and HABIT95 [19]. HABIT software uses the atom–atom approximation to determine intermolecular interactions in molecular crystals and further calculates the attachment energy. The crystal morphology is modeled by the attachment energy [20]. Roberts et al. used HABIT98 software to study lattice energies and constituent intermolecular interactions for the crystal structures of pharmaceuticals [21]. The program Mercury, developed at the Cambridge Crystallographic Data Centre, has become a powerful platform delivering analysis, design, and prediction functionality alongside visualization for crystal structure [22]. Childs et al. used the Materials module of Mercury CSD to analyze 50 crystal structures containing carbamazepine [23]. In this work, molecular dynamics simulation was used to study the crystal morphology of 5-ISMN.

2. Results and Discussion

2.1. Intermolecular Interactions within the Crystal Cell

The attachment energy model (AE model), which is based on the theory of periodic bond chains (PBC) and takes into account the anisotropic properties in the crystal unit [24], is widely used for the prediction of crystal morphology. A detailed discussion of the AE model and the modified attachment energy (MAE) model is provided in Section 3. The AE model determines the relative growth rate by calculating the intermolecular interactions within the crystal cell. The direction and bond energies of intermolecular interactions within the crystal cell are shown in Figure 1.
According to the AE model, the weaker the intermolecular interaction force is, the slower the growth, and the plane corresponding to this force is of greater morphological importance [25].

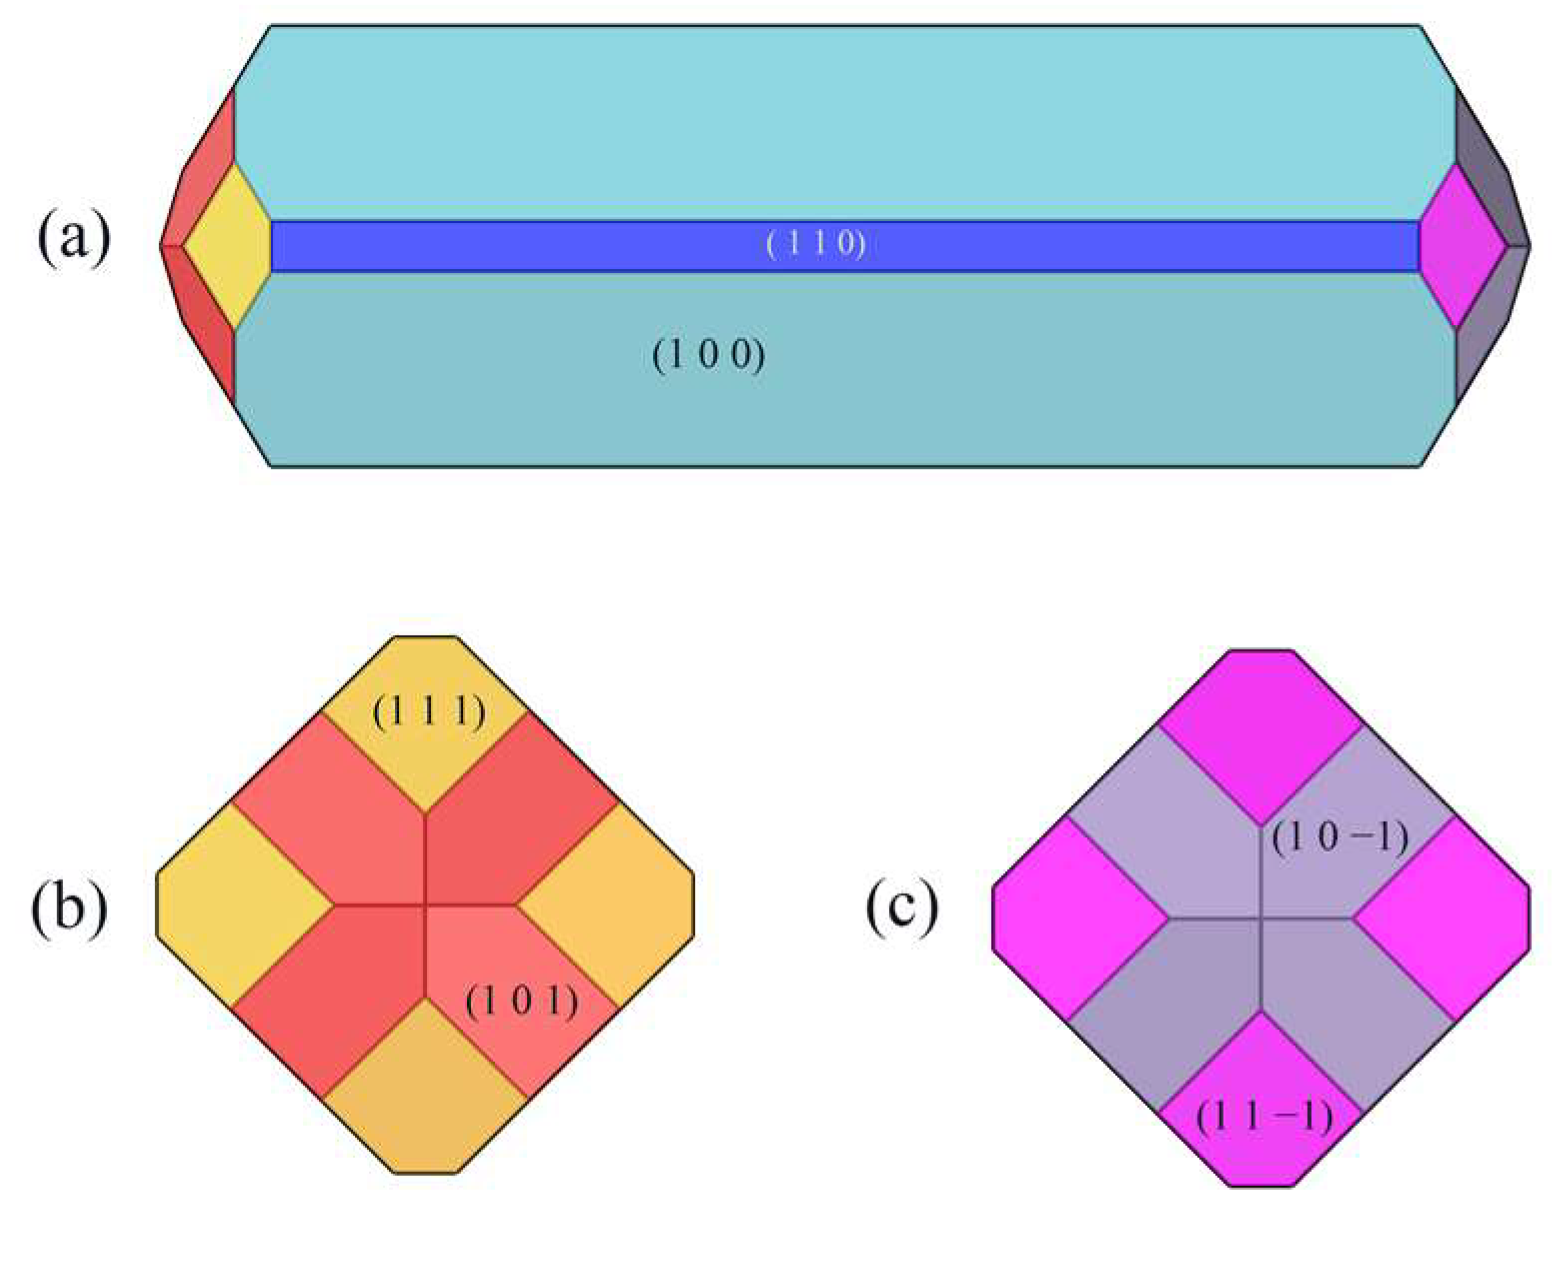
2.2. Crystal Morphology in Vacuum

The crystal morphology under vacuum was predicted using the AE model, which had six morphologically important growth surfaces, as shown in Figure 2. The Miller index (h k l) of one face is selected from all of the symmetry images to represent all symmetry-related facets. The symmetry-related facets are represented by the same color.
The interplanar distances of the six morphologically important growth surfaces, the attachment energy under vacuum, and the crystal face areas are shown in Table 1.
The absolute value of the attachment energy (|Eatt| of the (1 0 0) crystal surface is the smallest; the lattice plane spacing (dhkl) of the (1 0 0) surface is the largest, which has the greatest morphological importance; and the total crystal face area ratio is up to 72.56%.

2.3. Structural Properties of Crystal Faces

The structure of the crystal face closely affects the interaction between the solvent and the crystal face [26]. The rugosity S [27] is introduced to quantitatively characterize the roughness of the six morphologically important growth surfaces, and S is defined as follows:
S = A a c c A h k l
Aacc is the solvent-accessible area and Ahkl is the cross-sectional area of the crystal face in the unit cell.
The solvent-accessible area of each crystal face is shown in Figure 3.
The rugosity S of each crystal face are shown in Table 2.
The (1 1 0), (1 1 1), and (1 1 −1) crystal faces have similar and large roughness, and the (1 0 0) crystal face has less roughness.

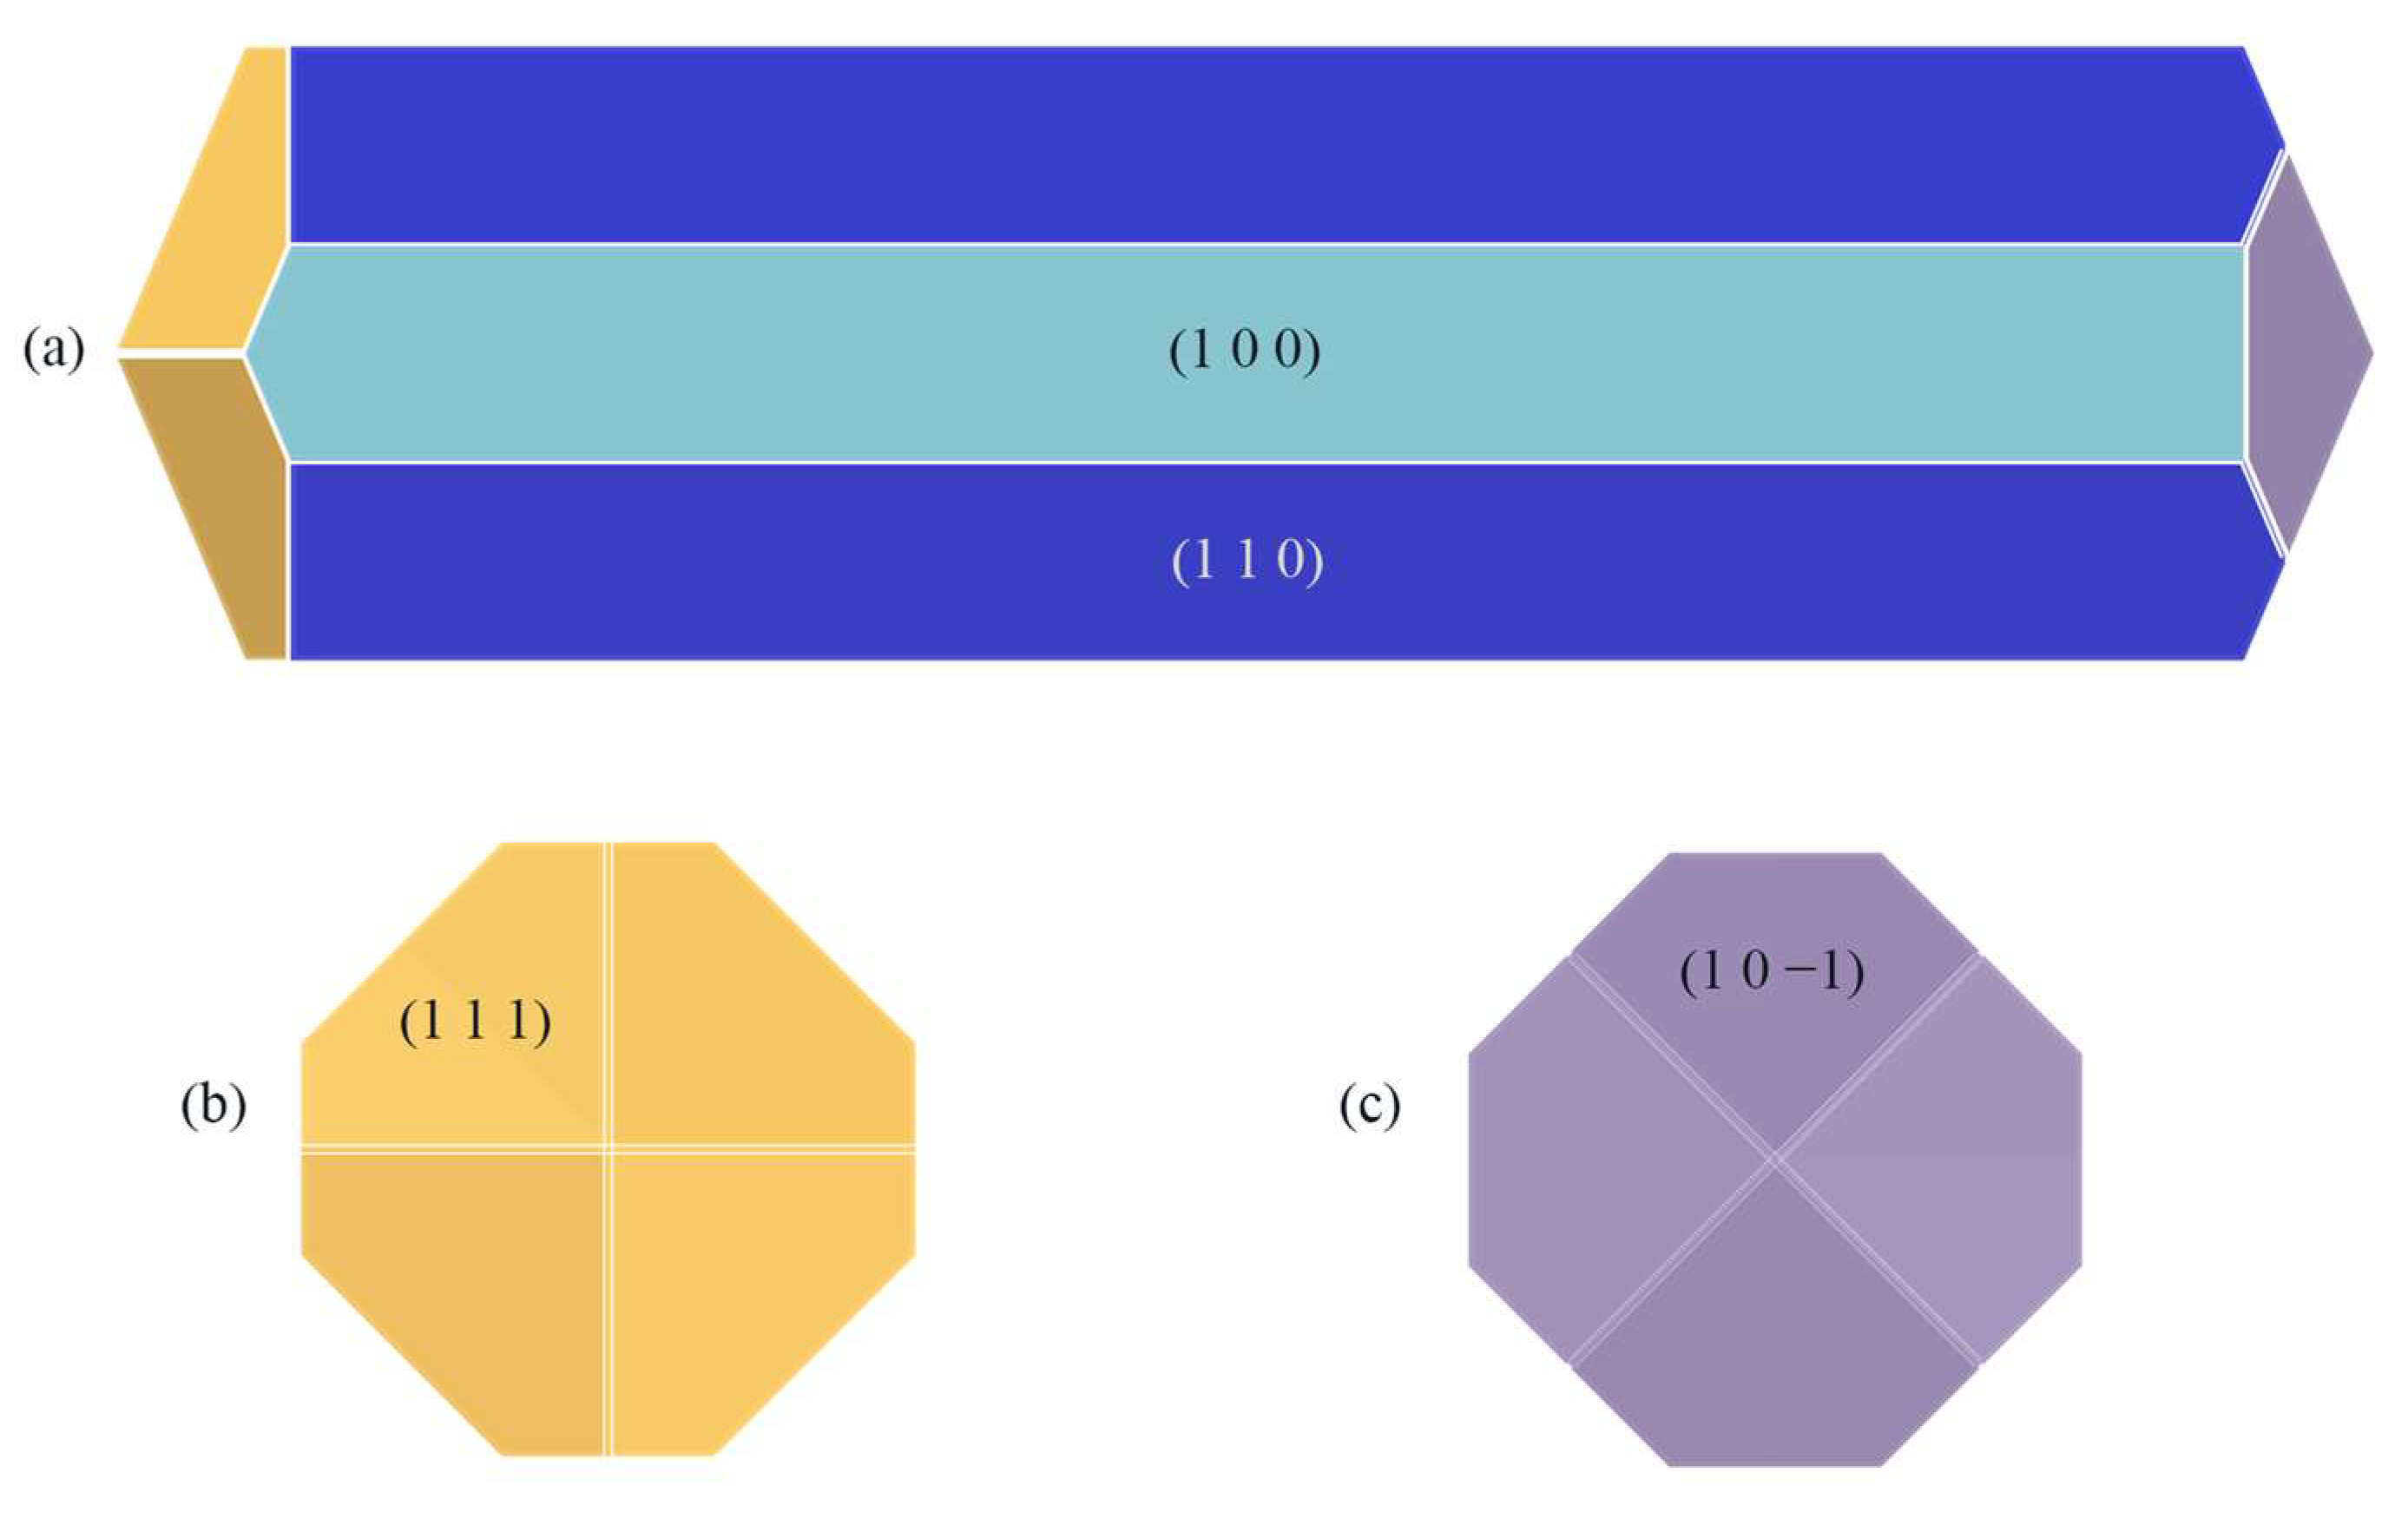
2.4. Effect of Solvent CH2Cl2 on the Morphology of ISMN

2.4.1. Crystal Morphology in the CH2Cl2 Solvent System

ISMN has high solubility in CH2Cl2 solvent, which is often used as an extractant to determine ISMN in plasma using gas chromatography [28]. In this work, CH2Cl2 was chosen as the solvent to study the influence of the solvent on the crystal morphology of ISMN.
Based on the last 100 frames of the conformations of the molecular dynamics simulations, the interaction energies of the solvent layers and crystal face layers of the six crystal face systems were calculated, and the average values were taken as the interaction energy between the solvent layer and the crystal face layer (Eint) of the corresponding systems. The modified attachment energy term (E′att) of the six morphologically important growth surfaces was calculated when the solvent was CH2Cl2, and the results of the calculations are shown in Table 3.
By calculating E’att when the solvent is CH2Cl2, the crystal morphology was predicted, as shown in Figure 4.
Compared with the crystal morphology under vacuum, the crystal morphology in the CH2Cl2 solvent system changed somewhat, with the aspect ratio changing from 3.944 in vacuum to 3.886 in the CH2Cl2 solvent system, and the relative surface area-to-volume ratio changed from 1.343 in vacuum to 1.315 in the CH2Cl2 solvent system. Meanwhile, the (1 0 1) crystal face and the (1 1 −1) crystal face no longer appeared as morphologically important growth faces in the CH2Cl2 solvent system.

2.4.2. Diffusion Coefficient

The diffusion coefficient is an important index to characterize the diffusion ability. The diffusion coefficient D can be calculated by Einstein’s diffusion equation, as shown in Equation (2), which can be fitted from the mean square displacement (MSD) [29,30].
D = 1 6 lim t d d t i = 1 N r i t r i 0 2
Different crystal face structures affect the diffusion ability of solvent molecules, thus affecting the interaction between the solvent and the crystal face. The MSD analysis of the kinetic simulation trajectories is beneficial to understanding the influence of the diffusion ability of the solvent on the crystal morphology. The MSD curves of solvent CH2Cl2 in different crystal face systems are shown in Figure 5.
The MSD curves were fitted to obtain the diffusion coefficients of the solvent molecule CH2Cl2 at different crystal faces, and the diffusion coefficient magnitude relationship was (1 1 −1) > (1 1 1) > (1 0 −1) > (1 0 1) > (1 0 0) > (1 1 0).

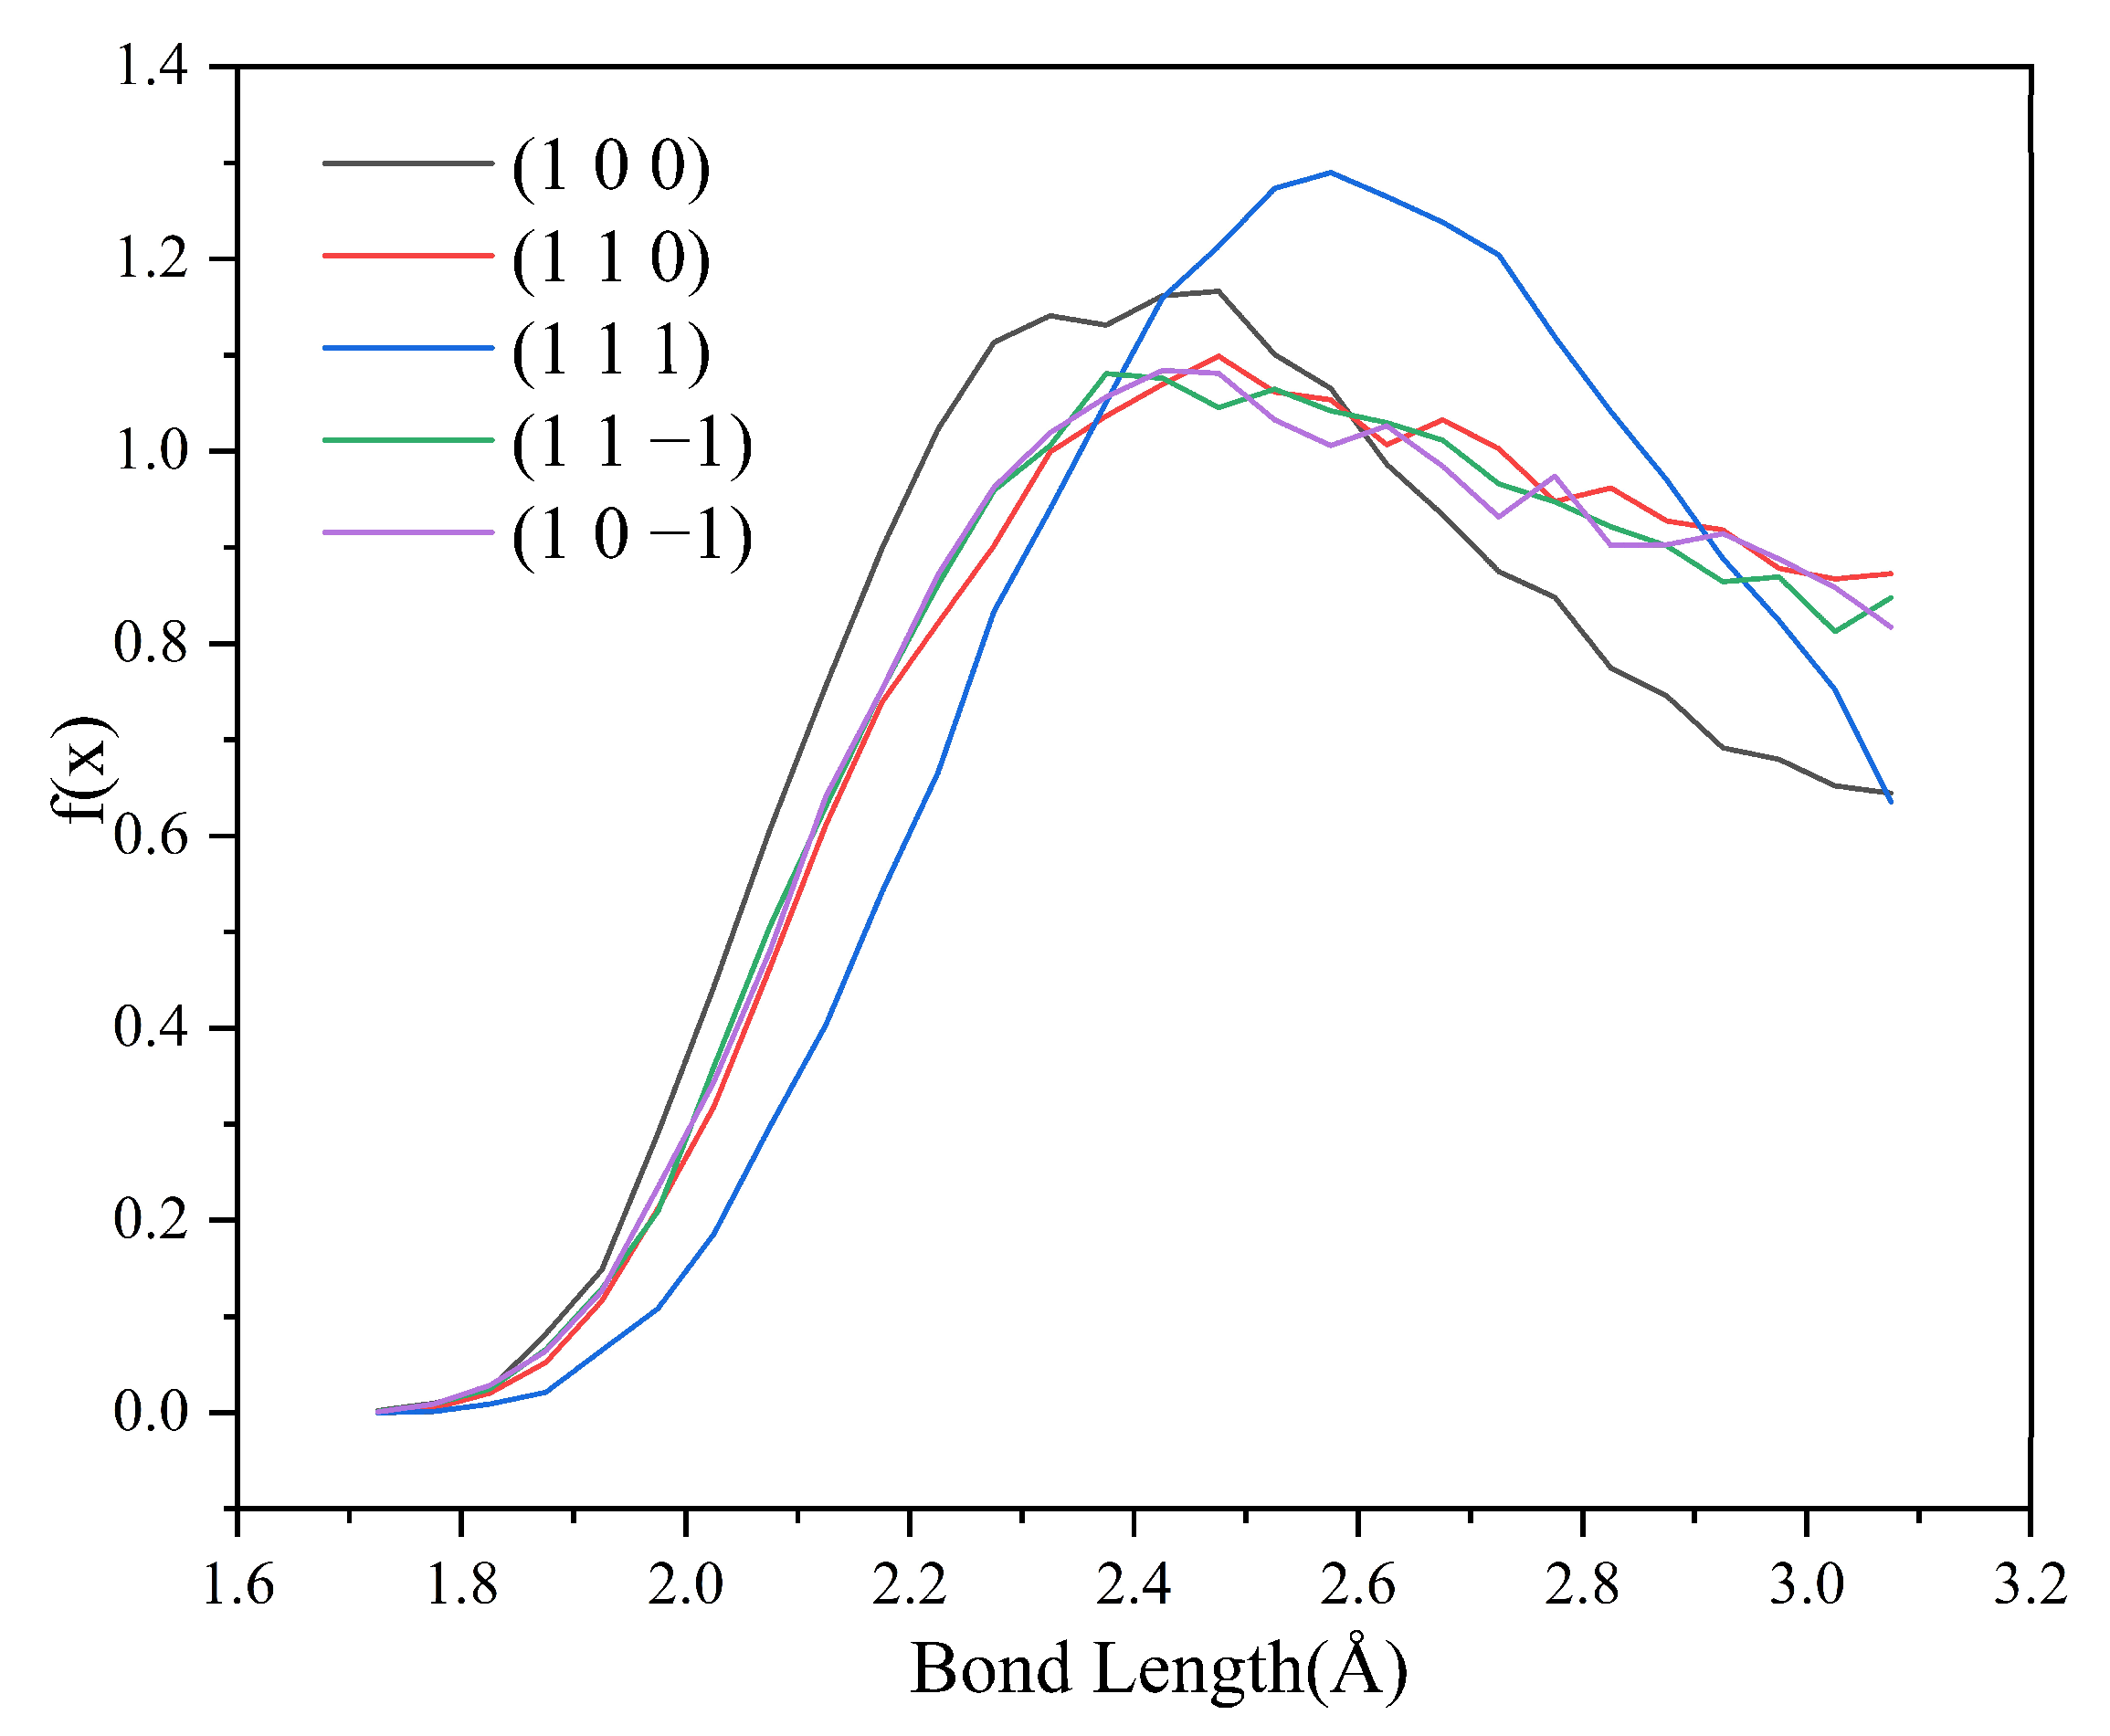
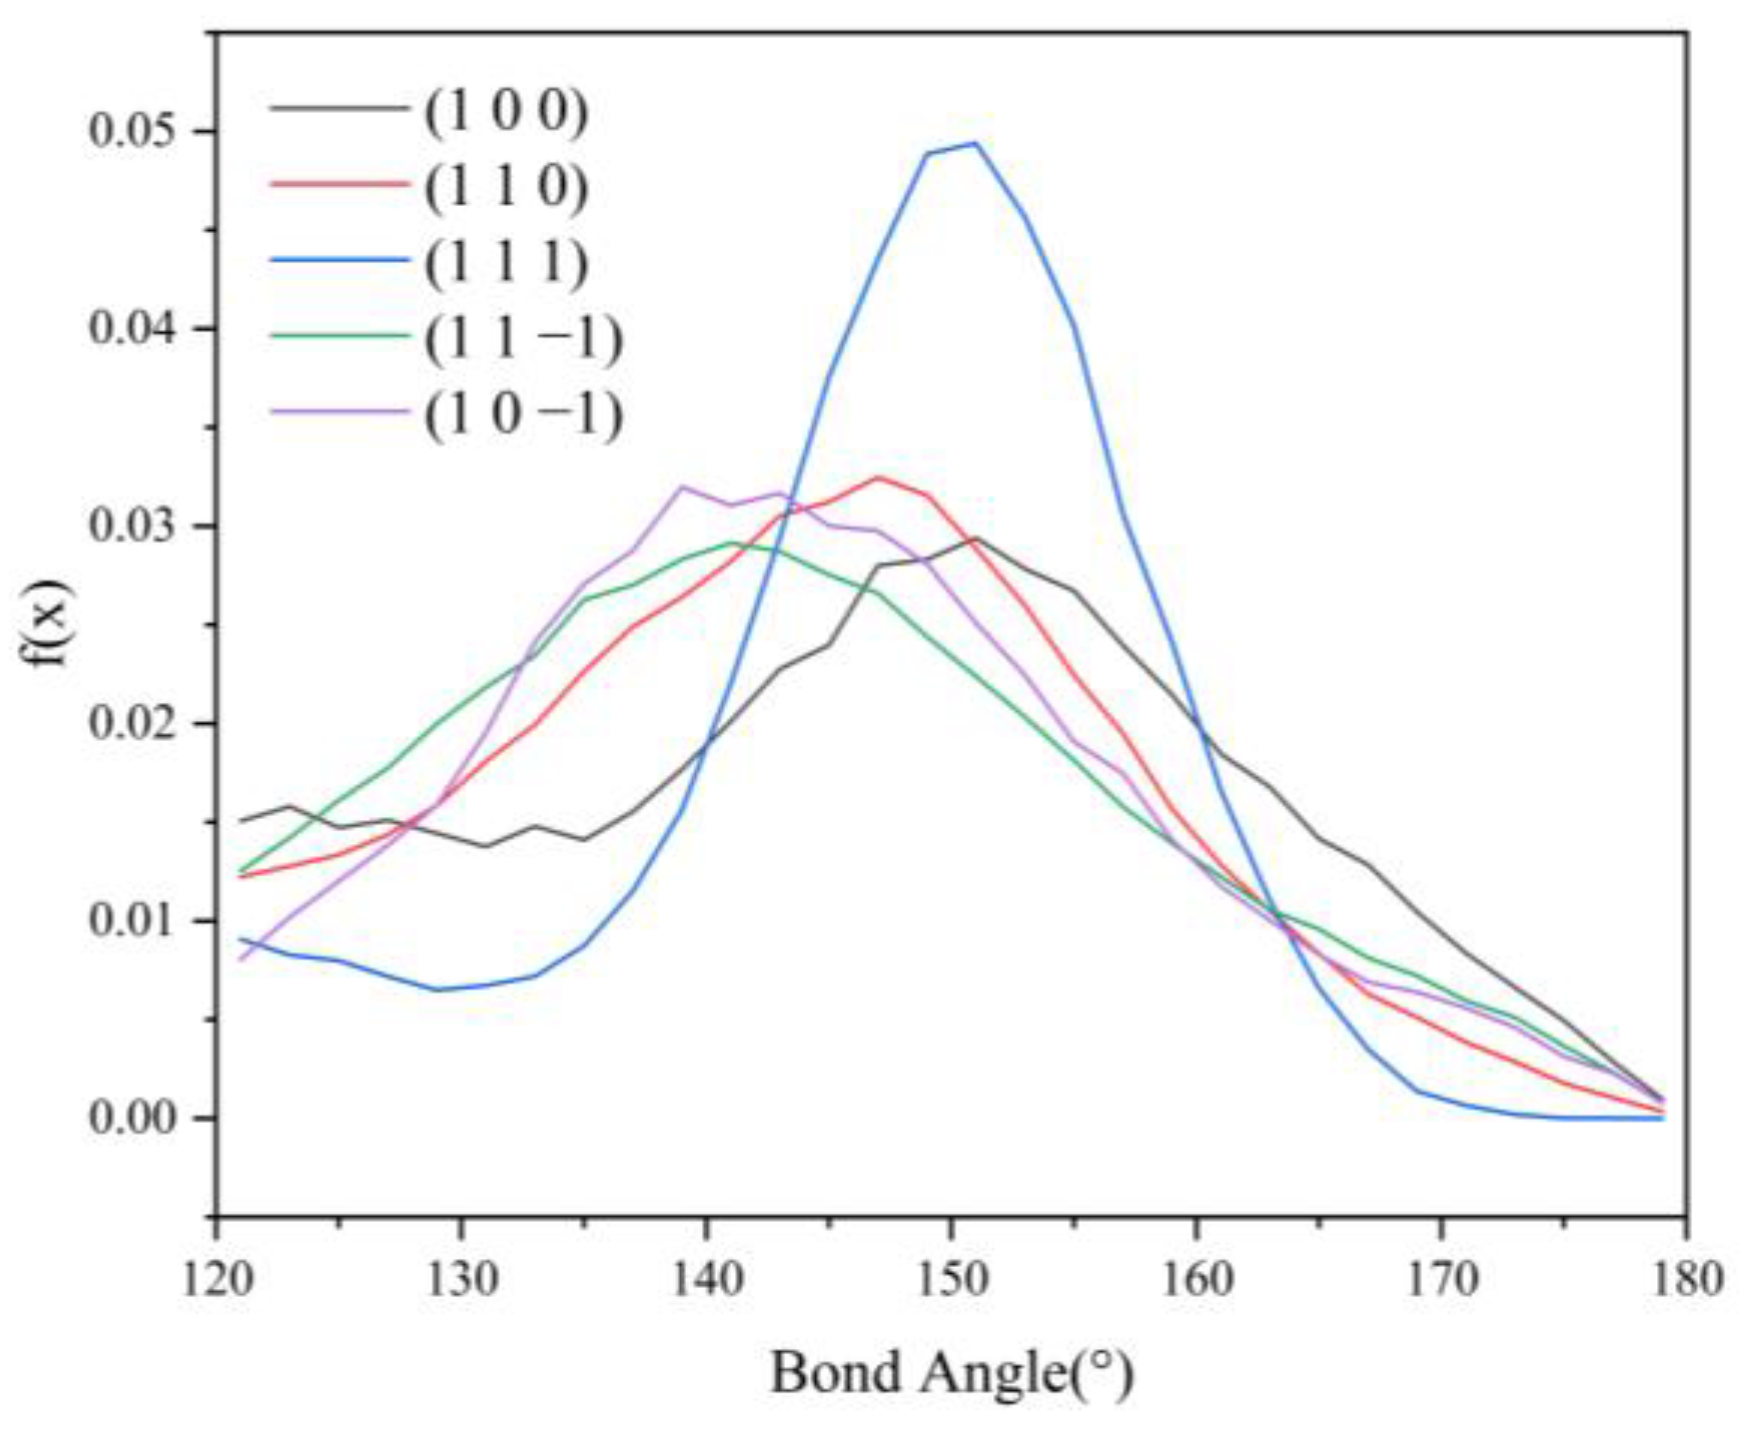
2.4.3. Radial Distribution Function Analysis

Due to the different structures of each morphologically important growth face, the exposed functional groups are also different, and the type and strength of the interaction between the solvent and each crystal face become the key factors affecting the crystal morphology. To reveal the essence of the interactions between crystal faces and solvent molecules, RDF [31,32,33] analysis is performed. The RDF is defined as the ratio of the density of the counted atoms within the shell layer at a distance r from the reference atom relative to the average density of the counted atoms in the whole simulation box, and it reflects the type of interaction to some extent.
By calculating the electrostatic potentials of ISMN and CH2Cl2, it was found that the H1 atom in the ISMN molecule has a large positive charge, while the Cl atom in the CH2Cl2 molecule has a large negative charge, as shown in Figure 6. The RDF was used to analyze the types of interactions between the H1 and Cl atoms mentioned above.
The reference atom is H1, and the counted atom is Cl, obtaining the radial distribution function between H and Cl atoms, as shown in Figure 7.
From the RDF diagram, it can be seen that a peak exists in the (1 0 0), (1 1 0), (1 1 1), (1 1 −1), and (1 0 −1) crystal face systems in the range of 2.30–2.53 Å, and the magnitude relationship of the peak intensity is (1 1 0) > (1 0 0) > (1 1 −1) > (1 1 1) > (1 0 −1). The hydrogen bond interaction is within 3.1 Å [34,35] and the van der Waals interaction is within 3.1 Å–5 Å [36]. There are hydrogen bonding interactions between H1 and Cl atoms in the above five crystal face systems.
The peak intensity of the RDF in the (1 1 0) crystal face system is significantly larger than that of the other four crystal face systems, indicating the existence of strong hydrogen bonding interactions between H1 and Cl atoms in the (1 1 0) crystal face system; the peak intensity of the (1 0 −1) crystal face system near 2.35 Å is weak, indicating the existence of weak hydrogen bonding interactions. The absence of a peak in the 3.1 Å range for the (1 0 1) crystal face system indicates that there is no hydrogen bonding interaction in this crystal system. The presence of a peak in the 3.1 Å–5 Å range for the (1 0 0), (1 1 0), (1 0 1), and (1 0 −1) crystal face systems suggests that there are also van der Waals interactions between the H1 and Cl atoms in the above crystal face systems.

2.4.4. Analysis of Hydrogen Bonding Interactions

Since no hydrogen bonding interaction is formed between the (1 0 1) crystal face and the solvent molecules, to reveal the effect of hydrogen bonding interaction on the crystal morphology, hydrogen bonding statistics were performed for the last 300 ps of the molecular dynamics simulation trajectories for the remaining five crystal face systems. Probability density distributions of the bond lengths and bond angles of the hydrogen bonds formed between H1 and Cl atoms are obtained, as shown in Figure 8.
From the probability density distribution of hydrogen bond lengths, it can be seen that the probability of hydrogen bond lengths less than 2.42 Å in the (1 0 0) crystal face is higher than that in the other four crystal faces, and the probability that the bond lengths of the hydrogen bond formed on the (1 1 1) crystal face lie in the range of 2.42–3.10 Å is greater than that on the other four crystal faces. The probability density distributions of hydrogen bond lengths are similar for the (1 1 0), (1 1 −1), and (1 0 −1) crystal face systems.
From the probability density distributions of the hydrogen bond angles formed in the five crystal face systems, it can be seen that there is little difference in the probability density distributions of hydrogen bond angles among the three crystal faces (1 1 0), (1 1 −1), and (1 0 −1). Among the five crystal face systems, the probability density distributions of hydrogen bond lengths and angles on the (1 1 1) crystal face both have the highest peaks, indicating that the distribution range of hydrogen bond lengths and angles on the (1 1 1) crystal face is relatively concentrated, and the bond lengths and angles of hydrogen bonds are more likely to occur at approximately 2.57 Å and 150°, respectively.
The angle between D-H⋯A (D is the donor, A is the acceptor) is straight or close to 180°, and the shorter the distance between H⋯A, the more stable the individual hydrogen bonding interaction formed [37]. The hydrogen bonding statistics are shown in Table 4: it can be seen that the individual hydrogen bonding interaction formed by the (1 0 0) crystal face is more stable.

2.4.5. Effect of Hydrogen Bonds on Changes in Crystal Morphology

The change in crystal morphology was analyzed from the hydrogen bond perspective by comparing the crystal morphology under vacuum with that in the CH2Cl2 solvent system. In the competitive growth process of the (1 1 1) and (1 0 1) crystal faces, the interaction between the solvent CH2Cl2 molecules and the (1 1 1) crystal face is strong because the (1 1 1) crystal face can form hydrogen bond interactions with the solvent CH2Cl2 molecules, while the (1 0 1) crystal face does not form hydrogen bond interactions with the solvent CH2Cl2 molecules. The growth of solute molecules in the (1 1 1) crystal plane is hindered, so the (1 1 1) crystal face grows slowly and shows greater morphological importance in the solvent environment.
The area percentage of the (1 1 0) crystal face varies greatly in the two conditions, with an area percentage of 12.85% in vacuum and 48.93% in the CH2Cl2 solvent system. In the competitive growth process of the lateral crystal faces of (1 0 0) and (1 1 0), the single hydrogen bond formed by the (1 0 0) crystal face is more stable, but the (1 1 0) crystal face has more H1 atoms involved in hydrogen bond formation. Considering that the MS 2018 software predicts the crystal morphology using the MAE of each crystal face in the unit cell, by counting NHB-hkl, it is found that the average number of hydrogen bonds contained in the (1 1 0) crystal face in the unit cell is much greater than that in the (1 0 0) crystal face. As a result, the interaction between the CH2Cl2 solvent molecules and the crystal face on the (1 1 0) crystal face is stronger than that on the (1 0 0) crystal face in general, and the growth of the (1 1 0) crystal face is slower, reflecting greater morphological importance.
HB length, HB angle, S1%, and S2% of the hydrogen bonds formed between the (1 1 −1) and (1 0 −1) crystal faces and the solvent molecules do not differ much. However, the bond angle probability density distribution functions of the two crystal faces show a large difference in the range of 120–150°, with the probability of the bond angle in the range of 120–133° being greater for the (1 1 −1) crystal face (shown by the green line in Figure 9) than for the (1 0 −1) crystal face (shown by the violet line in Figure 9). The probability of the bond angle of the hydrogen bonds formed on the (1 0 −1) crystal face is greater than that of the (1 1 −1) crystal face in the range of 133–150°. Under the same conditions, the larger the bond angle is, the more stable the hydrogen bond formed, so the interaction between the (1 0 −1) crystal face and the solvent molecules CH2Cl2 is stronger and shows greater morphological importance.

2.5. Prediction of Crystal Morphology in the CH2Cl2-C6H14 Solvent System and Analysis of Results

2.5.1. Crystal Morphology in the CH2Cl2-C6H14 Solvent System

Adding n-hexane (C6H14) to the solution can accelerate the volatilization of the solution and realize volatilization crystallization. Adding C6H14 to the model solvent layer, the simulation results are discussed.
The E’att of the six morphologically important growth surfaces in the CH2Cl2-C6H14 solvent system was calculated using the same method as in the CH2Cl2 solvent system, and the results are shown in Table 5.
Compared with the CH2Cl2 solvent system, the absolute value of E’att increased in all six crystal face systems in the CH2Cl2-C6H14 solvent system, indicating that after the addition of C6H14, the interaction between the solvent layer and the crystal face layer is weakened, the interaction between the solute and the crystal face is enhanced, and the growth rate of the crystal increases.
The crystal morphology in the CH2Cl2-C6H14 solvent system was obtained by E’att and is shown in Figure 10.
In contrast to the crystal morphology in the CH2Cl2 solvent system, the (1 1 −1) crystal face reappears as a morphologically important growth surface in the CH2Cl2-C6H14 solvent system.

2.5.2. Diffusion Coefficient of CH2Cl2 in the CH2Cl2-C6H14 Solvent System

The MSD of CH2Cl2 in the CH2Cl2-C6H14 solvent system was analyzed, and the results are shown in Figure 11.
The MSD curves were fitted to obtain the diffusion coefficients of the CH2Cl2 solvent molecules in the CH2Cl2-C6H14 solvent system, and the results are shown in Table 6.
The diffusion coefficients of CH2Cl2 at all six crystal face systems were increased compared with those before the addition of the volatile agent C6H14, indicating that the addition of C6H14 can accelerate the diffusion of CH2Cl2.

2.5.3. Analysis of Hydrogen Bond Interactions in the CH2Cl2-C6H14 Solvent System

Hydrogen bonding statistics were performed for the last 300 ps of the kinetic simulation trajectories of the five crystal face systems (1 0 0), (1 1 0), (1 1 1), (1 1 −1), and (1 0 −1), and the probability density distributions of the bond lengths and angles of the hydrogen bonds formed between the H1 and Cl atoms were obtained, as shown in Figure 12 and Figure 13.
Compared with the CH2Cl2 solvent system, the probability density distribution characteristics of the hydrogen bond lengths and angles did not change much after the addition of C6H14, indicating that the addition of the volatile agent C6H14 did not greatly affect the stability of the hydrogen bonds too much. The hydrogen bonding statistics are shown in Table 7.
From the statistical results, it can be seen that the HB length, HB angle, S1%, and S2% do not change much compared with those before the addition of C6H14. Except for the (1 1 1) crystal face, the NHB-unit area, and NHB-hkl in the other four crystal face systems change considerably, from which it can be hypothesized that the reduction in the number of hydrogen bonds after the addition of the volatile agent C6H14 leads to the weakening of the interaction between the solvent layer and the crystal face layer. Thus, the absolute value of the Es term in the modified attachment energy model decreases, and the absolute value of E’att increases.

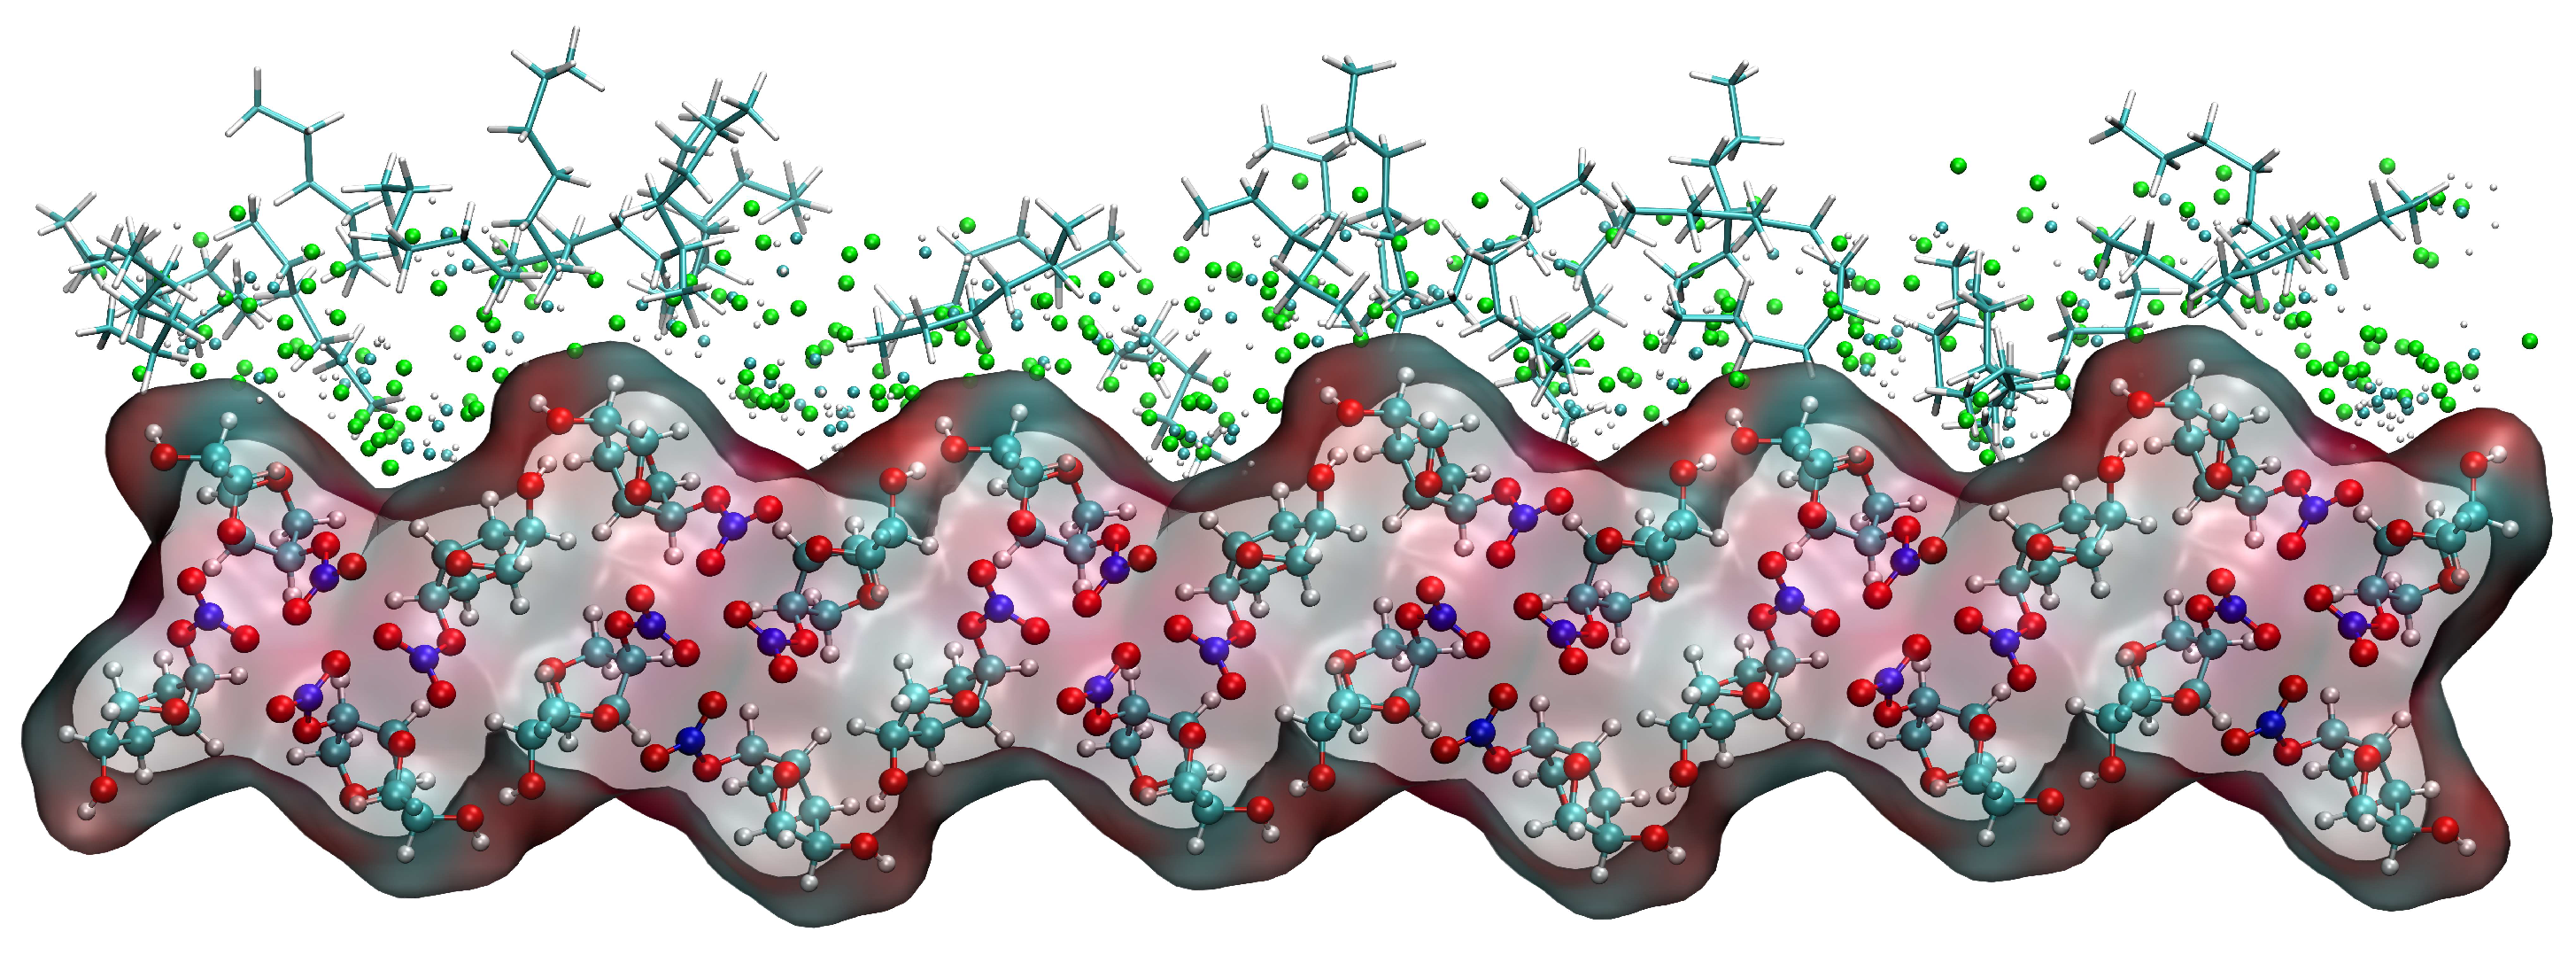
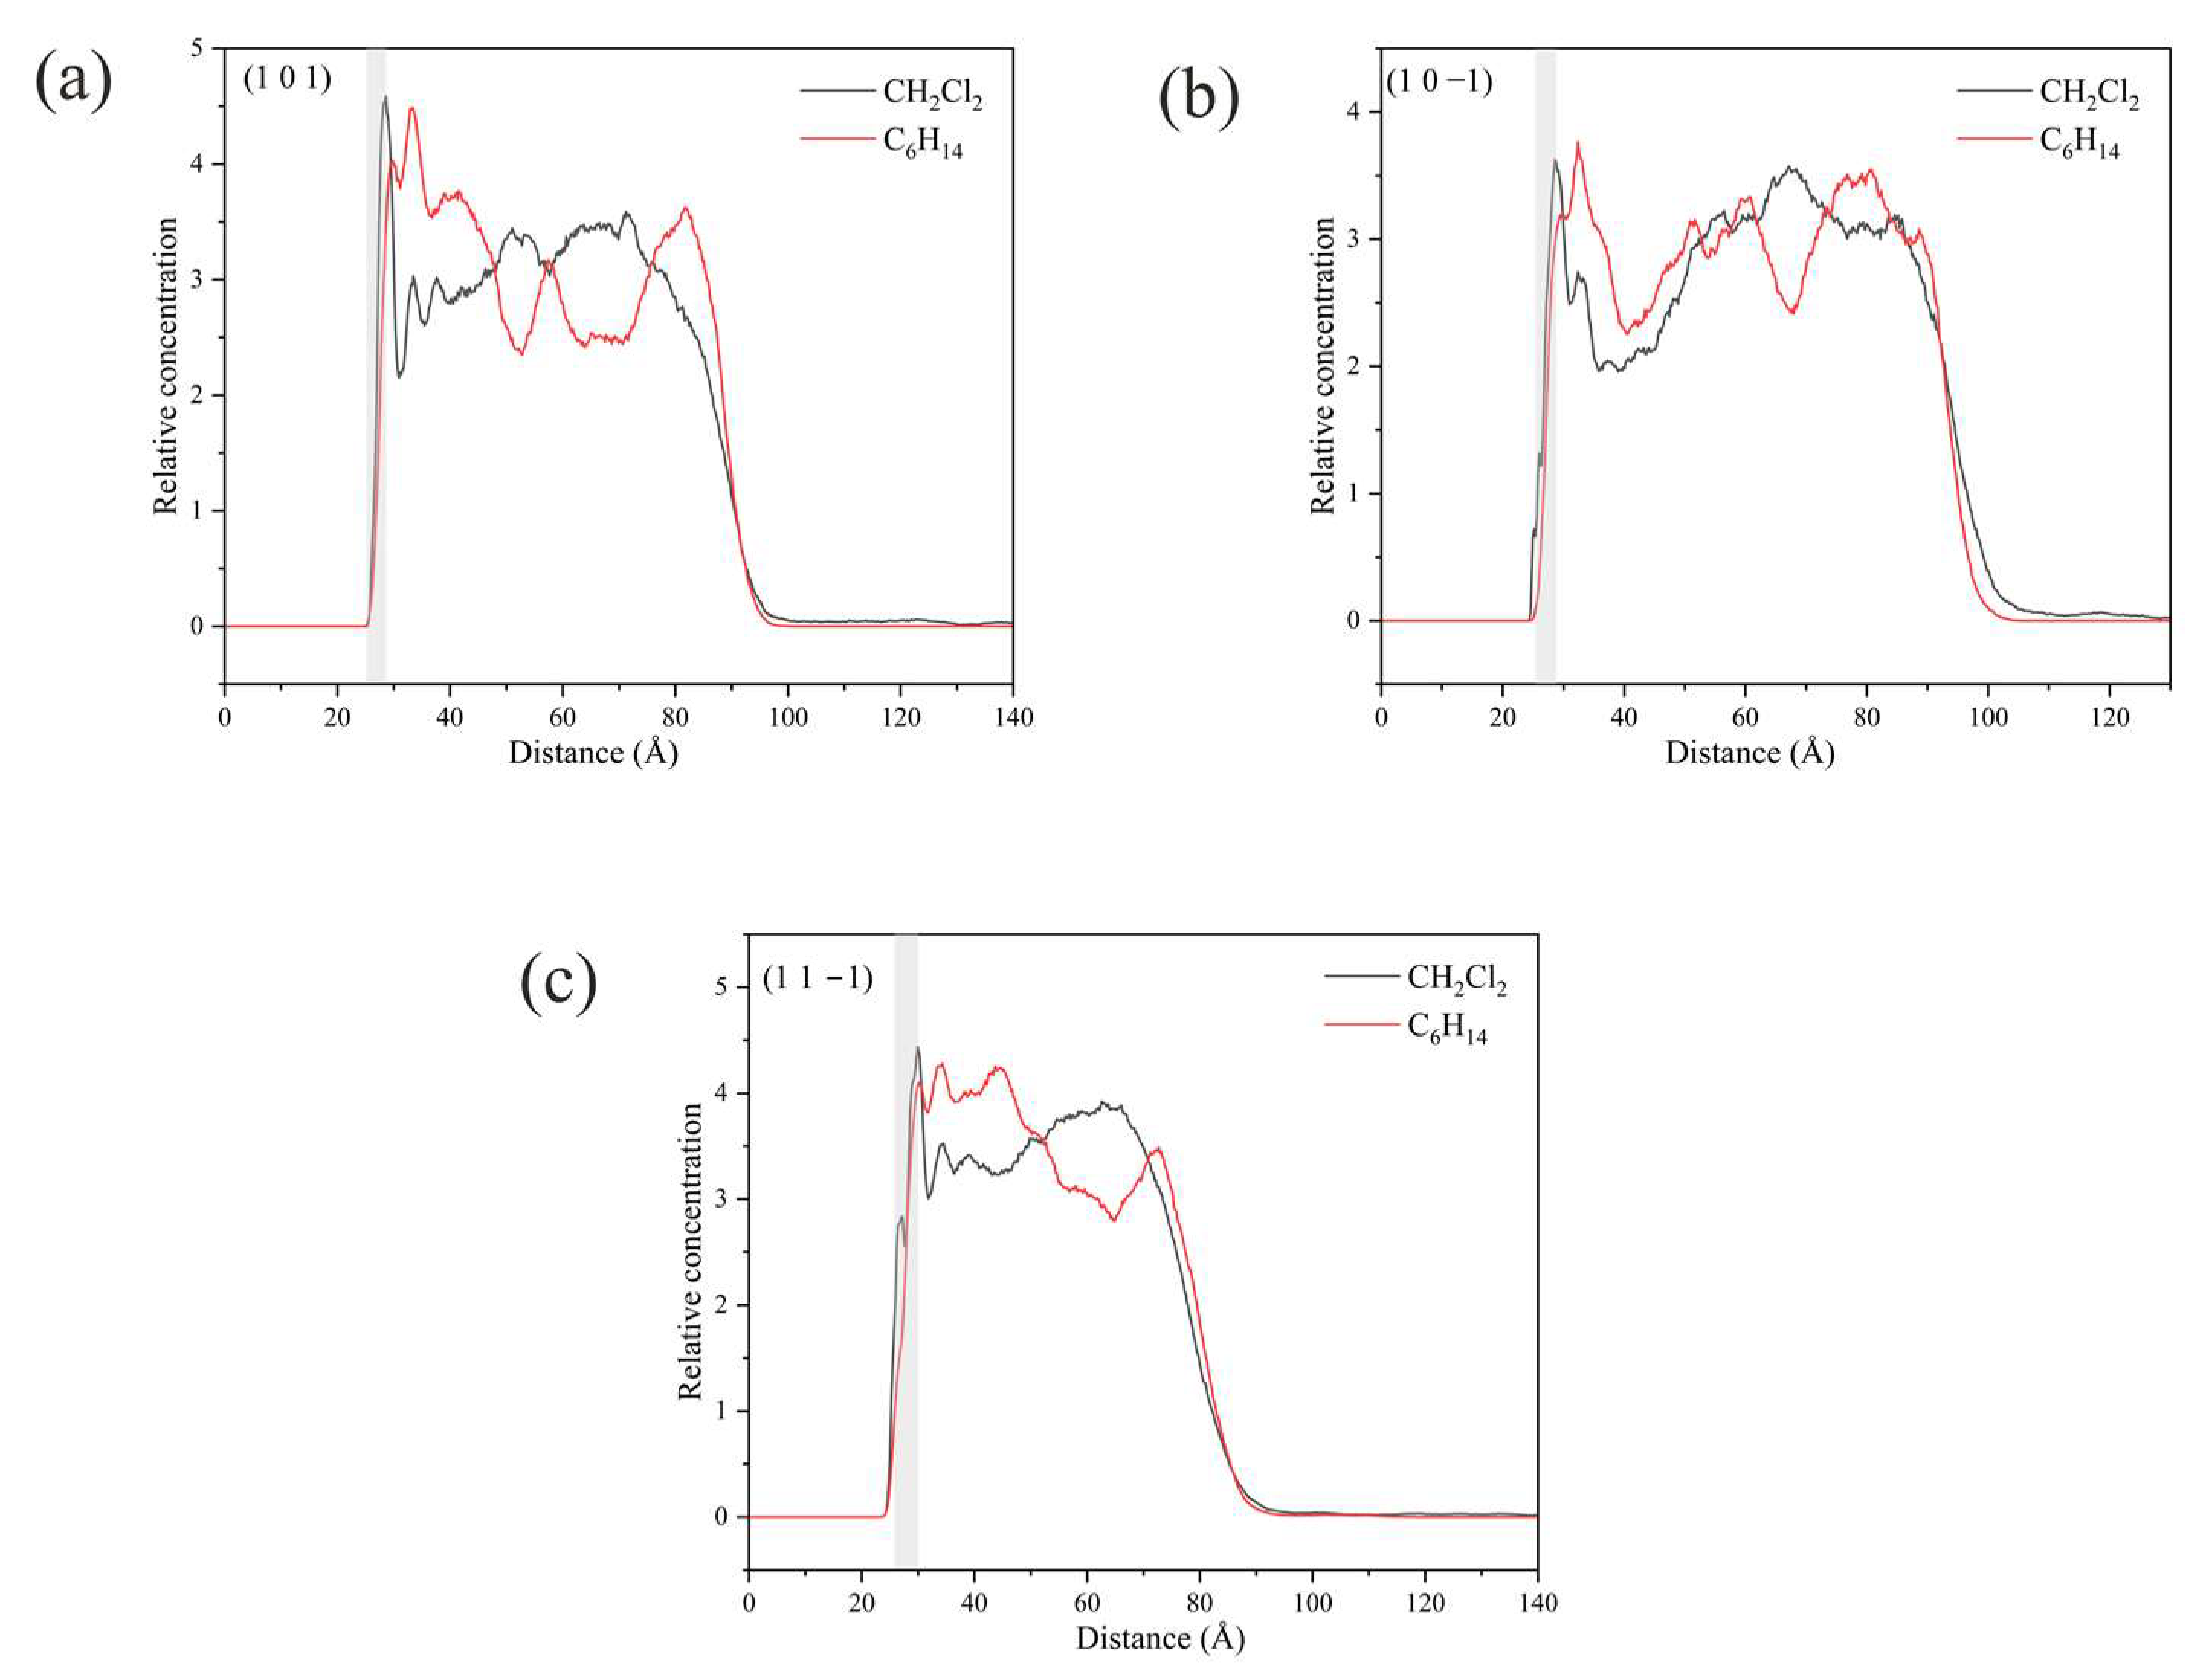
2.5.4. Relative Concentration Distributions of CH2Cl2 and C6H14

In the vicinity of the crystal face, the interaction between solvent molecules and the crystal face largely determines the crystal morphology, and the relative concentration distributions of CH2Cl2 and C6H14 were calculated in the direction perpendicular to the crystal face. By analyzing the last 200 ps of the kinetic simulation trajectory, the relative concentration distributions were obtained. The relative concentration of CH2Cl2 is high and that of C6H14 was low near the crystal face in the three crystal face simulation systems (1 0 0), (1 1 0), and (1 1 −1), as shown in Figure 14.
Taking the (1 1 0) crystal face as an example to explore the reasons for the higher concentration of CH2Cl2 solvent molecules near the crystal face, the microstructure near the crystal face during the kinetic simulation is analyzed as in Figure 15. The relative concentration distribution in the figure is at the contact area between the solvent layer and the crystal plane. Part of the solvent molecules above and part of the crystal molecules below outside the contact region have been hidden. The reason for the higher concentration of CH2Cl2 near the crystal face is mainly due to the existence of small depression regions at the crystal face, and the CH2Cl2 molecule, because of its smaller molecular structure, is embedded in the depression regions and interacts more strongly with ISMN molecules at the crystal face. The larger molecular structure of C6H14 has a larger spatial site resistance to enter the depression regions, so its concentration is lower near the crystal face.
The density distributions near the (1 0 0) and (1 1 1) crystal faces are similar to those near the (1 1 0) crystal face, with both higher CH2Cl2 concentrations and lower C6H14 concentrations near the crystal face. The molecular structures of CH2Cl2 and C6H14 and the spatial site barrier effect at the crystal face combine to contribute to the phenomenon.
Unlike the three crystal faces mentioned above, the relative concentrations of CH2Cl2 and C6H14 in the simulated systems of (1 0 1), (1 0 −1), and (1 1 −1) are both high in the vicinity of the crystal faces, as shown in Figure 16.
The high concentration of CH2Cl2 and C6H14 at the (1 0 1) crystal face is mainly because CH2Cl2 is unable to form hydrogen bonding interactions with the crystal surface in this crystal face simulation system, and the interaction between CH2Cl2 and the crystal face is weaker, resulting in a high concentration of C6H14 in this region as well.
The analysis of the kinetic trajectory of the (1 0 −1) crystal face system reveals that due to the larger space in the depression regions at the (1 0 −1) crystal face, the site resistance of the C6H14 molecules to enter the region is smaller, so the relative concentration of CH2Cl2 and C6H14 peaks in the vicinity of the crystal face. The microstructure near the (1 0 −1) crystal face is shown in Figure 17.
The reason for the high concentration of both CH2Cl2 and C6H14 at the (1 1 −1) crystal face is that the depression regions at the crystal face are so small that CH2Cl2 molecules cannot enter the region either, failing to reflect its structural advantages.

2.5.5. Analysis of Changes in the Crystal Morphology of ISMN in the CH2Cl2-C6H14 Solvent System

CH2Cl2 solvent molecules can form hydrogen bond interactions with ISMN molecules on the (1 0 −1) crystal face, while C6H14 molecules do not form hydrogen bond interactions with ISMN molecules on the (1 0 −1) crystal face. The high concentration of C6H14 near the (1 0 −1) crystal face weakens the interaction between the solvent layer and the crystal face layer, and the (1 0 −1) crystal face growth is faster. Therefore, when growing along with the (1 1 −1) crystal face, the (1 1 −1) crystal face has the opportunity to reappear as a morphologically important growth face.

3. Simulation

3.1. Calculation Methodology

There are three popular methods for studying crystal morphology, namely, the BDFH method, the growth morphology method, and the equilibrium morphology method [17]. The BDFH method [38,39] was first proposed by Bravais, verified by Friedel’s observations, and improved by Donnay and Harker. The theory states that the normal growth rate of a crystal surface is inversely proportional to the lattice plane spacing (dhkl). The growth morphology method determines the relative growth rate based on the magnitude of the intermolecular interactions within the crystal and is also referred to as the attachment energy model (AE model) [40,41]. The equilibrium morphology method works by calculating the minimum surface free energy for a given volume and temperature. Wulff plots are combined to visualize the morphology of crystals in equilibrium with their surroundings [42]. Among the above methods, the AE model is widely used for the prediction of crystal habits of energy-containing materials [43] and drug molecules [44] due to its simple computational steps and relatively reliable accuracy, and the AE model is used in this work to predict the crystal morphology.
In the AE model, the relative growth rate (Rhkl) of a crystal face in vacuum is proportional to the absolute value of the attachment energy (|Eatt|) of the corresponding lattice plane [45,46].
Rhkl∝│Eatt
The crystal plane with the most negative Eatt will have the fastest growth rate and at the same time the least morphological importance [24,31]. Eatt is calculated as follows:
Eatt = Elatt − Eslice
where Eatt is the energy released when a wafer of thickness dhkl is attached to the surface of the growing crystal, Elatt is the lattice energy of the crystal, and Eslice is the energy possessed by a wafer of thickness dhkl.
In solution, due to the interaction between the solvent molecules and the crystal surface, the growth of the crystal surface requires the exclusion of the solvent–crystal surface interaction, and the AE model needs to be corrected. In solution, the modified attachment energy (MAE) is calculated as follows:
E′att = Eatt − Es
E′att is the modified attachment energy term, and Es is the solvent adsorption effect on the attachment energy term, which can be obtained from the interaction energy between the solvent layer and the crystal face layer (Eint). Eint is expressed as follows:
Eint = Etot − (Ecry + Esol)
where Etot is the total energy of the solvent layer and crystal face system, Ecry is the potential energy of the crystal face layer alone without the solvent layer, and Esol is the potential energy of the solvent layer alone without the crystal face layer. The unit of measure for all three is kcal/mol.
The unit of measure of the attachment energy Eatt in Materials Studio (MS) software is kcal/mol/unit cell. To ensure the consistency of Es and Eatt, it is necessary to convert Eint by introducing the following conversion factors [47]:
E s = Z c r y Z h k l × A h k l A b o x E i n t
Eint is the interaction energy between the solvent layer and the crystal face in the simulation box in kcal/mol; Ahkl is the cross-sectional area of the crystal face cut out from the unit cell in Å2; Abox is the cross-sectional area of the simulation box in Å2; Ahkl/Abox is the reciprocal of the number of unit crystal faces contained in the simulation box, e.g., to construct a 2 × 3 simulation interface, then Ahkl/Abox = 1/6; Zcry is the number of molecules contained in the unit cell; Zhkl is the number of molecules contained in the crystal face cut from the unit cell.
Through the above conversion, Es and Eatt have the same dimension kcal/mol/unit cell.

3.2. Simulation Methods and Details

3.2.1. Optimization of Lattice Parameters

The original cell structure of the ISMN used in the simulation was obtained by testing and analyzing the product manufactured by Lunan Pharmaceutical Group Corporation, which belongs to the P43 space group, and its lattice parameters are shown in Table 8. The difference is not significant compared with the cell structure obtained from the Cambridge Structure Database [48]. The COMPASS force field was used to optimize the geometry of the original cell, and the degree of variation of the optimized lattice parameters was within the acceptable range. The COMPASS force field was used in this work for the following reasons: Validation studies representing 28 molecular classes show that COMPASS force field enables accurate and simultaneous prediction of structural, conformational, vibrational, and thermophysical properties for a broad range of molecules in isolation and in condensed phases [49]. These 28 molecular classes include C6H14 and CH2Cl2, the two solvent molecules in this simulation. The molecular dynamics simulation of organic drug crystals by the COMPASS force has also been effectively verified, for example, the prediction of sulfamerazine crystal morphology [27] and the crystallization of mefenamic acid using N, N-dimethyl formamide (DMF) as a solvent [50]. Cao et al. analyzed the intermolecular interactions of 5-ISMN and four organic solvents using molecular simulations, and the force field used for the molecular simulations was the COMPASS force field [12]. So, we believe that the COMPASS force field is applicable to the simulation system in this work.

3.2.2. Construction of the Simulation System

The AE model was used to predict the crystal morphology of the geometry-optimized crystal cell under vacuum conditions. The morphologically important growth faces are cut out and extended. The simulation box consists of the crystal surface layer and the solvent layer, where the solvent layer is composed of solvent molecules. The construction process of the simulation system is shown in Figure 18.
The size of the simulation box affects the results of molecular dynamics simulations [51,52]. Lan et al. [25] investigated the effect of the size of the interface model of the ɛ-hexanitrohexaazaisowurtzitane (HNIW) binary system on the results of the modified attachment energy calculations. The results showed that the length and width of the simulation box should be not less than twice the truncation radius (a ≥ 2dc) and the thickness of the crystal face layer should not be less than the truncation radius (Tc ≥ dc). In this simulation work, the length and width of the solvent layer were equal to those of the crystal face layer, and the height of the solvent layer was determined by the number of molecules and the density of molecules contained in the solvent layer. A vacuum layer of 100 Å was added above the solvent layer to eliminate the effect of periodic boundary conditions in the z-axis direction. The sizes of the simulation boxes constructed for each crystal face system are shown in Tables S1 and S2.

3.2.3. Molecular Dynamics Simulation Details

The simulation work in this paper was completed by using Materials Studio 2018 software. The molecular dynamics simulation of the crystal surface–solvent model system was carried out. The NVT ensemble was used, and the initial particle velocity was randomly assigned at 298 K. The simulation time was 500 ps with a time step of 1 fs, 1 frame of simulation trajectory was output every 100 steps, and a total of 5000 frames of simulation trajectory was obtained. The Andersen temperature control method was used to control the temperature of the system. Under the COMPASS force field, the atomic charge calculation method is forcefield assigned. The electrostatic interactions were calculated using the Ewald summation method, and the van der Waals interactions were calculated using an atom-based method with a truncation distance of 12.5 Å.

4. Conclusions

The crystal morphology of ISMN under vacuum was predicted using the AE model, and molecular dynamics simulations were performed for the model system containing morphologically important growth surfaces. The crystal morphology was predicted in two solvent systems, CH2Cl2 and CH2Cl2-C6H14, and the reasons for the changes in crystal morphology were analyzed. The conclusions are summarized as follows:
  • In the CH2Cl2 solvent system, the type of interaction present at each crystal face was determined using RDF analysis. Hydrogen bond interactions determine the crystal morphology to a certain extent, with the bond length, bond angle, and number of hydrogen bonds affecting the crystal morphology.
  • The use of C6H14 as a volatile agent accelerates crystal growth and increases the diffusion rate of CH2Cl2 molecules; the addition of C6H14 affects the interaction between the crystal face layer and the solution layer mainly by influencing the number of hydrogen bonds in the vicinity of the crystal face.
  • The addition of C6H14 did not have a major effect on the overall morphology of the crystals, mainly because the three morphologically important growth faces, (1 0 0), (1 1 0), and (1 1 1), are still dominated by CH2Cl2 solvent molecules in the vicinity of the crystal faces.
  • In the CH2Cl2-C6H14 solvent system, the difference in density distribution near the (1 0 −1) crystal face may account for the reappearance of the (1 1 −1) crystal face as a morphologically important growth surface.

Supplementary Materials

The following supporting information can be downloaded at: www.mdpi.com/xxx/s1, Table S1: The size of the simulated box and the number of solvent molecules contained in the CH2Cl2 solvent system; Table S2: The size of the simulated box and the number of solvent molecules contained in the CH2Cl2-C6H14 solvent system.

Author Contributions

Conceptualization, P.L. and G.Z.; methodology, P.L.; software, P.L. and G.Z.; validation, P.L., Z.Z. and Y.S.; formal analysis, P.L.; investigation, Y.W. and Y.Y.; resources, P.L. and Y.W.; data curation, Z.Z. and Y.S.; writing—original draft preparation, P.L.; writing—review and editing, X.Z.; visualization, P.L.; supervision, G.Z., Y.Y. and X.Z.; project administration, G.Z. and X.Z.; funding acquisition, X.Z. All authors have read and agreed to the published version of the manuscript.

Funding

This research was funded by Shandong Provincial Key Research and Development Program (2020CXGC010506) and Shandong Provincial Key Research and Development Program (Competitive innovation platform) (2022CXPT046).

Institutional Review Board Statement

Not applicable.

Informed Consent Statement

Not applicable.

Data Availability Statement

Data are contained within the article or Supplementary Materials.

Conflicts of Interest

Authors Zongyi Zhou and Ying Sun were employed by the company Lunan Pharmaceutical Group Co., Ltd. The authors declare no conflict of interest.

References

  1. Bolourchian, N.; Nili, M.; Foroutan, S.M.; Mahboubi, A.; Nokhodchi, A. The use of cooling and anti-solvent precipitation technique to tailor dissolution and physicochemical properties of meloxicam for better performance. J. Drug Deliv. Sci. Technol. 2020, 55, 101485. [Google Scholar] [CrossRef]
  2. Kumar, D.; Thipparaboina, R.; Shastri, N.R. Impact of Nisoldipine Crystal Morphology on Its Biopharmaceutical Properties: A Layer Docking Assisted Study. Org. Process Res. Dev. 2015, 19, 1912–1917. [Google Scholar] [CrossRef]
  3. Modi, S.R.; Dantuluri, A.K.R.; Puri, V.; Pawar, Y.B.; Nandekar, P.; Sangamwar, A.T.; Perumalla, S.R.; Sun, C.C.; Bansal, A.K. Impact of Crystal Habit on Biopharmaceutical Performance of Celecoxib. Cryst. Growth Des. 2013, 13, 2824–2832. [Google Scholar] [CrossRef]
  4. Gouthami, K.S.; Kumar, D.; Thipparaboina, R.; Chavan, R.B.; Shastri, N.R. Can crystal engineering be as beneficial as micronisation and overcome its pitfalls?: A case study with cilostazol. Int. J. Pharm. 2015, 491, 26–34. [Google Scholar] [CrossRef]
  5. Wu, P.; Huang, G.; Liu, W.; Gao, Q.; Gong, S.; Jin, M.; Yu, K. Study on the Characterization and Stability of Different Crystal Habits of Tacrolimus Monohydrate. Chin. J. Mod. Appl. Pharm. 2022, 39, 1856–1862. [Google Scholar]
  6. Dhondale, M.R.; Thakor, P.; Nambiar, A.G.; Singh, M.; Agrawal, A.K.; Shastri, N.R.; Kumar, D. Co-Crystallization Approach to Enhance the Stability of Moisture-Sensitive Drugs. Pharmaceutics 2023, 15, 189. [Google Scholar] [CrossRef]
  7. Maghsoodi, M.; Kiafar, F. Co-precipitation with PVP and Agar to Improve Physicomechanical Properties of Ibuprofen. Iran. J. Basic Med. Sci. 2013, 16, 635–642. [Google Scholar] [PubMed]
  8. Zhao, Z.; Liu, G.; Lin, Q.; Jiang, Y. Co-Crystal of Paracetamol and Trimethylglycine Prepared by a Supercritical CO2 Anti-Solvent Process. Chem. Eng. Technol. 2018, 41, 1122–1131. [Google Scholar] [CrossRef]
  9. Ren, Y.; Shen, J.; Yu, K.X.; Phan, C.U.; Chen, G.X.; Liu, J.Y.; Hu, X.R.; Feng, J.Y. Impact of Crystal Habit on Solubility of Ticagrelor. Crystals 2019, 9, 556. [Google Scholar] [CrossRef]
  10. Phan, C.U.; Shen, J.; Yu, K.X.; Mao, J.M.; Tang, G.P. Impact of Crystal Habit on the Dissolution Rate and In Vivo Pharmacokinetics of Sorafenib Tosylate. Molecules 2021, 26, 3469. [Google Scholar] [CrossRef]
  11. Pu, S.Y.; Hadinoto, K. Salting-Out crystallization of glycopeptide Vancomycin: Phase behavior study to control the crystal habit. Chem. Eng. Sci. 2022, 262, 118057. [Google Scholar] [CrossRef]
  12. Cao, Y.C.; Yao, T.; Zhang, G.M.; Zhou, Z.Y.; Zhai, L.H.; Wu, S.G. Nucleation behavior of isosorbide 5-mononitrate revealed from metastable zone widths by combining nucleation theory model and molecular simulation. J. Mol. Liq. 2022, 363, 119846. [Google Scholar] [CrossRef]
  13. Zhu, S.G.; Yang, J.T.; Zhang, G.M.; Chen, C.F.; Zhang, F.L. An Improved Process for Industrial Production of Isosorbide-5-mononitrate: Recycling of Wastes. Org. Process Res. Dev. 2018, 22, 991–995. [Google Scholar] [CrossRef]
  14. Yan, X.Y.; Wang, N.; Ji, X.T.; Feng, Y.G.; Li, J.; Wang, T.; Huang, X.; Hao, H.X. The Effect of Solvents on the Crystal Morphology of Pyriproxyfen. Crystals 2023, 13, 195. [Google Scholar] [CrossRef]
  15. Chen, J.; Jiang, X.G.; Cai, L.; Lu, W.; Gao, K.P.; Shi, Z.Q.; Zhang, Q.M. Pharmacokinetics of three organic nitrates in Chinese healthy male volunteers. Arzneim.-Drug Res. 2004, 54, 203–206. [Google Scholar] [CrossRef] [PubMed]
  16. Brown, C.; Marston, R.W.; Quigley, P.F.; Roberts, S.M. New preparative routes to isosorbide 5-mononitrate. J. Chem. Soc.-Perkin Trans. 2000, 1, 1809–1810. [Google Scholar] [CrossRef]
  17. Song, L.C.; Lv, S.; Guo, H.; Cui, Y.B.; Zhang, X.; Zhang, S.G.; Tian, Y.; Yang, C.H. Crystal morphology regulation of pronamide through solvent selection: Prediction and implementation. J. Chem. Thermodyn. 2022, 169, 106743. [Google Scholar] [CrossRef]
  18. Chen, X.; He, L.; Li, X.; Zhou, Z.; Ren, Z. Molecular Simulation Studies on the Growth Process and Properties of Ammonium Dinitramide Crystal. J. Phys. Chem. C 2019, 123, 10940–10948. [Google Scholar] [CrossRef]
  19. Smith, L.A.; Duncan, A.; Thomson, G.B.; Roberts, K.J.; Machin, D.; McLeod, G. Crystallisation of sodium dodecyl sulphate from aqueous solution: Phase identification, crystal morphology, surface chemistry and kinetic interface roughening. J. Cryst. Growth 2004, 263, 480–490. [Google Scholar] [CrossRef]
  20. Clydesdale, G.; Roberts, K.J.; Docherty, R. HABIT95—A program for predicting the morphology of molecular crystals as a function of the growth environment. J. Cryst. Growth 1996, 166, 78–83. [Google Scholar] [CrossRef]
  21. Ma, C.Y.; Moldovan, A.A.; Maloney, A.G.P.; Roberts, K.J. Exploring the CSD Drug Subset: An Analysis of Lattice Energies and Constituent Intermolecular Interactions for the Crystal Structures of Pharmaceuticals. J. Pharm. Sci. 2023, 112, 435–445. [Google Scholar] [CrossRef] [PubMed]
  22. Macrae, C.F.; Sovago, I.; Cottrell, S.J.; Galek, P.T.A.; McCabe, P.; Pidcock, E.; Platings, M.; Shields, G.P.; Stevens, J.S.; Towler, M.; et al. Mercury 4.0: From visualization to analysis, design and prediction. J. Appl. Crystallogr. 2020, 53, 226–235. [Google Scholar] [CrossRef] [PubMed]
  23. Childs, S.L.; Wood, P.A.; Rodríguez-Hornedo, N.; Reddy, L.S.; Hardcastle, K.I. Analysis of 50 Crystal Structures Containing Carbamazepine Using the Materials Module of Mercury CSD. Cryst. Growth Des. 2009, 9, 1869–1888. [Google Scholar] [CrossRef]
  24. Wang, K.; Huang, S.L.; Zhu, W.H. Solvent effects on the crystal morphology of β-HMX studied by modified attachment energy and occupancy models. J. Cryst. Growth 2022, 585, 126605. [Google Scholar] [CrossRef]
  25. Lan, G.C.; Jin, S.H.; Li, J.; Wang, J.Y.; Li, J.X.; Chen, S.S.; Li, L.J. The study of external growth environments on the crystal morphology of ε-HNIW by molecular dynamics simulation. J. Mater. Sci. 2018, 53, 12921–12936. [Google Scholar] [CrossRef]
  26. Liu, N.; Li, Y.N.; Zeman, S.; Shu, Y.J.; Wang, B.Z.; Zhou, Y.S.; Zhao, Q.L.; Wang, W.L. Crystal morphology of 3,4-bis(3-nitrofurazan-4-yl)furoxan (DNTF) in a solvent system: Molecular dynamics simulation and sensitivity study. Crystengcomm 2016, 18, 2843–2851. [Google Scholar] [CrossRef]
  27. Li, L.; Ji, X.T.; Cheng, X.W.; Li, D.N.; Wang, T.; Huang, X.; Wang, N.; Yin, Q.X.; Hao, H.X. Effect of the solvent on the morphology of sulfamerazine crystals and its molecular mechanism. Crystengcomm 2022, 24, 5497–5506. [Google Scholar] [CrossRef]
  28. Lutz, D.; Rasper, J.; Gielsdorf, W.; Settlage, J.A.; Jaeger, H. Improved automated simultaneous determination of isosorbide dinitrate and its metabolites in plasma by capillary column gas chromatography. J. High Resolut. Chromatogr. Chromatogr. Commun. 1984, 7, 58–65. [Google Scholar] [CrossRef]
  29. Chen, G.; Chen, C.Y.; Xia, M.Z.; Lei, W.; Wang, F.Y.; Gong, X.D. A study of the solvent effect on the crystal morphology of hexogen by means of molecular dynamics simulations. RSC Adv. 2015, 5, 25581–25589. [Google Scholar] [CrossRef]
  30. Chen, F.; Zhou, T.; Li, J.; Wang, X.L.; Cao, D.L.; Wang, J.L.; Yang, Z.J. Crystal morphology of dihydroxylammonium 5,5′-bistetrazole-1,1′-diolate (TKX-50) under solvents system with different polarity using molecular dynamics. Comput. Mater. Sci. 2019, 168, 48–57. [Google Scholar] [CrossRef]
  31. Liu, N.; Zhou, C.; Wu, Z.K.; Lu, X.M.; Wang, B.Z.; Wang, W.L. Theoretical study on crystal morphologies of 1,1-diamino-2,2-dinitroethene in solvents: Modified attachment energy model and occupancy model. J. Mol. Graph. Model. 2018, 85, 262–269. [Google Scholar] [CrossRef] [PubMed]
  32. Han, G.; Li, Q.F.; Gou, R.J.; Zhang, S.H.; Ren, F.D.; Wang, L.; Guan, R. Growth morphology of CL-20/HMX cocrystal explosive: Insights from solvent behavior under different temperatures. J. Mol. Model. 2017, 23, 360. [Google Scholar] [CrossRef] [PubMed]
  33. Xue, S.; Xu, J.P.; Han, Y.; Zhang, J.L.; Li, W. Solvent-Antisolvent Competitive Interactions Mediate Imidacloprid Polymorphs in Antisolvent Crystallization. Cryst. Growth Des. 2021, 21, 4318–4328. [Google Scholar] [CrossRef]
  34. Zhu, D.; Zhang, S.H.; Cui, P.P.; Wang, C.; Dai, J.Y.; Zhou, L.; Huang, Y.H.; Hou, B.H.; Hao, H.X.; Zhou, L.N.; et al. Solvent Effects on Catechol Crystal Habits and Aspect Ratios: A Combination of Experiments and Molecular Dynamics Simulation Study. Crystals 2020, 10, 316. [Google Scholar] [CrossRef]
  35. Sun, T.; Liu, Q.; Xiao, J.J.; Zhao, F.; Xiao, H.M. Molecular Dynamics Simulation of Interface Interactions and Mechanical Properties of CL-20/HMX Cocrystal and Its Based PBXs. Acta Chim. Sin. 2014, 72, 1036–1042. [Google Scholar] [CrossRef]
  36. Li, J.; Jin, S.H.; Lan, G.C.; Ma, X.; Ruan, J.; Zhang, B.; Chen, S.S.; Li, L.J. Morphology control of 3-nitro-1,2,4-triazole-5-one (NTO) by molecular dynamics simulation. Crystengcomm 2018, 20, 6252–6260. [Google Scholar] [CrossRef]
  37. Rozas, I. On the nature of hydrogen bonds: An overview on computational studies and a word about patterns. Phys. Chem. Chem. Phys. 2007, 9, 2782–2790. [Google Scholar] [CrossRef] [PubMed]
  38. Winn, D.; Doherty, M.F. Modeling crystal shapes of organic materials grown from solution. Aiche J. 2000, 46, 1348–1367. [Google Scholar] [CrossRef]
  39. Deij, M.A.; van Eupen, J.; Meekes, H.; Verwer, P.; Bennema, P.; Vlieg, E. Experimental and computational morphology of three polymorphs of the free base of Venlafaxine: A comparison of morphology prediction methods. Int. J. Pharm. 2008, 353, 113–123. [Google Scholar] [CrossRef]
  40. Zhao, Y.P.; Su, G.W.; Liu, G.Z.; Wei, H.Y.; Dang, L.P. Effect of modification of binary solvent molecules on ε-CL-20 crystal morphology: A molecular dynamics study. Crystengcomm 2021, 23, 3524–3536. [Google Scholar] [CrossRef]
  41. Chen, H.; Duan, S.J.; Sun, Y.Z.; Song, X.F.; Yu, J.G. Molecular dynamics simulations of solvent effects on the crystal morphology of lithium carbonate. RSC Adv. 2020, 10, 5604–5609. [Google Scholar] [CrossRef] [PubMed]
  42. Yang, L.L.; Dong, Y.M. Crystal morphology study of N,N′-diacetylchitobiose by molecular dynamics simulation. Carbohydr. Res. 2011, 346, 2457–2462. [Google Scholar] [CrossRef] [PubMed]
  43. Zhai, L.Z.; Zhao, X.; Rui, J.H.; Qiu, S.Q.; Li, Y.S. Molecular Dynamics Simulation of β-HMX Crystal Morphology Induced by Polymer Additives. Crystals 2022, 12, 164. [Google Scholar] [CrossRef]
  44. Wang, Y.; Liang, Z.Z. Solvent effects on the crystal growth structure and morphology of the pharmaceutical dirithromycin. J. Cryst. Growth 2017, 480, 18–27. [Google Scholar] [CrossRef]
  45. Cheng, X.; Huang, X.; Zheng, Z.; Dong, Y.; Wang, T.; Hao, H. Toward Understanding the Growth of Cefradine in Aqueous Solution. Cryst. Growth Des. 2021, 21, 1993–2004. [Google Scholar] [CrossRef]
  46. Liang, C.J.; Zhuang, J.H.; Zhuang, C.H.; Zhang, Z.X.; Lv, G.L.; Zhang, G.Q. Crystal morphology prediction and experimental verification of venlafaxine hydrochloride. Powder Diffr. 2022, 37, 133–142. [Google Scholar] [CrossRef]
  47. Liu, Y.Z.; Niu, S.Y.; Lai, W.P.; Yu, T.; Ma, Y.D.; Gao, H.X.; Zhao, F.Q.; Ge, Z.X. Crystal morphology prediction of energetic materials grown from solution: Insights into the accurate calculation of attachment energies. Crystengcomm 2019, 21, 4910–4917. [Google Scholar] [CrossRef]
  48. Santschi, N.; Wagner, S.; Daniliuc, C.; Hermann, S.; Schäfers, M.; Gilmour, R. Synthesis of 2-[18F]Fluoro-2-deoxyisosorbide 5-mononitrate and Assessment of Its in vivo Biodistribution as Determined by Dynamic Positron Emission Tomography (PET). Chemmedchem 2015, 10, 1724–1732. [Google Scholar] [CrossRef]
  49. Sun, H. COMPASS: An ab initio force-field optimized for condensed-phase applications—Overview with details on alkane and benzene compounds. J. Phys. Chem. B 1998, 102, 7338–7364. [Google Scholar] [CrossRef]
  50. Mudalip, S.K.A.; Adam, F.; Abu Bakar, M.R. Evaluation of the intermolecular interactions and polymorphism of mefenamic acid crystals in N,N-dimethyl formamide solution: A molecular dynamics simulation and experimental study. Comptes Rendus Chim. 2019, 22, 771–778. [Google Scholar] [CrossRef]
  51. Cao, Z.; Wu, Y.; Niu, M.; Li, Y.; Li, T.; Ren, B. Exploring the solvent effect on risperidone (form I) crystal morphology: A combination of molecular dynamics simulation and experimental study. J. Mol. Liq. 2023, 376, 121358. [Google Scholar] [CrossRef]
  52. Lan, G.C.; Jin, S.H.; Li, J.; Lu, Z.Y.; Chen, M.L.; Wu, N.N.; Chen, S.S.; Li, L.J. Molecular dynamics investigation on the morphology of HNIW affected by the growth condition. J. Energetic Mater. 2019, 37, 44–56. [Google Scholar] [CrossRef]
Figure 1. Intermolecular interactions in the unit cell of ISMN.
Molecules 29 00367 g001
Figure 2. Crystal morphology in vacuum using AE model: (a) front view, (b) left view, (c) right view.
Molecules 29 00367 g002
Figure 3. Solvent-accessible area of each crystal face.
Molecules 29 00367 g003
Figure 4. ISMN crystal morphology in the CH2Cl2 solvent system predicted using the MAE model: (a) front view, (b) left view, (c) right view.
Molecules 29 00367 g004
Figure 5. MSD curves of solvent CH2Cl2 in each crystal face simulation system.
Molecules 29 00367 g005
Figure 6. (a): Molecular structure of ISMN. (b): Electrostatic potential of ISMN. (c): Electrostatic potential of CH2Cl2.
Molecules 29 00367 g006
Figure 7. Analysis of the RDF between H1 and Cl atoms: (a) (1 0 0), (1 1 0) and (1 1 1) three crystal face systems, (b) (1 1 −1), (1 0 1) and (1 0 −1) three crystal face systems.
Molecules 29 00367 g007
Figure 8. Probability density distributions of hydrogen bond lengths.
Molecules 29 00367 g008
Figure 9. Probability density distribution of hydrogen bond angles.
Molecules 29 00367 g009
Figure 10. ISMN crystal morphology in the CH2Cl2-C6H14 solvent system predicted using the MAE model: (a) front view, (b) left view, (c) right view.
Molecules 29 00367 g010
Figure 11. MSD curve of CH2Cl2 in the CH2Cl2-C6H14 solvent system.
Molecules 29 00367 g011
Figure 12. Probability density distributions of HB lengths in the CH2Cl2-C6H14 solvent system.
Molecules 29 00367 g012
Figure 13. Probability density distributions of HB angles in the CH2Cl2-C6H14 solvent system.
Molecules 29 00367 g013
Figure 14. Relative concentration distributions of CH2Cl2 and C6H14 in the z-axis direction for the three crystal face simulation systems (1 0 0), (1 1 0), and (1 1 1): (a) (1 0 0) crystal face system, (b) (1 1 0) crystal face system, (c) (1 1 1) crystal face system. (The light gray area in the figure shows the relative concentration distribution in the vicinity of the crystal face).
Molecules 29 00367 g014
Figure 15. Concentration distribution of CH2Cl2 and C6H14 near the (1 1 0) crystal face. (The lower layer is the ISMN. In the upper layer, C6H14 is represented by a stick model, the Cl atom in CH2Cl2 by a green sphere, the C atom in CH2Cl2 by a cyan sphere, and the H atom in CH2Cl2 by a white sphere.)
Molecules 29 00367 g015
Figure 16. Relative concentration distributions of CH2Cl2 and C6H14 in the z-axis direction for the three crystal face simulation systems (1 0 1), (1 0 −1), and (1 1 −1): (a) (1 0 1) crystal face system, (b) (1 0 −1) crystal face system, (c) (1 1 −1) crystal face system. (The light gray area in the figure shows the relative concentration distribution in the vicinity of the crystal face.)
Molecules 29 00367 g016
Figure 17. Concentration distribution of CH2Cl2 and C6H14 near the (1 0 −1) crystal face. (The lower layer is the ISMN. In the upper layer, C6H14 is represented by a stick model, the Cl atom in CH2Cl2 by a green sphere, the C atom in CH2Cl2 by a cyan sphere, and the H atom in CH2Cl2 by a white sphere.)
Molecules 29 00367 g017
Figure 18. Schematic diagram of the construction of the simulation system.
Molecules 29 00367 g018
Table 1. Parameters associated with morphologically important growth surfaces in the ISMN.
(h k l)Multiplicitydhkl (Å)Eatt
(kcal/mol/Unit Cell)
Total Habit Facet Area (Å2)Total Habit Facet Area Percentage
(1 0 0)415.42−48.8126,086.6072.56%
(1 1 0)410.90−61.874621.2612.85%
(1 0 1)46.05−177.071339.403.73%
(1 0 −1)46.05−177.071339.403.73%
(1 1 1)45.63−170.281282.823.57%
(1 1 −1)45.63−170.281282.823.57%
Table 2. Calculation results of crystal face rugosity S.
(h k l)Ahkl2)Aacc2)S
(1 0 0)101.342131.6151.299
(1 1 0)143.319202.5051.413
(1 1 1)277.607392.6801.415
(1 1 −1)277.607391.5401.410
(1 0 1)258.448340.8651.319
(1 0 −1)258.448356.3751.379
Table 3. Calculation results of E′att in the CH2Cl2 solvent system.
(h k l)dhkl (Å)Eatt
(kcal/mol/Unit Cell)
ZcryZhklAhkl2)Abox2)Eint (kcal/mol)E’att
(kcal/mol/Unit Cell)
(1 0 0)15.42−48.8188101.342432.21−577.44−24.75
(1 1 0)10.90−61.8788143.323439.66−919.91−23.54
(1 1 1)5.63−170.2888277.616663.03−2211.43−78.15
(1 1 −1)5.63−170.2888277.616663.03−2074.29−83.86
(1 0 1)6.05−177.0788258.452326.03−805.57−87.56
(1 0 −1)6.05−177.0788258.452326.03−840.60−83.67
Table 4. Hydrogen bond statistics in the CH2Cl2 solvent system.
(h k l)HB Length a (Å)HB Angle b (°)S1% c (HB Length < 2.5 Å)S2% d (HB Angle > 150°)NHB eNH1 fNHB-per H1 gAbox h2)NHB-unit area iAhkl j2)NHB-hkl k
(1 0 0)2.52147.1350.00%44.67%24.80181.382432.210.0102101.3421.03
(1 1 0)2.57144.1342.34%31.99%47.19480.983439.660.0137143.3191.97
(1 1 1)2.59147.5337.49%45.55%20.92240.876663.030.0031277.6070.87
(1 1 −1)2.56144.2143.60%31.93%49.50481.036663.030.0074277.6072.06
(1 0 −1)2.56144.2843.80%30.99%17.68180.982326.030.0076258.4481.96
a HB length is the average hydrogen bond length in Å. b HB angle is the average hydrogen bond angle in °. c S1% is the percentage of hydrogen bond lengths less than 2.5 Å. d S2% is the percentage of hydrogen bonding angles greater than 150°. e NHB is the average number of hydrogen bonds contained in each frame of the trajectory. f NH1 is the number of H1 atoms involved in the formation of hydrogen bonds in the simulated trajectory. g NHB-per H1 is the average number of hydrogen bonds formed per H1 atom. h Abox is the simulated box cross-sectional area in Å2. i The NHB-unit area is the average number of hydrogen bonds formed per unit crystal face area. j Ahkl is the cross-sectional area of the crystal face in the unit cell. k NHB-hkl is the average number of hydrogen bonds contained in each crystal face in a unit cell.
Table 5. Results of MAE calculations in the CH2Cl2-C6H14 solvent system.
(h k l)dhkl (Å)Eatt
(kcal/mol/Unit Cell)
ZcryZhklAhkl2)Abox2)Eint (kcal/mol)E’att
(kcal/mol/Unit Cell)
(1 0 0)15.42−48.8188101.342432.21−556.13−25.63
(1 1 0)10.90−61.8788143.323439.66−903.67−24.22
(1 1 1)5.63−170.2888277.616663.03−2126.07−81.70
(1 1 −1)5.63−170.2888277.616663.03−1991.14−87.33
(1 0 1)6.05−177.0788258.452326.03−766.75−91.87
(1 0 −1)6.05−177.0788258.452326.03−786.70−89.66
Table 6. Diffusion coefficients of CH2Cl2 in two solvent systems.
(h k l)Dα1 a (10−8 m2/s)Dα2 b (10−8 m2/s)
(1 0 0)0.26610.3192
(1 1 0)0.26500.3657
(1 1 1)0.35260.4465
(1 1 −1)0.37730.4369
(1 0 1)0.26700.3475
(1 0 −1)0.30380.3673
a Dα1 is the diffusion coefficient of CH2Cl2 in the CH2Cl2 solvent systems. b Dα2 is the diffusion coefficient of CH2Cl2 in the CH2Cl2-C6H14 solvent systems.
Table 7. Hydrogen bonding statistics in the CH2Cl2-C6H14 solvent system.
(h k l)HB Length a (Å)HB Angle b (°)S1% c (HB Length < 2.5 Å)S2% d (HB Angle > 150°)NHB eNH1 fNHB-per H1 gAbox h2)NHB-unit area iAhkl j2)NHB-hkl k
(1 0 0)2.51147.2750.49%45.16%22.87181.272432.210.0094101.3420.95
(1 1 0)2.55144.4944.53%33.08%40.29480.843439.660.0117143.3191.68
(1 1 1)2.59147.7637.75%45.95%20.72240.866663.030.0031277.6070.86
(1 1 −1)2.57143.9343.01%31.22%39.87480.836663.030.0060277.6071.66
(1 0 −1)2.55144.6145.73%31.60%15.85180.882326.030.0068258.4481.76
Note: The meanings of the physical quantities marked by superscript letters (a–k) in the table are the same as in Table 4.
Table 8. Comparison of cell lattice parameters.
Lattice Parametera (Å)b (Å)c (Å)α (°)β (°)γ (°)
Primitive unit cell15.99215.9926.523909090
Cambridge Structural Database15.92615.9266.509909090
COMPASS15.41915.4196.572909090
Relative error3.58%3.58%0.75%0.00%0.00%0.00%
Disclaimer/Publisher’s Note: The statements, opinions and data contained in all publications are solely those of the individual author(s) and contributor(s) and not of MDPI and/or the editor(s). MDPI and/or the editor(s) disclaim responsibility for any injury to people or property resulting from any ideas, methods, instructions or products referred to in the content.

