Abstract
Our study was motivated by the urgent need to develop or improve antivirals for effective therapy targeting RNA viruses. We hypothesized that analogues of favipiravir (FVP), an inhibitor of RNA-dependent RNA polymerase (RdRp), could provide more effective nucleic acid recognition and binding processes while reducing side effects such as cardiotoxicity, hepatotoxicity, teratogenicity, and embryotoxicity. We proposed a set of FVP analogues together with their forms of triphosphate as new SARS-CoV-2 RdRp inhibitors. The main aim of our study was to investigate changes in the mechanism and binding capacity resulting from these modifications. Using three different approaches, QTAIM, QSPR, and MD, the differences in the reactivity, toxicity, binding efficiency, and ability to be incorporated by RdRp were assessed. Two new quantum chemical reactivity descriptors, the relative electro-donating and electro-accepting power, were defined and successfully applied. Moreover, a new quantitative method for comparing binding modes was developed based on mathematical metrics and an atypical radar plot. These methods provide deep insight into the set of desirable properties responsible for inhibiting RdRp, allowing ligands to be conveniently screened. The proposed modification of the FVP structure seems to improve its binding ability and enhance the productive mode of binding. In particular, two of the FVP analogues (the trifluoro- and cyano-) bind very strongly to the RNA template, RNA primer, cofactors, and RdRp, and thus may constitute a very good alternative to FVP.
1. Introduction
1.1. Motivation of the Research
Over the last two centuries, there have been several pandemics/epidemics caused by different human-infective RNA viruses: in 1889–1890 (Asiatic/Russian flu, A subtype H2), in 1918–1920 (Spanish flu, H1N1), in 1957–1958 (Asian flu, H2N2), in 1968–1969 (Hong Kong flu, H3N2), in 1977–1979 (Russian flu, H1N1), since 1981 (AIDS, HIV), in 2009–2010 (Swine flu, H1N1/09), in 2002–2003 (SARS, SARS-CoV), and in 2012–2013 (MERS, MERS-CoV). The emergence of Swine flu 13 highlighted the urgent need for effective antiviral therapy against RNA viruses due to their pandemic nature. The coronavirus disease-2019 (COVID-19), a life-threatening infectious disease caused by the novel severe acute respiratory syndrome coronavirus-2 (SARS-CoV-2) [1,2], which emerged in Hubei Province in Central-Eastern China in December 2019, caused panic and accelerated these efforts. Since the global spread of the COVID-19 pandemic, many different SARS-CoV-2 variants (Alpha, Beta, Gamma, Delta, Epsilon, Etha, Iota, Kappa, Lambda Omicron, Theta, and Zeta) and subvariants, in particular, so-called variants of interests (XBB.1.5, XBB.1.16, EG.5, and JN.1) and variants under monitoring (BA.5, CH.1.1, XBB, and BA.2.86) appeared, which raised concerns about the possibility of prolonging the current pandemic and the occurrence of subsequent ones. Therefore, SARS-CoV-2 variants are monitored on an ongoing basis by the World Health Organization Technical Advisory Group on SARS-CoV-2 Virus Evolution [3].
Three recent pandemics, influenza [4], HIV [5], and SARS-CoV-2 [6], not only have common zoonotic origins but also are caused by RNA viruses (negative-sense single-stranded RNA ssRNA (−) or positive-sense single-stranded RNA ssRNA (+)), belonging to the kingdom Orthornavirae (realm Riboviria). The HIV group antigens (Gag) and influenza virus matrix (M1/M2) proteins also have even evolved from a common ancestor protein [7]. Two pandemic viruses, influenza and coronavirus, infect the respiratory tract, share similar symptoms, and use surface proteins to infect the host cells [8]. However, influenza uses surface glycoproteins hemagglutinin (HA) and neuraminidase (NA) for infection [9], while SARS-CoV-2 (similarly to MERS-CoV, SARS-CoV-1) uses the spike (S) protein [10]. In the case of HIV-1, the mechanisms of entry are different, but the strategy is similar to the one used by SARS-CoV-2 [11]. All three viruses use the viral RNA polymerase to express their proteins, although only SARS-CoV-2 has a proofreading mechanism [12], which has been considered an argument against the possibility of rapid mutation. Furthermore, in the case of the Ebola virus (Zaire Ebolavirus, EBOV), which is an ssRNA (−) enveloped virus from Riboviria [13], the trimeric transmembrane glycoprotein (GP) that plays a key role in infection mediates EBOV attachment and entry into host cells. However, EBOV, which is transmitted through body fluids and causes flu-like symptoms, was the cause of the Ebola hemorrhagic fever epidemic in West Africa in 2013–2016. Fortunately, EBOV does not mutate rapidly, which, contrary to initial fears, reduces the risk of a pandemic. In any case, viruses belonging to the same group of ssRNA viruses with a similar structure are considered potential culprits for the next global pandemic. In light of this, effective therapy targeting RNA viruses is highly desirable.
Most anti-viral drugs used in previous pandemics either inhibit the virion’s M2 ion channel, such as amantadine (Gocovri/Symadine/Symmetrel, 1964) and rimantadine (Flumadine, 1964), or inhibit the viral neuraminidase (e.g., oseltamivir (Tamiflu, 1997), zanamivir (Relenza, 1993), peramivir (Rapivab, 2000), and laninamivir (CS-8958, 2009). They prevent the virus from entering (entry/uncoating phase) and exiting cells (release phase). These treatments have demonstrated some effectiveness; however, there is potential for greater effectiveness with more specific treatment methods. The search for more effective drugs with a broad spectrum of activity and an innovative mode of action was dictated by three main factors: poor performance against new variants, the emergence of resistance to antiviral drugs (e.g., amantadine, rimantadine [14,15,16], and oseltamivir [17,18,19]), and the need to treat previously unknown or untreatable diseases. The most current first-line anti-viral therapies either focus on suppressing the cytokine storm (e.g., tocilizumab, a humanized anti-human IL-6 receptor antibody) or act as broad-spectrum antivirals (e.g., favipiravir, ribavirin, and remdesivir) which inhibit the viral RNA polymerase. The priority is to develop or improve broad-spectrum antivirals for the treatment of epidemic diseases caused by emerging or re-emerging viruses.
1.2. Favipiravir–State of the Art
Favipiravir (6-fluoro-3-hydroxypyrazine-2-carboxamide, FPV, T-705;), Figure 1, is an active pharmaceutical ingredient discovered by a Japanese company Toyama Co. Ltd. (now Toyama Kagaku Kōgyō, Toyama, Japan), which was approved for treating influenza strains unresponsive to adamantanes or neuraminidase inhibitors [20].
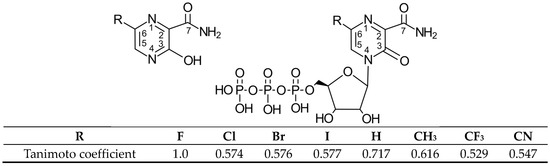
Figure 1.
Structural formula of Favipiravir (6-fluoro-3-hydroxypyrazine-2-carboxamide, FVP, R = F) and its analogues R = H, Cl, Br, I, CH3, CF3 and CN (pro-drug (left), ribofuranosyl-5′-triphosphate active forms (right)) and the Tanimoto coefficient (molecular similarity distance).
Food and Drug Administration (FDA) phase II and III clinical trials demonstrated the safety of FVP in humans and better efficacy against the influenza virus than oseltamivir [21]. In influenza virus-infected patients treated with FVP, the high barrier to resistance was observed [22]. FVP has been shown to have broad antiviral activity at higher concentrations against many other RNA viruses [23,24,25,26], such as OTV-resistant influenza A, B, and C viruses; as well as flavi-, alpha-, filo-, bunya, and arena-noroviruses [27,28]; Ebola [29]; Lassa virus [30]; West Nile Fever [31]; Zika [32]; Rift Valley fever [33]; Yellow fever [34]; Crimean-Congo hemorrhagic fever (CCHF) [35]; Nipah tick-borne encephalitis [36]; rabies [37]; and Argentine hemorrhagic fever (Junín) [38], including those for which there is currently no antiviral treatment available. After the identification of the new virus, SARS-CoV-2, FVP was among the first medications screened for its effectiveness and safety. Due to its mechanism of action, preclinical results, and high safety in humans, FVP shows promise in treating human diseases caused by various RNA viruses, including SARS-CoV-2. According to the ClinicalTrials.gov database, there are 67 completed, ongoing, or planned clinical trials around the world (Europe, North America, and Australia) assessing the efficacy and safety of FPV in monotherapies and combination therapies in the treatment of COVID-19. (Another 12 are efficacy studies for Influenza (7), Ebola (3), Lassa (1), and CCHF (1).) Currently, FVP is registered as a drug for COVID-19 in China, India, and Russia and is approved in Turkey, Hungary, Serbia, the KSA, Thailand, Egypt, Bangladesh, Pakistan, Jordan, and Saudi Arabia [39,40,41]. Oral doses of FVP have been shown to be safe in outpatients with mild to moderate infections. Furthermore, the reduction in viral load and improvement in radiological and clinical outcomes are significant [24,25]. Compared to Molnupiravir (MOL), Nirmatrelvir (NMVr) [18,19], or Remdesivir (RDV) [42], FVP exhibits reduced potency against SARS-CoV-2 in vitro but similar effectiveness in animal models.
Certain studies have indicated a potential association between FVP and oxidative stress/cardiotoxicity, [43] hepatotoxicity [44], teratogenicity [45,46,47], and embryotoxicity [48]. However, other anti-viral drugs, including MOL, NMVr, or RDV, also exhibit hepatotoxicity [49], nephrotoxicity [50], and mutagenicity [51]. Inconsistencies in clinical trial results, despite the synergistic effect of combined therapy with Oseltamivir (OSE) [52,53], Ivermectin (IVM) [54], Ribavirin (RBV) [55], Remdesivir (RDV), and Tocilizumab (TOZ) [56] in the fight against H1N1, H3N2, H5N1, and SARS-CoV-2 [57], have caused the use of FVP as a regular drug to remain under investigation. Even RDV, although introduced as a drug for the treatment of COVID-19 after obtaining its first emergency use authorization in May 2020 in the United States [58] and then later in Japan, has faced much criticism. The FDA approved RVD for the treatment of hospitalized patients, and the EU Commission granted conditional authorization, but the European Medicines Agency (EMA) approved it only for patients 12+ suffering from pneumonia who require oxygen supply [59]. The only anti-viral drug approved by the FDA is Pfizer’s PaxlovidTM, which is the combination of Nirmatrelvir (NMVR)—SARS-CoV-2 3-CL Mpro inhibitor and Ritonavir (RTV)—protease inhibitor. Thus, its mechanism of action is completely different. However, its use carries many risk factors, including severe liver impairment or liver disease. Recent studies show that SARS-CoV-2 has acquired phenotypic resistance to RDV and PaxlovidTM [60] but not to FVP. Thus, it is highly desirable to seek more suitable FVP alternatives, keeping in mind the issues mentioned above.
1.3. Favipiravir—Unique Mechanism of Action
Due to its relatively simple structure, FVP seems to be easily modifiable while maintaining its unique mode of action. It is therefore an attractive basis for investigating new drugs. However, the exact molecular mechanism behind the broad-spectrum antiviral activity of FVP has not yet been fully elucidated. It is known that FVP, a pro-drug, must be first converted by hypoxanthinguanine phosphoribosyl transferase (HGPRT) to FVP-ribosyl 5′-monophosphate (FVP-RMP) and then metabolized to the FVP-ribofuranosyl-5′-triphosphate (FVP-RTP) by cellular kinases [20,21] to inhibit viral RNA-dependent RNA polymerase (RdRp), as shown in Figure 2.

Figure 2.
Conversion of favipiravir and its analogues to its various metabolites (a series of ribosylation and phosphorylation steps to form the active triphosphate FVP-RTP).
RdRp, a key enzyme regulating both the replication and transcription of viral RNA, is a component of the so-called minimal core of viral RNA replication. FVP-RTP acts as a purine nucleoside analogue, which pairs with either cytosine or uracil. It competitively inhibits the viral RdRp polymerase substrate, leading to chain termination [61] and ultimately inhibits the transcription and replication of the viral genome RNA. Another possible mechanism of its action is lethal mutagenesis, resulting in an increased frequency of, primarily, guanosine to adenine (G→A) and, secondarily, C→U mutations, which produce non-infectious progeny during replication [62]. In this case, the therapeutic effect of FPV will result from the accumulation of mutations in the replicated RNA of nascent viruses, which leads to a cascade of mistakes, the so-called “error catastrophe”, and loss of the virus’s ability to reproduce. The malfunction of RdRP in the presence of FPV depends on the intracellular phosphorylation of the drug to its active form (FPV triphosphate), a false nucleoside that is built by the viral RdRP into the nascent viral RNA, resulting in a “defective”, mutated RNA. Since RdRp structure and function are conserved among RNA viruses and no RdRp homolog has been found in human cells, its selection as a target is highly advantageous for the development of broad-spectrum antivirals. Furthermore, it was observed that the conserved active site of RdRp does not mutate as easily as other targets, such as the Spike protein. However, FVP is considered a poor substrate for HGPRT, and the requirement for its conversion to the active metabolite RTP is, in fact, a limiting factor for its antiviral activity [63]. Viral resistance to FVP may result from depletion or a lack of HGPRT [44]. In HGPRT-deficient cells, FVP is completely devoid of antiviral activity. To overcome the inadequate activation of FVP, the utilization of ribonucleoside pro-drugs, as well as di- and triphosphate analogues, seems to be a viable solution, which increases the biodistribution and therapeutic efficacy of FVP.
1.4. FVP Analogues—A Research Hypothesis and Concept
The motivation for our study is the hypothesis that new FVP analogues may provide more efficient nucleic acid recognition and binding processes while reducing side effects. Based on our previous observations from the analysis of FVP binding modes in solid, pre-catalytic, and active forms [64], we proposed a set of the FVP analogues (pro-drugs) along with their triphosphate forms as novel SARS-CoV-2 RdRp inhibitors. The pyrazine heterocyclic ring and three functional groups (halogen/CH3/CF3, hydroxide, and amide) in the FVP analogues allow them to engage in weak non-covalent interactions (e.g., hydrogen-bonds, van der Waals, steric, and stacking). The presence of the three donor (amide and hydroxide) or five/eight acceptor atoms (i.e., two aromatic ring nitrogens, oxygens of amide and hydroxide, and halogen/CF3/CN) in one molecule facilitates the formation of hydrogen bonds in the parental FVP. According to the Etter rule [65], FVP analogues can theoretically realize up to twenty-four different types of hydrogen bonds, which makes them highly appealing for pharmaceutical purposes. Enzymatic conversion to the active ribofuranose-5′-triphosphate (RTP) form leads to an increase in the number of oxygen atoms while facilitating the establishment of hydrogen bonds. However, both of these factors can be modified by altering the substituents at the C(6) position of the pyridazine ring. The key question is whether and to what extent alteration of the molecular structure via substituents will help in the effective recognition of FPV analogues, their incorporation into the RNA strand, and their binding to the RdRp. The effective screening of the halogenated and non-halogenated (R = I, Br, Cl, CF3, H, CH3, CF3, or CN) analogues of FVP-RTP is the objective of the current research. Using the Quantum Theory of Atoms in Molecules (QTAIM), Quantitative Structure–Property Relationship (QSPR), and Molecular Docking (MD) approaches, the differences in their reactivity, toxicity, binding efficiency, and ability to be incorporated by SARS-CoV-2 RdRp were assessed. These methods, supplemented by new global indices describing relative reactivity and new quantitative methods for the estimation and visualization of the differences in the binding modes of individual analogues with RdRp, provide insight into the set of desirable characteristics responsible for the inhibition of the SARS-CoV-2 RdRp. Molecular docking studies demonstrate the high binding affinity of the FPV analogues to SARS-CoV-2, indicating their potency as antiviral drugs against COVID-19. The proposed modification of the FVP structure seems to improve its binding ability to SARS-CoV-2 RdRp and enhance productive binding modes. If sufficient efficacy in inhibiting viral replication in cell culture is established, they could be explored as potential drugs against COVID-19. Our method for quantifying differences in binding mode holds promise for guiding future research on new anti-SARS-CoV-2 agents.
2. Results and Discussion
2.1. Characteristics of the Candidate Ligands
2.1.1. Physicochemical Profile (ADMET) and Key Pharmacokinetic Parameters
FVP analogues (Figure 1, R = I, Br, Cl, CF3, H, CH3, CF3, or CN) were selected as candidate ligands for SARS-CoV-2 RdRp and potential pro-drugs. The physicochemical profile parameters that describe the pharmacokinetic behavior of the candidate ligands and known drugs (MOL, RVD, and the only registered drug, PaxlovidTM, components: NMVr and RTV) have been evaluated in Table 1 and Table 2.

Table 1.
The physicochemical profile parameters that describe the pharmacokinetic behavior of the candidate ligands.
Table 2.
The parameters describing the toxicity of the candidate ligands.
The molecular weights of the ligands (MW) ranged from 139.11 to 265.01 g/mol and did not exceed 500 g/mol. According to Swiss ADME [66], the predicted consensus LogP (lipophilicity) for the ligands ranged from −0.83 to 0.52. The CN analogue, like FVP, showed low and negative lipophilicity, while the CF3 analogue showed high and positive lipophilicity (closer to optimal for drugs). The substitution of –F with –CF3 increases the hydrophobicity (lipophilicity) of the ligand. Thus, the alteration of lipophilicity has the potential to modify hydrophobic targets. Indeed, in medicinal chemistry, –CF3 is often used as a substituent due to its strong electron-withdrawing nature, poor polarizability, and broad hydrophobic domain [67] (e.g., Tecovirimat [68], Doravirine [69], and Tipranavir [70]). However, ADMETlab 2.0 [71], which uses a different model, predicts negative LogP for both above-mentioned ligands. The predicted water solubility index (Solubility, SILICOS-IT) suggests that all the candidate ligands, like FVP, should be highly water soluble. Moreover, none of them showed lead-likeness violations and no violation of drug-like rules (Lipinski, Egan, or Veber). The predicted synthetic accessibility score (SAS) for the ligands ranges from 1.73 to 2.43, indicating the ease of synthesis of these compounds.
All the ligands showed high gastrointestinal absorption (GI), a key parameter in assessing the in vivo performance of an orally administered drug formulation. Abbot’s Bioavailability score for all ligands placed them within the 55% probability class. The topological polar surface area (TPSA), which describes the passive molecular transport across the membranes, is 88.84, except for the CN analogue, which showed a significantly higher TPSA of 112.63. However, since TPSA does not exceed 140, it is still an optimal level. Overall, the physicochemical profile of the candidate is better than those of MOL, RDV, NMVr, and RTV. The candidate ligands show no Pan Assay of Interference Structures (PAINS) or Structural (BRENK) alerts. None of the ligands are expected to cross the blood–brain barrier (BBB), inhibit cytochrome P450 (CYP) isoforms or have a potential to be a substrate of multidrug resistance protein (permeability glycoprotein, P-gp). The risk scores for carcinogenicity or genotoxic mutagenicity are very low for all of them, while the risk scores for hepatotoxicity (H-HT) and drug-induced liver injury (DILI) in humans are high. However, the CF3 analogue showed two times lower hepatotoxicity than FVP. The probability of genetic toxicity (Salmonella typhimurium reverse mutation assay, i.e., AMES assay) and the probability of rat acute oral toxicity (LD50) are relatively low for the CN and CH3 derivatives. Overall, the AMDE toxic profile for candidate ligands is non-inferior to FVP and better than MOL and RVD in terms of TPSA, genotoxic mutagenicity, genetic toxicity, H-HT, and DILI. The NVMr shows smaller toxicity, but it is combined with highly toxic RTV.
However, there is no set of ideal pharmacokinetic parameters that a given drug candidate should exhibit, as it depends on the specific requirements of the target. Therefore, our objective is to identify drugs that possess an optimal pharmacological profile, achieving the desired biological activity with minimal side effects (the last rows of Table 1 and Table 2 show the values that can be considered optimal).
2.1.2. Reactivity Profile (Quantitative Structure–Property Relationships)
Each ligand (potential pro-drug) and its active form, ribofuranosyl-5′-triphosphate (RTP), were constructed and optimized at the B3LYP/6–311G(d,p) level of theory. The enol tautomer (with intramolecular OH⋯O hydrogen bond), although more stable than the keto tautomer in solids and solutions, is further excluded by ribofuranosyl substitution. The planar conformation of the pyrazine moiety in active forms is maintained and supported by the intramolecular NH⋯O hydrogen bond in all FVP analogues, regardless of the type of substituent. The optimized molecular geometries served as the initial configurations for further QSPR and MD studies.
Determining the impact of molecular structure on reactivity is essential when designing the ligands with desired properties. A powerful tool for describing the chemical reactivity of the ligands based on their structure is the frontier molecular orbital (FMO) theory, which conceptualizes chemical bonding and reactivity in terms of the interactions between frontier orbitals. The highest occupied molecular orbital (HOMO) and lowest unoccupied molecular orbital (LUMO) are very useful for assessing the chemical reactivity of molecules. LUMO accepts electrons, and its energy corresponds to an electron affinity (EA), while HOMO donates electrons, and its energy is related to ionization potential (IP). Low IP and high EA correspond to high nucleophilic and high electrophilic properties, respectively. Therefore, the HOMO-LUMO gap is useful for predicting charge transport and ligand. Theoretical global indices of ligand reactivity, such as absolute electronegativity, χ; absolute hardness, η; electrophilicity index (reactivity), ω; softness, S; electro-donating power, ω−; electro-accepting power ω+; net electrophilicity, Δω; and a maximum number of electrons transferred in a chemical reaction, ΔNmax, provide further details regarding the reactivity of the ligands. The HOMO, LUMO, and global reactivity indices for the ligands were evaluated at MP2/6-311G(d,p) and M062X/6-311G(d,p) levels of the theory (in the gas phase—single molecule and aqueous solution) in Table 3 and Table 4.
Table 3.
The global reactivity descriptors calculated at the MP2/6-311G(d,p) level of the theory.
Table 4.
The global reactivity descriptors calculated at the M062X/6-311G(d,p) level of the theory.
Comparing reactivity parameters makes sense in relation to groups of structurally similar compounds; therefore, analyzing MOL, RVD, NVMr, or RTV will not bring anything in this respect.
The ligands studied can be ordered according to the decreasing HOMO-LUMO gap as follows: CF3 > H > CN > F > CH3 > Cl > Br > I. The results show that regardless of the phase (gas or aqueous solution), the CF3 and I analogues have the highest and lowest stability, respectively. The CF3 and CN analogues, which have a higher HOMO-LUMO energy gap, are more stable and are therefore chemically harder than the other ligands. However, each of these ligands is slightly less stable in aqueous solutions than in the gas phase.
The ordering of the ligands according to decreasing absolute electronegativity, χ, a measure of the ligand’s ability to attract electrons to itself, is correlated with the electronegativity of the halogen: CH3 < H < I < Br < Cl < F < CN < CF3. The CF3 group has a significantly strong electronegativity, typically intermediate between that of F and Cl, while the CN bond is strongly polarized toward nitrogen and more electronegative than Cl. Surprisingly, among the FVP analogues, the CF3 derivative is more electronegative than the CN derivative. The ordering of the ligands according to decreasing global hardness, a measure of the ligands’ resistance to change its electronic configuration, is as follows: CF3 > H > CN > F > CH3 > Cl > Br > I. The very high value of the absolute hardness for the CF3 derivative indicates its high degree of stability and low reactivity. The χ value describes the tendency to donate/accept electrons, while η measures the ease with which this can occur, which for CF3, are high and low, respectively.
The most important descriptor measuring electrophilic power (capacity of an electrophile to accept the maximal number of electrons in a neighboring reservoir of electron pool) is the global electrophilicity index, ω. Its values for the ligands are in the range of 1.318–1.885 eV and 1.323–1.670 eV in the gas phase and aqueous solution, respectively, as can be seen in Table 1. The parameter ω, which actually measures the reactivity of the ligand, revealed the following trend: CN > CF3 > F > Cl > Br > I > H > CH3. Therefore, reducing the inductive electron-withdrawing effect (F > Cl > Br > I) and electron-donating effect via resonance (F > Cl > Br > I) leads to a decrease in electrophilic activation (ω = 1.676, 1.648, 1.606, 1.592 eV for F, Cl, Br, and I, respectively). Very high reactivity values describing the system’s tendency to acquire electrons from the environment are observed for the CN and CF3 derivatives, while very low values for the H and CH3 derivatives. Thus, the CN and CF3 analogues seem most promising because highly electrophilic reagents lead to low substrate selectivity, which means they can inhibit a wide range of RdRps, not just SARS-CoV-2. Both analogues also have the highest local electro-donating power, ω+, electro-accepting power, ω−, and overall electrophilicity, Δω. A larger ω+ value for CN corresponds to its better ability to accept charge, whereas a smaller ω− value for CN makes this ligand a better electron donor. However, the unusually low-lying LUMO level for the CN and CF3 analogues suggests their easy participation in molecular reactions with nucleophiles, and the low-lying HOMO level for the CN and CF3 analogues suggests their easy participation in molecular reactions with electrophiles. LUMO is even slightly lower, while HOMO is slightly higher in the aqueous solution than in the gas phase, while ω+ and ω− are higher in the gas phase.
Two new reactivity descriptors, the so-called relative electron donation power, R+, and the relative electro-accepting power, R−, have been defined by us.
The relative electro-donating power, R+, is the quotient of the electro-donating power of the tested ligand and the reference ligand:
Similarly, the relative electro-accepting power is the quotient of the electro-accepting power of the tested ligand and the reference ligand:
Both parameters, R+ and R−, describe the ability of the ligands to accept and donate charge, as can be seen in Table 3 and Table 4.
The orderings of the ligands in descending order of R+ and R- are as follows:
CN > CF3 > F > Cl > I > Br > H > CH3 and CN > CF3 > F > Cl > Br > I > H > CH3 (the gas phase)
and
CN > CF3 > F > Cl > Br > I > H > CH3 and CF3 > CN > F > Cl > Br > I > H > CH3 (aqueous solution).
Both parameters, R+ and R−, allow for the classification of ligands based on the reference ligand, as can be seen in Figure 3.
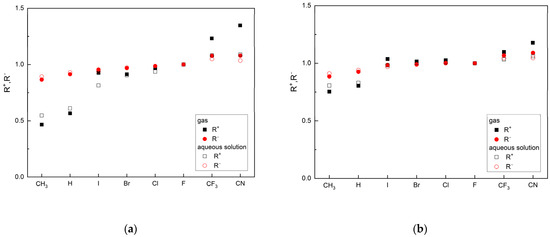
Figure 3.
The ligand’s ability to accept (R+) and donate (R−) charge in relation to FVP: (a) MP2/6-311G(d,p) and (b) M062X/6-311G(d,p) (the ordering of the substituents according to group electronegativity).
The R− values in the gas phase and the aqueous solution are similar, while the R+ values differ significantly. Based on these parameters, the two ligands CN and CF3 are better as both acceptors and donors than FVP. These features are maintained in the aqueous solution (pH = 7, i.e., close to body pH). Moreover, the conclusions remain the same regardless of the calculation method used. However, the MP2 function appears to be more sensitive to changes in reactivity, as shown in Figure 3.
The degree of interaction, DOI [65], calculated for the most promising ligands in Table 5 confirms the observations regarding the differences between the two analogues CN and CF3.
Table 5.
The degree of interaction, DOI, for FVP and its two analogues, CN and CF3.
The DOI characterizes the strength of an atom’s attachment to its molecular neighborhood, i.e., the degree of electron density sharing between the atom and its surroundings. The highest DOI was obtained for the acceptors –N(4) (39.26% in FVP, 37.964 for CN, and 37.963 for CF3), followed by –C(3) (20.942% for FVP, 20.651% for CN, and 20.300% for CF3), and –C(2) (22.819% for FVP, 22.352% for CN, and 22.349% for CF3). The lowest DOI was obtained for –NH2 (1.053% for FVP, 1.18% for CN, and 1.024% for CF3), –OH (2.626% for FVP, 2.449% for CN, and 2.571% for CF3) acting as a donor, and =O (0.141 for FVP, 0.143 for CN, and 0.156 for CF3%). The very low DOI for the –NH2 group is maintained regardless of the ligand type, making it highly suitable for binding ligands to the RNA strand. Based on the DOI parameters, the CF3 ligand appears more attractive than CN. After ribofuranosyl substitution, any R substituent loses the ability to share electron density with its surroundings in favor of RTP, and therefore, RTP plays a dominant role in the formation of bindings with the protein.
2.2. Characteristic of RNA-Directed RNA Polymerase
The genomic arrangement of SARS-CoV-2 is primarily composed of 4 structural proteins, nucleocapsid protein (N), spike protein(S), envelope protein (E), and membrane protein (M); 16 non-structural (NSPs); and 9 accessories (ORFs). Therefore, the SARS-CoV-2 virus consists of many proteins that can mutate rapidly. Two-thirds of the viral genome is occupied by the replicase gene referred to as two Open Reading Frames (ORFs), ORF 1a and ORF1ab, which encode the non-structural proteins (NSPs), the so-called pp1a and pp1ab polyproteins, respectively. The non-structural protein pp1ab includes RNA-directed RNA polymerase (RdRp), so-called nsp12 (chain 4393–5324). RdRp is a core component of viral replication and transcription [26] and exhibits significant catalytic activity, but only with the help of other cofactors: nsp7 and nsp8 [26,27]. Thus, nsp12-nsp7-nsp8 is defined as the minimal core component for viral RNA replication. It has been observed that the conserved active site of RdRp does not mutate as easily as other targets, such as the S protein.
The palm subdomain of SARS-CoV-2 RdRp (residues 585–625 and 680–807) forms the catalytic core of the polymerase, which contains the four highly conserved motifs (A–D). The principal target for SARS-CoV-2 is the active site of the RdRp polymerase, which is formed by two catalytic motifs: A, composed of the residues from 611 to 626, and C, containing residues from 753 to 767 [72]. In general, different RdRp polymerase inhibitors bind more or less strongly with the following residues: ASP760, ASP761, GLY616, TRP617, ASP618, TYR619, PRO620, LYS621, CYS622, LEU758, SER759, ALA762, ALA797, LYS798, CYS799, TRP800, HIS810, GLU811, PHE812, CYS813, SER814, and GLN815 [73,74]. Three hydrophilic and polar residues, ASP618, ASP760, and ASP761, play a key role in SARS-CoV-2 RdRp inhibition [74]. ASP618 is the most conserved residue in viral RdRp and, together with two strictly conserved residues, ASP760 and ASP761, is responsible for the formation of the RdRp catalytic center. ASP623 is involved in a hydrogen bond with the 2′-OH group of the nucleoside triphosphate and therefore appears to be important in sugar selection. The neutral SER759 residue is involved in the positioning of the priming nucleotide [75,76], while the hydrophilic and polar LYS798 stabilizes the RdRp core [77]. The multi-subunit RdRp binds nucleotide triphosphate substrates that enter the main enzyme channel via a hydrophilic cluster formed by the polar residues LYS545, ARG553, and ARG555. When the substrate enters the active site of the enzyme, the complex is formed.
2.3. Binding Modes of the Native and Candidate Ligands to RdRp in Different States
The procedure used to dock FVP-RTP analogues (Figure 1, R = I, Br, Cl, CF3, H, CH3, CF3, or CN) to the SARS-CoV-2 RdRp was nearly identical to that previously described [64,78,79]. The binding site (cavity) was identified, and the search space was defined as a subset region of about 9.0–15.0 Å.
Knowing that FVP-RTP can effectively mimic either guanosine or adenosine and bind to cytosine or uracil [66,80], both potential possible methods to bind to the SARS-CoV RdRp were explored. This may help resolve the source of bias in the spectrum of mutations induced by FVP, which is likely to be competition with adenosine and guanosine during nucleotide incorporation. Furthermore, the differences between desirable/productive and undesirable/unproductive binding modes were analyzed. To evaluate the quality of the docking process, we performed a redocking task. In each case, the actual ligand was removed from the parental structure and redocked in its own binding site. The redocking protocol was considered successful when the root-mean-square deviation (RMSD) of the pose relative to its conformation in the parental structure did not exceed 3 Å. The binding mode of the native ligand to the RdRp was described in detail. Then, in the same way, the new ligand was docked into the rigid protein structure, and its binding mode was characterized.
2.3.1. Pre-Catalytic State—Productive Mode I (Binding to Cytosine and Stacking to Adenosine)
Binding Mode of the Native FVP-RTP Ligand to RdRp
The structure of the replicating polymerase complex of SARS-CoV-2 with FVP-RTP in the pre-catalytic state (7CTT) [81] was retrieved from the PDB database. The pocket containing FVP-RTP has a surface area of 967.55 Å2 and a volume of 998.91 Å3, which is thus a surface/volume ratio of 0.97. Its hydrophobicity is 0.58. In this pre-catalytic state, one FVP-RTP molecule is incorporated into the RNA primer strand and forms a base-stacking interaction with adenosine in this strand. The conformation of the amide group in FVP-RTP is stabilized by the intramolecular N–H⋯O hydrogen bond of 2.612 Å (closing 6-member ring), which causes it to resemble guanine and facilitate π⋯π stacking. FVP-RTP is also involved in strong hydrogen bonds (two N–H⋯O of 2.4 Å and 3.2 Å and one N–H⋯N of 2.74 Å) with the cytosine from the RNA template strand. Furthermore, FVP-RTP binds to at least nine RdRp residues and one cofactor (magnesium Mg2+ ion) via various non-covalent interactions, as shown in Table 6 and Table 7 and Figure 4.
Table 6.
The list of hydrogen bonds binding FVP-RTP to RdRp in the 7CTT [81] complex.
Table 7.
The list of salt bridges (opposite charges), π-cation interactions (a positive charge and an aromatic ring), and metallic interactions in the 7CTT [81] complex.

Figure 4.
The binding mode of FVP-RTP to RdRp in the 7CTT [81] complex.
Non-covalent interactions include one N–H⋯O of 2.99 Å and two O–H⋯O hydrogen bonds of 2.44 Å and 3.38 Å binding FVP-RTP to serine SER682, and plenty of O–H⋯O and N–H⋯O hydrogen bonds between ribosyl and phosphate of FVP-RTP, and the neighboring residues, as shown in Table 1. FVP-RTP is also coordinated with ARG555 via π-cation interaction, with LYS545, which accepts hydrogen bonds, and with ARG555, LYS798, LYS621, and ARG553 via salt bridges. The interaction of FVP-RTP with Mg2+ is weak because it is long-range (of 6.94 Å). Fluorine participates in two F⋯O contacts of 4.957 Å and 4.691 Å and supports a C–H⋯O hydrogen bond of 2.694 Å to maintain the specific conformation of RTP. Moreover, the F⋯N contact of 4.151 Å supports the π⋯π stacking. This all adheres to the typical pattern of fluoride’s role in drug structures, specifically its impact on conformation. The binding mode of the candidate ligands should be consistent with that described above.
Binding Mode of the Candidate Ligands to RdRp
- Docking Results
Triphosphorylated forms of the candidate ligands (with the F replaced by I, Br, Cl, H, CH3, CF3, or CN at the C(6) position) were prepared and docked to the binding site in RdRp that had been previously prepared by correcting protonation and atomic hybridization. The docking results are summarized in Table 8, and the best poses that led to the stabilization of the complex with the highest binding/docking score are shown in Figure 5.
Table 8.
The docking results for FVR-RTP analogues (the RdRp target from 7CTT [81]).
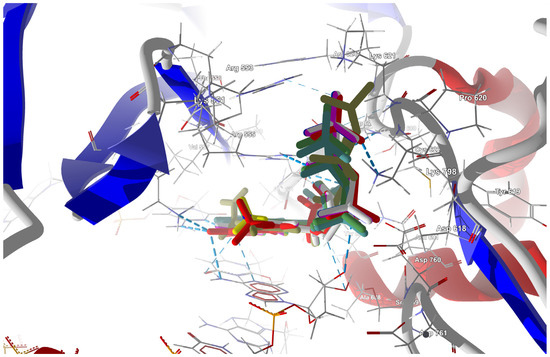
Figure 5.
The docked poses of the ligands in the RdRp binding site. The protein backbone is represented as a cartoon, the binding cavity residues are shown as thin sticks, and the docked ligands are shown as color sticks (FVP in cyan, CN in yellow, and CF3 in red).
The ordering of the ligands by descending docking score is as follows:
CN > CF3 > CH3 > Cl > Br > I > H > F.
As shown in Table 6, the total protein–ligand binding energy increased by 20–30% compared to the actual ligand, FVR-RTP. The docking score and total protein–ligand binding energy are highest for the CN analogue, followed by CF3 and Cl. According to decreasing total binding energy, the ligands can be ordered as follows:
CN > CF3 > Cl > I > CH3 > Br > H > F.
The sum of the binding energies of the ligand to the cofactor, RNA Template, and RNA primer is the highest for the CF3 analogue, followed by CN and Cl. Protein–ligand hydrogen bonds are the strongest for the CF3 analogue, followed by CN and Br. The orderings according to different energy characteristics, as presented in Table 9, show similar trends, i.e., the substitution of F to CF3 and CN leads to the most significant changes.
Table 9.
The ordering of the ligands according to the different parameters describing the binding strength.
The ordering of the ligands according to the decreasing binding affinity is as follows:
CF3 > CN > F > H > Cl ≅ Br > I > CH3
The binding affinity is strongly but non-linearly correlated with the relative reactivity power R+ and R−, Figure 6.
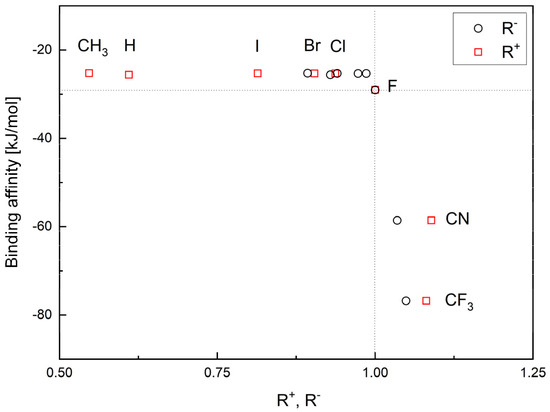
Figure 6.
The binding affinity versus ligand’s ability to accept (R+) and donate (R−) charge.
The highest values of R+ and R− correspond to the strongest binding affinity. Thus, the CF3 and CN analogues indeed seem the most promising.
- In-Depth Analysis of the Binding Mode
The in-depth inspection of the binding mode reveal that all FVP-RTP analogues bind to the same set of the RdRp residues (76 in total), RNA primer, RNA template, and one cofactor (Mg2+ ion), although via various non-covalent interactions. In this sense, the binding mode remains consistent among all analogues, while there are differences in the strength and nature of the interactions.
The binding mode of each ligand can be treated as a specific kind of “binding fingerprint”. Global differences in the binding modes of specific ligands relative to the actual ligand FVP-RTP (the entire complex, only protein residues, only cofactors, RNA template, and RNA primer) can be compared using different mathematical metrics (Euclidean or Manhattan) or simple summations, as shown in Table 10 and Table 11. Manhattan distance, which measures distance by pairwise aggregating the absolute difference between each variable, seems the most intuitive for relating the binding mode differences. Euclidean distance, which uses the squared difference in each variable, seems less convenient as it over-optimizes the result. Simple summing (additive method) shows only the balance of contributions.
Table 10.
Comparison of the similarity of binding patterns of the individual ligands with respect to the FPV-RTP ligand (Pre-Catalytic State—Productive Mode I, all residues).
Table 11.
Comparison of the similarity of binding patterns of the individual ligands with respect to the FPV-RTF ligand (Pre-Catalytic State—Productive Mode I, selected residues).
Although each ligand interacts with as many as 76 residues of RdRp, most of these interactions are of minor importance, as shown in Table 8 and Table 9 and Figure S1. The CF3 and CN derivatives show the most significant differences in their binding modes compared to FVP, as Table 6, Table 8 and Table 9 show. Furthermore, these differences arise from different factors. While CN substitution modifies bindings to the RdRp residues, primarily those near the active site, CF3 significantly modifies interactions with the co-factors, RNA template, and RNA primer. Moreover, the docking results suggest that among the candidate ligands, the CF3 analogue should bind most strongly to both the RdRp, as well as the cofactor, RNA template, and RNA primer, and thus may be a very good alternative to FVP. Although the CN derivative has the highest total binding affinity, as shown in Table 6, it binds relatively weakly to the RNA template due to the unfavorable conformation of its amide group (tilted relative to the plane of the pyridazine ring).
Detailed insight into the binding mode using Ligplot+ [82,83] reveals a set of hydrogen bonds binding the ligands with ARG555, SER682, LYS98, LYS621, and LYS545 and hydrophobic interactions binding the ligands with ASP760, THR687, ASP623, VAL557, ASP618, adenosine, and uracil, as shown in Figure S2, which further stabilizes the protein–ligand complex. It should be noted that Ligplot+ suggests a similar set of hydrophobic interactions for all considered ligands binding to the RdRp. However, ASP623 forms NH⋯O or OH⋯O hydrogen bonds only with the CF3 and CN analogues and is therefore not recognized as hydrophobic, as shown in Figure S2 (middle and right).
The binding energies of the FVP-RTP analogues to the RdRp residues, RNA primer, RNA template, and cofactor (7CTT [81] target) are summarized in Table 12, and a radar plot comparing these data is shown in Figure 7.
Table 12.
The binding mode of the FVR-RTP analogues to RdRp (the RdRp target from 7CTT [81]); kcal/mol units. (The active site residues, RNA primer, RNA template, and cofactor are taken into account).

Figure 7.
The comparison of the binding energies of FVR-RTP analogues with the RdRp split to active site residues, RNA primer, RNA template, and cofactor. (FVP*—native ligand).
As shown in Table 12 and Figure 7, the replacement of the F at C(6) with I, Br, Cl, CF3, H, CH3, CF3, and CN leads primarily to the changes in the binding strength of the ligand to the RNA primer, LYS545, ARG553, ARG555, ASP618, LYS621, CYS622, ASP623, SER682, ASN691, SER759, ASP760, ASP761, and LYS798. Moreover, the interactions of all FVP-RTP analogues with the conserved residue ASP618 and critical residues SER759, ASP760, and ASP761 are primarily electrostatic and repulsive; the bindings to the polar and hydrophilic LYS798, LYS621, SER682, ASP623, and ASN691 are strong and attractive, while their bindings to the hydrophilic cluster formed by LYS545, ARG553, and ARG555 are strong and mainly ionic (salt bridges). The bindings to the Mg2+ and Zn2+ cofactors are relatively weak, and the latter is negligible. However, the allocation of the binding energy between the individual residues is not uniform, Figure 7. Moreover, some residues, such as LYS798, LYS621, and ASP618, are highly sensitive to the type of ligand.
Regardless of whether only residues near the active site or all of them are taken into account, the most significant changes occur when F is replaced by CF3 or CN, as shown in Table 6, Table 8, Table 9 and Table 10. The most promising CF3 analogue interacts with the conserved residue ASP618 (11.267 kcal/mol) and three critical residues neutral SER759 (−0.752 kcal/mol), polar ASP761 (4.363 kcal/mol), and ASP760 (5.699 kcal/mol); these interactions are primarily electrostatic and repulsive in nature. Its bindings with LYS798 (−21.657 kcal/mol), LYS621 (−31.682 kcal/mol), SER682 (−10.147 kcal/mol), ASP623 (−5.553 kcal/mol), and ASN691 (−2.873 kcal/mol) are significantly stronger than the other ligands. The binding of the CF3 analogue to the hydrophilic cluster residues LYS545 (−9.728 kcal/mol), ARG553 (−16.868 kcal/mol), and ARG555 (−32.469 kcal/mol) is very strong, but its binding to the Mg2+ cofactor is relatively weak: only of −6.464 kcal/mol. Moreover, its binding to the RNA template and primer is the strongest among the candidate ligands (−48.652 and −16.309 kcal/mol for the RNA primer and template, respectively). The CN analogue binds to the RNA template and RNA primer less strongly than the CF3 analogue, but its binding to LYS621 and LYS798 is much stronger. The cosine distance in Table 10 shows the relatively low similarity of the CF3 and CN analogues to the FVP-RTP in terms of binding mode when considering the active site residues, RNA primer, RNA template, and cofactor and even slightly smaller when considering only active site residues. This effect is noticeable in all analogues, but it is noteworthy only in the CN and CF3 analogues. Importantly, the discrepancies in molecular fingerprints (Tanimoto distances, Figure 1) do not correspond to the discrepancies in the binding modes. Thus, the alteration in the binding mode resulting from a mere substitution of a group is complex and multifactorial.
- Binding Mode Visualization
The sign[λ2(r)]ρ(r) surface mapped to the reduced density gradient, RDG(r), isosurface in the red–green–blue scheme for the RdRp-ligand complex visualizes the binding mode and reveals the nature of the non-covalent interactions between the RdRp and the ligands, as can be seen in Figure 8.

Figure 8.
The overlap of the isosurfaces of RDG (isovalue 0.5a.u.) with sign(λ2)ρBCP mapped over the surface for (a) FVP (red) and the CF3 derivative (green) and (b) FVP (red) and the CN derivative (green). (Pre-Catalytic State—Productive Mode I).
The overlap of the isosurfaces of RDG with sign(λ2)ρBCP mapped over the surface shows the differences in binding mode for the candidate and actual ligand. Weak van der Waals-type interactions clearly dominate, which is indicated by the green color of the surface for each ligand. The large and nearly flat green area above the six-membered ring of the FVP ring proves π⋯π stacking between the ligands and adenosine. The N–H⋯O hydrogen bond linking the ligands to the RNA strand is clearly visible and depicted by a small light cyan disc-shaped area near =O and -NH2. The CF3 analogue binds more strongly to RdRp than the CN analogue, as confirmed by the significantly larger blue-green surfaces depicting attractive interactions, as shown in Figure 8.
2.3.2. Pre-Catalytic State—Productive Mode II (Binding to Uracil and Stacking to Guanosine)
Binding of the Native RVD Ligand to RdRp
The structure of the replicating polymerase complex of SARS-CoV-2 in the pre-catalytic state bound to RVD (7UO4) [80] was retrieved from the PDB database. The pocket containing RDV has a surface area of 1364.91 Å2, a volume of 1364.99 Å3, and a surface/volume ratio of 1.0. Its hydrophobicity factor is slightly higher and equal to 0.61. The backbone of 7UO4 [80], which holds the protein together and gives it its tertiary structure, differs from 7CTT [81] but only by 0.475% (backbone residues) and 1.817% (all residues). In this form, one RVD molecule incorporates into the RNA primer strand and forms a base-stacking interaction with the guanosine. It also participates in strong hydrogen bonds with the uracil moiety from the RNA template strand. Thus, this structure actually represents a slightly different binding mode than FVP-RTP in 7CTT [81].
Considering the possibility of alternative binding of FVP-RTP to the RNA strand, we used 7UO4 [80] to simulate this particular variant. However, the actual ligand, RVD, binds to a similar set of the RdRp residues (ASP623, ASN691, ARG555, LYS798, LYS621, ARG553, LYS551 ASP618, ASP760, and SER682) and one magnesium ion (cofactor), as shown in Table 13 and Table 14 and Figure 9.
Table 13.
The list of most important hydrogen bonds binding RVD to RdRp in 7UO4 [80] complex.
Table 14.
The list of salt bridges (opposite charges) and metallic interactions in 7UO4 [80].
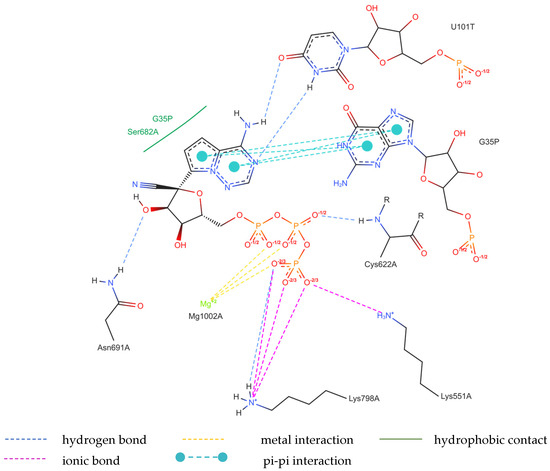
Figure 9.
The binding mode of RDV (7UO4 [80]).
The binding of RVD to the hydrophilic cluster residues LYS545, ARG553, ARG555, and LYS551 and the Mg2+ cofactor is very strong and involves π-cation (ARG555), salt bridge (LYS551), or electrostatic/charge–charge (ARG553 and Mg2+) interactions. The interaction between RVD and LYS798 is mixed in nature and can be described as a combination of salt bridges and electrostatic (charge–charge, attractive) interactions. RVD interactions with ASP618, ASP760, and ASP761 are primarily electrostatic but repulsive. Ligand bonds with guanosine from the RNA primer and SER682 are of the π⋯π type (hydrophobic). Conventional strong and attractive hydrogen bonds bind RDV to ASP623, ASN691, and uracil. In-depth analysis reveals that the actual ligand, RVD, is linked to the uracil in the RNA template via two hydrogen bonds: N–H⋯O of 2.878 Å and N–H⋯N of 3.10 Å, involving the amine group and nitrogen N(4), respectively. In addition, three N–H⋯O hydrogen bonds link –OH moieties from RDV to ASN691 (of 2.80 Å), LYS798 (of 2.89 Å), CYS622 (of 3.44 Å), and two O–H⋯O hydrogen bonds link RDV with ASP623 (of 3.21 Å). The atoms of the RDV heterocyclic ring and nitrogen atom from the –NH2 group participate in the π⋯π stacking with guanosine (of 3.99–5.0 Å). The RVD ligand binds to the NH3+ group of LYS798 using three oxygen atoms of its PO3 moiety.
Binding Mode of the Candidate Ligands to RdRp
- Docking Results
The triphosphorylated forms of the candidate ligands in which the F at the C(6) position was replaced by I, Br, Cl, H, CH3, CF3, or CN were docked to the active site instead of the parental RDV. The docking results are summarized in Table 15, and the best poses are shown in Figure 10.
Table 15.
The docking results for FVR-RTP analogues (the RdRp target from 7UO4 [80]).

Figure 10.
The docked poses of the ligands in the binding site of RdRp (target from 7UO4 [80]). The protein backbone is represented as a cartoon, the binding cavity residues are shown as thin sticks, and the docked ligands are shown as sticks.
As shown in Table 15, the total protein–ligand binding energy increased by approximately 30% compared to the energy of the actual ligand, RDV. The highest docking score and total protein–ligand binding energy are observed for FVP-RTP and the CF3 and CN analogues are shown in Table 16. The ligands’ ordering according to the decreasing docking score is as follows:
Table 16.
The ligands’ ordering according to the decreasing binding strength.
F > CF3 > CN > Cl > Br > I > CH3 > H
According to the decreasing total energy of binding, the ligands can be ordered as follows:
CF3 > F > CN > CH3 > Cl > I > H > Br
The sum of the energies of binding ligand to cofactor, RNA Template, and RNA primer is the highest for the CH3 analogue, followed by F and CN. The protein–ligand hydrogen bonds are the strongest for FVP-RTP, followed by the H and Cl analogues.
- In-Depth Analysis of the Binding Mode
Overall, the original FVP-RTP ligand, as well as its analogues, bind to the same set of RdRp residues, RNA primer, RNA template, and one cofactor (Mg2+ ion) but via different non-covalent interactions. In-depth analysis shows that the bindings of RVD and FVP-RTP to RdRp differ by as much as 20 residues (the Tanimoto distance 0.73). Differences in binding modes of specific ligands compared to the actual ligand RVD (the entire complex, only protein residues, only cofactors, RNA template, and RNA primer) calculated using different metrics (Euclidean or Manhattan) and additively are listed in Table 17 and Table 18.
Table 17.
The differences in binding mode of the particular FVP-RTP analogues relative to actual RVD ligand (Pre-Catalytic State—Productive Mode II, all residues).
Table 18.
The comparison of the similarity of binding patterns of the individual ligands in relation to the actual RVD ligand (Pre-Catalytic State—Productive Mode II, selected residues).
In terms of overall interaction pattern, the CF3 analogue is closest to RDV, while the H and I analogues are the most different. However, the differences are mainly due to binding to the co-factors, RNA primer, and RNA template. The three analogues, F, CN, and CF3, appear to be the most preferred because they exhibit the strongest total protein–ligand binding, as well as a strong binding ability to both the RNA primer and RN template. The differences between the interactions within the entire complex and active site residues, as shown in Table 17 and Table 18, are subtle, so only residues near the ligand play a key role. Although each ligand interacts with as many as 83 residues of RdRp, most of them are of minor importance, Figure S3.
Docked ligands interact mainly with the active site residues via hydrogen bonding and hydrophobic interactions. Detailed insight into the binding mode using Ligplot+ [82,83] confirms the presence of the hydrogen bonds and reveals the hydrophobic interactions binding the ligands and ASP760, THR687, ASP623, VAL557, ASP618, adenosine, and uracil, as shown in Figure S4. Note that Ligplot+ suggests a similar set of hydrophobic interactions for the ligands binding to the same protein. However, only FVP-RTP forms an NH⋯O hydrogen bond with ASP623 and ASP760. In the case of the CF3 analogue, the hydrophobic contacts replace the hydrogen bonds. The CF3 analogue has a high docking score but relatively low binding affinity, so it may seem most convenient when it is desired to exclude binding to uracil.
The binding energies of FVR-RTP analogues with the RdRp residues, RNA primer, RNA template, and cofactor are summarized in Table 19, and a radar plot comparing these data is shown in Figure 11.
Table 19.
The binding mode of the FVP-RTP analogues with RdRp (the RdRp target from 7UO4 [80]); kcal/mol units.

Figure 11.
The comparison of the binding energies of FVR-RTP analogues with RdRp (selected residues), RNA primer, RNA template, and cofactor (target from 7UO4 [80]). (RDV*—native ligand).
As follows from Table 19 and Figure 11, the replacement of the F at C(6) with I, Br, Cl, CF3, H, CH3, CF3, and CN leads primarily to the changes in the binding strength of the ligand to the RNA primer, Mg2+, RNA template, and residues: LYS545, LYS551, ARG553, ARG555, ASP618, LYS621, CYS622, ASP623, SER682, THR687, ASP760, ASP761, and LYS798. The nature of these interactions is the same as previously described for 7CTT [81], but their strengths are different, e.g., the bond with Mg2+ is very strong. Therefore, the distribution of the binding energy between individual residues is relatively uniform, Figure 11. Moreover, some residues, such as ARG553, ARG555, LYS621, and THR687, are highly sensitive to the type of the ligand. The high similarity of the binding modes in candidate ligands to RDV, greatest for the CF3 analogue, is confirmed by the high cosine distance values.
- Binding Mode Visualization
The sign[λ2(r)]ρ(r) surface mapped to the RDG(r) isosurface in the red–green–blue scheme visualizes the binding mode for the RdRp-ligand complex and reveals the nature of the non-covalent interactions between RdRp and candidate ligands, shown in Figure 12.

Figure 12.
The isosurfaces of RDG (isovalue 0.5a.u.) with sign(λ2)ρBCP mapped over the surface for (a) the CF3 analogue and (b) the CN analogue.(Pre-Catalytic State—Productive Mode II).
Weak van der Waals-type interactions clearly dominate, as indicated by the green color of the surface. The N–H⋯O hydrogen bond linking the ligands to the RNA strand is clearly visible and depicted by a small light cyan disc-shaped region near =O and -NH2. The large and nearly flat green surfaces above the six-membered ring of the FVP ring prove π⋯π stacking between the ligands and guanosine. The differences between the modes of binding of the CF3 and CN analogues are small, as shown in Figure 12.
However, the differences between the binding modes in both pre-catalytic states (binding to cytosine and stacking to adenosine vs. binding to uracil and stacking to guanosine) for the same ligands are significant as the cosine distance ranges from 0.550 to 0.610. The most significant difference concerns the binding of ligand to Mg2+, which is six times stronger. Three residues, ARG555, ARG553, and ASP618, are important, but their ligand binding is only twice as strong. Ligand binding to the RNA template is only slightly stronger. The docking results suggest that among the analogues studied, the CF3 derivative should bind most strongly to RdRp, the cofactor Mg2+, the RNA template, and the RNA primer and may therefore be a very good alternative to FVP-RTP and RVD. The key factor for improving FVP effectiveness seems to be increasing the binding strength of the ligand to the RNA template.
2.3.3. Pre-Catalytic State—Non-Productive Mode
The structure of the complex of the SARS-CoV-2 replicating polymerase bound to FVP-RTP in the pre-catalytic and non-productive state (7AAP) [84] was retrieved from the PDB database. The pocket containing FVP-RTP has a surface area of 1120.59 Å2, a volume of 1205.75 Å3, and therefore a surface/volume ratio of 0.93. Its hydrophobicity is 0.61. The 7AAP [84] backbone differs from 7UO4 [80] by 0.737 (backbone residues) and 1.638 (all residues), which is almost twice as much as 7CTT [81]. The FVP-RTP molecule in 7AAP [84] weakly interacts with ASP618 (5.238 kcal/mol), SER759 (−0.79 kcal/mol), ASP760 (1.779 kcal/mol), and ASP761 (6.171 kcal/mol) but binds strongly to LYS545 (−9.426 kcal/mol), ARG553 (−4.621 kcal/mol), and ARG555 (−8.070 kcal/mol). In the non-productive mode, the phosphoribosyl conformation is different than in the productive mode and ensures a very strong binding of FVP-RTP to two Mg2+ ions (−28.57 and −44.10 kcal/mol).
FVP-RTP interactions with the hydrophilic cluster residues LYS545, ARG553, ARG555, and LYS551, as well as the Mg2+ cofactor, are very strong and include π-cation (ARG555), salt bridge (LYS551) or electrostatic/charge–charge interactions (ARG553, Mg2+). The bonding between FVP-RTP and LYS798 exhibits a mixed nature and can be described as a combination of salt bridges and electrostatic (charge–charge, attractive) interactions. The FVP-RTP interactions with ASP618, ASP760, and ASP761 are mainly electrostatic but repulsive. The interactions of the ligands with guanosine from RNA primer and SER682 are of the π⋯π type (hydrophobic). Conventional strong and attractive hydrogen bonds bind RDV to ASP623, ASN691, and uracil. In-depth analysis reveals that the actual ligand, FVP-RTP, is linked to uracil in the RNA template via two hydrogen bonds, N–H⋯O of 2.878 Å and N–H⋯N of 3.10 Å, involving the amine group and nitrogen N(4), respectively, Figure 13.

Figure 13.
The binding mode of FVP-RTP in 7AAP [84].
Docking Results
The docking results of FVP-RTP and its seven analogues are summarized in Table 20. Negative values of the docking scores suggest generally favorable docking of the ligands at the binding site.
Table 20.
The docking results for the FVR-RTP analogues (the RdRp target from 7AAP [84]).
As shown in Table 20, the docking score values are the highest for the CF3 analogue, followed by CN and I.
The ordering of the ligands in descending order of the docking scores is as follows:
CF3 > CN > I > Br > F > H > Cl > CH3
According to the decreasing total energy of binding, the ligands can be ordered as follows:
CF3 > Br > Cl > I > CH3 > CN > H > F
The total protein–ligand binding energy for the CF3 analogue was increased by 20% compared to that of the actual ligand, FVR-RTP. The sum of the binding energies of the ligand to the cofactor, RNA Template, and RNA primer is highest for the CH3 analogue, followed by CF3 and Br (this order is mainly due to the steric effect). Hydrogen bonds between protein and ligand are strongest for the CF3 analogue, followed by CH3 and H. The CF3 analogue’s highest binding affinity suggests it is the most promising ligand. On the contrary, the lowest binding affinity of the CN analogue suggests that it may offer a non-productive mode exclusion.
In-Depth Analysis of the Binding Mode
Differences in the binding modes of specific ligands compared to the actual ligand, RVD, calculated using different metrics (Euclidean or Manhattan) and additively are summarized in Table 21 and Table 22. Calculations were performed for three variants: the entire complex; protein residues; cofactors, RNA template and RNA primer.
Table 21.
The differences in binding mode of the particular FVP-RTP analogues relative to actual ligand FVP-RTP (Pre-Catalytic State—Non-Productive Mode, all residues).
Table 22.
Comparison of the similarity of binding patterns of individual ligands in relation to the current FVP-RTP ligand (Pre-Catalytic State—Non-Productive Mode, selected residues).
The binding of the cofactors, RNA primer, and RNA template is the key factor that determines changes in the entire complex. The distinctions among the interactions throughout the entire complex and the active site residues are subtle, validating that only specific residues in close proximity to the ligand are crucial. In terms of the total interaction pattern, the CH3 analogue is the closest to the actual ligand FVR-RTP, while the CF3 and I analogues are the most different, as can be seen in Table 21 and Table 22. However, the differences in the strength of the residues’ interactions with individual ligands in 7AAP [84] are significantly greater than those observed in 7CTT [81] (especially for CF3 and I analogues). Overall, of the analogues tested, the CF3 derivative should bind most strongly to both RdRp and the cofactor, RNA template, and RNA primer, while the CN analogue provided the weakest binding.
The docked ligands interact mainly with the active site residues via hydrogen bonding and hydrophobic interactions. A thorough examination of binding modes using Ligplot+ uncovers the hydrophobic interactions that bind the ligands with ASP760, THR687, SER682, adenosine, and uracil, as shown in Figure S5.
The CF3 analogue additionally interacts with Asp618, while CN interacts with Asp555 and Asp623. Moreover, the CF3 derivative forms NH⋯O, NH⋯N, and NH⋯F hydrogen bonds with LYS545, while the CN analogue forms only one NH⋯N hydrogen bond. These bonds are absent in the structure of the 7AAP [84] complex. Thus, the binding mode in non-productive 7AAP is heavily influenced by the substituent.
The binding energies of the FVR-RTP analogues to the RdRp residues, RNA primer, RNA template, and cofactor are summarized in Table 23, and the best poses are shown in Figure 14.
Table 23.
The binding affinity of the FVP-RTP analogues to RdRp (the RdRp target from 7AAP); kcal/mol units.
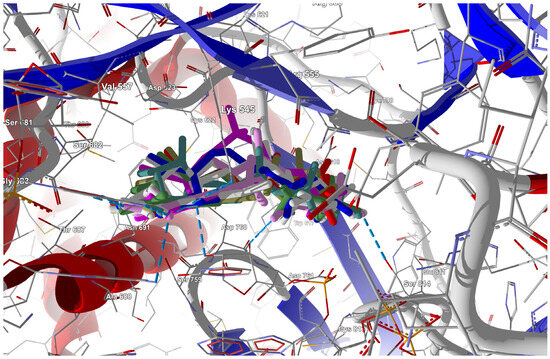
Figure 14.
The docked poses of the ligands in the binding site of RdRp (target from 7AAP [84]). The protein backbone is represented as a cartoon; the binding cavity residues are shown as thin sticks, and the docked ligands are shown as sticks (FVP-RTP in cyan, the CF3 analogue in pink, and the CN analogue in white).
A radar plot illustrating the discrepancies in binding modes is shown in Figure 15.

Figure 15.
The comparison of the binding energies of FVR-RTP analogues to RdRp (selected residues), RNA primer, RNA template, and cofactor (target from 7AAP [84]) (FVP-RTP*—native ligand).
The largest variations in binding strength caused by the substituent effect are observed in the bonds connecting the ligand and the cofactor. Most residues, except LYS545 and ARG555, are insensitive to the type of ligand. The strong resemblance of binding modes in the complexes of RdRp with candidate ligands and the complex with FVP-RTP is reaffirmed by the elevated cosine distance values. The highest cosine distance value for the CF3 analogue revealed its high similarity to FVP-RTP.
Binding Mode Visualization
The sign[λ2(r)]ρ(r) surface mapped to the RDG(r) isosurface in the red–green–blue scheme for RdRp-ligand complex visualizes the binding mode and reveals the nature of the non-covalent interactions between the RdRp and the candidate ligands, as shown in Figure 16.

Figure 16.
The isosurfaces of RDG (isovalue 0.5a.u.) with sign(λ2)ρBCP mapped over the surface for (a) the CF3 derivative and (b) the CN derivative (Pre-Catalytic State—Non-Productive Mode).
There are extensive green areas indicating the presence of weak van der Waals interactions, especially in the case of the CN derivative. The N–H⋯O hydrogen bond linking the ligands to cytosine is clearly visible and depicted as a small light cyan disc-shaped area near =O and -NH2. Both its shape and color reveal that the CF3 analogue binds more strongly to cytosine than the CN analogue. The large and nearly flat green area above the six-membered ring of the pyridazine ring proves π⋯π stacking between the ligands and guanosine. The CN analogue shows larger surfaces representing the interactions of phosphate groups with RdRp. However, the mostly green color indicates that these interactions are weaker than those observed for CF3.
The binding modes in 7AAP [84] and 7OU4 [80] differ in the binding strength within the complex components, i.e., the RNA primer, LYS621, LYS798, and Mg2+. The most significant differences between the non-productive (7AAP [84]) and productive modes (7CTT [81] and 7OU4 [80]) concern the binding strength of LYS798 and Mg2+ (three magnesium ions involved) with the ligand, which are six times weaker and very strong, respectively. The inorganic Mg2+ cofactor, which binds strongly to each ligand in the non-productive mode, changes the structure and chemical potential of the active site. The LYS798 residue, which stabilizes the core of the RdRp, is weakly bound by the ligand in this mode. The CF3 analogue shows the strongest binding to LYS798 among the FVP-RTP analogues and forms a strong binding to the cofactor. Moreover, the binding of the ligand to the RNA primer in the productive state is weaker, but to the RNA template, it is stronger. Importantly, the binding affinity in the non-productive mode is not correlated with the R+ and R-values.
The differences between the binding modes in productive and non-productive states can be compared using the radar plots in Figure 7, Figure 12 and Figure 15. In the productive modes, the bindings between the ligands and LYS621, LYS798, ARG555, and ARG553 are stronger than in the non-productive mode. Furthermore, the allocation of interaction energy between the active-site residues is more evenly distributed in the non-productive mode (i.e., the interactions are less directional).
2.3.4. Active State
The development of nucleotide-based medicines for combating COVID-19 relies on the understanding of the structure in the active state. The structure of the replicating polymerase complex of SARS-CoV-2 in the active state bound to FVP-RMP (7DFG) [85] was retrieved from the PDB database. The pocket containing FVP-RMP incorporated into the RNA strand has a volume of 2765 Å3. The two most promising ligands (the CF3 or CN analogues of FVP-RMP) were prepared, incorporated into the RNA strand, and docked.
Docking Results
The docking results are summarized in Table 24, and a radial plot comparing these data is shown in Figure 17.
Table 24.
The docking results for FVP-RMP analogues (the RdRp target from 7DFG [85]).

Figure 17.
The comparison of the binding energies of the FVR-RMP analogues to RdRp (selected residues) and cofactor (target from 7DFG [85]). (FVP-RMP*—native ligand).
In-Depth Analysis of the Binding Mode
The docking score is higher for the CN analogue than for the CF3 analogue, but the total energy of protein–ligand binding and hydrogen bond strength are higher for CF3 than for CN, as shown in Table 25.
Table 25.
The binding mode of the FVP-RMP analogues to RdRp (target from 7DFG [85]); kcal/mol units.
Furthermore, the CF3 analogue has a much higher (−75.135 kcal/mol), while the CN analogue has a lower (−69.515 kcal/mol) binding affinity than the actual ligand (−72.457 kJ/mol). The radial plot presented in Figure 17 demonstrates uniformity and symmetry similar to that observed in the pre-catalytic state (target from 7CTT [81]) that was previously described. Substitution leads to significant differences in binding strengths of ARG836, ARG858, ARG513, ARG555, and LYS545, with ARG836 being most strongly affected. However, determining which ligand has a binding mode closest to FVP-RMP from examining just the plot shapes poses a challenge. In this task, the cosine distance is helpful. The cosine distance between the energetic profiles of binding of both ligands is high (0.996), which confirms their high similarity and binding efficiency. Moreover, the cosine distance between the energetic profiles of binding for FVP-RMP and the CN analogue incorporated in the RNA strand is slightly higher than that of FVP-RMP and the CF3 analogue (0.993 vs. 0.991, respectively). Thus, in terms of the overall interaction pattern, the CN analogue is closer to FVP-RMP than the CF3 analogue. The distinctions between the two ligands primarily stem from their bindings to the co-factors and RNA template. There is relatively little variation in the strength of the bindings within the active site residues. The best poses with the greatest binding/docking scores, illustrated in Figure 18, appear to be insignificantly distinct.
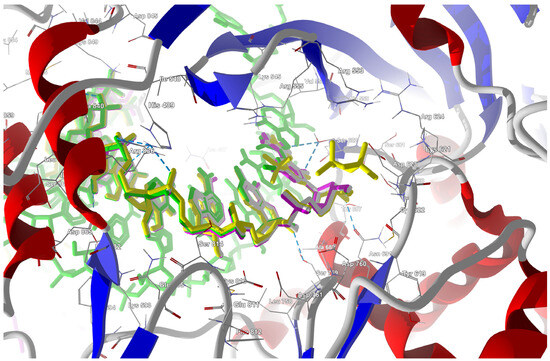
Figure 18.
The docked poses of the ligands in the binding site of RdRp (Active state). The protein backbone is represented as a cartoon; the binding cavity residues are shown as thin sticks and docked ligands are shown as sticks (FVP in pink, the CF3 analogue in yellow, and the CN analogue in green).
The disparities in the binding modes of particular ligands compared to the actual ligand, ascertained using various metrics (Euclidean and Manhattan) and additively, are summarized in Table 26 and Table 27. Three variants, the entire complex, protein residues, and cofactors and the RNA template, were taken into account.
Table 26.
The differences in binding mode of the particular FVP-RTP analogues relative to actual ligand FVP-RTP (Active stat, all residues).
Table 27.
Comparison of the similarity of binding patterns of individual ligands in relation to the current FVP-RTP ligand (Active state, selected residues).
Detailed insight into the structures of protein–ligand complexes using Ligplot+ reveals the hydrophobic interactions between the candidate ligands incorporated into the RNA strand and RdRp residues, Figure S6. As can be seen from Figure S6, all ligands interact with the residues ASP623, CYS813, ALA840, SER861, and MET855. Additionally, FVP-RTP interacts hydrophobically with ASP760 and ASP865; the CF3 analogue interacts with ASP691, LYS849, and GLU857; and CN interacts with LEU862, LYS849, and GLU857. Furthermore, both CN and CF3 analogues form OH⋯O hydrogen bonds with ASP865, while ASP760 forms metallic bonds with Mg2+ instead of the ligand. These bonds are not present in the current active state complex. Thus, the nature of the binding mode in the active state is strongly modulated by the substituent. Additionally, the hydrogen bond NH⋯F of 3.299Å between Lys545 and the CF3 ligand results in the RNA strand with the CF3 analogue being held more securely in the hydrophilic pocket. The CN analogue does not form an extra bond. Nevertheless, thanks to the -CN group, it facilitates water binding.
Binding Mode Visualization
The mapping of sign[λ2(r)]ρ(r) onto the RDG(r) isosurface demonstrates the significant similarity between the binding modes of the CF3 and CN analogues, as shown in Figure 19.
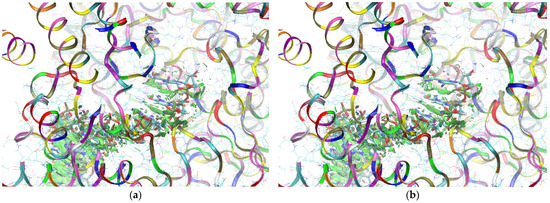
Figure 19.
The isosurfaces of RDG (isovalue 0.5a.u.) with sign(λ2)ρBCP mapped over the surface for (a) the CF3 derivative and (b) the CN derivative. (Active state).
Green areas in Figure 19 indicate weak non-covalent interactions. The green, flat, and almost parallel surfaces in the single-stranded RNA template reveal numerous instances of hydrophobic π⋯π stacking between aromatic rings.
2.3.5. Allosteric Effect
A possible alternative mechanism of FVP action, which may explain the scattering of the results of clinical trials [86,87] or the synergistic effect observed in combined treatment against SARS-CoV-2 [88], can be associated with the allosteric effect [64]. The cryo-electron microscopy structure of SARS-CoV-2 virus full-length nsp12 in complex with cofactors nsp7 and nsp8 (6M71) [74] was retrieved from the PDB database. The allosteric sites were detected with Allosite-Pro [89] and PASSer [90] using a scheme [64,91,92].
Near the active site (2943 Å3 in volume), there are two allosteric pockets on either side of the RNA strand. One of them is composed of VAL557, ARG555, LYS545, THR680, SER682, THR556, ASP623, THR687, SER759, ASN691, ALA688, ASP760, and ARG553.
Docking Results
Ligands in which the F at the C(6) position was replaced by I, Br, Cl, H, CH3, CF3, or CN were docked to this site. The docking results are summarized in Table 28, and the best poses are shown in Figure 20.
Table 28.
The binding mode of the FVP-RTP analogues to RdRp (the RdRp target from 6M71 [74]).

Figure 20.
The docked poses of the ligands in the binding site of RdRp (the RdRp target from 6M71 [74]). The protein backbone is represented as a cartoon; the binding cavity residues are shown as thin sticks and docked ligands are shown as sticks (FVP in pink, the CF3 analogue in yellow, and the CN analogue in green).
The ligands’ ordering according to the decreasing docking score is as follows:
F > I > CN > Br > CF3 > CH3 > Cl > H
According to the decreasing total energy of binding, the ligands can be ordered as follows:
F > I > CN > Br > CF3 > H > CH3 > Cl
The ligands’ ordering according to the decreasing binding affinity is as follows:
CF3 > Br > I > F > Cl > H > CN > CH3
The CF3 analogue binds directly to the RdRp, much weaker than the F or CN ones. This direct binding of the CF3 analogue is also much weaker than when it is incorporated into the RNA strand.
In-Depth Analysis of the Binding Mode
Comparison of the cosine distance between the binding energy profiles of the potential ligands indicates that the CF3 analogue deviates most from others in terms of overall interaction pattern.
The conformation of FVP-RTP docked directly into the allosteric pocket is very similar to its conformation in the RNA template, Figure 18.
Docking of the FVP-RTP analogues directly into the allosteric pocket leads to their very strong bindings to hydrophilic cluster residues LYS545, ARG555, and ARG553, but much weaker to conserved residues ASP623 and ASP618 and critical catalytic residues SER682, SER759, ASP760 and ASP761, as shown in Table 29 and Figure 21.
Table 29.
The binding mode of the FVP-RTP analogues to RdRp (the RdRp target from 6M71 [74]); kcal/mol units.

Figure 21.
The comparison of the binding energies of the FVR-RTP analogues to RdRp (the RdRp target from 6M71 [74]).
Changing the ligand has no effect on binding to LYS798 and ASP761, while bindings to LYS545, SER682, and ASN691 are strongly modulated by the ligand, as shown in Figure 21. Surprisingly, despite the high binding affinity for the CF3 derivative, the cosine distance to the F analogue is the largest, which is mainly due to the weak binding to SER682.
Detailed insight into the structures of protein–ligand complexes using Ligplot+ reveals the hydrophobic interactions between the candidate ligands incorporated into the RNA strand and RdRp residues, Figure S7. As can be seen from Figure S7, all ligands interact hydrophobically with the residues ARG555, VAL557, and ALA688. Additionally, FVP-RTP interacts hydrophobically with CYS622, ASP623, ASP691, and ASP760, while the CN analogue interacts with SER682, CYS622, and THR556. Furthermore, FVP-RTP forms OH⋯O hydrogen bonds with SER759 and NH⋯O with ASN691, ASP623, TYR556, ARG553, and LYS545. The CF3 analogue forms OH⋯O hydrogen bonds with SER759 and THR676, and NH⋯O bonds with Arg553 and LYS545, while the CN analogue forms OH⋯O bonds with SER759 and NH⋯O bonds with ASP760, ASP623, THR687, ARG555, and LYS545. Thus, their binding modes differ significantly.
Binding Mode Visualization
The mapping of sign[λ2(r)]ρ(r) onto the RDG(r) isosurface in Figure 22 demonstrates above-mentioned differences between the binding modes of the CF3 and CN analogues.
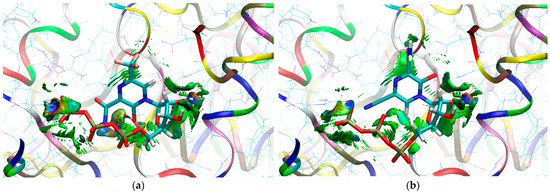
Figure 22.
The isosurfaces of RDG (isovalue 0.5a.u.) with sign(λ2)ρBCP mapped over the surface for (a) the CF3 derivative and (b) the CN derivative. (Allosteric effect).
Green areas in Figure 22 indicate non-covalent interactions. The green and flat regions reveal hydrophobic π⋯π stacking, while cyan discs indicate hydrogen bonds.
2.4. Comparison of the Productive, Non-Productive, Active State and Allosteric Site Binding Modes
Upon comparison of all protein–ligand complexes described above, it is apparent that the main channel proteins (LYS545, ARG553, and ARG555) are relatively loosely bound to the ligand in the non-productive and active states. Nevertheless, in the pre-catalytic states and in instances of direct binding, the binding is significantly stronger. The ligand binding to LYS798 firmly stabilizes the RdRp core in pre-catalytic states, but the binding is feeble in non-productive and direct binding states.
Radar plots, as shown in Figure 23, aid in quick screening, and highly bonded components are easily identified with pop-up peaks.

Figure 23.
The comparison of the binding energies of the FVR-RTP analogues to RdRp of all residues, cofactors Mg2+ and Zn2+, RNA Template, and RNA Primer; (a) pre-catalytic productive mode I; (b) pre-catalytic productive mode II; (c) non-productive mode. Pop-up peaks represent components with high binding energy.
The CN analogue exhibits lower selectivity, as it promotes comparable binding modes in pre-catalytic state I and II. Conversely, the CF3 analogue primarily reinforces pre-catalytic state I. The latter, combined with a better ADME profile, increases CF3 attractiveness in terms of selective anti-virial activity. Strong direct binding of FVP-RTP to the active site residues suggests a possible alternative mechanism of FVP action, which may explain the scattering of the results of clinical trials [25,63] or the synergistic effect observed in combined treatment against SARS-CoV-2 [64]. The replacement of F with CF3 may help to overcome this limitation.
3. Methods
3.1. ADME and Drug-Likeness Prediction
In silico ADME drug-likeness evaluation was performed using the SwissADME tool developed by the Swiss Institute of Bioinformatics [66]. Drug-likeness was tested according to Lipinski, Veber, and Egan’s rules of 5 (RO5). The Abbot Bioavailability scores were computed to predict the probability of a compound having at least 10% oral bioavailability. Lipophilicity was predicted with iLOGP, XLOGP3, WLOGP, MLOGP, and SILICOS-IT models, from which a consensus log Po/w was determined [66]. The solubility (log S) of the ligands was predicted using SILICOS-IT [66]. The mutagenicity and carcinogenicity were predicted using models implemented in ADMET2.0 [71]. Synthetic accessibility (SA) was predicted based on the assumption that the frequency of molecular fragments in “really” obtainable molecules correlates with the ease of synthesis [66].
3.2. Density Functional Theory
Quantum chemical calculations were carried out within the Density Functional Theory (DFT) approach rooted in the Kohn–Sham [93] theorem, generalized by Levy [94]. Becke’s hybrid exchange-correlation functional, B3LYP [95,96]; Møller-Plesset, MP2 [97]; Minnesota hybrid meta M062X a high-nonlocality exchange-correlation functional with double the amount of nonlocal exchange (2X) [98], and the all-electron split-valence basis set 6-311G(d,p) were used to optimize the geometry of the ligands and their triphosphate forms. Geometry optimization was performed in the internal coordinates system. Following geometry optimization, a Hessian matrix (a matrix of second derivatives of the energy with respect to atomic coordinates) was calculated for all optimized ligand structures to verify the absence of imaginary frequencies (i.e., true stationary points). The polarizable continuum model (PCM) [99] was used to model solvation effects, required for the estimation of the reactivity indices in solution. The calculations were performed using Gaussian 16 rev. C01 [100].
The theoretical reactivity indices defined by Par and Pearson [101], Gazquez [102], and Chattaraj [103] are as follows: the absolute electronegativity [χ = −(ELUMO + EHOMO)/2; eV]; absolute hardness [η = (ELUMO − EHOMO)/2; eV)]; electrophilicity index (reactivity) [ω = χ2/2η; eV]; softness [S = 1/η; 1/eV]; electro-donating power [ω−; eV]; electro-accepting power [ω+; eV]; net electrophilicity [Δω = ω+ + ω−; eV]; and maximum number of electrons transferred in a chemical reaction [ΔNmax]. These indices were evaluated at MP2/6-311G(d,p) and M062X/6-311G(d,p), and describe the effect of donating (HOMO) and accepting (LUMO) electrons in the frozen core approximation (the Koopmans theorem [104]).
3.3. Quantum Theory of Atoms in Molecules
Theoretical analysis of the topology of intermolecular interactions was performed within Bader’s Quantum Theory of Atoms in Molecules (QTAIM) [105] approach using Gaussian 16 rev. C01 [100]. The DFT wavefunction was calculated at the M062X/6-311+G(d,p) level of the theory. The so-called topological descriptors calculated at the Bond Critical Points (BCPs) include the electron density at BCP, ρ(rBCP); three eigenvalues of the principal components of Hessian matrix composed of second partial derivatives of the electron density describing curvature of the electron density according to the principal axes λ1, λ2, and λ3; and Laplacian (the sum of Hessian eigenvalues), Δρ. Some of these descriptors (λ2 and Δρ) provide information about the nature and strength of the interactions. In many molecular systems, the reduced density gradient (RDG), which is highly sensitive to the electron density distribution and its variations, helps to detect weak or specific non-covalent interactions that were uncertain or not revealed by classical QTAIM [105,106].
The reduced density gradient is defined as follows:
where ∇ρ(r) is the electron density gradient, and ρ(r) is electron density. The RDG(r) vs. sign(λ2)ρ(r) plot reveals characteristic spikes in the low-gradient and low-density regions as long as the non-covalent contacts are present in the structure. The nature of these contacts can be determined using the sign of λ2, which allows their classification as attractive (stabilizing; λ2 < 0) or repulsive (destabilizing; λ2 > 0). A spike in the low-gradient, low-density region at λ2 < 0 suggests a stabilizing interaction such as a hydrogen bonding, a smaller spike accompanied with only slightly negative λ2 indicates a weakly stabilizing interaction, and a spike associated with λ2 > 0 indicates the absence of non-covalent interactions. Thus, the reduced density gradient (RDG) isosurface analysis allows for the analysis and visualization of non-covalent repulsive and attractive interactions. The results of the RDG analysis were visualized using Visual Molecular Dynamics (VMDs) [107]. The isosurfaces have been colored using a blue–green–red scale, where blue indicates strong attraction, red indicates strong repulsive interactions, and green indicates weak van der Waals interactions.
3.4. Molecular Docking
Molecular docking is a widely used technique in drug development for the screening of novel therapeutic agents. It requires knowledge of the reliable 3D structures of the ligand and target. The structures of the candidate ligands were optimized at the M062X/6-311+G(d,p) level, while the target RdRp structures were downloaded from the Protein databank PDB database (http://www.rcsb.org/pdb, accessed on 30 September 2023). The structures of the replicating polymerase complex of SARS-CoV-2 with FVP-RTP (7CTT) [81], RVD (7UO4) [80], FVP-RMP(7AAP) [84], and FVP-RTP (7DFG) [85] were retrieved from the PDB database. Prior to docking the candidate ligands, the native ligand that co-crystallized with the RNA was removed from the structure. The docking was performed using candidate ligands incorporated into the RNA strand. The cryo-electron microscopy structure of SARS-CoV-2 full-length nsp12 in complex with cofactors nsp7 and nsp8 (6M71) [74] was used exclusively for the studies of allosteric effect. The allosteric sites were detected with software dedicated for this purpose, i.e., Allosite-Pro [89] and PASSer [90], using schemes [64,91,92]. Allosite-Pro 2016 predicts allosteric sites using Support Vector Machines (SVMs), while PASSer 2021 uses eXtreme gradient boosting (XGBoost) and graph convolutional neural networks (GCNNs). However, both methods are based on a set of topological and physicochemical parameters. The results obtained from both methods were very similar. The active site differs only slightly in shape and size but not in position.
Conversion of the files with receptor and ligand structures to the .pdbqt format was carried out using MGLTools ver. 1.5.7. Molecular docking was performed using the automated docking tools AutoDock ver. 4.2.6 [108] and AutoDock Vina ver. 1.2.3 [109]. Both are designed to predict the binding of small molecules, such as substrates or drug candidates, to a receptor. AutoDock calculations were performed in three steps: (1) the preparation of coordinate files using AutoDockTools, (2) the pre-calculation of atomic affinities using AutoGrid, and (3) the docking of ligands using AutoDock. AutoDock AutoGrid was used to pre-calculate the grids for each type of atom in the ligand, as well as grids of electrostatic and desolvation potentials. AutoDock Vina automatically performs this task. The pre-calculated grid was treated as a template. Two techniques were used for docking: Template docking based on the native ligand and docking within a defined searched space around the active site. The search space was a grid box with step sizes covering 9–15 Å centered on the active site. The Autodock was applied for the docking of the ligand to a set of grids describing the target protein. Some specific sidechains (in the nearest neighborhood of the cavity) were treated as flexible. For docking, we applied the most computationally efficient method: a Lamarckian genetic algorithm (LGA) with only a slightly modified set of parameters.
To evaluate the quality of the docking process, we performed a redocking task. The actual ligand was removed from the parental structure and redocked in its own binding site. The redocking protocol was considered successful when the root-mean-square deviation (RMSD) of pose relative to its conformation in the parental structure did not exceed 3 Å. Then, in the same way, the new ligand was docked into the rigid protein structure. The number of rotatable bonds in the ligands was calculated, and the ligands were treated as flexible bodies. Due to the high flexibility of the ligands, as many as 50 conformational poses were searched for each ligand. AutoDock was performed many times to obtain several docked poses. After docking, the best poses leading to the stabilization of the protein–ligand complex with the highest docking score were selected and further investigated. The best pose was selected on the basis of the scoring function estimating the protein–ligand binding energy. In the final post-docking step, the residues (side chains) closest to the active ligand were minimized with respect to the pose found, the ligand was energy-minimized using standard potentials, and the positions of the protons in the entire complex were optimized. The docking results were further verified (redocking task) using a Genetic Evolutionary Method for molecular DOCKing (GEMDOCK) [110], which, similar to AutoDock, uses the genetic algorithm but a different evolution operator (limited Gaussian and Cauchy mutations and introduced rotamer-based mutations). The docking score is defined as a combination of the pairwise inter- and intramolecular energy with penalty term, the energy of binding of pharmacophore summarizing (electrostatic and hydrophilic terms) for all hot-spot atoms and penalty function which limits non-active conformations. Further post-docking exploration of protein–ligand non-covalent and hydrophobic interactions was performed using PoseEdit [111], Discovery Studio Visualizer [112], LigPlot+ [82,83], QTAIM/RDG, and GEMDOCK. Several techniques were employed because detecting weak, non-covalent interactions can be challenging. The GEMDOCK docking score was calculated as a sum of the intramolecular and intermolecular interactions corrected by a penalty value keeping the ligand inside the box (ligand–protein term), the pharmacophore-based interaction between the ligand and protein (binding site term) and penalty value for the electrostatic and hydrophilic preferences of the ligand (penalty term). The energy of the intramolecular interactions was described using the sum of the piecewise linear potential (PLP) term, which describes steric (van der Waals), hydrogen bonding interactions and the Coulomb electrostatic term. The energy of intramolecular interactions was estimated using the Gehlhaar model [113] with original parameterization, which employs piecewise linear potentials and a steric term. The binding affinity was estimated using a multiple linear regression model. The final 3D visualization of the binding modes was made using VMD [107].
3.5. Comparison of the Differences in the Binding Modes—Mathematical Metrics
A similarity of the molecules was calculated using the Tanimoto distance, defined as the ratio of the intersection of A and B to the union of A and B:
where A and B are sets characterizing molecular structures.
A similarity of the binding modes was calculated using a few metrics defined below:
- Euclidian distance ;
- Manhattan distance ;
- the additive formula ;
- cosine distance ;
- Tanimoto distance ;
where pi and qi are the binding interactions in each structure, P = {pi}, and Q = {qi}.
The plots were generated using OriginLab 2024 (OriginLab corporation, Northampton, MA, USA).
4. Conclusions
One of the primary objectives of small molecule drug discovery is to find innovative chemical compounds that possess desired properties. For this purpose, new global quantum chemical indices describing relative reactivity and new quantitative methods for the estimation and visualization of the differences in the binding modes of individual analogues with RdRp have been developed and applied, allowing the candidate ligands to be conveniently screened. The use of new relative reactivity indices can aid in the preliminary screening of candidate ligands. Euclidean, Manhattan, and cosine distances are helpful in quantifying the differences in binding modes between native and candidate ligands. Isosurfaces and radial plots can be used to visualize these differences, which is helpful in recognizing their location. This combined approach is particularly useful when comparing modifications or screening candidate drugs.
Quantitative analysis of the binding modes provided important clues to design high-affinity RdRp ligands. The proposed modification of the FVP structure seems to improve its binding ability to the SARS-CoV-2 RdRp and enhance productive binding mode.
In particular, two of the candidate ligands (the trifluoro- and cyano- derivatives) bind very strongly to both the RNA template and RdRp, so they may constitute a very good alternative to FVP. The CN analogue, like FVP, shows low and negative lipophilicity, while the CF3 analogue shows high and positive lipophilicity, which is more optimal for drugs. Replacing –F with –CF3, which has a strong electron-withdrawing nature, poor polarizability, and a broad hydrophobic domain, results in an increase in the hydrophobicity (lipophilicity) of the ligand and thus modifies the hydrophobic targets. Both CN and CF3 analogues seem promising because, as highly electrophilic reagents, they should have low substrate selectivity and inhibit a wide range of RdRps, not only SARS-CoV-2. Moreover, their relative electro-donating and electro-accepting powers are high; thus, both should act more efficiently than FVP-RTP. The CF3 analogue appears to be a better choice because it does not affect the preferred arrangement of the amide and triphosphate groups required for the effective binding to RNA primer and Mg2+, respectively. However, the CN analogue has a disadvantage because it is conformationally more labile. The CF3 analogue incorporated into the RNA strand binds to the RNA template and RNA primer more strongly than FVP, even in monophosphate form. Moreover, it shows the strongest binding to LYS798 among the FVP-RMP analogues and forms a strong binding to the cofactor. On the other hand, the CF3 analogue binds directly to RdRp much more weakly than the F or CN derivatives. This direct binding of the CF3 analogue is also much weaker than when it is incorporated into the RNA strand.
Upon comparison of all protein–ligand complexes described above, it is apparent that the main channel proteins (LYS545, ARG553, and ARG555) are relatively loosely bound to the ligand in the non-productive and active states. Nevertheless, in the pre-catalytic states and in instances of direct binding, the binding is significantly stronger. The ligand binding to LYS 798 firmly stabilizes the RdRp core in pre-catalytic states, but the binding is feeble in non-productive and direct binding states. The CN analogue exhibits lower selectivity, as it promotes comparable binding modes in pre-catalytic state I and II. Conversely, the CF3 analogue primarily reinforces pre-catalytic state I. The latter combined with a better ADME profile, increases CF3 attractiveness in terms of selective anti-virial activity. Replacing F with CF3 may help to overcome the limitations caused by the alternative mechanism of binding responsible for the scattering of the results of clinical trials or the synergistic effect observed in combined treatment against SARS-CoV-2. Increasing the number of acceptors seems to be a good step toward greater efficiency of FVP analogues. The docking results suggest that among the analogues studied, the CF3 derivative should bind most strongly to the cofactor Mg2+, the RNA template, and the RNA primer and therefore may be a very good alternative to FVP-RTP and RVD. Additionally, the incorporation of the CF3 group is expected to considerably reduce the likelihood of the formation of an alternate metabolite, in which the OH group is attached to the C(5) position due to the steric hindrance.
Our method for quantifying differences in binding mode holds promise for guiding future research on new anti-SARS-CoV-2 agents. If sufficient effectiveness in inhibiting viral replication in cell culture is established, they could be explored as potential drugs against COVID-19.
Supplementary Materials
The following supporting information can be downloaded at https://www.mdpi.com/article/10.3390/molecules29020441/s1. Figure S1. The comparison of the total binding energy of FVR-RTP analogues to RdRp, RNA primer, RNA template, and cofactor (the RdRp target from 7CTT [81]); Figure S2. A LigPlot+ schematic 2D representation of the protein–ligand interactions (the RdRp target from 7CTT [81]). The hydrogen bonds are shown as green dashed lines, and residues involved in hydrophobic contacts are shown as red arcs and labeled; Figure S3. The comparison of the total binding affinity of FVR-RTP analogues with RdRp, RNA primer, RNA template, and cofactor (the RdRp target from 7UO4); Figure S4. A LigPlot+ schematic 2D representation of the protein–ligand interactions (the RdRp target from 7UO4 [80]). The hydrogen bonds are shown as green dashed lines, and residues involved in hydrophobic contacts are shown as red arcs and labeled; Figure S5. A LigPlot+ schematic 2D representation of the protein–ligand interactions (target from 7AAP [84]). The hydrogen bonds are shown as green dashed lines, and residues involved in hydrophobic contacts are shown as red arcs and labeled.; Figure S7. A LigPlot+ schematic 2D representation of the protein–ligand interactions (the RdRp target from 6M71 [74]). The hydrogen bonds are shown as green dashed lines, and residues involved in hydrophobic contacts are shown as red arcs and labeled.
Author Contributions
Conceptualization, J.N.L.; methodology, J.N.L.; investigation, quantum chemical calculations and modeling, J.N.L. and M.L.; visualizations, M.L.; writing—original draft preparation, J.N.L.; writing—review and editing, M.L. and J.N.L. All authors have read and agreed to the published version of the manuscript.
Funding
This research received no external funding.
Institutional Review Board Statement
Not applicable.
Informed Consent Statement
Not applicable.
Data Availability Statement
The data presented in this study are available in article and Supplementary Materials.
Acknowledgments
Allotment of computer time from Wrocław Supercomputing and Networking Center (WCSS) is gratefully acknowledged.
Conflicts of Interest
The authors declare no conflicts of interest.
Abbreviations
| Abbreviation | Meaning |
| ADME | Absorption, Distribution, Metabolism, and Excretion |
| BBB | blood–brain barrier |
| CYP | cytochrome P450 |
| DFT | Density Functional Theory |
| DILI | drug-induced liver injury |
| DOI | degree of interaction |
| FVP | favipiravir |
| GI | gastrointestinal absorption |
| HGPRT | hypoxanthinguanine phosphoribosyl transferase |
| H-HT | hepatotoxicity |
| MD | Molecular Docking |
| MOL | Molnupiravir |
| NMVr | Nirmatrelvir |
| PAINS | Pan Assay of Interference Structures |
| PCM | polarizable continuum model |
| P-gp | permeability glycoprotein |
| QSPR | Quantum Quantitative Structure–Property Relationship |
| QTAIM | Quantum Theory of Atoms in Molecules |
| RDG | Reduced Density Gradient |
| RdRp | RNA-dependent RNA polymerase |
| RDP | ribonucleoside-5′-diphosphate |
| RMP | ribonucleoside-5′-monophosphate |
| RTP | ribonucleoside-5′-triphosphate |
| RTV | Ritonavir |
| RNA | ribonucleic acid |
| RVD | Remdesivir |
| RBV | Ribavirin |
| SAS | synthetic accessibility score |
| ssRNA | single-stranded RNA viruses |
| TPSA | topological polar surface area |
References
- Perlman, S. Another Decade, Another Coronavirus. N. Engl. J. Med. 2020, 382, 760–762. [Google Scholar] [CrossRef]
- Zhang, T.; Wu, Q.; Zhang, Z. Probable Pangolin Origin of SARS-CoV-2 Associated with the COVID-19 Outbreak. Curr. Biol. 2020, 30, 1578. [Google Scholar] [CrossRef]
- WHO. Tracking SARS-CoV-2 Variants. Available online: https://www.who.int/activities/tracking-SARS-CoV-2-variants (accessed on 27 September 2023).
- Taubenberger, J.K.; Morens, D.M. 1918 Influenza: The Mother of All Pandemics. Emerg. Infect. Dis. 2006, 12, 15–22. [Google Scholar] [CrossRef] [PubMed]
- Hartman, A.L.; Zadeh, V.R.; Afowowe, T.O.; Abe, H.; Urata, S.; Yasuda, J. Potential and action mechanism of favipiravir as an antiviral against Junin virus. PLoS Pathog. 2022, 18, e1010689. [Google Scholar] [CrossRef]
- Konda, M.; Dodda, B.; Konala, V.M.; Naramala, S.; Adapa, S. Potential Zoonotic Origins of SARS-CoV-2 and Insights for Preventing Future Pandemics Through One Health Approach. Cureus 2020, 12, e8932. [Google Scholar] [CrossRef] [PubMed]
- Harris, A.; Sha, B.; Luo, M. Structural similarities between influenza virus matrix protein M1 and human immunodeficiency virus matrix and capsid proteins: An evolutionary link between negative-stranded RNA viruses and retroviruses. J. Gen. Virol. 1999, 80, 863–869. [Google Scholar] [CrossRef][Green Version]
- Bar-On, Y.M.; Flamholz, A.; Phillips, R.; Milo, R. SARS-CoV-2 (COVID-19) by the numbers. eLife 2020, 9, e57309. [Google Scholar] [CrossRef] [PubMed]
- Kosik, I.; Yewdell, J.W. Influenza Hemagglutinin and Neuraminidase: Yin-Yang Proteins Coevolving to Thwart Immunity. Viruses 2019, 11, 346. [Google Scholar] [CrossRef]
- Letko, M.; Marzi, A.; Munster, V. Functional assessment of cell entry and receptor usage for SARS-CoV-2 and other lineage B betacoronaviruses. Nat. Microbiol. 2020, 5, 562–569. [Google Scholar] [CrossRef]
- Fantini, J.; Chahinian, H.; Yahi, N. Convergent Evolution Dynamics of SARS-CoV-2 and HIV Surface Envelope Glycoproteins Driven by Host Cell Surface Receptors and Lipid Rafts: Lessons for the Future. Int. J. Mol. Sci. 2023, 24, 1923. [Google Scholar] [CrossRef]
- Robson, F.; Khan, K.S.; Le, T.K.; Paris, C.; Demirbag, S.; Barfuss, P.; Rocchi, P.; Ng, W.-L. Coronavirus RNA Proofreading: Molecular Basis and Therapeutic Targeting. Mol. Cell 2020, 79, 710–727. [Google Scholar] [CrossRef]
- Kuhn, J.H.; Becker, S.; Ebihara, H.; Geisbert, T.W.; Johnson, K.M.; Kawaoka, Y.; Lipkin, W.I.; Negredo, A.I.; Netesov, S.V.; Nichol, S.T.; et al. Proposal for a revised taxonomy of the family Filoviridae: Classification, names of taxa and viruses, and virus abbreviations. Arch. Virol. 2010, 155, 2083–2103. [Google Scholar] [CrossRef] [PubMed]
- Cheung, C.L.; Rayner, J.M.; Smith, G.J.D.; Wang, P.; Naipospos, T.S.P.; Zhang, J.; Yuen, K.Y.; Webster, R.G.; Peiris, J.S.M.; Guan, Y.; et al. Distribution of Amantadine-Resistant H5N1 Avian Influenza Variants in Asia. J. Infect. Dis. 2006, 193, 1626–1629. [Google Scholar] [CrossRef]
- Deyde, V.M.; Xu, X.; Bright, R.A.; Shaw, M.; Smith, C.B.; Zhang, Y.; Shu, Y.; Gubareva, L.V.; Cox, N.J.; Klimov, A.I. Surveillance of Resistance to Adamantanes among Influenza A(H3N2) and A(H1N1) Viruses Isolated Worldwide. J. Infect. Dis. 2007, 196, 249–257. [Google Scholar] [CrossRef] [PubMed]
- Nelson, M.I.; Simonsen, L.; Viboud, C.; Miller, M.A.; Holmes, E.C. The origin and global emergence of adamantane resistant A/H3N2 influenza viruses. Virology 2009, 388, 270–278. [Google Scholar] [CrossRef] [PubMed]
- Hata, M.; Tanaka, S.; Yasui, Y.; Fujiwara, N.; Kobayashi, S.; Minagawa, H. Rapid Genotypic Assay for Detection of Oseltamivir-Resistant Influenza A (H1N1) Viruses. J. Clin. Microbiol. 2010, 48, 1983–1984. [Google Scholar] [CrossRef] [PubMed][Green Version]
- Earhart, K.C.; Elsayed, N.M.; Saad, M.D.; Gubareva, L.V.; Nayel, A.; Deyde, V.M.; Abdelsattar, A.; Abdelghani, A.S.; Boynton, B.R.; Mansour, M.M.; et al. Oseltamivir resistance mutation N294S in human influenza A(H5N1) virus in Egypt. J. Infect. Public Health 2009, 2, 74–80. [Google Scholar] [CrossRef]
- Meijer, A.; Lackenby, A.; Hungnes, O.; Lina, B.; van der Werf, S.; Schweiger, B.; Opp, M.; Paget, J.; van de Kassteele, J.; Hay, A.; et al. Oseltamivir-Resistant Influenza Virus A (H1N1), Europe, 2007–2008 Season. Emerg. Infect. Dis. 2009, 15, 552–560. [Google Scholar] [CrossRef]
- Report on the Deliberation Results March 4, 2014 Evaluation and Licensing Division, Pharmaceutical and Food Safety Bureau Ministry of Health, Labour and Welfare, Pharmaceuticals and Medical Devices Agency. Available online: https://www.pmda.go.jp/files/000210319.pdf (accessed on 27 September 2023).
- Hayden, F.G.; Lenk, R.P.; Stonis, L.; Oldham-Creamer, C.; Kang, L.L.; Epstein, C. Favipiravir Treatment of Uncomplicated Influenza in Adults: Results of Two Phase 3, Randomized, Double-Blind, Placebo-Controlled Trials. J. Infect. Dis. 2022, 226, 1790–1799. [Google Scholar] [CrossRef]
- Takashita, E.; Ejima, M.; Ogawa, R.; Fujisaki, S.; Neumann, G.; Furuta, Y.; Kawaoka, Y.; Tashiro, M.; Odagiri, T. Antiviral susceptibility of influenza viruses isolated from patients pre- and post-administration of favipiravir. Antivir. Res. 2016, 132, 170–177. [Google Scholar] [CrossRef]
- Jordan, P.C.; Stevens, S.K.; Deval, J. Nucleosides for the treatment of respiratory RNA virus infections. Antivir. Chem. Chemother. 2018, 26, 2040206618764483. [Google Scholar] [CrossRef] [PubMed]
- Watanabe, M. The COVID-19 Pandemic in Japan. Surg. Today 2020, 50, 787–793. [Google Scholar] [CrossRef] [PubMed]
- Kumar, R.; Gupta, N.; Kodan, P.; Mittal, A.; Soneja, M.; Wig, N. Battling COVID-19: Using old weapons for a new enemy. Trop. Dis. Travel Med. Vaccines 2020, 6, 6. [Google Scholar] [CrossRef] [PubMed]
- Şimşek Yavuz, S.; ÜNal, S. Antiviral treatment of COVID-19. Turk. J. Med. Sci. 2020, 50, 611–619. [Google Scholar] [CrossRef]
- Delang, L.; Abdelnabi, R.; Neyts, J. Favipiravir as a potential countermeasure against neglected and emerging RNA viruses. Antivir. Res. 2018, 153, 85–94. [Google Scholar] [CrossRef]
- Furuta, Y.; Komeno, T.; Nakamura, T. Favipiravir (T-705), a broad spectrum inhibitor of viral RNA polymerase. Proc. Jpn. Acad. Ser. B 2017, 93, 449–463. [Google Scholar] [CrossRef]
- Bai, C.-Q.; Mu, J.-S.; Kargbo, D.; Song, Y.-B.; Niu, W.-K.; Nie, W.-M.; Kanu, A.; Liu, W.-W.; Wang, Y.-P.; Dafae, F.; et al. Clinical and Virological Characteristics of Ebola Virus Disease Patients Treated With Favipiravir (T-705)—Sierra Leone, 2014. Clin. Infect. Dis. 2016, 63, 1288–1294. [Google Scholar] [CrossRef]
- Rosenke, K.; Feldmann, H.; Westover, J.B.; Hanley, P.W.; Martellaro, C.; Feldmann, F.; Saturday, G.; Lovaglio, J.; Scott, D.P.; Furuta, Y.; et al. Use of Favipiravir to Treat Lassa Virus Infection in Macaques. Emerg. Infect. Dis. 2018, 24, 1696–1699. [Google Scholar] [CrossRef]
- Escribano-Romero, E.; Jiménez de Oya, N.; Domingo, E.; Saiz, J.C. Extinction of West Nile Virus by Favipiravir through Lethal Mutagenesis. Antimicrob. Agents Chemother. 2017, 61, 10–1128. [Google Scholar] [CrossRef]
- Marlin, R.; Desjardins, D.; Contreras, V.; Lingas, G.; Solas, C.; Roques, P.; Naninck, T.; Pascal, Q.; Behillil, S.; Maisonnasse, P.; et al. Antiviral efficacy of favipiravir against Zika and SARS-CoV-2 viruses in non-human primates. Nat. Commun. 2022, 13, 5108. [Google Scholar] [CrossRef]
- Williams, M.; Caroline, A.L.; Powell, D.S.; Bethel, L.M.; Oury, T.D.; Reed, D.S.; Hartman, A.L. Broad Spectrum Antiviral Activity of Favipiravir (T-705): Protection from Highly Lethal Inhalational Rift Valley Fever. PLoS Negl. Trop. Dis. 2014, 8, e2790. [Google Scholar] [CrossRef]
- Julander, J.G.; Shafer, K.; Smee, D.F.; Morrey, J.D.; Furuta, Y. Activity of T-705 in a Hamster Model of Yellow Fever Virus Infection in Comparison with That of a Chemically Related Compound, T-1106. Antimicrob. Agents Chemother. 2009, 53, 202–209. [Google Scholar] [CrossRef]
- Singh, S.K.; Oestereich, L.; Rieger, T.; Neumann, M.; Bernreuther, C.; Lehmann, M.; Krasemann, S.; Wurr, S.; Emmerich, P.; de Lamballerie, X.; et al. Evaluation of Antiviral Efficacy of Ribavirin, Arbidol, and T-705 (Favipiravir) in a Mouse Model for Crimean-Congo Hemorrhagic Fever. PLoS Negl. Trop. Dis. 2014, 8, e2804. [Google Scholar] [CrossRef]
- Bologheanu, R.; Schubert, L.; Thurnher, M.; Schiefer, J.; Santonja, I.; Holzmann, H.; Oesterreicher, Z.; Tobudic, S.; Winkler, S.; Faybik, P.; et al. Unexpected complete recovery of a patient with severe tick-borne encephalitis treated with favipiravir. Antivir. Res. 2020, 184, 104952. [Google Scholar] [CrossRef]
- Banyard, A.C.; Mansfield, K.L.; Wu, G.; Selden, D.; Thorne, L.; Birch, C.; Koraka, P.; Osterhaus, A.D.M.E.; Fooks, A.R. Re-evaluating the effect of Favipiravir treatment on rabies virus infection. Vaccine 2019, 37, 4686–4693. [Google Scholar] [CrossRef] [PubMed]
- Veliziotis, I.; Roman, A.; Martiny, D.; Schuldt, G.; Claus, M.; Dauby, N.; Van den Wijngaert, S.; Martin, C.; Nasreddine, R.; Perandones, C.; et al. Clinical Management of Argentine Hemorrhagic Fever using Ribavirin and Favipiravir, Belgium, 2020. Emerg. Infect. Dis. 2020, 26, 1562–1566. [Google Scholar] [CrossRef] [PubMed]
- Agrawal, U.; Raju, R.; Udwadia, Z.F. Favipiravir: A new and emerging antiviral option in COVID-19. Med. J. Armed Forces India 2020, 76, 370–376. [Google Scholar] [CrossRef] [PubMed]
- Joshi, S.; Parkar, J.; Ansari, A.; Vora, A.; Talwar, D.; Tiwaskar, M.; Patil, S.; Barkate, H. Role of favipiravir in the treatment of COVID-19. Int. J. Infect. Dis. 2021, 102, 501–508. [Google Scholar] [CrossRef]
- Mallhi, T.H.; Fathi, M.; Vakili, K.; Sayehmiri, F.; Mohamadkhani, A.; Hajiesmaeili, M.; Rezaei-Tavirani, M.; Eilami, O. The prognostic value of comorbidity for the severity of COVID-19: A systematic review and meta-analysis study. PLoS ONE 2021, 16, e0246190. [Google Scholar] [CrossRef]
- Wang, Y.; Li, P.; Rajpoot, S.; Saqib, U.; Yu, P.; Li, Y.; Li, Y.; Ma, Z.; Baig, M.S.; Pan, Q. Comparative assessment of favipiravir and remdesivir against human coronavirus NL63 in molecular docking and cell culture models. Sci. Rep. 2021, 11, 23465. [Google Scholar] [CrossRef]
- Gunaydin-Akyildiz, A.; Aksoy, N.; Boran, T.; Ilhan, E.N.; Ozhan, G. Favipiravir induces oxidative stress and genotoxicity in cardiac and skin cells. Toxicol. Lett. 2022, 371, 9–16. [Google Scholar] [CrossRef]
- Kumar, P.; Kulkarni, A.; Sharma, M.; Rao, P.N.; Reddy, D.N. Favipiravir-induced Liver Injury in Patients with Coronavirus Disease 2019. J. Clin. Transl. Hepatol. 2021, 9, 276. [Google Scholar] [CrossRef] [PubMed]
- Madelain, V.; Mentré, F.; Baize, S.; Anglaret, X.; Laouénan, C.; Oestereich, L.; Nguyen, T.H.T.; Malvy, D.; Piorkowski, G.; Graw, F.; et al. Modeling Favipiravir Antiviral Efficacy Against Emerging Viruses: From Animal Studies to Clinical Trials. CPT Pharmacomet. Syst. Pharmacol. 2020, 9, 258–271. [Google Scholar] [CrossRef]
- Tırmıkçıoğlu, Z. Favipiravir exposure and pregnancy outcome of COVID-19 patients. Eur. J. Obstet. Gynecol. Reprod. Biol. 2022, 268, 110–115. [Google Scholar] [CrossRef] [PubMed]
- Ertem, O.; Guner, O.; Incir, C.; Kalkan, S.; Gelal, A. The outcomes of favipiravir exposure in pregnancy: A case series. Arch. Gynecol. Obstet. 2022, 307, 1385–1395. [Google Scholar] [CrossRef] [PubMed]
- Nagata, T.; Lefor, A.K.; Hasegawa, M.; Ishii, M. Favipiravir: A New Medication for the Ebola Virus Disease Pandemic. Disaster Med. Public Health Prep. 2014, 9, 79–81. [Google Scholar] [CrossRef] [PubMed]
- Casalini, G.; Giacomelli, A.; Antinori, S. Liver tests abnormalities with licensed antiviral drugs for COVID-19: A narrative review. Expert Opin. Drug Saf. 2023, 21, 1483–1494. [Google Scholar] [CrossRef] [PubMed]
- Dufour, I.; Devresse, A.; Scohy, A.; Briquet, C.; Georgery, H.; Delaey, P.; Greef, J.D.; Goffin, E.; Labriola, L. Safety and efficiency of molnupiravir for COVID-19 patients with advanced chronic kidney disease. Kidney Res. Clin. Pract. 2023, 42, 275–278. [Google Scholar] [CrossRef]
- Zhou, S.; Hill, C.S.; Sarkar, S.; Tse, L.V.; Woodburn, B.M.D.; Schinazi, R.F.; Sheahan, T.P.; Baric, R.S.; Heise, M.T.; Swanstrom, R. β-d-N4-hydroxycytidine Inhibits SARS-CoV-2 Through Lethal Mutagenesis But Is Also Mutagenic To Mammalian Cells. J. Infect. Dis. 2021, 224, 415–419. [Google Scholar] [CrossRef]
- Smee, D.F.; Hurst, B.L.; Wong, M.-H.; Bailey, K.W.; Tarbet, E.B.; Morrey, J.D.; Furuta, Y. Effects of the Combination of Favipiravir (T-705) and Oseltamivir on Influenza A Virus Infections in Mice. Antimicrob. Agents Chemother. 2010, 54, 126–133. [Google Scholar] [CrossRef]
- Smee, D.F.; Tarbet, E.B.; Furuta, Y.; Morrey, J.D.; Barnard, D.L. Synergistic combinations of favipiravir and oseltamivir against wild-type pandemic and oseltamivir-resistant influenza A virus infections in mice. Future Virol. 2013, 8, 1085–1094. [Google Scholar] [CrossRef]
- Sarojvisut, P.; Apisarnthanarak, A.; Jantarathaneewat, K.; Sathitakorn, O.; Pienthong, T.; Mingmalairak, C.; Warren, D.K.; Weber, D.J. An Open Label Randomized Controlled Trial of Ivermectin Plus Favipiravir-Based Standard of Care versus Favipiravir-Based Standard of Care for Treatment of Moderate COVID-19 in Thailand. Infect. Chemother. 2023, 55, 50. [Google Scholar] [CrossRef]
- Oestereich, L.; Rieger, T.; Lüdtke, A.; Ruibal, P.; Wurr, S.; Pallasch, E.; Bockholt, S.; Krasemann, S.; Muñoz-Fontela, C.; Günther, S. Efficacy of Favipiravir Alone and in Combination With Ribavirin in a Lethal, Immunocompetent Mouse Model of Lassa Fever. J. Infect. Dis. 2016, 213, 934–938. [Google Scholar] [CrossRef] [PubMed]
- Zhao, H.; Zhu, Q.; Zhang, C.; Li, J.; Wei, M.; Qin, Y.; Chen, G.; Wang, K.; Yu, J.; Wu, Z.; et al. Tocilizumab combined with favipiravir in the treatment of COVID-19: A multicenter trial in a small sample size. Biomed. Pharmacother. 2021, 133, 110825. [Google Scholar] [CrossRef] [PubMed]
- Abdel-Halim, H.; Hajar, M.; Hasouneh, L.; Abdelmalek, S.M.A. Identification of Drug Combination Therapies for SARS-CoV-2: A Molecular Dynamics Simulations Approach. Drug Des. Dev. Ther. 2022, 16, 2995–3013. [Google Scholar] [CrossRef]
- Rubin, D.; Chan-Tack, K.; Farley, J.; Sherwat, A. FDA Approval of Remdesivir—A Step in the Right Direction. N. Engl. J. Med. 2020, 383, 2598–2600. [Google Scholar] [CrossRef] [PubMed]
- Gérard, A.O.; Laurain, A.; Fresse, A.; Parassol, N.; Muzzone, M.; Rocher, F.; Esnault, V.L.M.; Drici, M.D. Remdesivir and Acute Renal Failure: A Potential Safety Signal From Disproportionality Analysis of the WHO Safety Database. Clin. Pharmacol. Ther. 2021, 109, 1021–1024. [Google Scholar] [CrossRef]
- Stevens, L.J.; Pruijssers, A.J.; Lee, H.W.; Gordon, C.J.; Tchesnokov, E.P.; Gribble, J.; George, A.S.; Hughes, T.M.; Lu, X.; Li, J.; et al. Mutations in the SARS-CoV-2 RNA-dependent RNA polymerase confer resistance to remdesivir by distinct mechanisms. Sci. Transl. Med. 2022, 14, eabo0718. [Google Scholar] [CrossRef]
- Sangawa, H.; Komeno, T.; Nishikawa, H.; Yoshida, A.; Takahashi, K.; Nomura, N.; Furuta, Y. Mechanism of Action of T-705 Ribosyl Triphosphate against Influenza Virus RNA Polymerase. Antimicrob. Agents Chemother. 2013, 57, 5202–5208. [Google Scholar] [CrossRef]
- Baranovich, T.; Wong, S.-S.; Armstrong, J.; Marjuki, H.; Webby, R.J.; Webster, R.G.; Govorkova, E.A. T-705 (Favipiravir) Induces Lethal Mutagenesis in Influenza A H1N1 Viruses In Vitro. J. Virol. 2013, 87, 3741–3751. [Google Scholar] [CrossRef]
- Naesens, L.; Guddat, L.W.; Keough, D.T.; van Kuilenburg, A.B.P.; Meijer, J.; Vande Voorde, J.; Balzarini, J. Role of Human Hypoxanthine Guanine Phosphoribosyltransferase in Activation of the Antiviral Agent T-705 (Favipiravir). Mol. Pharmacol. 2013, 84, 615–629. [Google Scholar] [CrossRef] [PubMed]
- Latosińska, J.N.; Latosińska, M.; Seliger, J.; Žagar, V.; Apih, T.; Grieb, P. Elucidating the Role of Noncovalent Interactions in Favipiravir, a Drug Active against Various Human RNA Viruses; a 1H-14N NQDR/Periodic DFT/QTAIM/RDS/3D Hirshfeld Surfaces Combined Study. Molecules 2023, 28, 3308. [Google Scholar] [CrossRef] [PubMed]
- Etter, M.C. Encoding and decoding hydrogen-bond patterns of organic compounds. Acc. Chem. Res. 2002, 23, 120–126. [Google Scholar] [CrossRef]
- Daina, A.; Michielin, O.; Zoete, V. SwissADME: A free web tool to evaluate pharmacokinetics, drug-likeness and medicinal chemistry friendliness of small molecules. Sci. Rep. 2017, 7, 42717. [Google Scholar] [CrossRef]
- Jia, H.; Häring, A.P.; Berger, F.; Zhang, L.; Ritter, T. Trifluoromethyl Thianthrenium Triflate: A Readily Available Trifluoromethylating Reagent with Formal CF3+, CF3•, and CF3− Reactivity. J. Am. Chem. Soc. 2021, 143, 7623–7628. [Google Scholar] [CrossRef]
- Mucker, E.M.; Goff, A.J.; Shamblin, J.D.; Grosenbach, D.W.; Damon, I.K.; Mehal, J.M.; Holman, R.C.; Carroll, D.; Gallardo, N.; Olson, V.A.; et al. Efficacy of Tecovirimat (ST-246) in Nonhuman Primates Infected with Variola Virus (Smallpox). Antimicrob. Agents Chemother. 2013, 57, 6246–6253. [Google Scholar] [CrossRef]
- Wang, Z.; Yu, Z.; Kang, D.; Zhang, J.; Tian, Y.; Daelemans, D.; De Clercq, E.; Pannecouque, C.; Zhan, P.; Liu, X. Design, synthesis and biological evaluation of novel acetamide-substituted doravirine and its prodrugs as potent HIV-1 NNRTIs. Bioorg. Med. Chem. 2019, 27, 447–456. [Google Scholar] [CrossRef] [PubMed]
- Turner, S.R.; Strohbach, J.W.; Tommasi, R.A.; Aristoff, P.A.; Johnson, P.D.; Skulnick, H.I.; Dolak, L.A.; Seest, E.P.; Tomich, P.K.; Bohanon, M.J.; et al. Tipranavir (PNU-140690): A Potent, Orally Bioavailable Nonpeptidic HIV Protease Inhibitor of the 5,6-Dihydro-4-hydroxy-2-pyrone Sulfonamide Class. J. Med. Chem. 1998, 41, 3467–3476. [Google Scholar] [CrossRef]
- Xiong, G.; Wu, Z.; Yi, J.; Fu, L.; Yang, Z.; Hsieh, C.; Yin, M.; Zeng, X.; Wu, C.; Lu, A.; et al. ADMETlab 2.0: An integrated online platform for accurate and comprehensive predictions of ADMET properties. Nucleic Acids Res. 2021, 49, W5–W14. [Google Scholar] [CrossRef]
- Gao, Z.-G.; Jacobson, K.A. Emerging adenosine receptor agonists. Expert Opin. Emerg. Drugs 2007, 12, 479–492. [Google Scholar] [CrossRef]
- Xu, X. Molecular model of SARS coronavirus polymerase: Implications for biochemical functions and drug design. Nucleic Acids Res. 2003, 31, 7117–7130. [Google Scholar] [CrossRef] [PubMed]
- Gao, Y.; Yan, L.; Huang, Y.; Liu, F.; Zhao, Y.; Cao, L.; Wang, T.; Sun, Q.; Ming, Z.; Zhang, L.; et al. Structure of the RNA-dependent RNA polymerase from COVID-19 virus. Science 2020, 368, 779–782. [Google Scholar] [CrossRef] [PubMed]
- Tao, Y.; Farsetta, D.L.; Nibert, M.L.; Harrison, S.C. RNA Synthesis in a Cage—Structural Studies of Reovirus Polymerase λ3. Cell 2002, 111, 733–745. [Google Scholar] [CrossRef] [PubMed]
- Butcher, S.J.; Grimes, J.M.; Makeyev, E.V.; Bamford, D.H.; Stuart, D.I. A mechanism for initiating RNA-dependent RNA polymerization. Nature 2001, 410, 235–240. [Google Scholar] [CrossRef]
- Jacobo-Molina, A.; Ding, J.; Nanni, R.G.; Clark, A.D.; Lu, X.; Tantillo, C.; Williams, R.L.; Kamer, G.; Ferris, A.L.; Clark, P. Crystal structure of human immunodeficiency virus type 1 reverse transcriptase complexed with double-stranded DNA at 3.0 A resolution shows bent DNA. Proc. Natl. Acad. Sci. USA 1993, 90, 6320–6324. [Google Scholar] [CrossRef]
- Latosińska, J.N.; Latosińska, M.; Orzeszko, A.; Maurin, J.K. Synthesis and Crystal Structure of Adamantylated 4,5,6,7-Tetrahalogeno-1H-benzimidazoles Novel Multi-Target Ligands (Potential CK2, M2 and SARS-CoV-2 Inhibitors); X-ray/DFT/QTAIM/Hirshfeld Surfaces/Molecular Docking Study. Molecules 2022, 28, 147. [Google Scholar] [CrossRef]
- Latosińska, J.N.; Latosińska, M.; Maurin, J.K.; Orzeszko, A.; Kazimierczuk, Z. Quantum-Chemical Insight into Structure-Reactivity Relationship in 4,5,6,7-Tetrahalogeno-1H-benzimidazoles: A Combined X-ray, DSC, DFT/QTAIM, Hirshfeld Surface-Based, and Molecular Docking Approach. J. Phys. Chem. A 2014, 118, 2089–2106. [Google Scholar] [CrossRef]
- Malone, B.F.; Perry, J.K.; Olinares, P.D.B.; Lee, H.W.; Chen, J.; Appleby, T.C.; Feng, J.Y.; Bilello, J.P.; Ng, H.; Sotiris, J.; et al. Structural basis for substrate selection by the SARS-CoV-2 replicase. Nature 2023, 614, 781–787. [Google Scholar] [CrossRef]
- Peng, Q.; Peng, R.; Yuan, B.; Wang, M.; Zhao, J.; Fu, L.; Qi, J.; Shi, Y. Structural Basis of SARS-CoV-2 Polymerase Inhibition by Favipiravir. Innovation 2021, 2, 100080. [Google Scholar] [CrossRef]
- Wallace, A.C.; Laskowski, R.A.; Thornton, J.M. LIGPLOT: A program to generate schematic diagrams of protein-ligand interactions. Protein Eng. Des. Sel. 1995, 8, 127–134. [Google Scholar] [CrossRef]
- Laskowski, R.A.; Swindells, M.B. LigPlot+: Multiple Ligand–Protein Interaction Diagrams for Drug Discovery. J. Chem. Inf. Model. 2011, 51, 2778–2786. [Google Scholar] [CrossRef] [PubMed]
- Naydenova, K.; Muir, K.W.; Wu, L.-F.; Zhang, Z.; Coscia, F.; Peet, M.J.; Castro-Hartmann, P.; Qian, P.; Sader, K.; Dent, K.; et al. Structure of the SARS-CoV-2 RNA-dependent RNA polymerase in the presence of favipiravir-RTP. Proc. Natl. Acad. Sci. USA 2021, 118, e2021946118. [Google Scholar] [CrossRef] [PubMed]
- Li, Z.; Zhou, Z.; Yu, X. Structure of COVID-19 RNA-Dependent RNA Polymerase Bound to Favipiravir; RCSB Protein Data Bank: Piscataway, NJ, USA, 2021. [Google Scholar] [CrossRef]
- Golan, Y.; Campos, J.A.S.; Woolson, R.; Cilla, D.; Hanabergh, R.; Gonzales-Rojas, Y.; Lopez, R.; Finberg, R.; Balboni, A. Favipiravir in Patients With Early Mild-to-moderate Coronavirus Disease 2019 (COVID-19): A Randomized Controlled Trial. Clin. Infect. Dis. 2023, 76, e10–e17. [Google Scholar] [CrossRef] [PubMed]
- Sirijatuphat, R.; Manosuthi, W.; Niyomnaitham, S.; Owen, A.; Copeland, K.K.; Charoenpong, L.; Rattanasompattikul, M.; Mahasirimongkol, S.; Wichukchinda, N.; Chokephaibulkit, K. Early treatment of Favipiravir in COVID-19 patients without pneumonia: A multicentre, open-labelled, randomized control study. Emerg. Microbes Infect. 2022, 11, 2197–2206. [Google Scholar] [CrossRef]
- Eloy, P.; Le Grand, R.; Malvy, D.; Guedj, J. Combined treatment of molnupiravir and favipiravir against SARS-CoV-2 infection: One + zero equals two? eBioMedicine 2021, 74, 103663. [Google Scholar] [CrossRef]
- Huang, W.; Lu, S.; Huang, Z.; Liu, X.; Mou, L.; Luo, Y.; Zhao, Y.; Liu, Y.; Chen, Z.; Hou, T.; et al. Allosite: A method for predicting allosteric sites. Bioinformatics 2013, 29, 2357–2359. [Google Scholar] [CrossRef]
- Tian, H.; Jiang, X.; Tao, P. PASSer: Prediction of allosteric sites server. Mach. Learn. Sci. Technol 2021, 2, 035015. [Google Scholar] [CrossRef] [PubMed]
- Faisal, S.; Badshah, S.L.; Kubra, B.; Sharaf, M.; Emwas, A.-H.; Jaremko, M.; Abdalla, M. Identification and Inhibition of the Druggable Allosteric Site of SARS-CoV-2 NSP10/NSP16 Methyltransferase through Computational Approaches. Molecules 2022, 27, 5241. [Google Scholar] [CrossRef]
- Kijewska, M.; Sharfalddin, A.A.; Jaremko, Ł.; Cal, M.; Setner, B.; Siczek, M.; Stefanowicz, P.; Hussien, M.A.; Emwas, A.-H.; Jaremko, M. Lossen Rearrangement of p-Toluenesulfonates of N-Oxyimides in Basic Condition, Theoretical Study, and Molecular Docking. Front. Chem. 2021, 9, 662533. [Google Scholar] [CrossRef]
- Kohn, W.; Sham, L.J. Self-Consistent Equations Including Exchange and Correlation Effects. Phys. Rev. 1965, 140, A1133–A1138. [Google Scholar] [CrossRef]
- Levy, M. Universal variational functionals of electron densities, first-order density matrices, and natural spin-orbitals and solution of the v-representability problem. Proc. Natl. Acad. Sci. USA 1979, 76, 6062–6065. [Google Scholar] [CrossRef]
- Becke, A.D. A new mixing of Hartree–Fock and local density-functional theories. J. Chem. Phys. 1993, 98, 1372. [Google Scholar] [CrossRef]
- Becke, A.D. Density-functional thermochemistry. III. The role of exact exchange. J. Chem. Phys. 1993, 98, 5648–5652. [Google Scholar] [CrossRef]
- Møller, C.; Plesset, M.S. Note on an Approximation Treatment for Many-Electron Systems. Phys. Rev. 1934, 46, 618–622. [Google Scholar] [CrossRef]
- Zhao, Y.; Truhlar, D.G. The M06 suite of density functionals for main group thermochemistry, thermochemical kinetics, noncovalent interactions, excited states, and transition elements: Two new functionals and systematic testing of four M06-class functionals and 12 other functionals. Theor. Chem. Acc. 2007, 120, 215–241. [Google Scholar] [CrossRef]
- Miertuš, S.; Scrocco, E.; Tomasi, J. Electrostatic interaction of a solute with a continuum. A direct utilizaion of AB initio molecular potentials for the prevision of solvent effects. Chem. Phys. 1981, 55, 117–129. [Google Scholar] [CrossRef]
- Frisch, M.J.; Trucks, G.W.; Schlegel, H.B.; Scuseria, G.E.; Robb, M.A.; Cheeseman, J.R.; Scalmani, G.; Barone, V.; Petersson, G.A.; Nakatsuji, H.; et al. Gaussian 16 Rev. C.01; Gaussian, Inc.: Wallingford, CT, USA, 2016. [Google Scholar]
- Parr, R.G.; Szentpály, L.v.; Liu, S. Electrophilicity Index. J. Am. Chem. Soc. 1999, 121, 1922–1924. [Google Scholar] [CrossRef]
- Gázquez, J.L.; Cedillo, A.; Vela, A. Electrodonating and Electroaccepting Powers. J. Phys. Chem. A 2007, 111, 1966–1970. [Google Scholar] [CrossRef]
- Chattaraj, P.K.; Chakraborty, A.; Giri, S. Net Electrophilicity. J. Phys. Chem. A 2009, 113, 10068–10074. [Google Scholar] [CrossRef]
- Koopmans, T. Über die Zuordnung von Wellenfunktionen und Eigenwerten zu den Einzelnen Elektronen Eines Atoms. Physica 1934, 1, 104–113. [Google Scholar] [CrossRef]
- Bader, R. Atoms in Molecules: A Quantum Theory (International Series of Monographs on Chemistry); Oxford University Press: Cary, NC, USA, 1994. [Google Scholar]
- Johnson, E.R.; Keinan, S.; Mori-Sánchez, P.; Contreras-García, J.; Cohen, A.J.; Yang, W. Revealing Noncovalent Interactions. J. Am. Chem. Soc. 2010, 132, 6498–6506. [Google Scholar] [CrossRef] [PubMed]
- Humphrey, W.; Dalke, A.; Schulten, K. VMD: Visual molecular dynamics. J. Mol. Graph. 1996, 14, 33–38. [Google Scholar] [CrossRef] [PubMed]
- Trott, O.; Olson, A.J. AutoDock Vina: Improving the speed and accuracy of docking with a new scoring function, efficient optimization, and multithreading. J. Comput. Chem. 2009, 31, 455–461. [Google Scholar] [CrossRef] [PubMed]
- Eberhardt, J.; Santos-Martins, D.; Tillack, A.F.; Forli, S. AutoDock Vina 1.2.0: New Docking Methods, Expanded Force Field, and Python Bindings. J. Chem. Inf. Model. 2021, 61, 3891–3898. [Google Scholar] [CrossRef] [PubMed]
- Yang, J.M.; Chen, C.C. GEMDOCK: A Generic Evolutionary Method for Molecular Docking. Proteins 2004, 55, 288–304. [Google Scholar] [CrossRef]
- Diedrich, K.; Krause, B.; Berg, O.; Rarey, M. PoseEdit: Enhanced ligand binding mode communication by interactive 2D diagrams. J. Comput. Aided Mol. Des. 2023, 37, 481–503. [Google Scholar] [CrossRef]
- Dassault Systèmes, Discovery Studio Visualizer, version v21.1.0.20298; Dassault Systèmes; BIOVIA: San Diego, CA, USA, 2021.
- Gehlhaar, D.K.; Bouzida, D.; Rejto, P.A. Fully automated and rapid flexible docking of inhibitors covalently bound to serine proteases. Lect. Notes Comput. Sci. 1198, 1447, 449–461. [Google Scholar] [CrossRef]


Disclaimer/Publisher’s Note: The statements, opinions and data contained in all publications are solely those of the individual author(s) and contributor(s) and not of MDPI and/or the editor(s). MDPI and/or the editor(s) disclaim responsibility for any injury to people or property resulting from any ideas, methods, instructions or products referred to in the content. |
© 2024 by the authors. Licensee MDPI, Basel, Switzerland. This article is an open access article distributed under the terms and conditions of the Creative Commons Attribution (CC BY) license (https://creativecommons.org/licenses/by/4.0/).