
Theoretical Study of the NO Reduction Mechanism on Biochar Surfaces Modified by Li and Na Single Adsorption and OH Co-Adsorption
 , , , ,
Abstract
: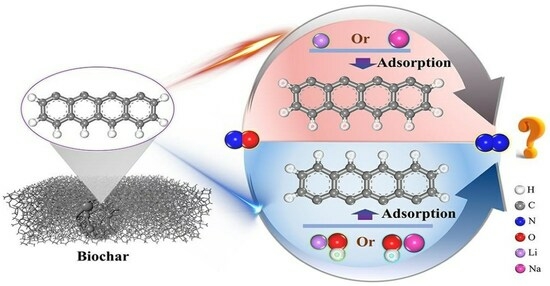
1. Introduction
2. Materials and Methods
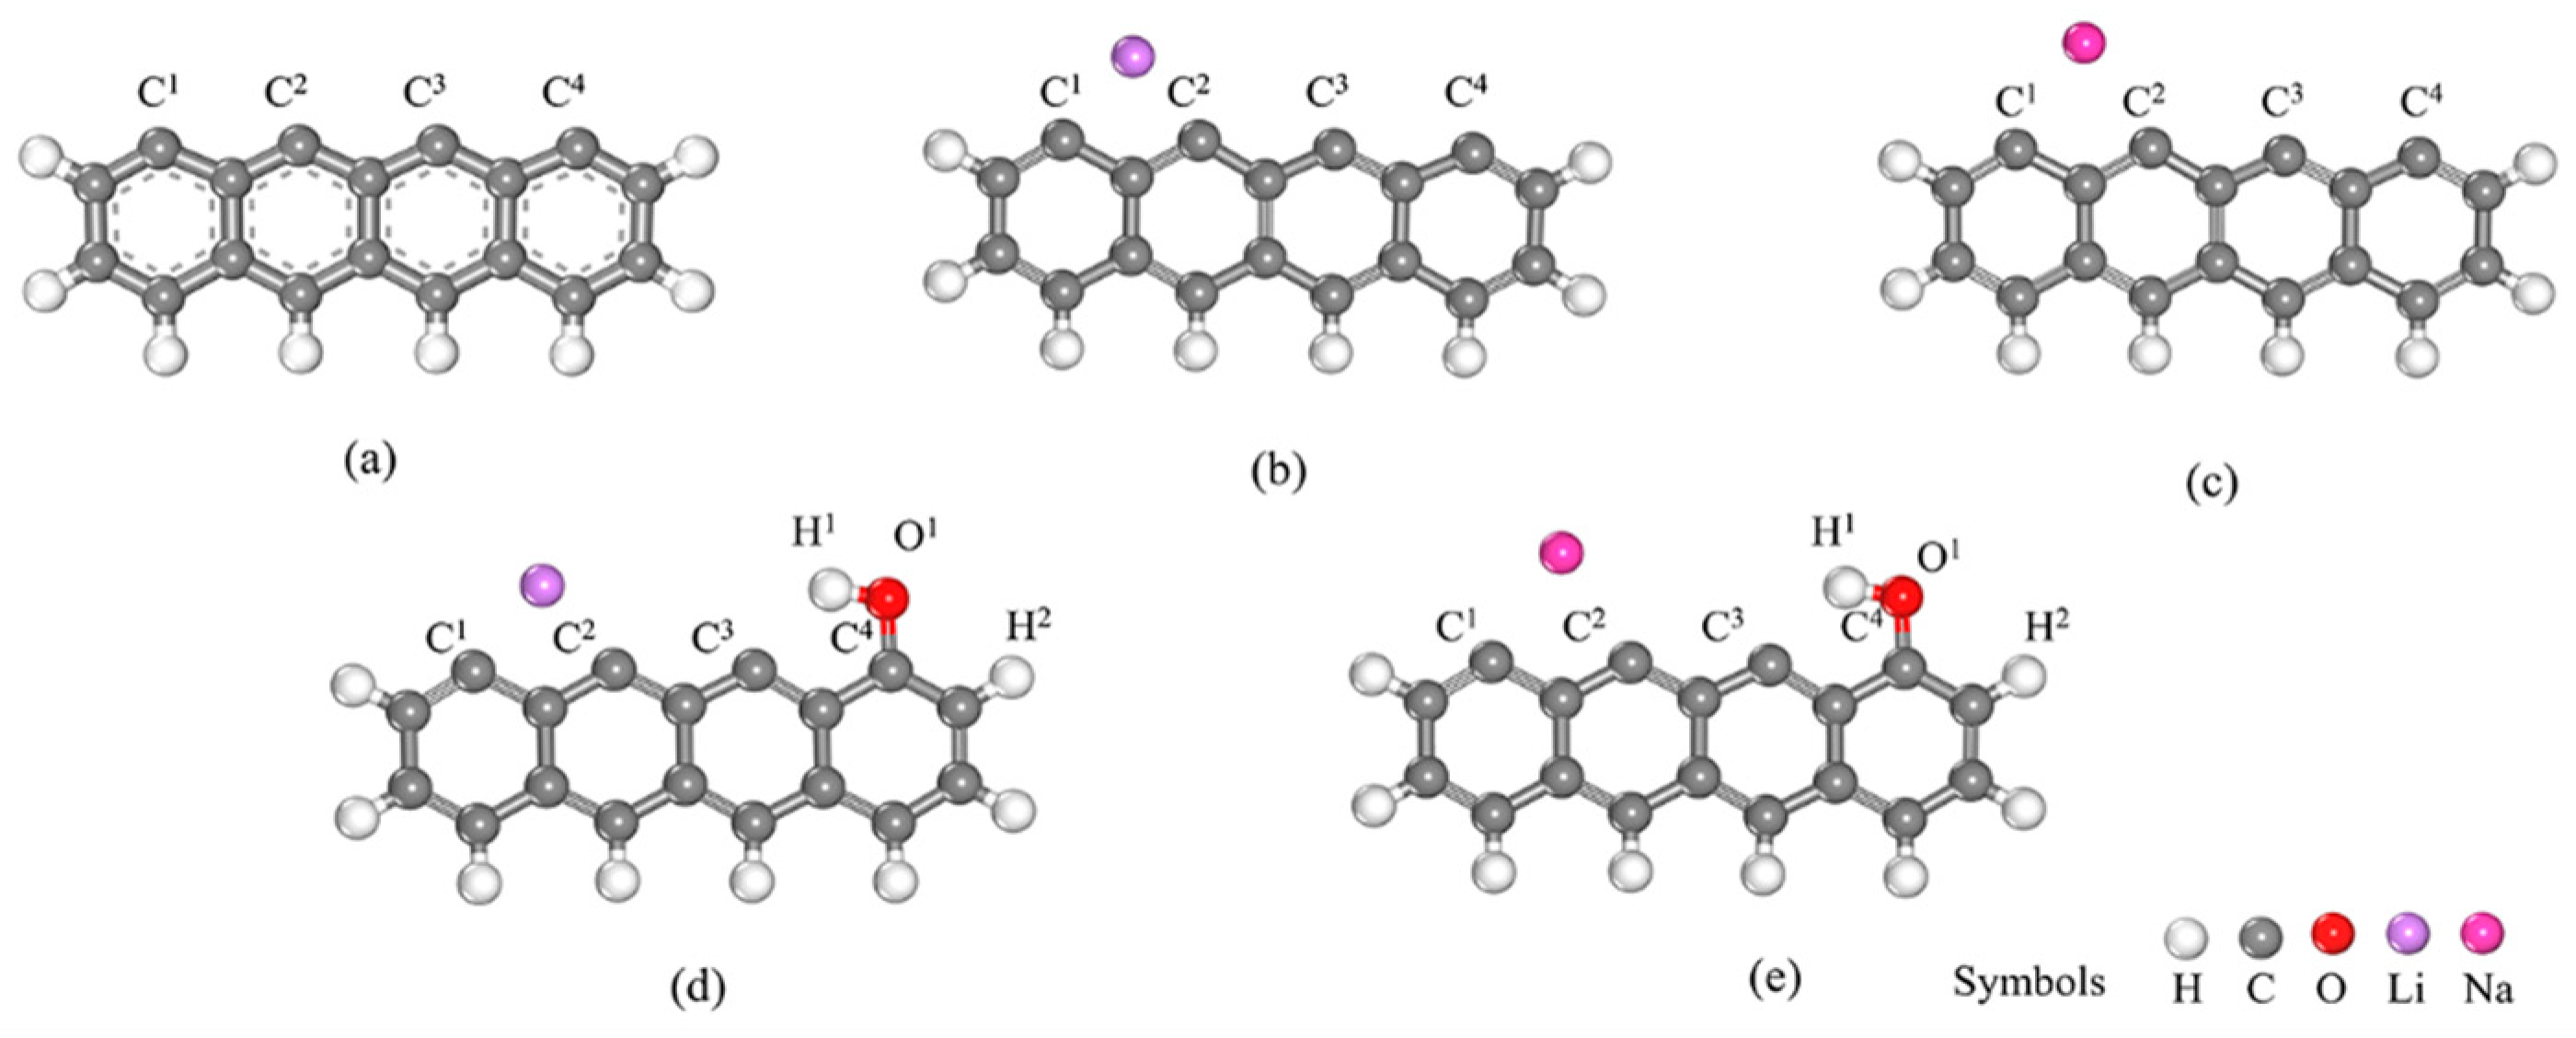
2.1. Models
2.2. Computational Methods
3. Results and Discussion
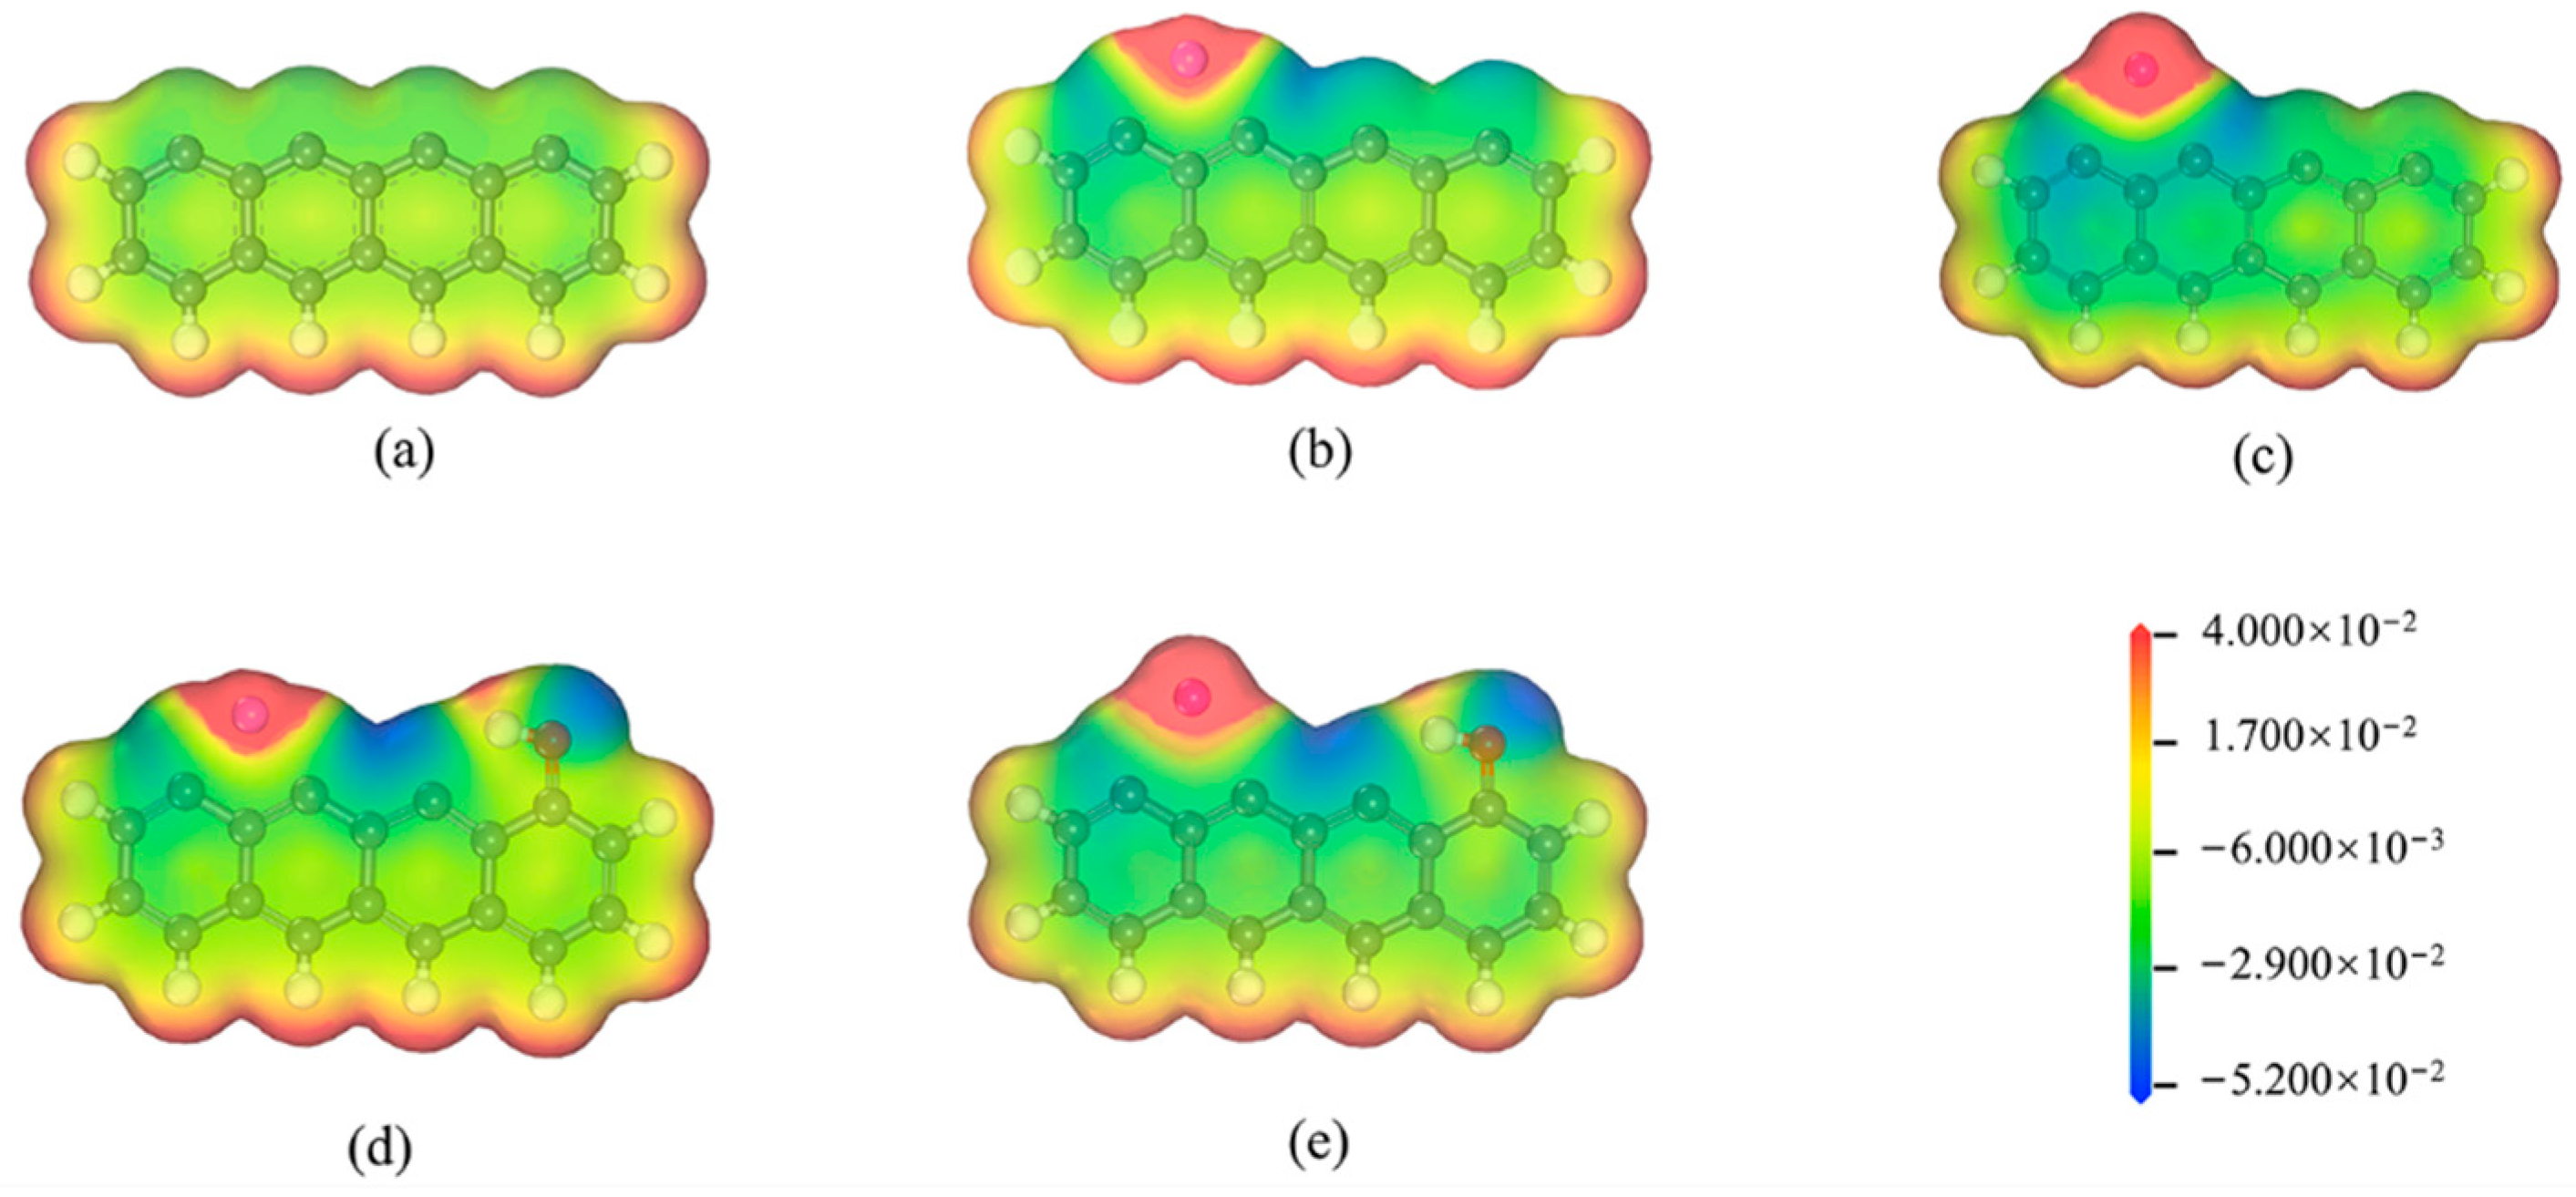
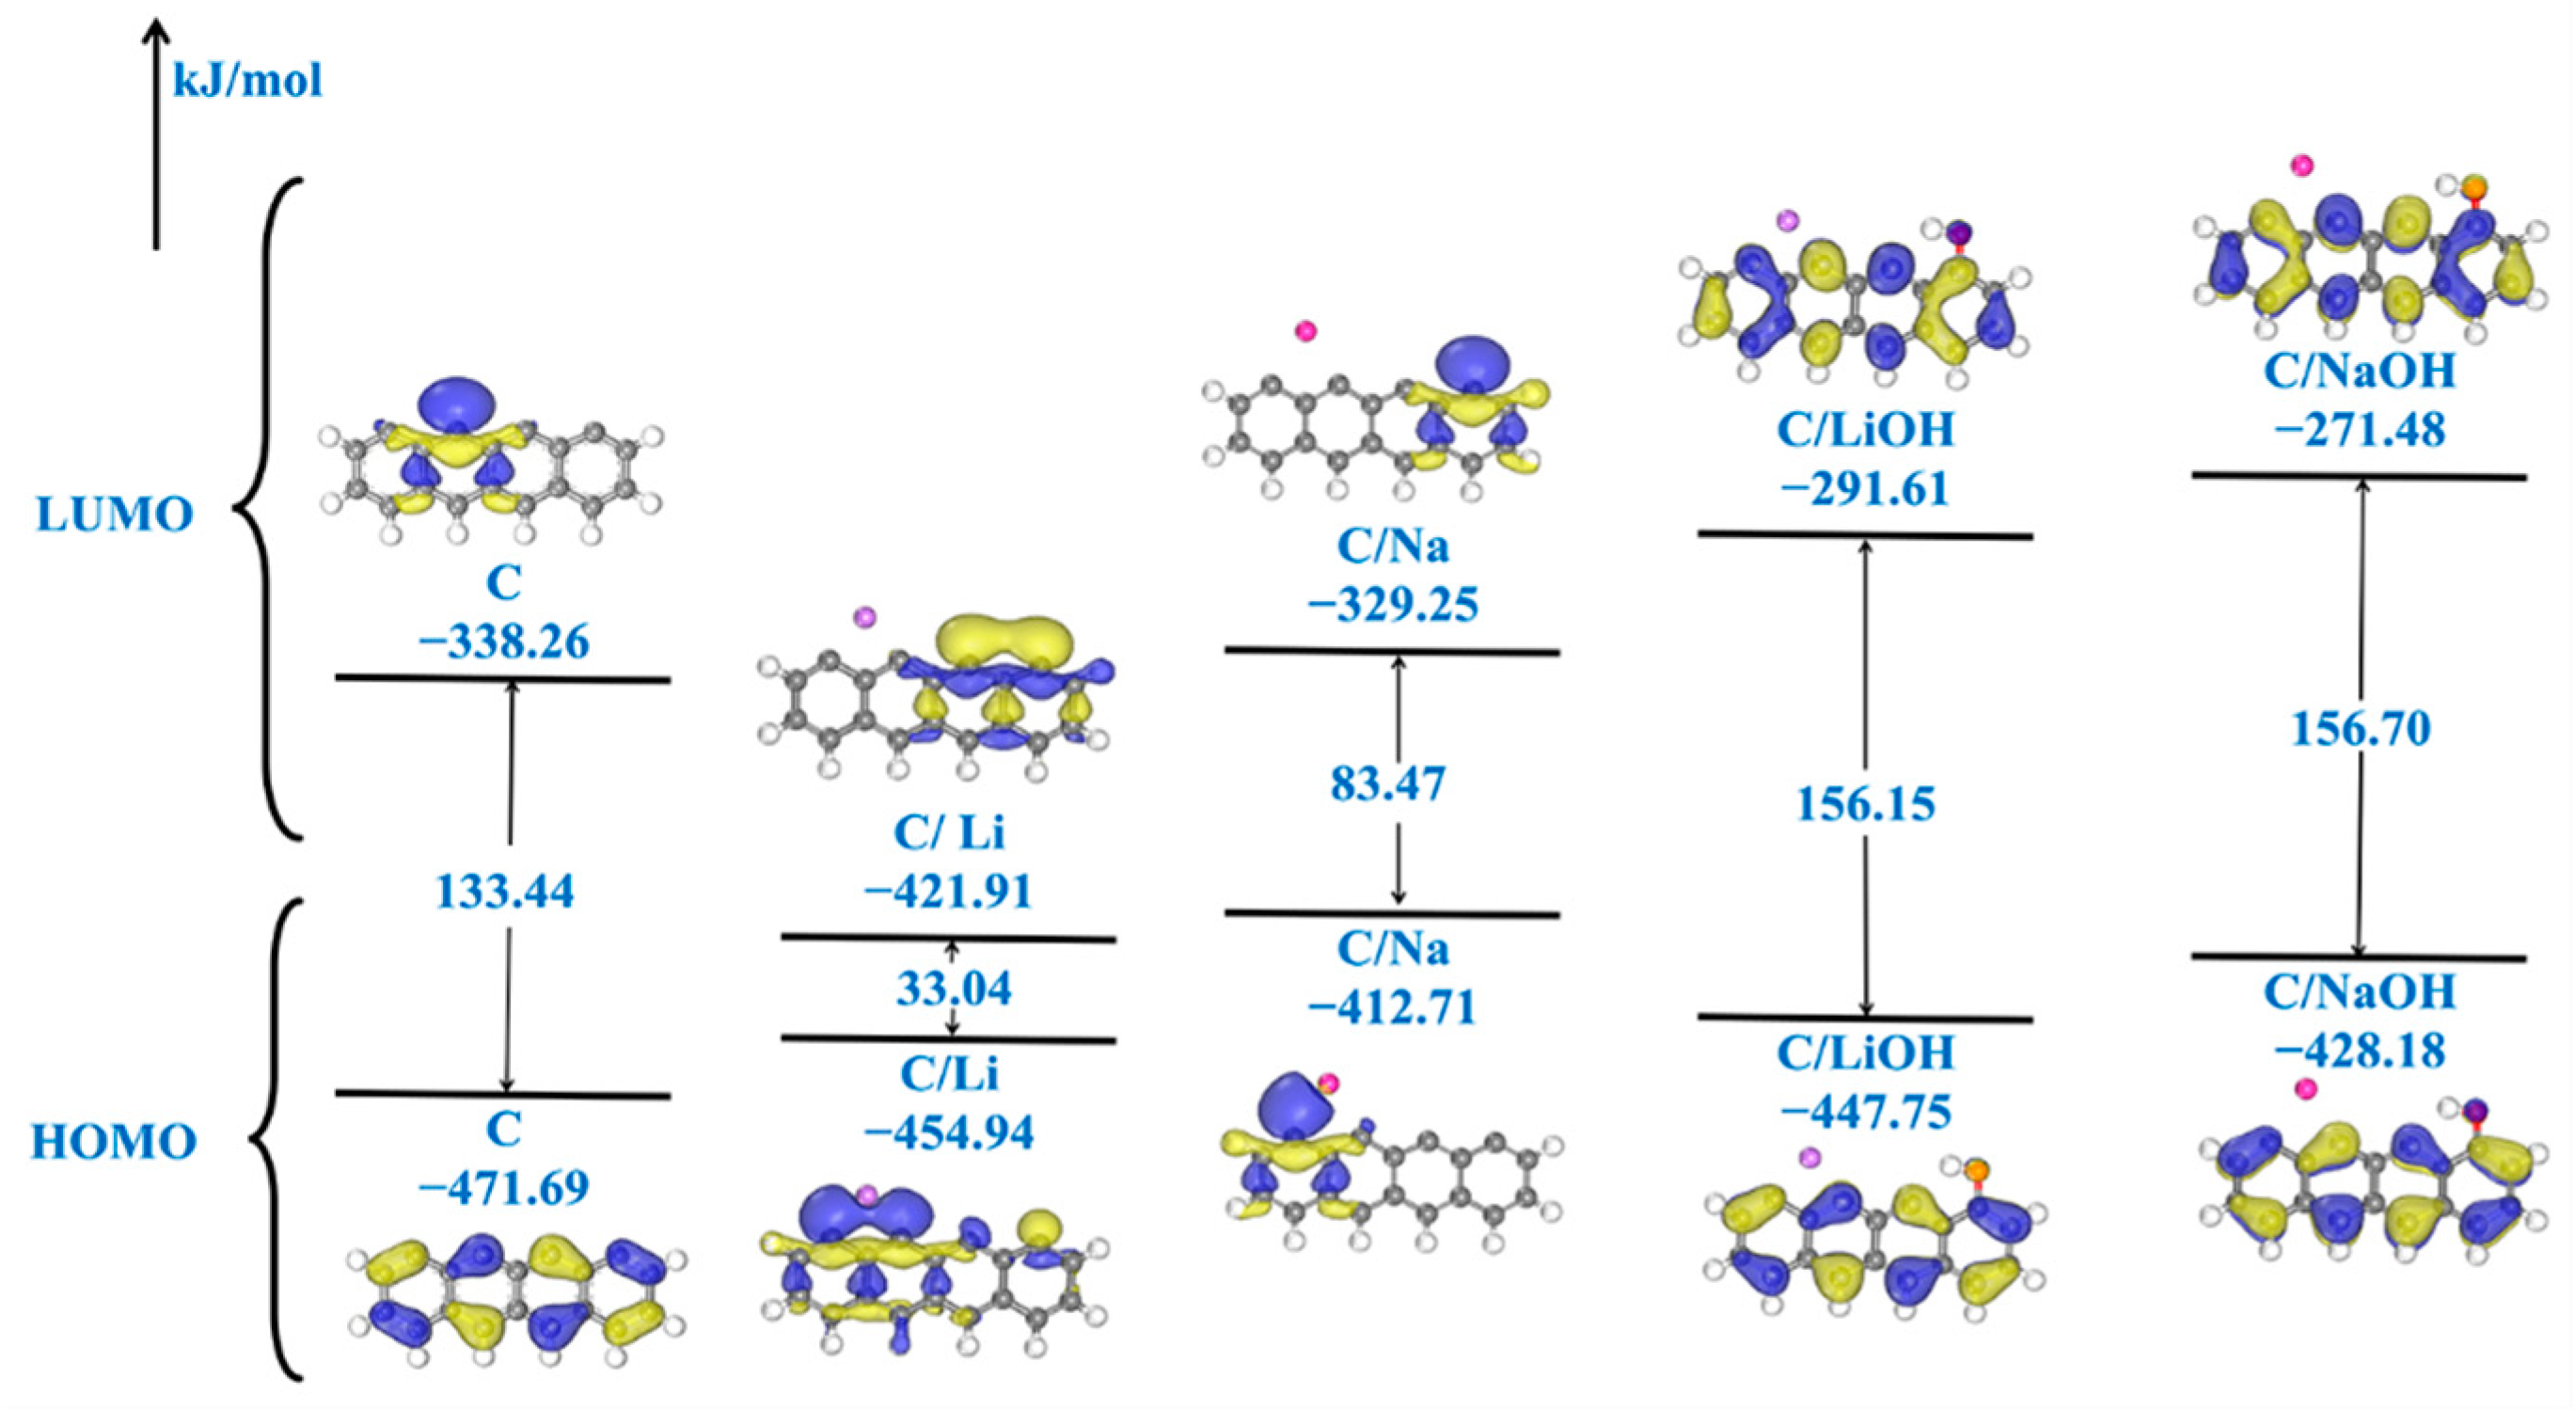
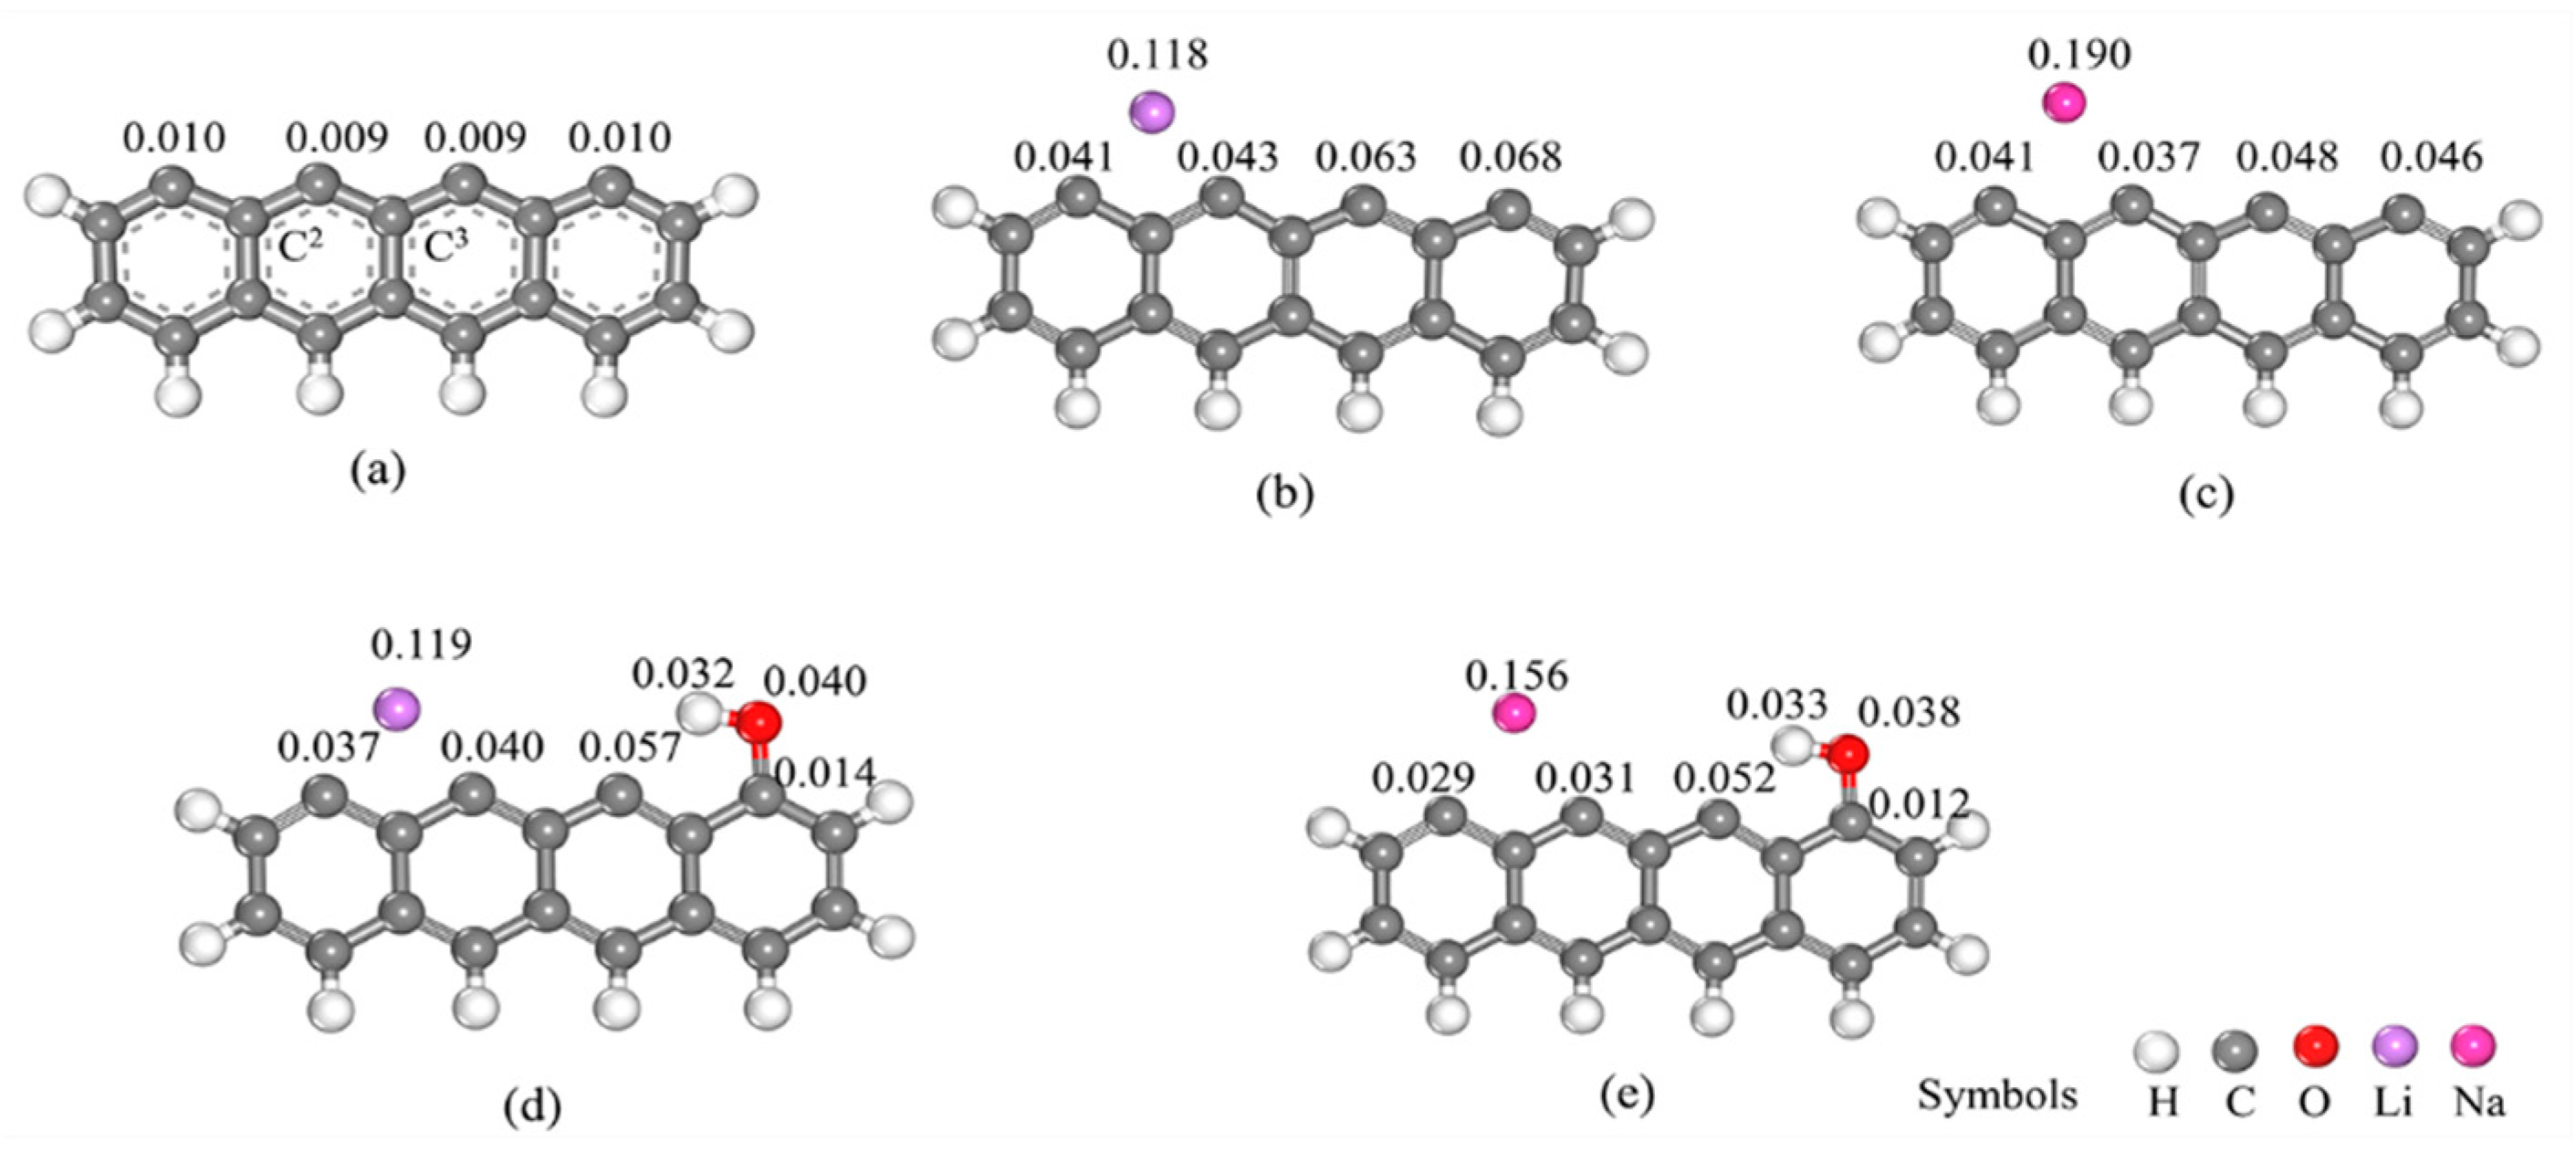
3.1. Electronic Structure of Models
3.2. Reduction Mechanism Analysis
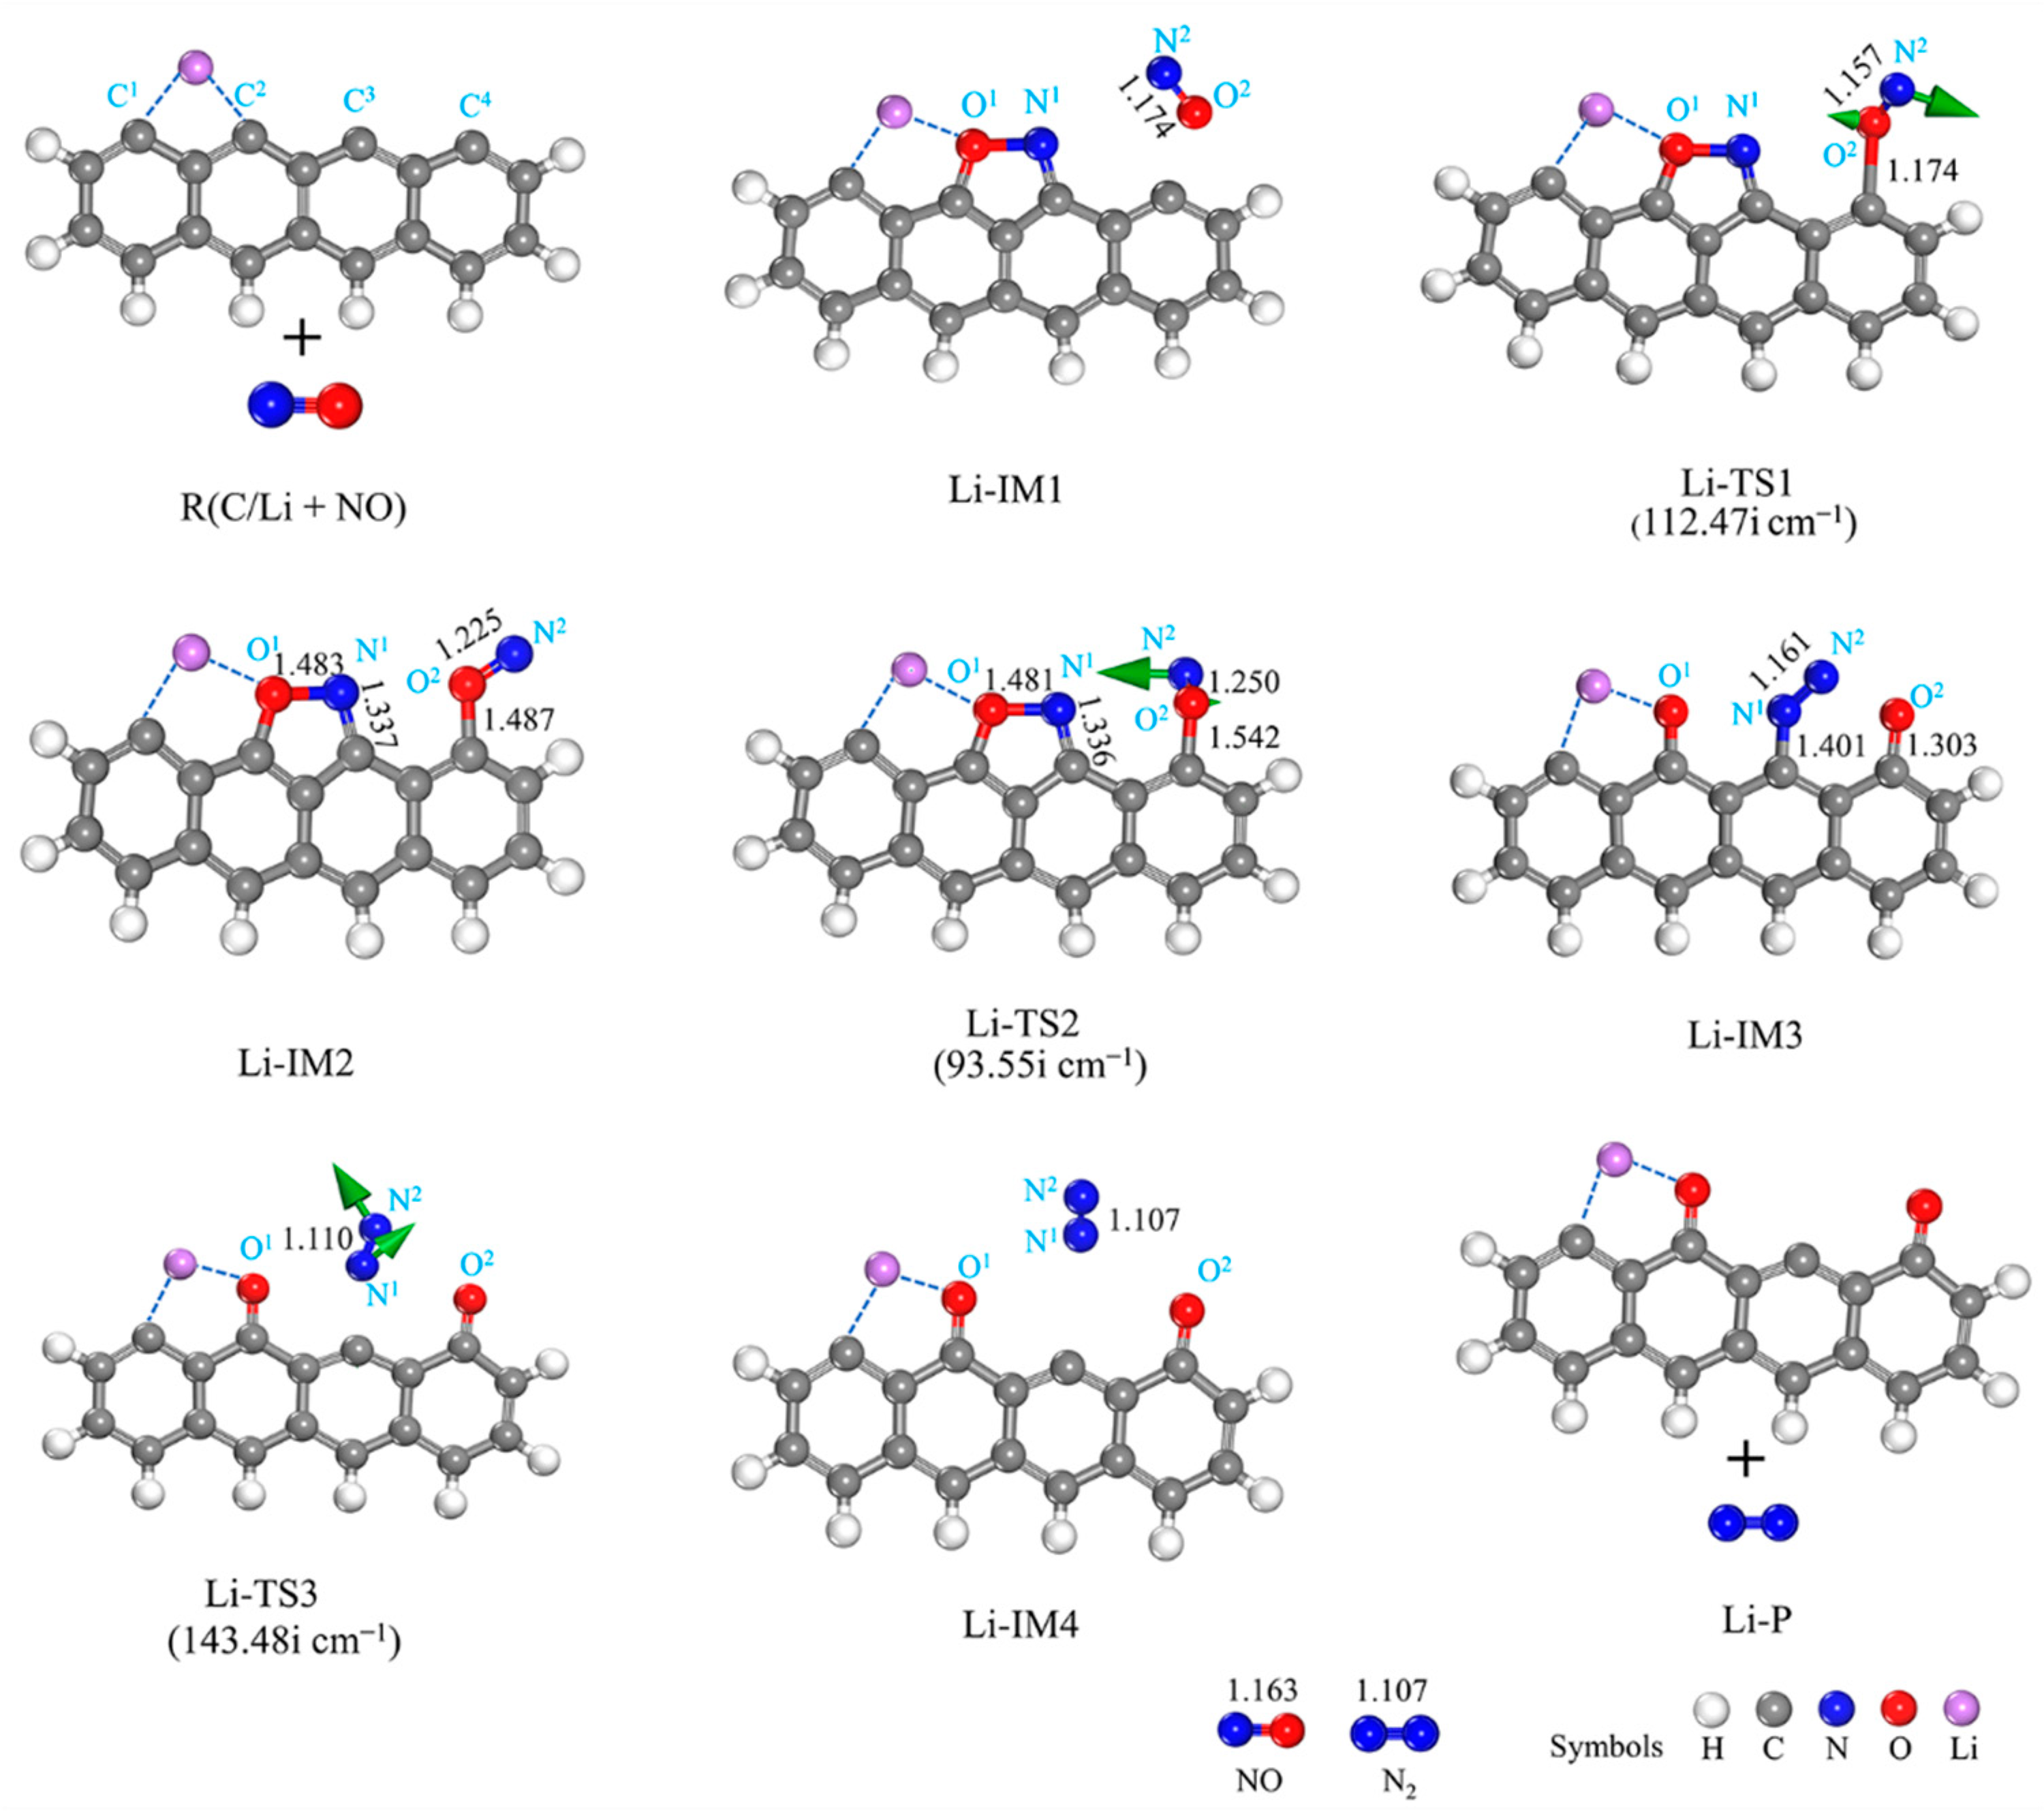
3.2.1. Li-Decorated Biomass
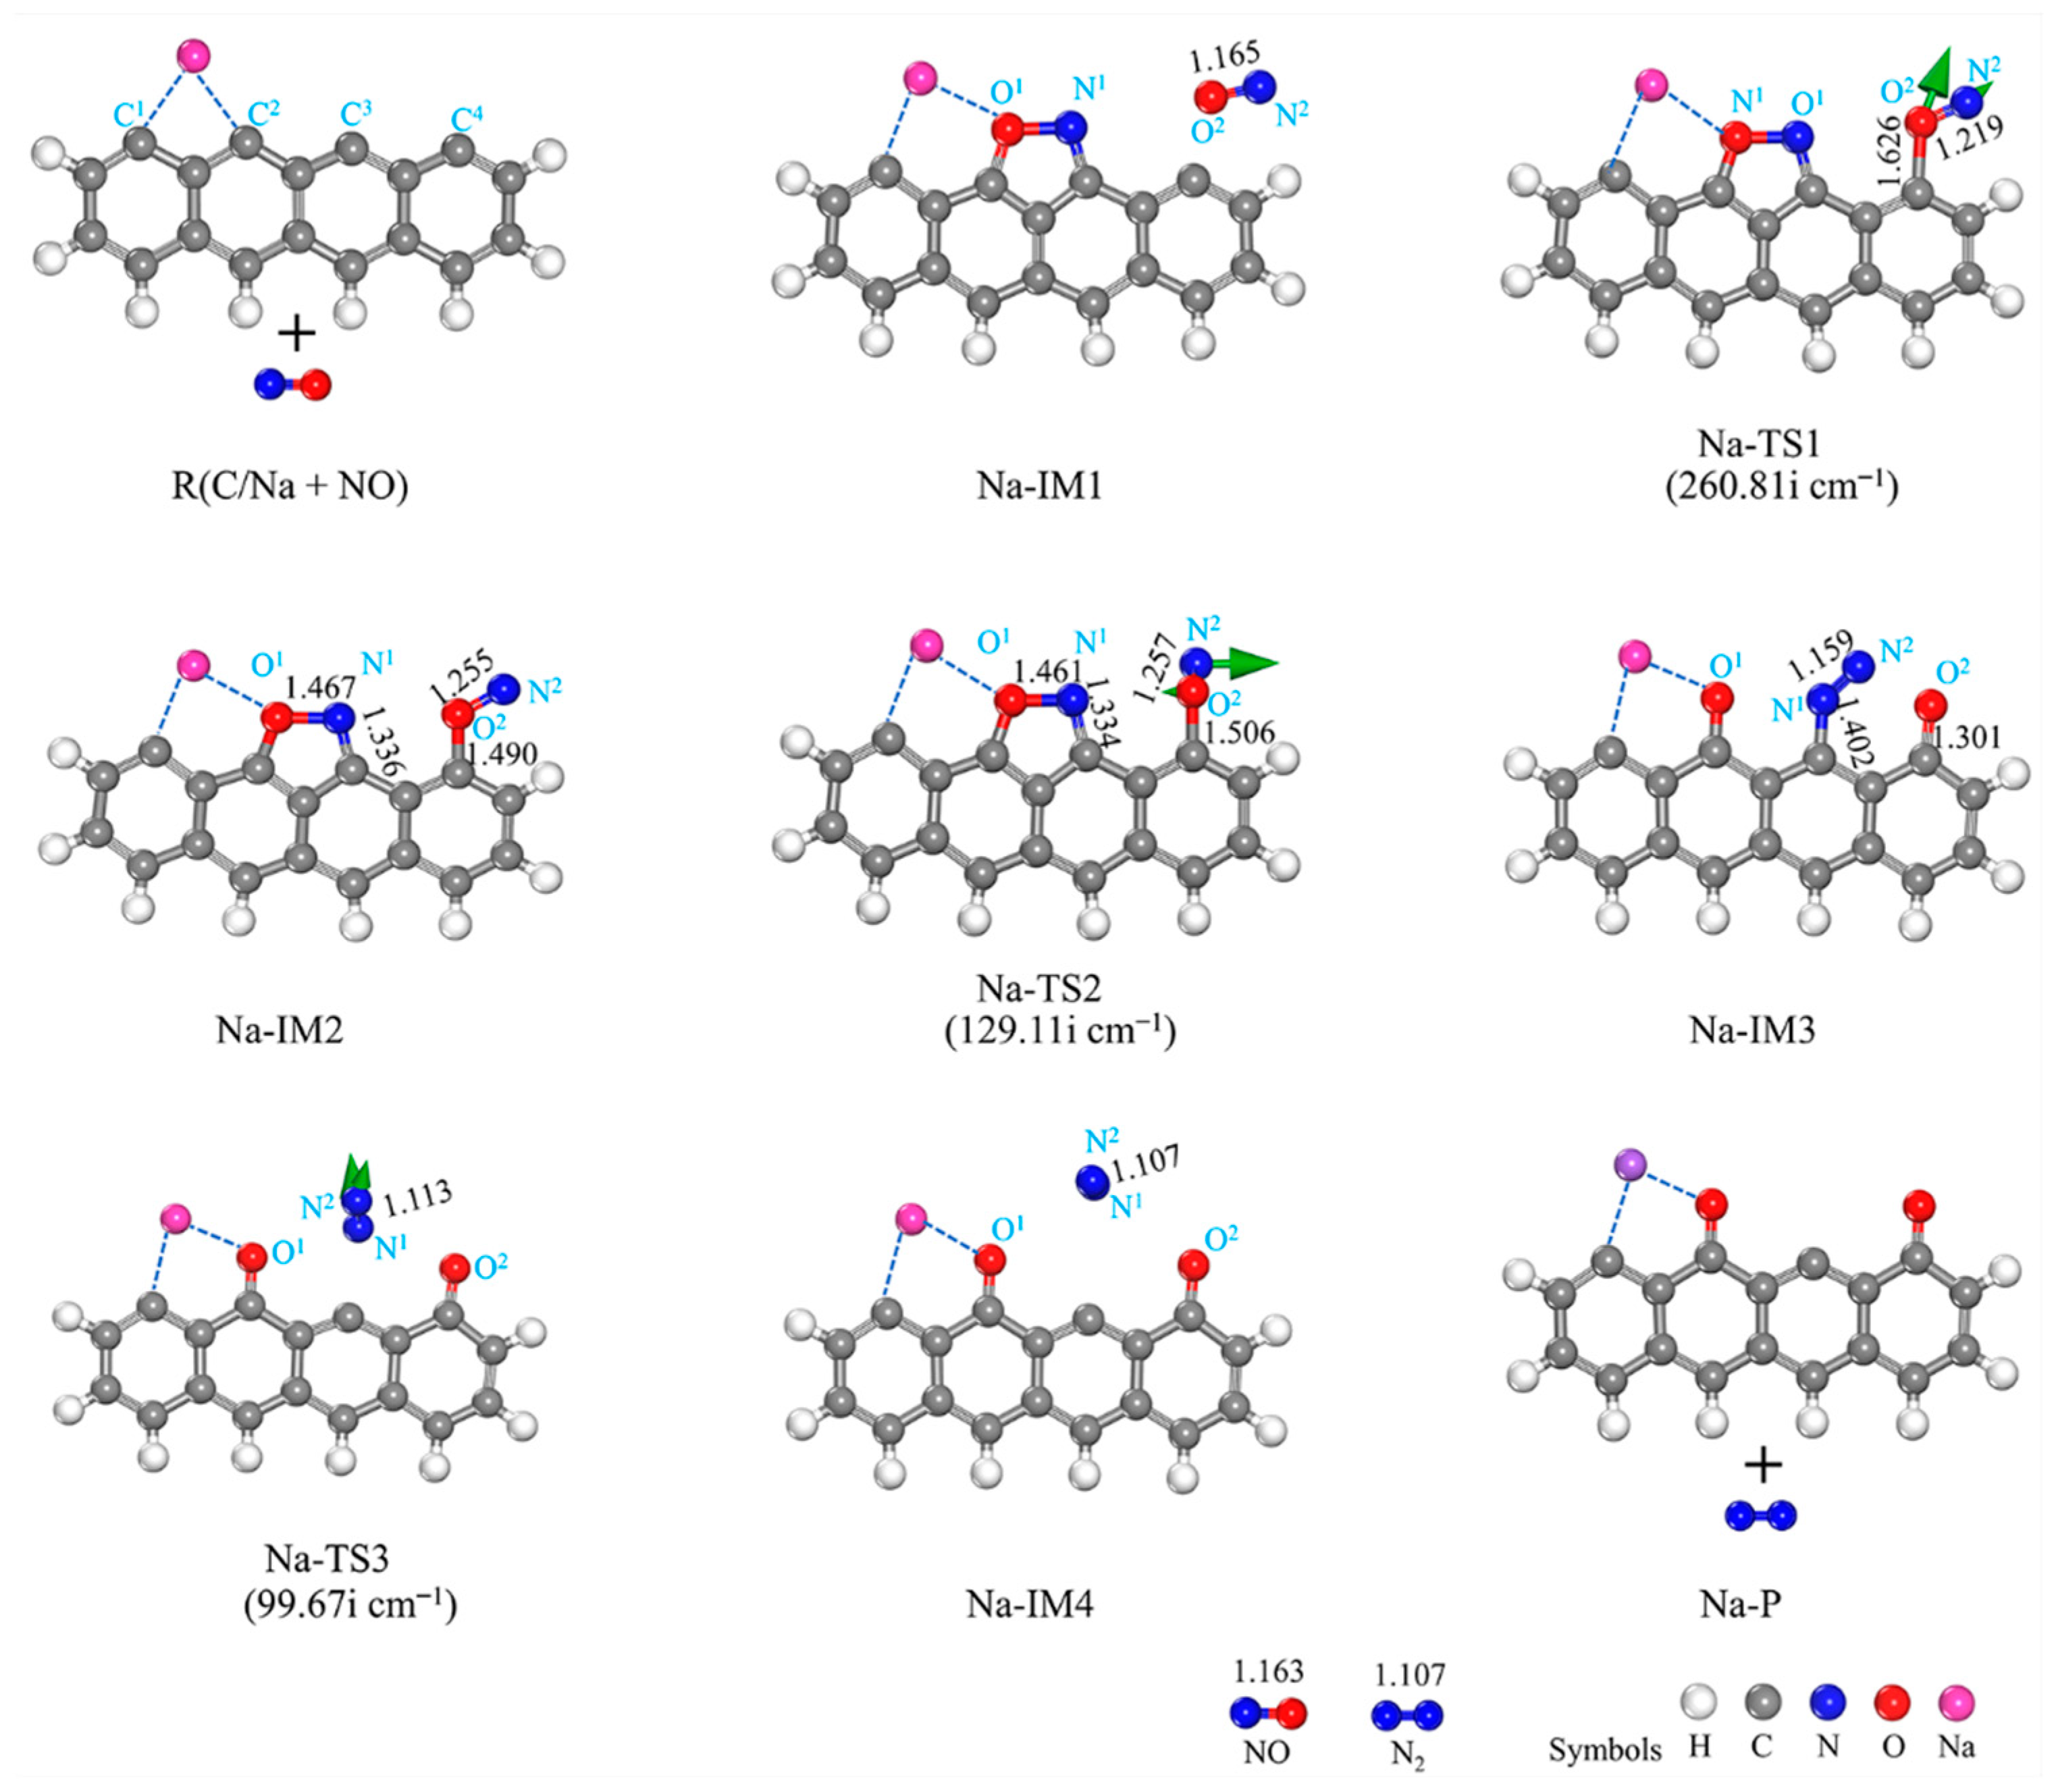
3.2.2. Na-Decorated Biomass
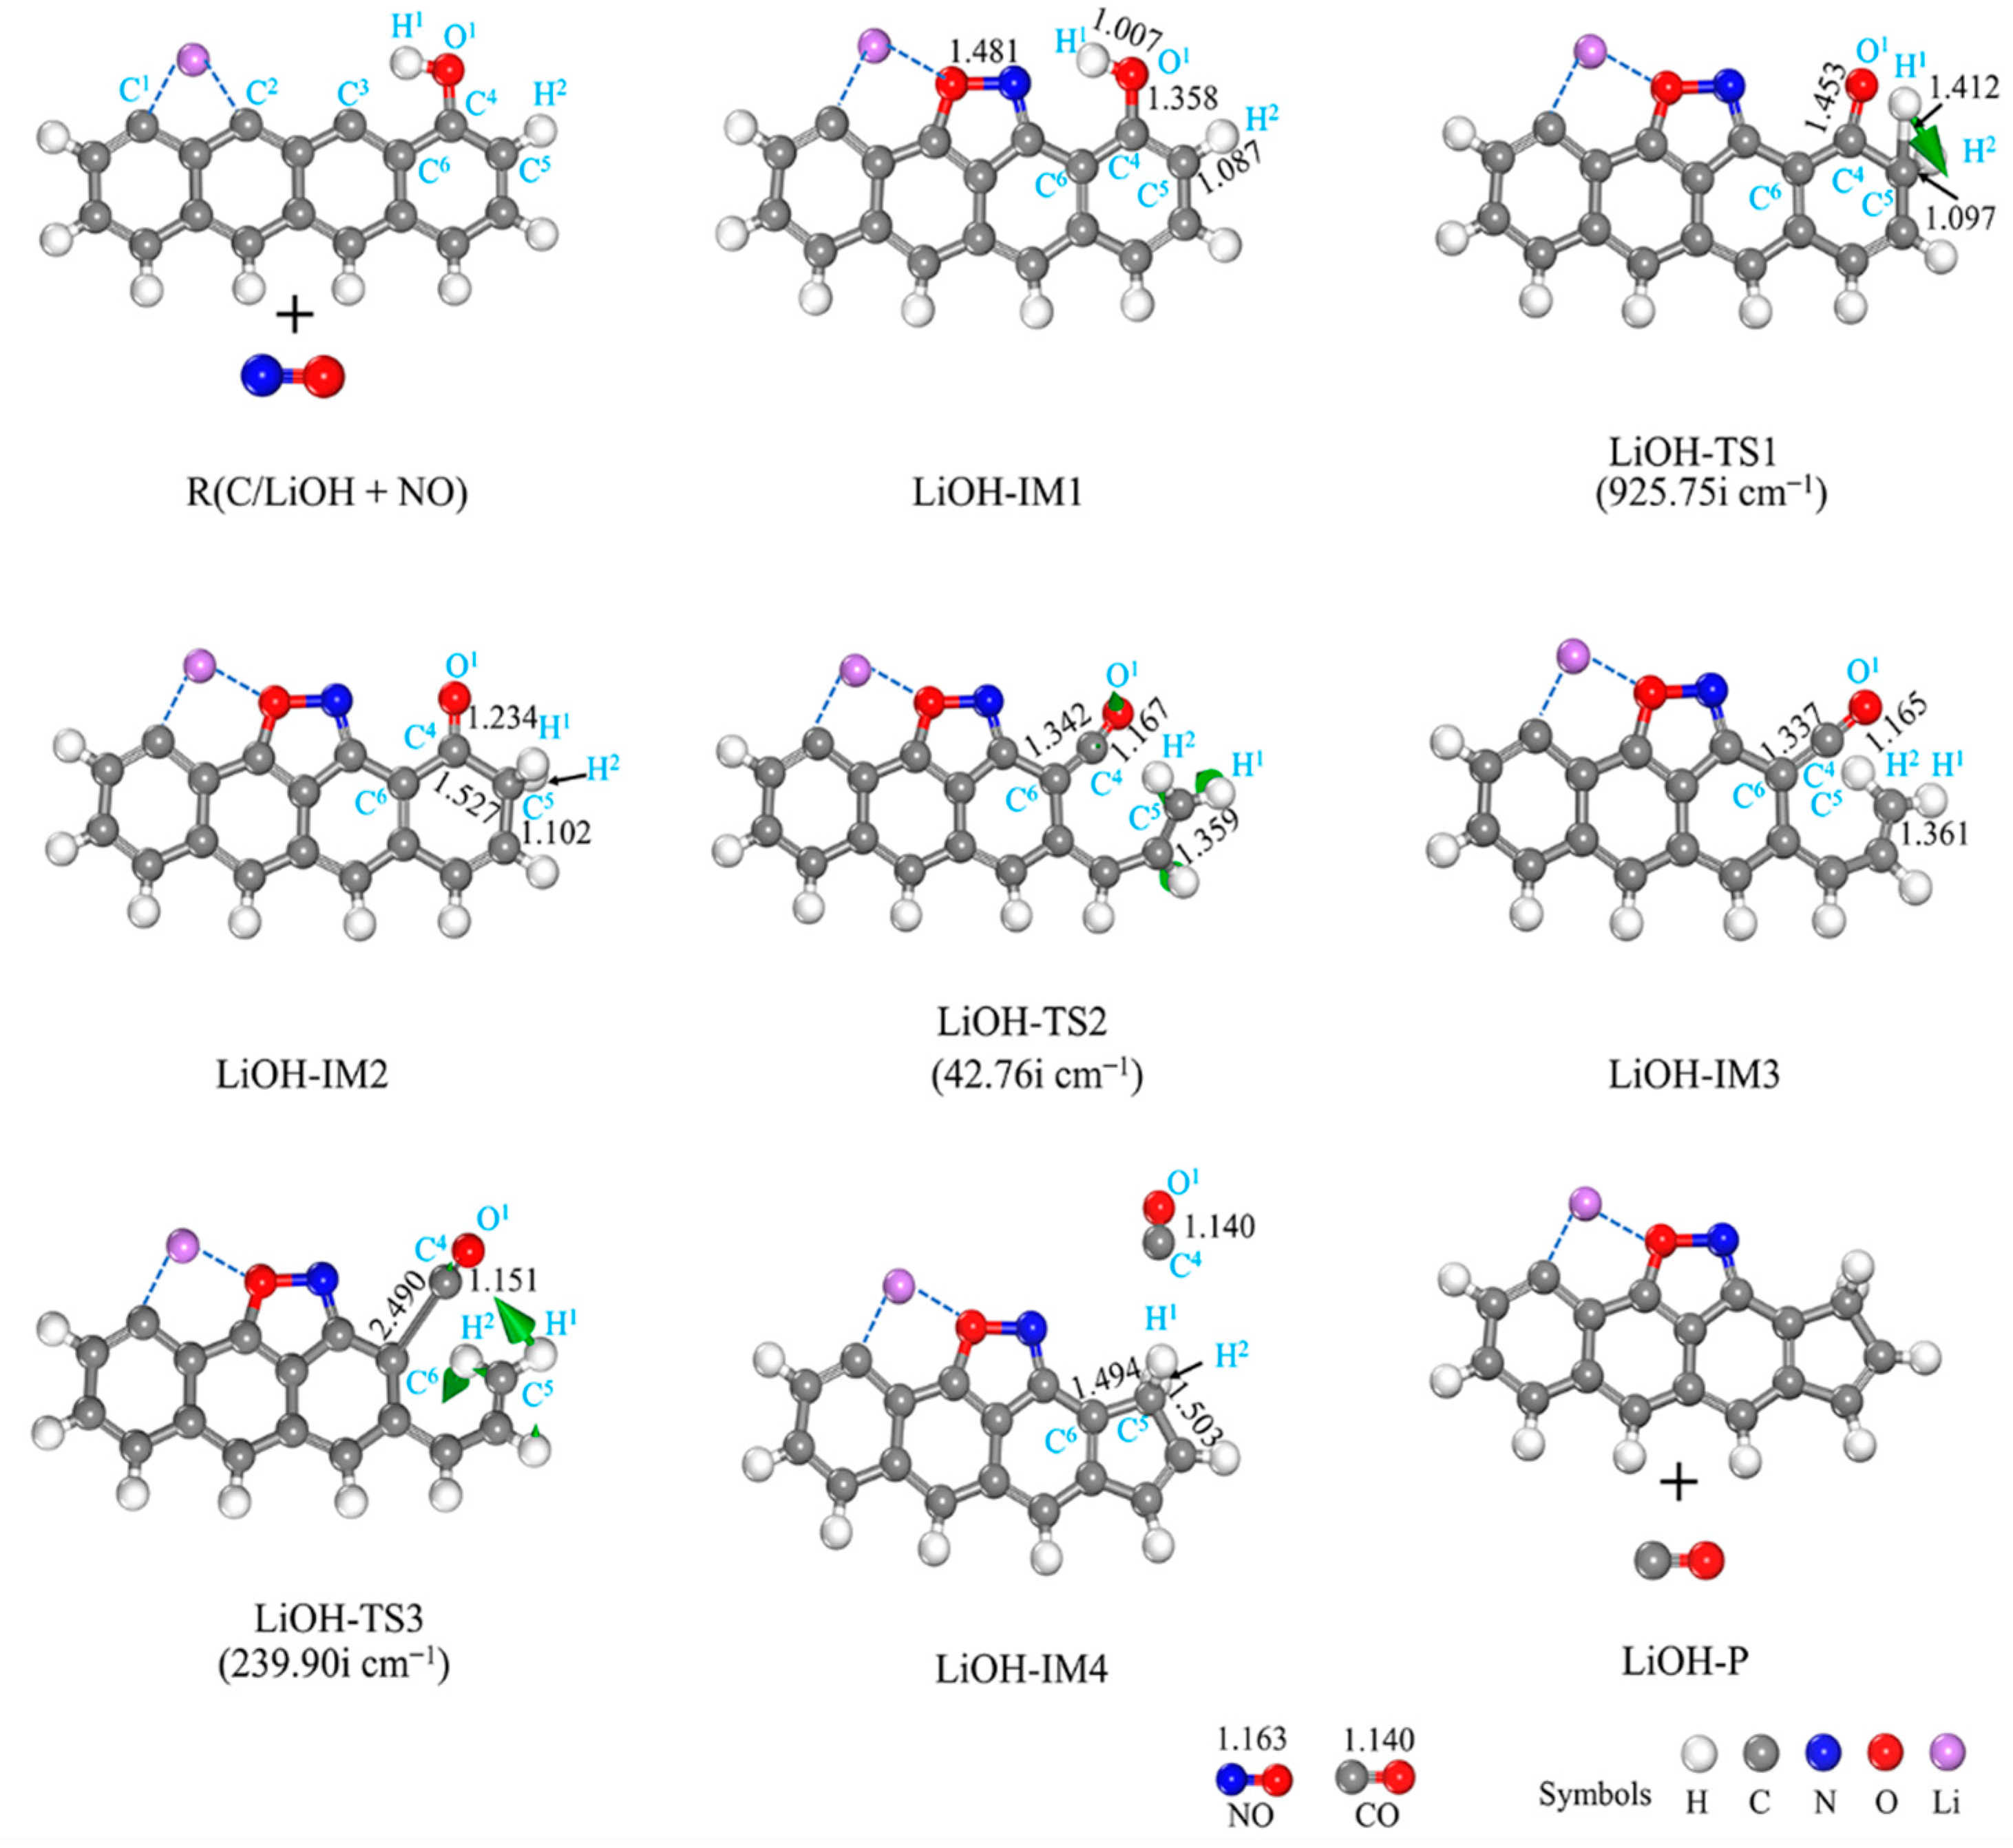
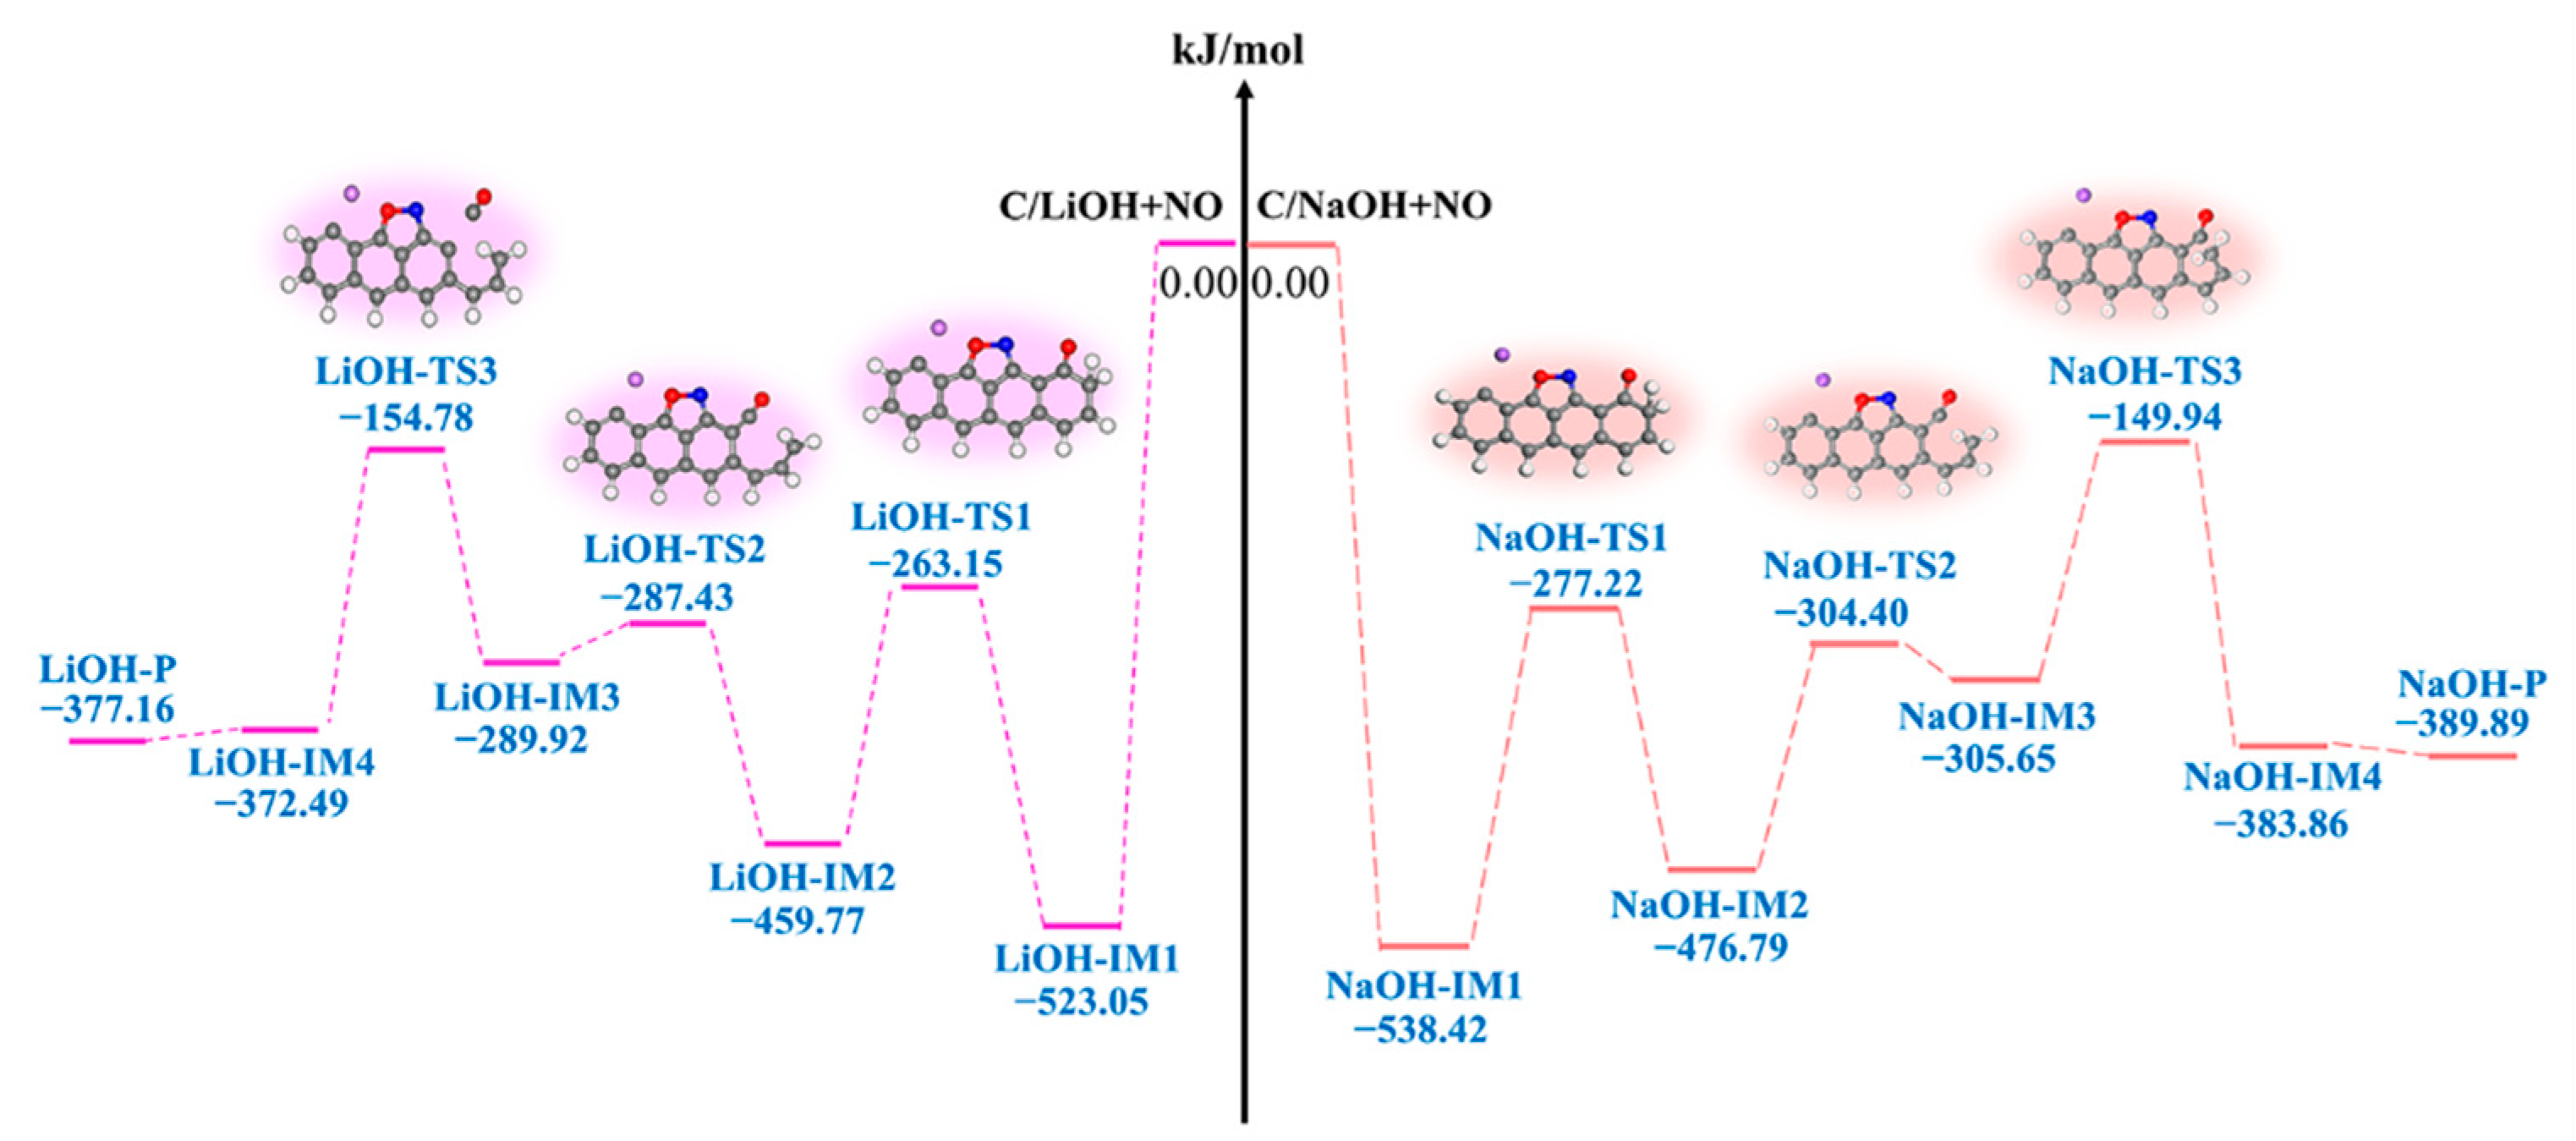
3.2.3. LiOH-Decorated Biomass
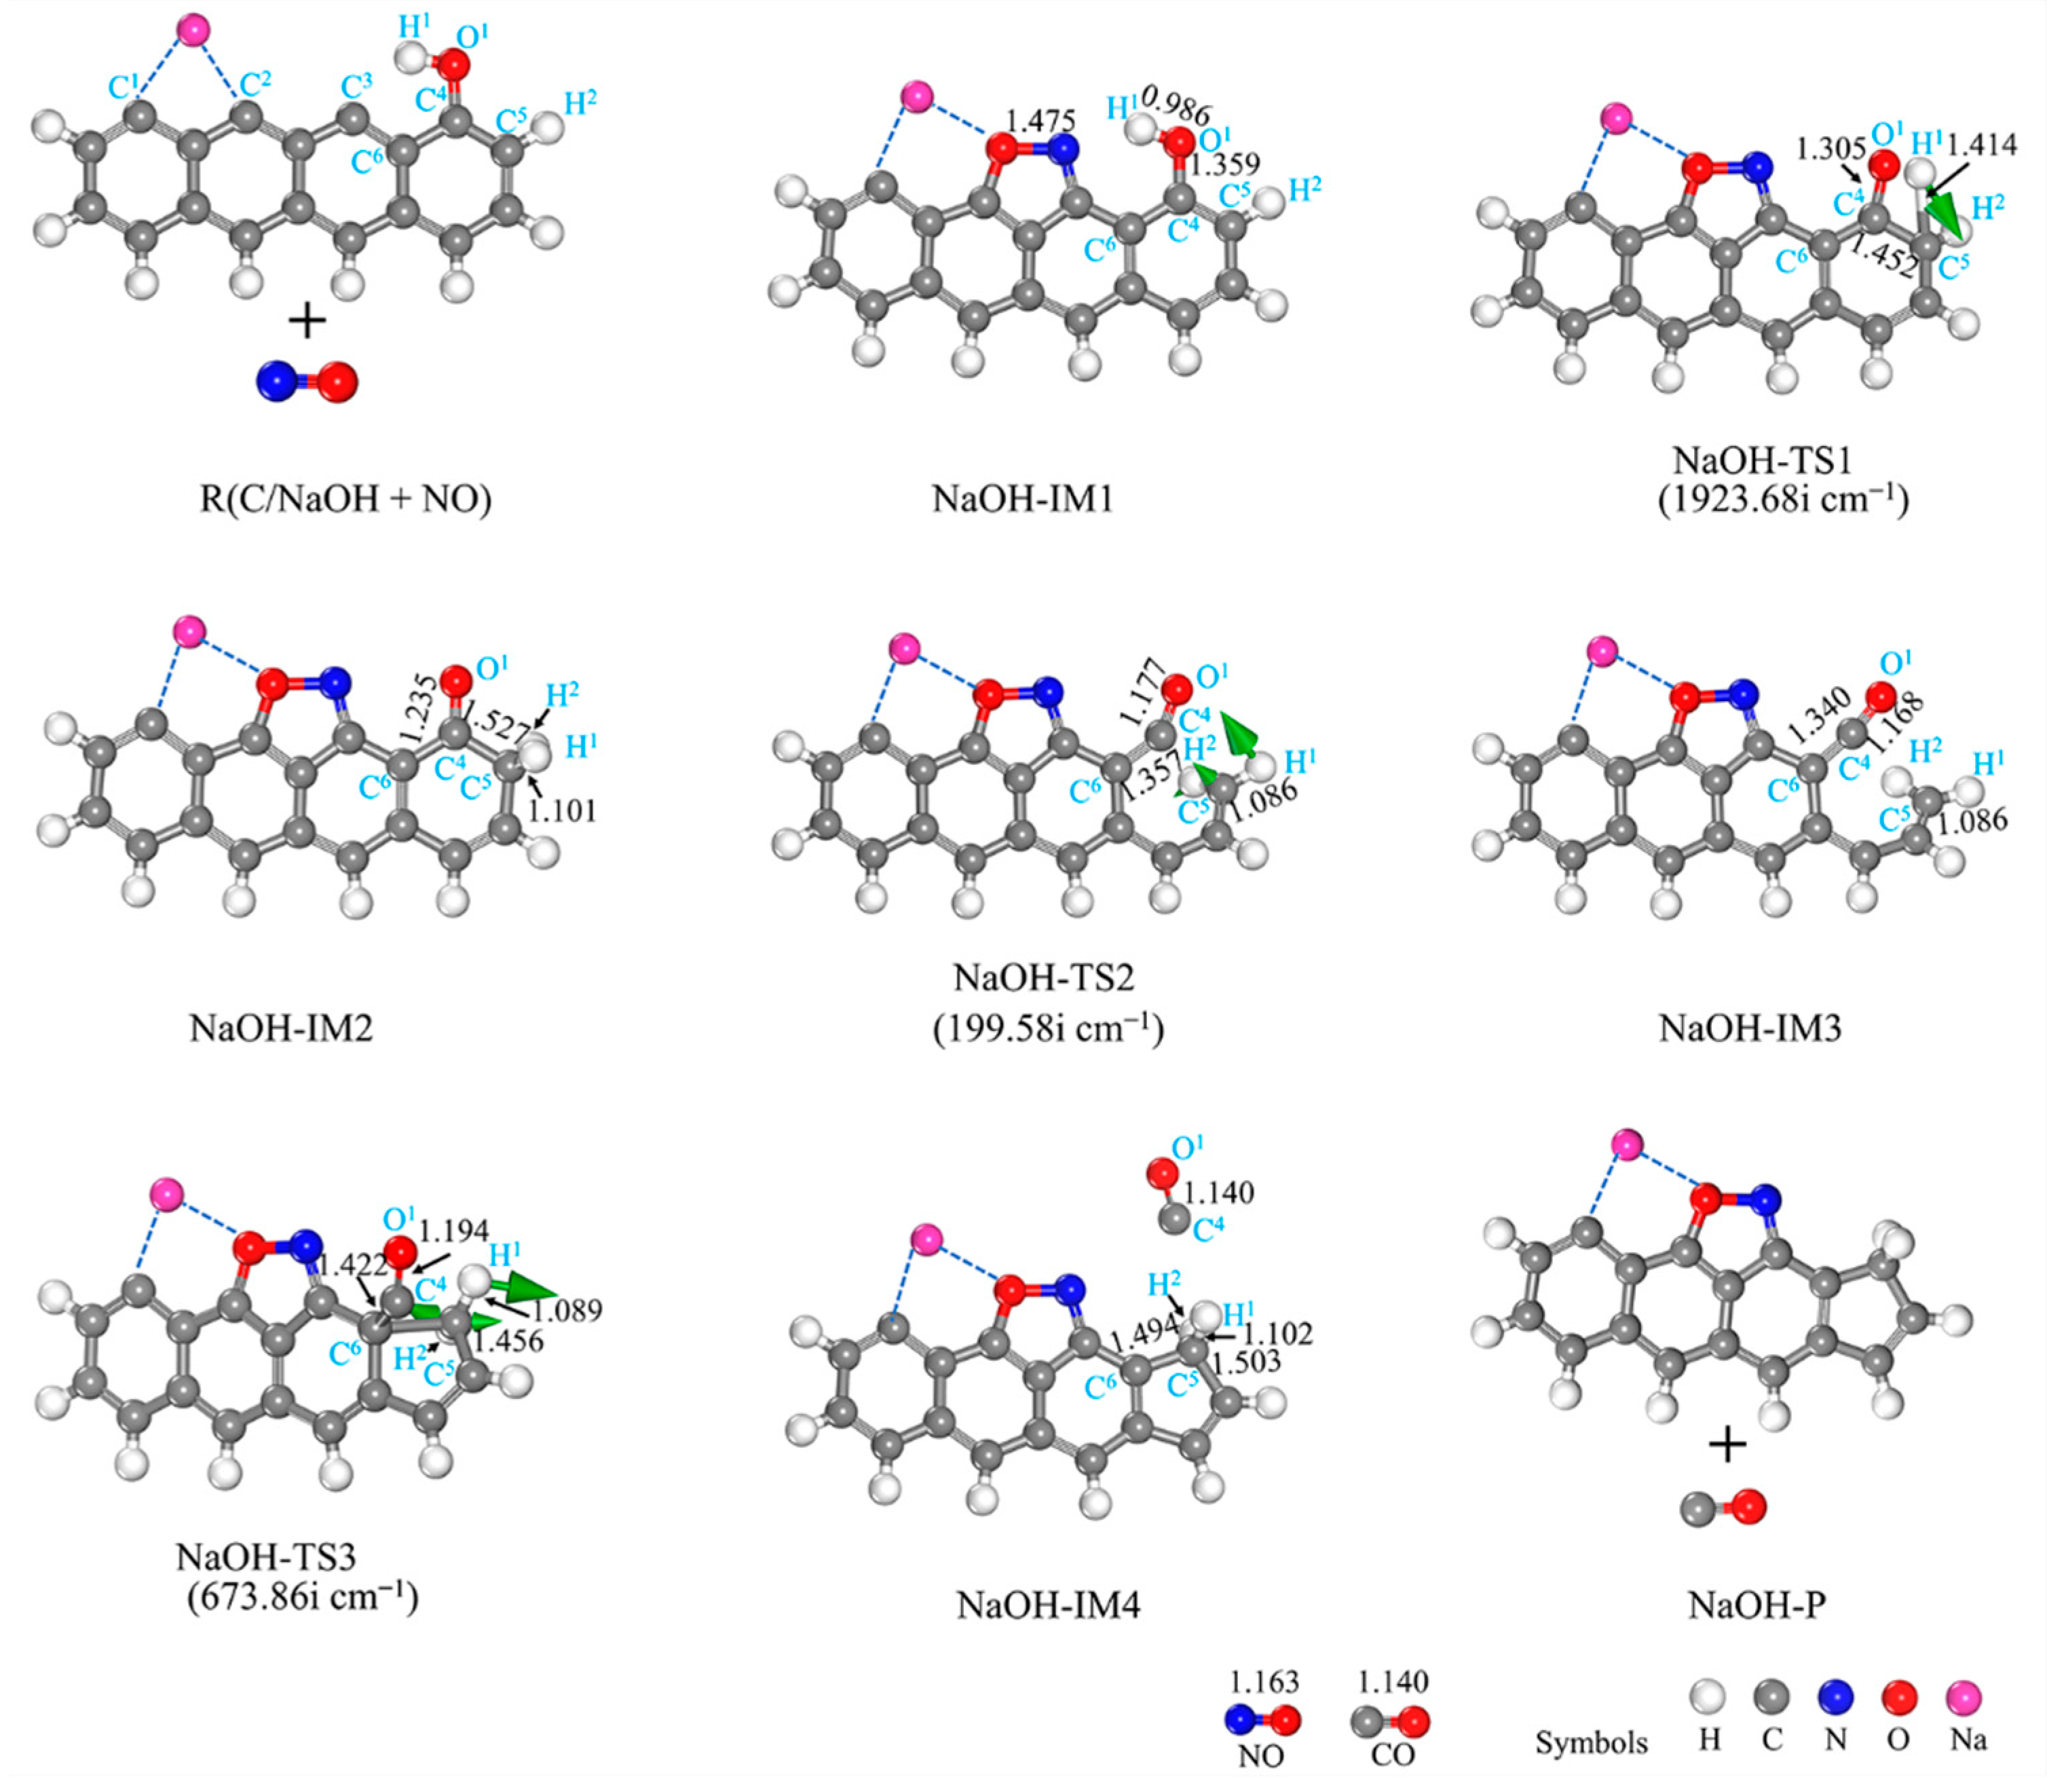
3.2.4. NaOH-Decorated Biomass
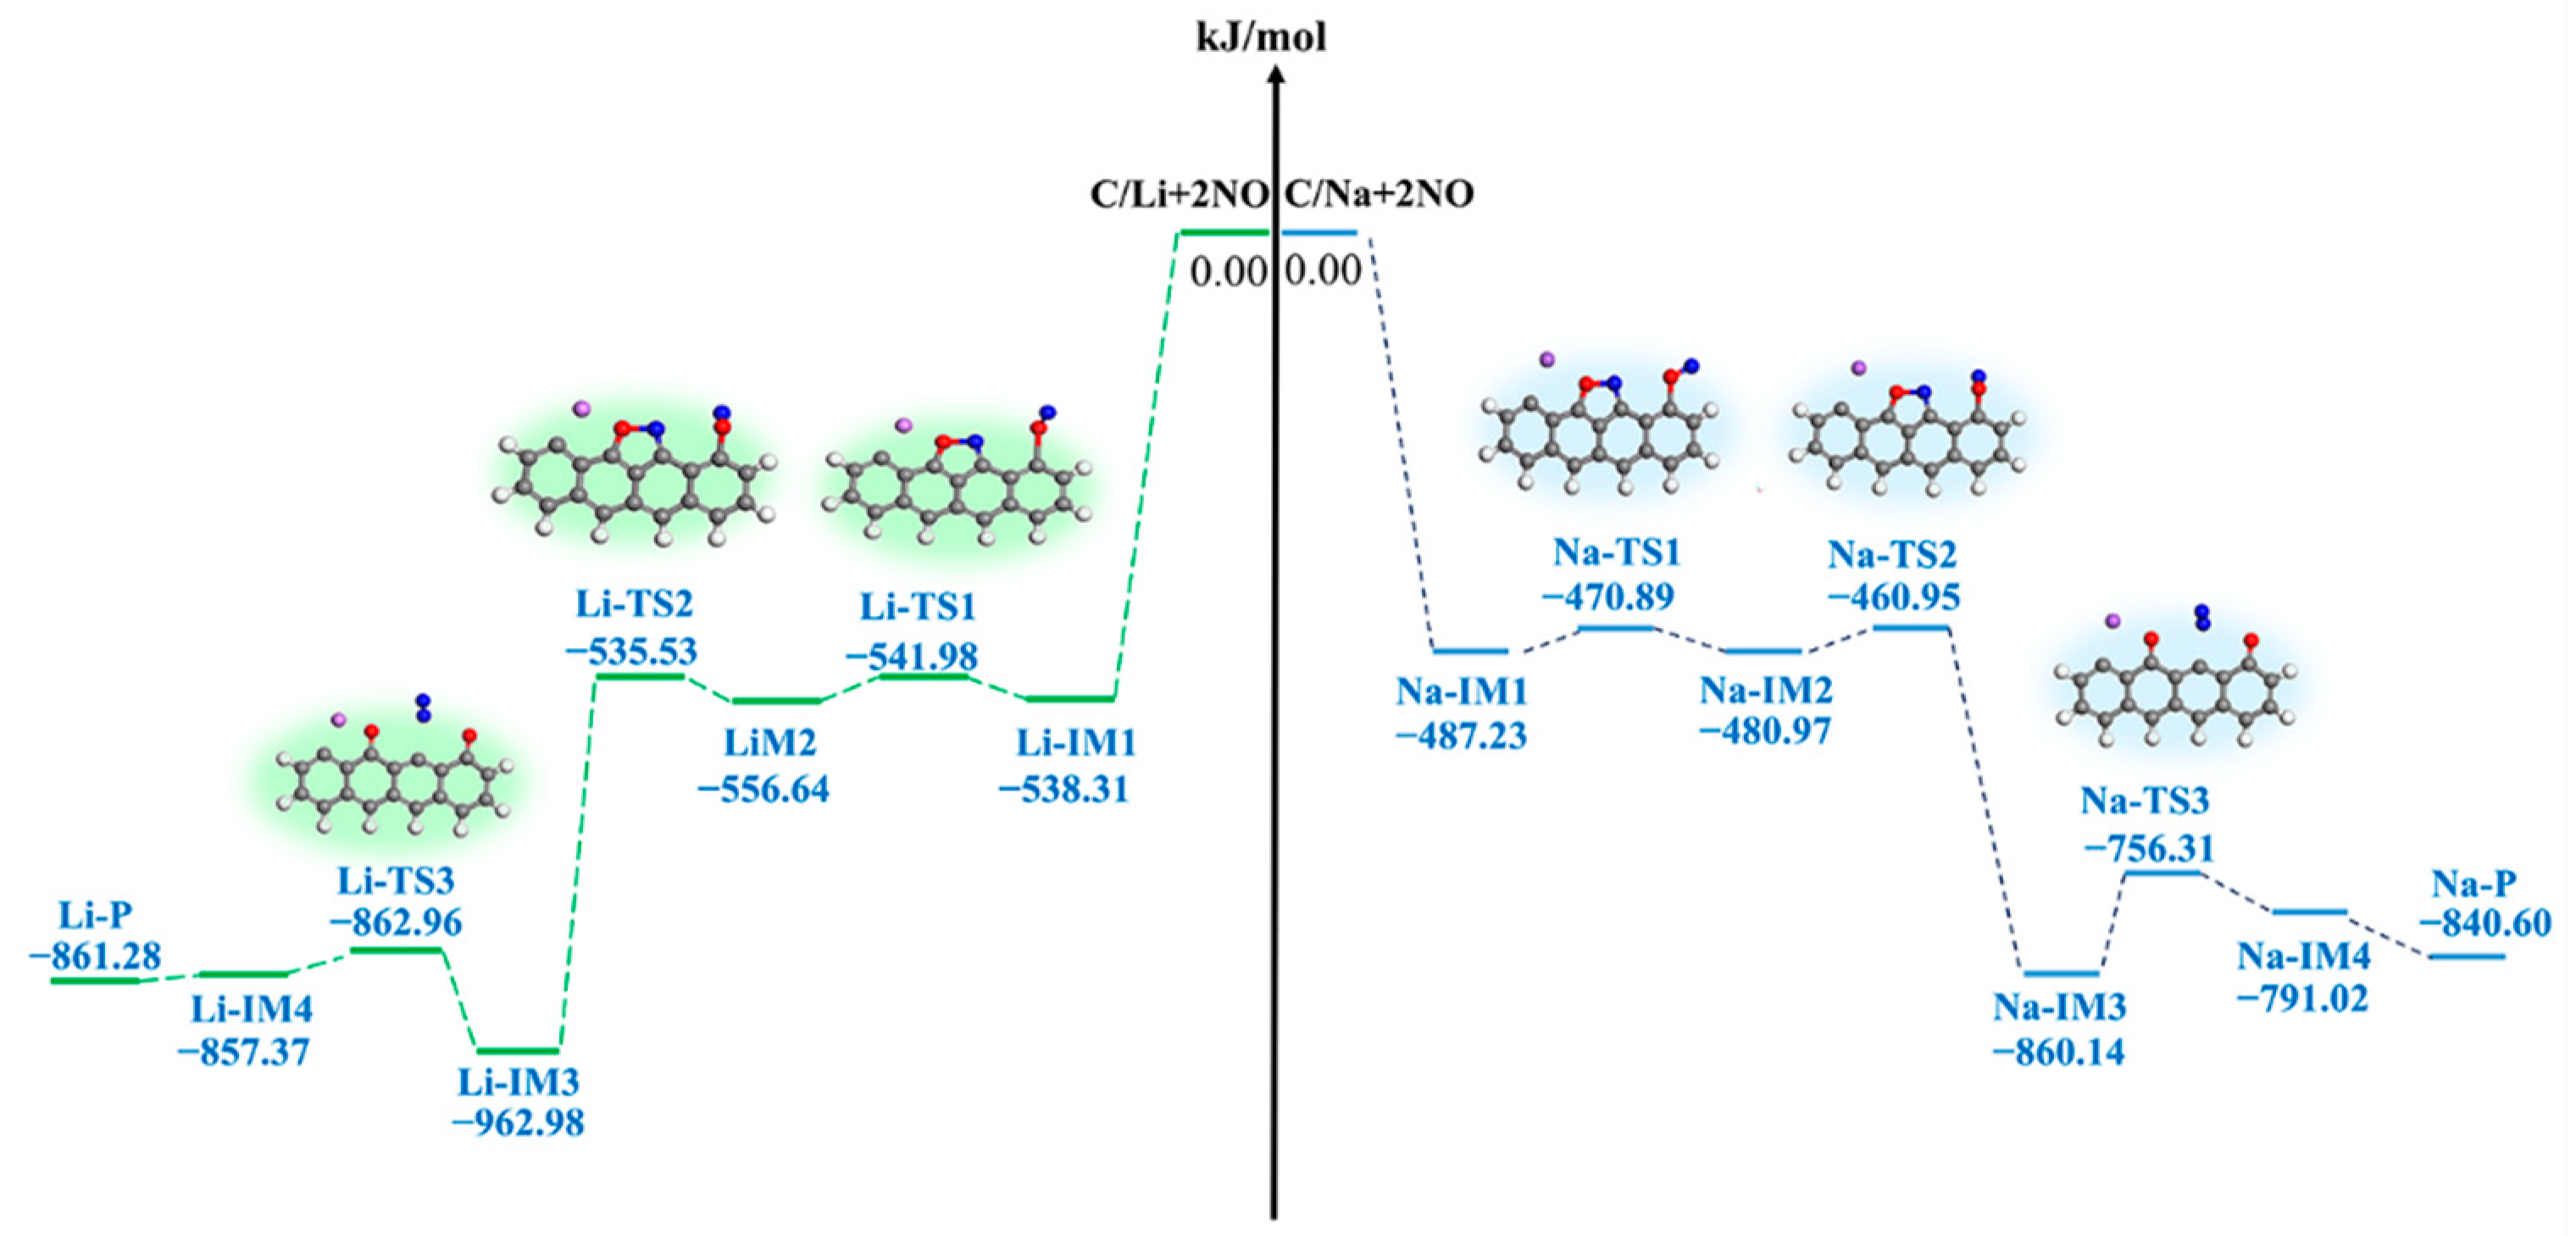
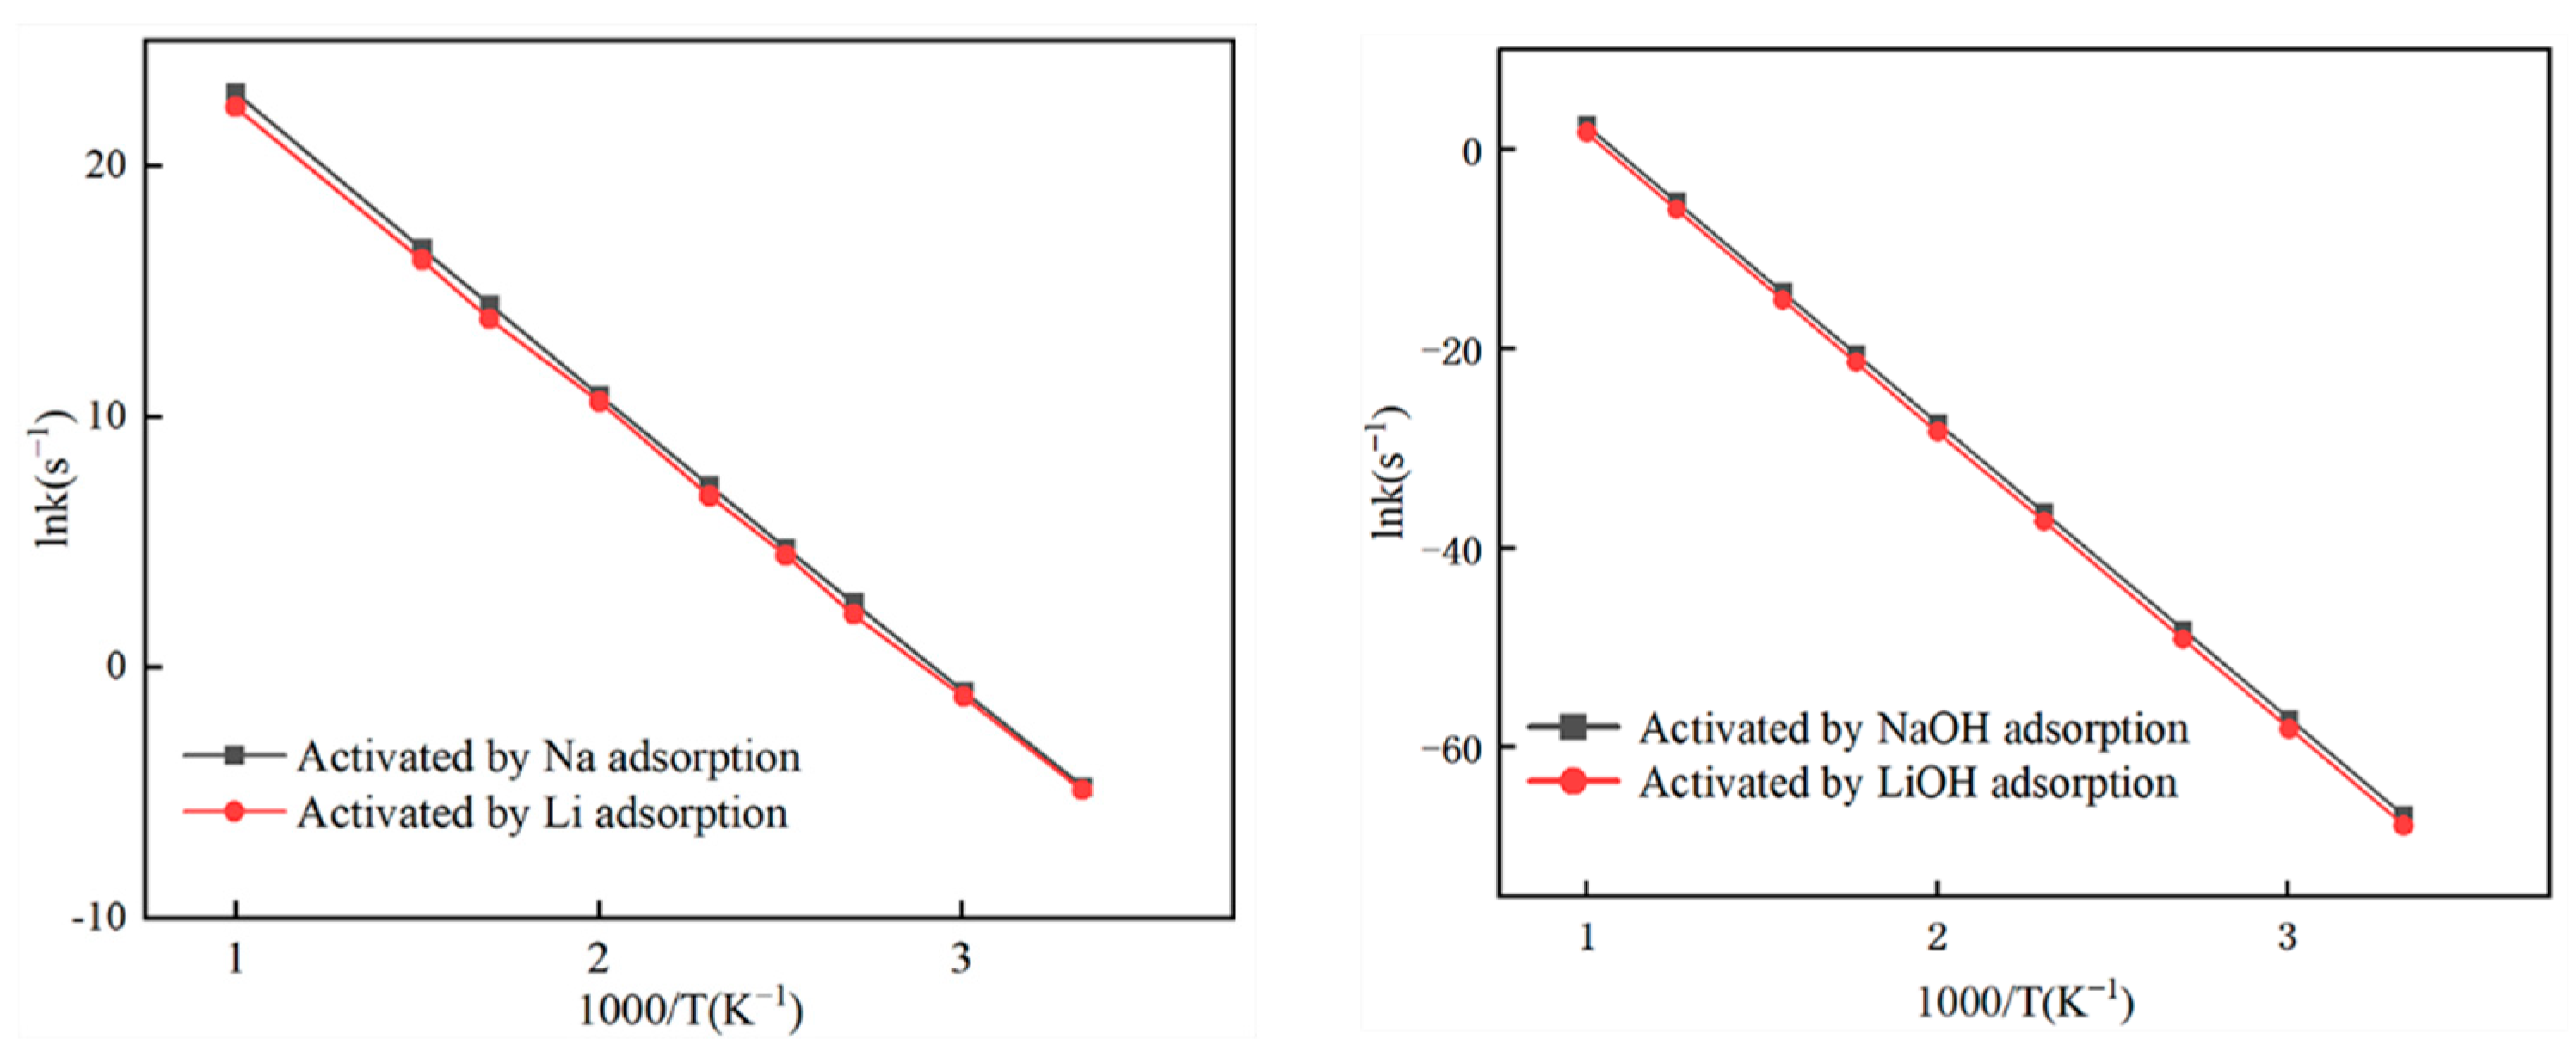
3.3. Kinetic Characteristics
4. Conclusions
Author Contributions
Funding
Data Availability Statement
Acknowledgments
Conflicts of Interest
References
- Galloway, J.N.; Dentener, F.J.; Capone, D.G.; Boyer, E.W.; Howarth, R.W.; Seitzinger, S.P.; Asner, G.P.; Cleveland, C.C.; Green, P.A.; Holland, E.A.; et al. Nitrogen cycles: Past, present, and future. Biogeochemistry 2004, 70, 153–226. [Google Scholar] [CrossRef]
- Sutton, M.A.; Oenema, O.; Erisman, J.W.; Leip, A.; van Grinsven, H.; Winiwarter, W. Too much of a good thing. Nature 2011, 472, 159–161. [Google Scholar] [CrossRef] [PubMed]
- Song, W.; Liu, X.-Y.; Hu, C.-C.; Chen, G.-Y.; Liu, X.-J.; Walters, W.W.; Michalski, G.; Liu, C.-Q. Important contributions of non-fossil fuel nitrogen oxides emissions. Nat. Commun. 2021, 12, 243. [Google Scholar] [CrossRef] [PubMed]
- Clark, C.M.; Tilman, D. Loss of plant species after chronic low-level nitrogen deposition to prairie grasslands. Nature 2008, 451, 712–715. [Google Scholar] [CrossRef] [PubMed]
- Wei, Y.; Li, D.; Qiao, J.; Guo, X. Recovery of spent SCR denitration catalyst: A review and recent advances. J. Environ. Chem. Eng. 2023, 11, 110104. [Google Scholar] [CrossRef]
- Hao, S.; Yuling, L.; Yang, J. Synthesis of Cu-BTC by room temperature hydrothermal and its low temperature SCR denitration. J. Mol. Struct. 2022, 1251, 132046. [Google Scholar] [CrossRef]
- Shi, J.; Zhang, Y.; Zhu, Y.; Chen, M.; Zhang, Z.; Shangguan, W. Efficient Fe-ZSM-5 catalyst with wide active temperature window for NH3 selective catalytic reduction of NO: Synergistic effect of isolated Fe3+ and Fe2O3. J. Catal. 2019, 378, 17–27. [Google Scholar] [CrossRef]
- Zhang, Z.; Li, J.; Tian, J.; Zhong, Y.; Zou, Z.; Dong, R.; Gao, S.; Xu, W.; Tan, D. The effects of Mn-based catalysts on the selective catalytic reduction of NOx with NH3 at low temperature: A review. Fuel Process. Technol. 2022, 230, 107213. [Google Scholar] [CrossRef]
- Van Caneghem, J.; De Greef, J.; Block, C.; Vandecasteele, C. NOx reduction in waste incinerators by selective catalytic reduction (SCR) instead of selective non-catalytic reduction (SNCR) compared from a life cycle perspective: A case study. J. Clean. Prod. 2016, 112, 4452–4460. [Google Scholar] [CrossRef]
- Yang, W.; Feng, Y.; Chen, X.; Wu, C.; Wang, F.; Gao, Z.; Liu, Y.; Ding, X.; Li, H. Understanding Trends in the NO Oxidation Activity of Single-Atom Catalysts. J. Environ. Chem. Eng. 2022, 10, 108744. [Google Scholar] [CrossRef]
- Yang, W.; Chen, L.; Zhou, B.; Jia, Z.; Liu, X.; Liu, Y.; Li, H.; Gao, Z. NO Oxidation Using H2O2 at a Single-Atom Iron Catalyst. J. Phys. Chem. C 2023, 127, 13011–13020. [Google Scholar] [CrossRef]
- Yang, M.; Liu, C.; Xu, L.; Dong, M.; Wang, Z.; Shen, B.; Kong, W.; Wang, X. Catalytic mechanism of bi-alkali-metal-doped char in heterogeneous reduction of NO: A density functional theory study. Energy 2023, 278, 127999. [Google Scholar] [CrossRef]
- Wei, J.T.; Wang, M.; Tang, G.J.; Akhtar, M.A.; Xu, D.L.; Song, X.D.; Yu, G.S.; Li, B.; Zhang, H.; Zhang, S. Advances on in-situ analysis of char structure evolution during thermochemical conversion of coal/biomass: A review. Fuel Process. Technol. 2022, 230, 107221. [Google Scholar] [CrossRef]
- Kazemi Shariat Panahi, H.; Dehhaghi, M.; Ok, Y.S.; Nizami, A.-S.; Khoshnevisan, B.; Mussatto, S.I.; Aghbashlo, M.; Tabatabaei, M.; Lam, S.S. A comprehensive review of engineered biochar: Production, characteristics, and environmental applications. Clean. Prod. 2020, 270, 122462. [Google Scholar] [CrossRef]
- Devaraja, U.M.A.; Dissanayake, C.L.W.; Gunarathne, D.S.; Chen, W.H. Oxidative torrefaction and torrefaction-based biorefining of biomass: A critical review. Biofuel Res. J. 2022, 9, 1672–1696. [Google Scholar] [CrossRef]
- Foong, S.Y.; Liew, R.K.; Yang, Y.; Cheng, Y.W.; Yek, P.N.Y.; Wan Mahari, W.A.; Lee, X.Y.; Han, C.S.; Vo, D.-V.N.; Van Le, Q.; et al. Valorization of biomass waste to engineered activated biochar by microwave pyrolysis: Progress, challenges, and future directions. Chem. Eng. J. 2020, 389, 124401. [Google Scholar] [CrossRef]
- Mishra, R.K.; Mohanty, K. Pyrolysis of low-value waste sawdust over low-cost catalysts: Physicochemical characterization of pyrolytic oil and value-added biochar. Biofuel Res. J. 2022, 9, 1736–1749. [Google Scholar] [CrossRef]
- Deng, W.; Tao, C.; Cobb, K.; Zhou, H.; Su, Y.; Ruan, R. Catalytic oxidation of NO at ambient temperature over the chars from pyrolysis of sewage sludge. Chemosphere 2020, 251, 126429. [Google Scholar] [CrossRef]
- Li, N.; Wang, Y.; Cui, S.; Jin, X. Experimental and Kinetic Investigation on NO Reduction by Rice Husk Char and Catalytically with CO. Appl. Sci. 2020, 10, 6715. [Google Scholar] [CrossRef]
- Xu, J.; Zhang, X.; Sun, Y.; Long, H.; Zheng, Z. Improvement of low-temperature NH3-SCR catalytic activity over Mn-Ce oxide catalysts supported on sewage sludge char activated with KOH and H3PO4. Korean J. Chem. Eng. 2020, 37, 2152–2160. [Google Scholar] [CrossRef]
- Shen, B.; Chen, J.; Yue, S.; Li, G. A comparative study of modified cotton biochar and activated carbon based catalysts in low temperature SCR. Fuel 2015, 156, 47–53. [Google Scholar] [CrossRef]
- Chen, L.; Ren, S.; Liu, W.; Yang, J.; Chen, Z.; Wang, M.; Liu, Q. Low-temperature NH3-SCR activity of M (M = Zr, Ni and Co) doped MnO supported biochar catalysts. J. Environ. Chem. Eng. 2021, 9, 106504. [Google Scholar] [CrossRef]
- Gong, Q.-C.; He, L.-Q.; Zhang, L.-H.; Duan, F. Comparison of the NO heterogeneous reduction characteristics using biochars derived from three biomass with different lignin types. J. Environ. Chem. Eng. 2021, 9, 105020. [Google Scholar] [CrossRef]
- Jo, Y.B.; Cha, J.S.; Ko, J.H.; Shin, M.C.; Park, S.H.; Jeon, J.-K.; Kim, S.-S.; Park, Y.-K. NH3 selective catalytic reduction (SCR) of nitrogen oxides (NOx) over activated sewage sludge char. Korean J. Chem. Eng. 2011, 28, 106–113. [Google Scholar] [CrossRef]
- Wang, Y.; Qin, N.; Cui, S.; Ma, X.; Peng, S. Influence of Biochar Composition and Micro-Structure on the Denitration of Flue Gases at High Temperature. Appl. Sci. 2020, 10, 1920. [Google Scholar] [CrossRef]
- Li, Q.; Hou, Y.; Wang, J.; Liu, Y.; Xiang, N.; Huang, Z. Superiority of Raw Biomass and Potassium Hydroxide in Preparation of Ultrahigh Nitrogen Doping of Carbon for NH3-SCR Reaction. ACS Sustain. Chem. Eng. 2020, 8, 11308–11316. [Google Scholar] [CrossRef]
- Chen, H.; Chen, D.; Hong, L.; Dou, X. Recycle Sewage Sludge Char as Flue Gas De-NOx Catalyst within Low Temperature Ranges. Energy Procedia 2015, 66, 45–48. [Google Scholar] [CrossRef]
- Jia, X.; Peng, R.; Huang, H.; Dan, J.; Lu, M.; Zhang, D.; Wang, J.; Li, D.; Fang, H.; Yu, C. Lotus leaves-derived MnOx/biochar as an efficient catalyst for low-temperature NH3-SCR removal of NOx: Effects of modification methods of biochar. J. Chem. Technol. Biotechnol. 2022, 97, 3100–3110. [Google Scholar] [CrossRef]
- Jongha, L.; Hoyeon, L.; Seungryong, C. Sinogram synthesis using convolutional-neural-network for sparsely view-sampled CT. Proc. SPIE 2018, 10574, 105742A. [Google Scholar]
- Chen, H.; Chen, D.; Hong, L. Influences of activation agent impregnated sewage sludge pyrolysis on emission characteristics of volatile combustion and De-NOx performance of activated char. Appl. Energy 2015, 156, 767–775. [Google Scholar] [CrossRef]
- Gao, Z.; Li, M.; Sun, Y.; Yang, W. Effects of oxygen functional complexes on arsenic adsorption over carbonaceous surface. J. Hazard. Mater. 2018, 360, 436–444. [Google Scholar] [CrossRef] [PubMed]
- Gao, Z.; Zhao, M.; Yan, G.; Huang, H.; Yang, W.; Ding, X.; Wu, C.; Gates, l.D. Identifying the active sites of carbonaceous surface for the adsorption of gaseous arsenic trioxide: A theoretical study. Chem. Eng. J. 2020, 402, 125800. [Google Scholar] [CrossRef]
- Yan, G.; Gao, Z.; Zhao, M.; Yang, W.; Ding, X. A comprehensive exploration of mercury adsorption sites on the carbonaceous surface: A DFT study. Fuel 2020, 282, 118781. [Google Scholar] [CrossRef]
- Zhang, H.; Song, H.; Yuan, R.; Zhang, X.; Yu, H.; Zhao, Y.; Jiang, T. Polyene phosphatidylcholine overcomes oxaliplatin resistance in human gastric cancer BGC823 cells. Biochem. Biophys. Res. Commun. 2018, 497, 108–114. [Google Scholar] [CrossRef] [PubMed]
- Yang, W.; Gao, Z.; Liu, X.; Ma, C.; Ding, X.; Yan, W. Directly catalytic reduction of NO without NH3 by single atom iron catalyst: A DFT calculation. Fuel 2019, 243, 262–270. [Google Scholar] [CrossRef]
- Feng, K.; Hu, Y.; Cao, T. Mechanism of Fuel Gas Denitration on the KOH-Activated Biochar Surface. J. Phys. Chem. A 2022, 126, 296–305. [Google Scholar] [CrossRef] [PubMed]
- Zhang, X.-X.; LÜ, X.-X.; Wu, H.-X.; Xie, M.; Lin, R.-Y.; Zhou, Z.-J. Microscopic mechanism for effect of sodium on NO heterogeneous reduction by char. J. Fuel Chem. Technol. 2020, 48, 663–673. [Google Scholar] [CrossRef]
- Chen, P.; Gu, M.; Chen, G.; Liu, F.; Lin, Y. DFT study on the reaction mechanism of N2O reduction with CO catalyzed by char. Fuel 2019, 254, 115666. [Google Scholar] [CrossRef]
- Li, Y.; Niu, S.-L.; Wang, Y.-Z.; Han, K.-H.; Zhou, W.-B.; Wang, J. Mechanism of N2O reduction by biomass gasification gas reburning. J. Fuel Chem. Technol. 2021, 49, 1435–1443. [Google Scholar] [CrossRef]
- Zhang, X.; Xie, M.; Wu, H.; Lv, X.; Zhou, Z. DFT study of the effect of Ca on NO heterogeneous reduction by char. Fuel 2020, 265, 116995. [Google Scholar] [CrossRef]
- Perry, S.T.; Hambly, E.M.; Fletcher, T.H.; Solum, M.S.; Pugmire, R.J. Solid-state 13C NMR characterization of matched tars and chars from rapid coal devolatilization. Proc. Combust. Inst. 2000, 28, 2313–2319. [Google Scholar] [CrossRef]
- Feng, K.; Hu, Y.; Cao, T. Effect of K-decoration on the generation and reduction of N2O onto a biochar surface. Fuel 2022, 316, 123148. [Google Scholar] [CrossRef]
- Liu, J.; Xia, Y.-g.; Sun, H.-d.; Hu, B.; Zhang, B.; Lu, Q. Insight into the fate of nitrogen during char thermal conversion and the influence mechanism of potassium: A theoretical research. Sci. Total Environ. 2024, 912, 168880. [Google Scholar] [CrossRef] [PubMed]
- Chen, P.; Gu, M.; Chen, X.; Chen, J. Study of the reaction mechanism of oxygen to heterogeneous reduction of NO by char. Fuel 2019, 236, 1213–1225. [Google Scholar] [CrossRef]
- Yang, J.; Yuan, S.; Wang, S.; Yang, M.; Shen, B.; Zhang, Q.; Zhang, Z.; Wang, F.; Xu, L.; Wang, Z. Density Functional Theory Study on the Effect of Sodium on the Adsorption of NO on a Char Surface. Energy Fuels 2020, 34, 8726–8731. [Google Scholar] [CrossRef]
- Yang, J.; Chen, L.; Su, J.; Huang, Y.; Zhang, M.; Gao, M.; Yang, M.; Yuan, S.; Wang, X.; Shen, B. Mechanism on the effect of sodium on the heterogeneous reduction reaction of NO by Char(N). Fuel 2022, 321, 124065. [Google Scholar] [CrossRef]
- Liu, X.D.; Wei, Q.; Huang, W.B.; Zhou, Y.S.; Zhang, P.F.; Xu, Z.S. DFT insights into the stacking effects on HDS of 4,6-DMDBT on Ni-Mo-S corner sites. Fuel 2020, 280, 118669. [Google Scholar] [CrossRef]
- Liu, X.D.; Ding, S.J.; Wei, Q.; Zhou, Y.S.; Zhang, P.F.; Xu, Z.S. DFT insights in to the hydrodenitrogenation behavior differences between indole and quinoline. Fuel 2021, 285, 119039. [Google Scholar] [CrossRef]
- Wu, C.C.; Yang, W.J.; Wang, J.Y.; Kannaiyan, R.; Gates, I.D. CO2 adsorption and dissociation on single and double iron atomic molybdenum disulfide catalysts: A DFT study. Fuel 2021, 305, 121547. [Google Scholar] [CrossRef]
- Accelrys Inc. Malerials Studio Version 8.0; Accelrys Inc.: San Diego, CA, USA, 2014. [Google Scholar]
- Parr, R.G.; Yang, W.T. Density functional-approach to the frontier-electron theory of chemical-reactivity. J. Am. Chem. Soc. 1984, 106, 4049–4050. [Google Scholar] [CrossRef]
- Murray, J.S.; Politzer, P. The electrostatic potential: An overview. Wires Comput. Mol. Sci. 2011, 1, 153–163. [Google Scholar] [CrossRef]
- Lu, T.; Chen, Q.X. Shermo: A general code for calculating molecular thermochemistry properties. Comput. Theor. Chem. 2021, 1200, 113249. [Google Scholar] [CrossRef]
- Ruiz-Morales, Y. HOMO-LUMO gap as an index of molecular size and structure for polycyclic aromatic hydrocarbons (PAHs) and asphaltenes: A theoretical study. I. J. Phys. Chem. A 2002, 106, 11283–11308. [Google Scholar] [CrossRef]
- Liu, J.; Xia, Y.-G.; Wu, Y.-W.; Zhou, X.-Y.; Hu, B.; Lu, Q. Microscopic mechanism for the effect of potassium on heterogeneous NO–char(N) interaction: A theoretical account. Fuel Process. Technol. 2023, 242, 107657. [Google Scholar] [CrossRef]
- Ke, X.; Jiang, L.; Li, Y.; Yang, H.; Lyu, J.; Zhang, M. A comprehensive study of char reaction kinetics: Does CO always promote NO reduction on char surface? Fuel 2022, 310, 122440. [Google Scholar] [CrossRef]

| Li-Decorated | Na-Decorated | LiOH-Decorated | NaOH-Decorated | |
|---|---|---|---|---|
| Activation energy (kJ/mol) | 95.44 | 93.80 | 243.96 | 243.51 |
| Pre-exponential factor A (s−1) | 2.70 × 10¹⁴ | 1.80 × 10¹⁴ | 1.19 × 10¹³ | 2.31 × 10¹³ |
Disclaimer/Publisher’s Note: The statements, opinions and data contained in all publications are solely those of the individual author(s) and contributor(s) and not of MDPI and/or the editor(s). MDPI and/or the editor(s) disclaim responsibility for any injury to people or property resulting from any ideas, methods, instructions or products referred to in the content. |
© 2024 by the authors. Licensee MDPI, Basel, Switzerland. This article is an open access article distributed under the terms and conditions of the Creative Commons Attribution (CC BY) license (https://creativecommons.org/licenses/by/4.0/).
Share and Cite
Su, Q.; Ren, F.; Lu, M.; Zhao, J.; Zhu, X.; Shen, T.; Shen, Y.; Wang, Y.; Liang, J. Theoretical Study of the NO Reduction Mechanism on Biochar Surfaces Modified by Li and Na Single Adsorption and OH Co-Adsorption. Molecules 2024, 29, 574. https://doi.org/10.3390/molecules29030574
Su Q, Ren F, Lu M, Zhao J, Zhu X, Shen T, Shen Y, Wang Y, Liang J. Theoretical Study of the NO Reduction Mechanism on Biochar Surfaces Modified by Li and Na Single Adsorption and OH Co-Adsorption. Molecules. 2024; 29(3):574. https://doi.org/10.3390/molecules29030574
Chicago/Turabian StyleSu, Qiong, Fang Ren, Mengmeng Lu, Jinqin Zhao, Xingchen Zhu, Tao Shen, Yan Shen, Yanbin Wang, and Junxi Liang. 2024. "Theoretical Study of the NO Reduction Mechanism on Biochar Surfaces Modified by Li and Na Single Adsorption and OH Co-Adsorption" Molecules 29, no. 3: 574. https://doi.org/10.3390/molecules29030574