Article

A Turn-On Fluorescent Probe for Highly Selective Detection and Visualization of Hydrogen Sulfide in Fungi

1
School of Medicine, College of Pharmacy, Nanjing University of Chinese Medicine, Nanjing 210023, China
2
State Key Laboratory of Fine Chemicals, Dalian University of Technology, Dalian 116024, China
3
Second Affiliated Hospital, Dalian Medical University, Dalian 116023, China
4
College of Pharmacy, College of Integrative Medicine, Dalian Medical University, Dalian 116044, China
*
Authors to whom correspondence should be addressed.
These authors contributed equally to this work.
Molecules 2024, 29(3), 577; https://doi.org/10.3390/molecules29030577
Submission received: 7 December 2023 / Revised: 13 January 2024 / Accepted: 18 January 2024 / Published: 24 January 2024
(This article belongs to the Section Analytical Chemistry)

Abstract

:
Hydrogen sulfide (H2S) is a significant actor in the virulence and pathogenicity of fungi. The analysis of endogenous H2S in fungi benefits the prevention and treatment of pathogenic infections. Herein, a H2S-activated turn-on fluorescent probe named DDX-DNP was developed for the sensitive and selective detection of H2S. Using DDX-DNP, the ability of several oral fungi strains to produce H2S was identified, which was also validated using a typical chromogenic medium. In addition, DDX-DNP was successfully used for the visual sensing of endogenous H2S in fungal cells via microscope, flow cytometry, and colony imaging, along with a specific validation with the co-incubation of H2S production inhibitors in living cells. Above all, DDX-DNP could be used for H2S detection, the fluorescent imaging of fungi, and even the identification of related fungi.

Graphical Abstract

1. Introduction

Hydrogen sulfide (H2S) was the third important signaling gas molecule discovered in the body, after carbon monoxide (CO) and nitric oxide (NO), and it has an unpleasant smell of rotten eggs [1,2]. Generally, H2S can be produced by enzymatic or non-enzymatic reactions. Now, several main enzymes related to the production of H2S have been characterized in mammals and bacteria, such as cystathionine-γ-lyase (CSE), cystathionine-β-synthase (CBS), cysteine aminotransferase (CAT), and 3-mercaptopyruvate sulfurtransferase (3-MST) [3,4,5,6]. CSE and CBS produce H2S through the condensation of homocysteine and cysteine or the α,β-elimination of cysteine, while 3-MST reductively converts 3-mercaptopyruvate to H2S [2,4,5]. In particular, in Candida albicans, CYS4 is annotated as encoding CBS for the synthesis of H2S in the Candida Genome Database [4]. On the other hand, polysulfides and glutathione could be converted to H2S via the non-enzymatic pathway [6]. As a well-known endogenous gas molecule, H2S has been known to exert all kinds of biological functions, such as relaxing vascular smooth muscles, mediating neuronal transmission, and regulating inflammation [7,8,9]. However, an abnormal level of H2S in biosystems could induce an array of malignant diseases including Down Syndrome, Alzheimer’s disease, and diabetes, as well as accelerate the proliferation and migration of cancer cells [10,11,12,13,14]. In addition, H2S, a volatile sulfur compound, is also one of the main causes of oral malodor [15]. Excessive H2S may also irritate the eyes and respiratory tract, resulting in the severe loss of consciousness, respiratory failure, and even death [16].
Given the biological importance of H2S, in the past few years, several methods have been reported for H2S detection and analysis, such as colorimetry, electrochemical assay, and gas chromatography [17,18,19]. Unfortunately, few of these techniques are suitable for living systems or for the in situ monitoring and analysis of H2S. On the contrary, compared with the traditional methods, small molecular fluorescent probes have attracted considerable attention because of their inherent advantages, for example, excellent selectivity, high sensitivity, real-time monitoring, nondestructive visualization, convenience, and so on [20,21,22,23,24,25].
Some fluorescent probes have been developed for the detection of H2S based on a variety of strategies, such as (1) azides and nitro compounds being reduced to amines, (2) the Michael addition reaction of the H2S-specific cleavage of the disulfide bond, nucleophilic reaction, and thiolysis reaction, and (3) the H2S-induced metal displacement approach and the metal indicator displacement approach [26,27,28,29,30,31]. These probes can image H2S in living cells, tissue, and blood samples in vivo, even in subcellular targeting location analysis [32,33,34,35]. Although great advancements have been made, unfortunately, none of them has been used in microorganisms, including for fungi detection and analysis. Hence, the design and synthesis of a highly selective fluorescent probe for monitoring H2S in fungi is of great importance and urgently desirable to better understand the detailed physiological and pathological effects of H2S.
In view of this, we designed and synthesized a fluorescent probe named DDX-DNP for the detection of H2S in fungi based on the thiolysis of the dinitrophenyl ether strategy [31,36,37]. Further research shows that the probe DDX-DNP has excellent optical performance, including biological applicability and good selectivity. More importantly, this probe successfully performed the visual sensing of endogenous H2S in fungi. To the best of our knowledge, this technique is a pioneering and effective tool for assessing H2S changes in the field of pathogenic infections.

2. Results and Discussion

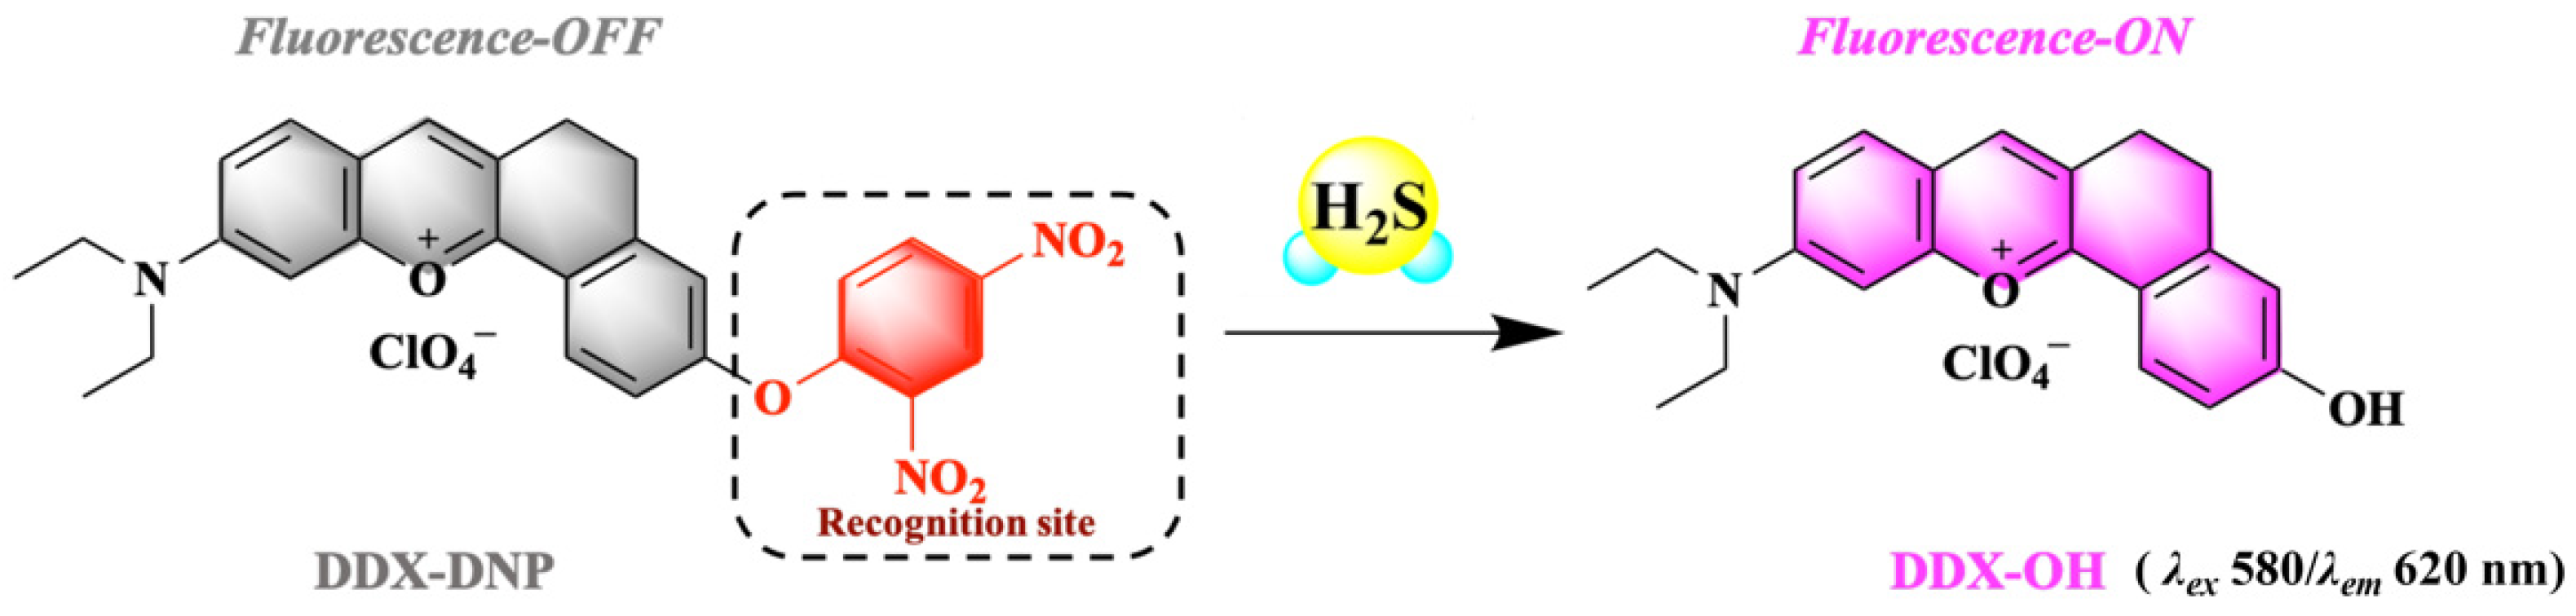
2.1. Design of DDX-DNP and H2S Response

To achieve the detection and imaging of H2S, in consideration of its dual nucleophilicity toward H2S, we introduced the 2,4-dinitrophenyl (DNP) group, which not only acts as a recognition site but also an effective fluorescence quencher [36]. The final structure of the designed fluorescent probe is shown in Scheme 1. In the absence of H2S, the probe DDX-DNP exhibited a weak fluorescence signal. When DDX-DNP reacted with H2S, the DNP group was removed from DDX-DNP so as to release the DDX-OH, exhibiting a remarkable fluorescence signal at 620 nm. Thus, H2S was detected qualitatively by recording the fluorescence intensity changes from probe DDX-DNP to the fluorophore, DDX-OH.

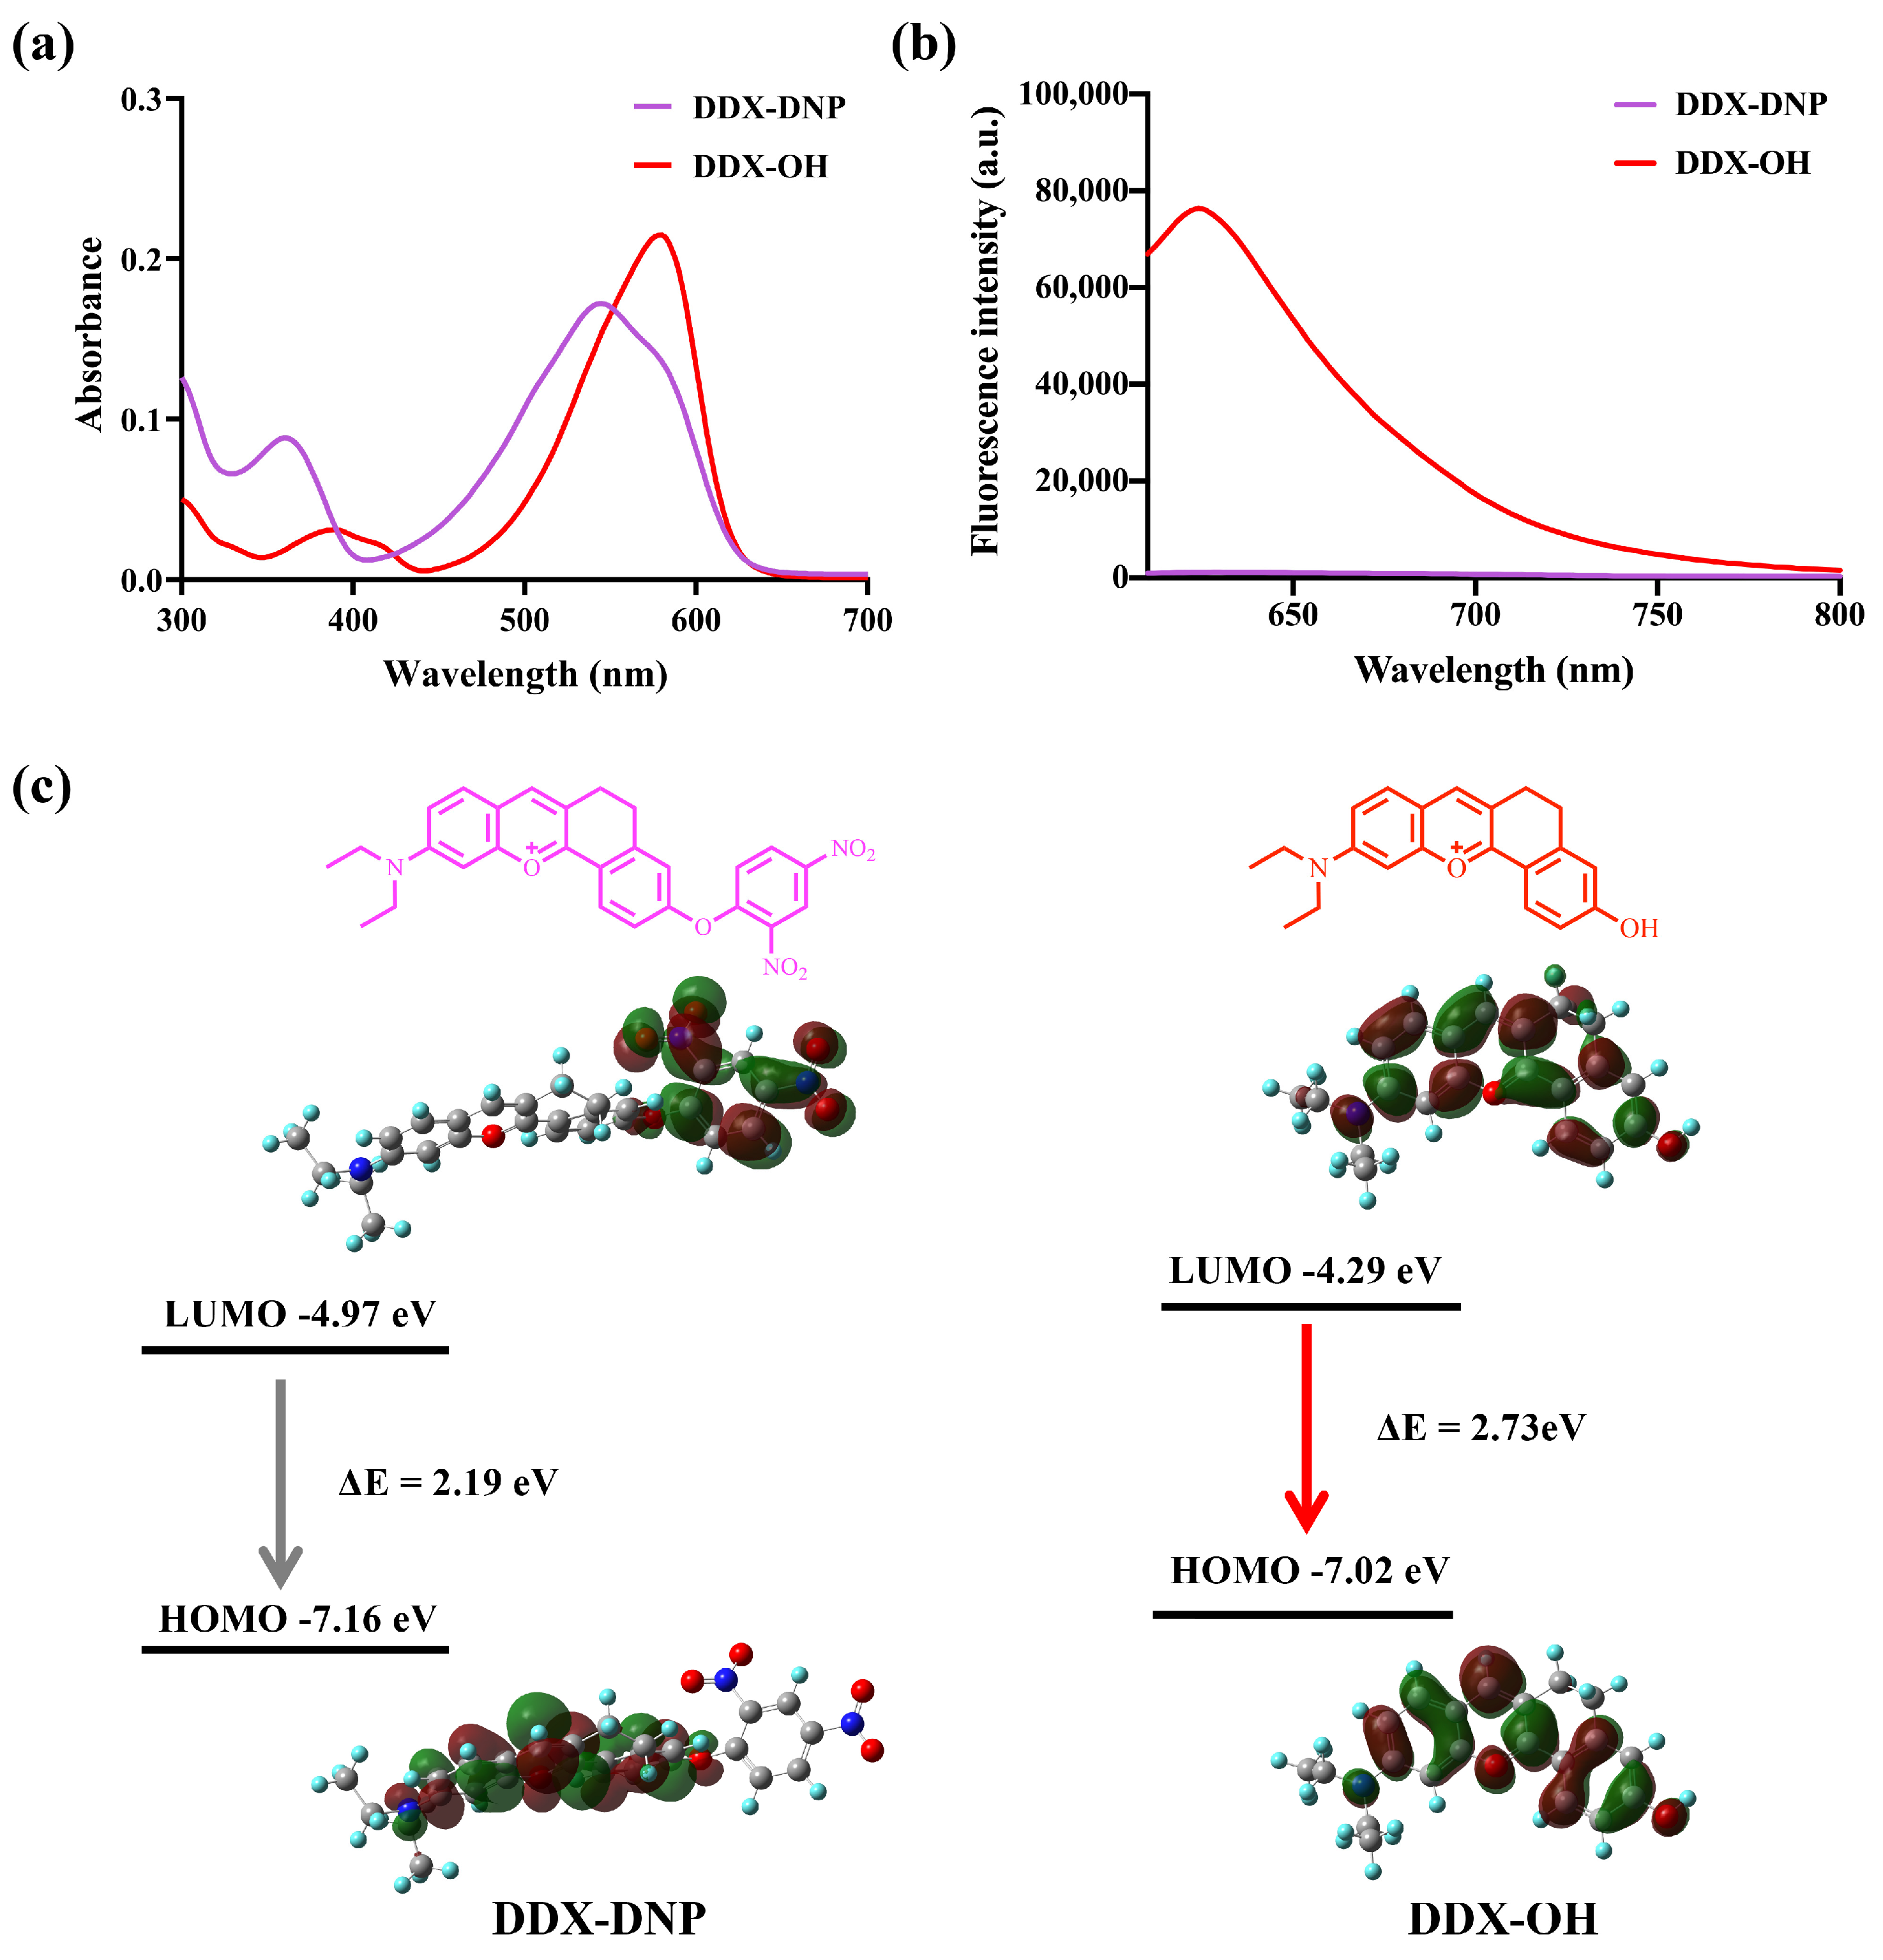
2.2. Spectral Characteristics and DFT Calculations of DDX-DNP and DDX-OH

In order to evaluate the detection properties of DDX-DNP, first, the optical spectral characteristics of DDX-DNP and the product, DDX-OH, were recorded using UV-vis absorbance and fluorescence spectroscopy. As shown in Figure 1a, DDX-DNP and DDX-OH displayed the maximum absorbance at 540 nm and 580 nm, respectively. Excited by laser at 580 nm, DDX-OH showed a strong fluorescence intensity at 620 nm, while DDX-DNP showed no fluorescence signal (Figure 1b). In addition, we also recorded the absorbance spectra of DDX-DNP at different concentrations (0–10 μM), and a good linear relationship was observed between the DDX-DNP concentrations and the absorbance values (Figure S1).
In order to gain a better insight into the fluorescence response behavior of DDX-DNP from the perspective of the molecular orbital, the geometries of DDX-DNP and DDX-OH were optimized, and their frontier relevant molecular energy levels were calculated as shown in Figure 1c [36,38]. The π electrons on the HOMO level of fluorescent probe DDX-DNP were mainly concentrated on the dihydrobenzo[c]xanthen skeleton. In contrast, on the LUMO level, these electrons were mainly distributed in the DNP group. This phenomenon means that a possible photoinduced electron transfer (PET) process occurs in DDX-DNP; the electron transfer from the dihydroben-zo[c]xanthen skeleton to the DNP group leads to a fluorescence “turn off” state. Nevertheless, the π electrons of the DDX-OH fluorophore were mainly delocalized in the whole-molecule skeleton on both the LUMO and HOMO levels, which resulted in a typical intramolecular charge transfer (ICT) process, and the strong fluorescence signal was “turned on”. In addition, the calculated energy gaps (LUMO → HOMO) of DDX-DNP and DDX-OH were 2.19 eV and 2.73 eV, respectively.
Next, the fluorescence response of DDX-DNP toward H2S at different concentrations (0–100 μM) was also investigated. As can be seen in Figure 2a, along with the addition of incremental amounts of H2S, the fluorescence intensity enhancement at 620 nm, in a concentration-dependent manner, was observed clearly, which indicated that the DNP moiety was cut off by H2S to induce a dramatic and rapid fluorescence turn-on response. A point worth emphasizing is that a good linear relationship (R2 = 0.9937) was observed between the H2S concentrations and the fluorescence intensity at 620 nm (Figure 2b). Furthermore, we measured the visual fluorescence images with a series of concentrations for H2S (0–100 μM) and DDX-OH (0–1 μM) in 96 plates, which showed that the fluorescence intensity gradually increased with the increasing H2S concentration (Figure 2c,d), indicating the potential visual detection of H2S. Above all, DDX-DNP could be activated by H2S, suggesting its application as a turn-on fluorescent probe for H2S.
On the other hand, the fluorescence response of DDX-DNP toward H2S with different incubation times, in the range of 0–180 min, was also explored. With the increase in incubation time, the fluorescence intensity at 620 nm showed an increasing tendency, and it appeared to be flat after 120 min (Figure 3). Therefore, we finally identified 100 μM of H2S and an incubation time of 60 min as the key factors for the H2S fluorescence detection system based on the above results. In addition, kinetic analysis (Figure S3) revealed that the apparent rate constant k′ for the reaction of DDX-DNP with H2S was 0.023 min−1, and the pseudo-first-order rate constant k for the reaction of DDX-DNP with H2S was 0.23 M−1 min−1.
Job’s Plot [39] was generated by continuously varying the mole fraction of NaHS from 0 to 1 in a solution of NaHS + DDX-DNP with a total concentration of 100 μM. The fluorescence intensity became the strongest when the molar fraction of NaHS was 0.5, which indicated that the binding stoichiometry between probe DDX-DNP and NaHS is 1:1 (Figure S4).

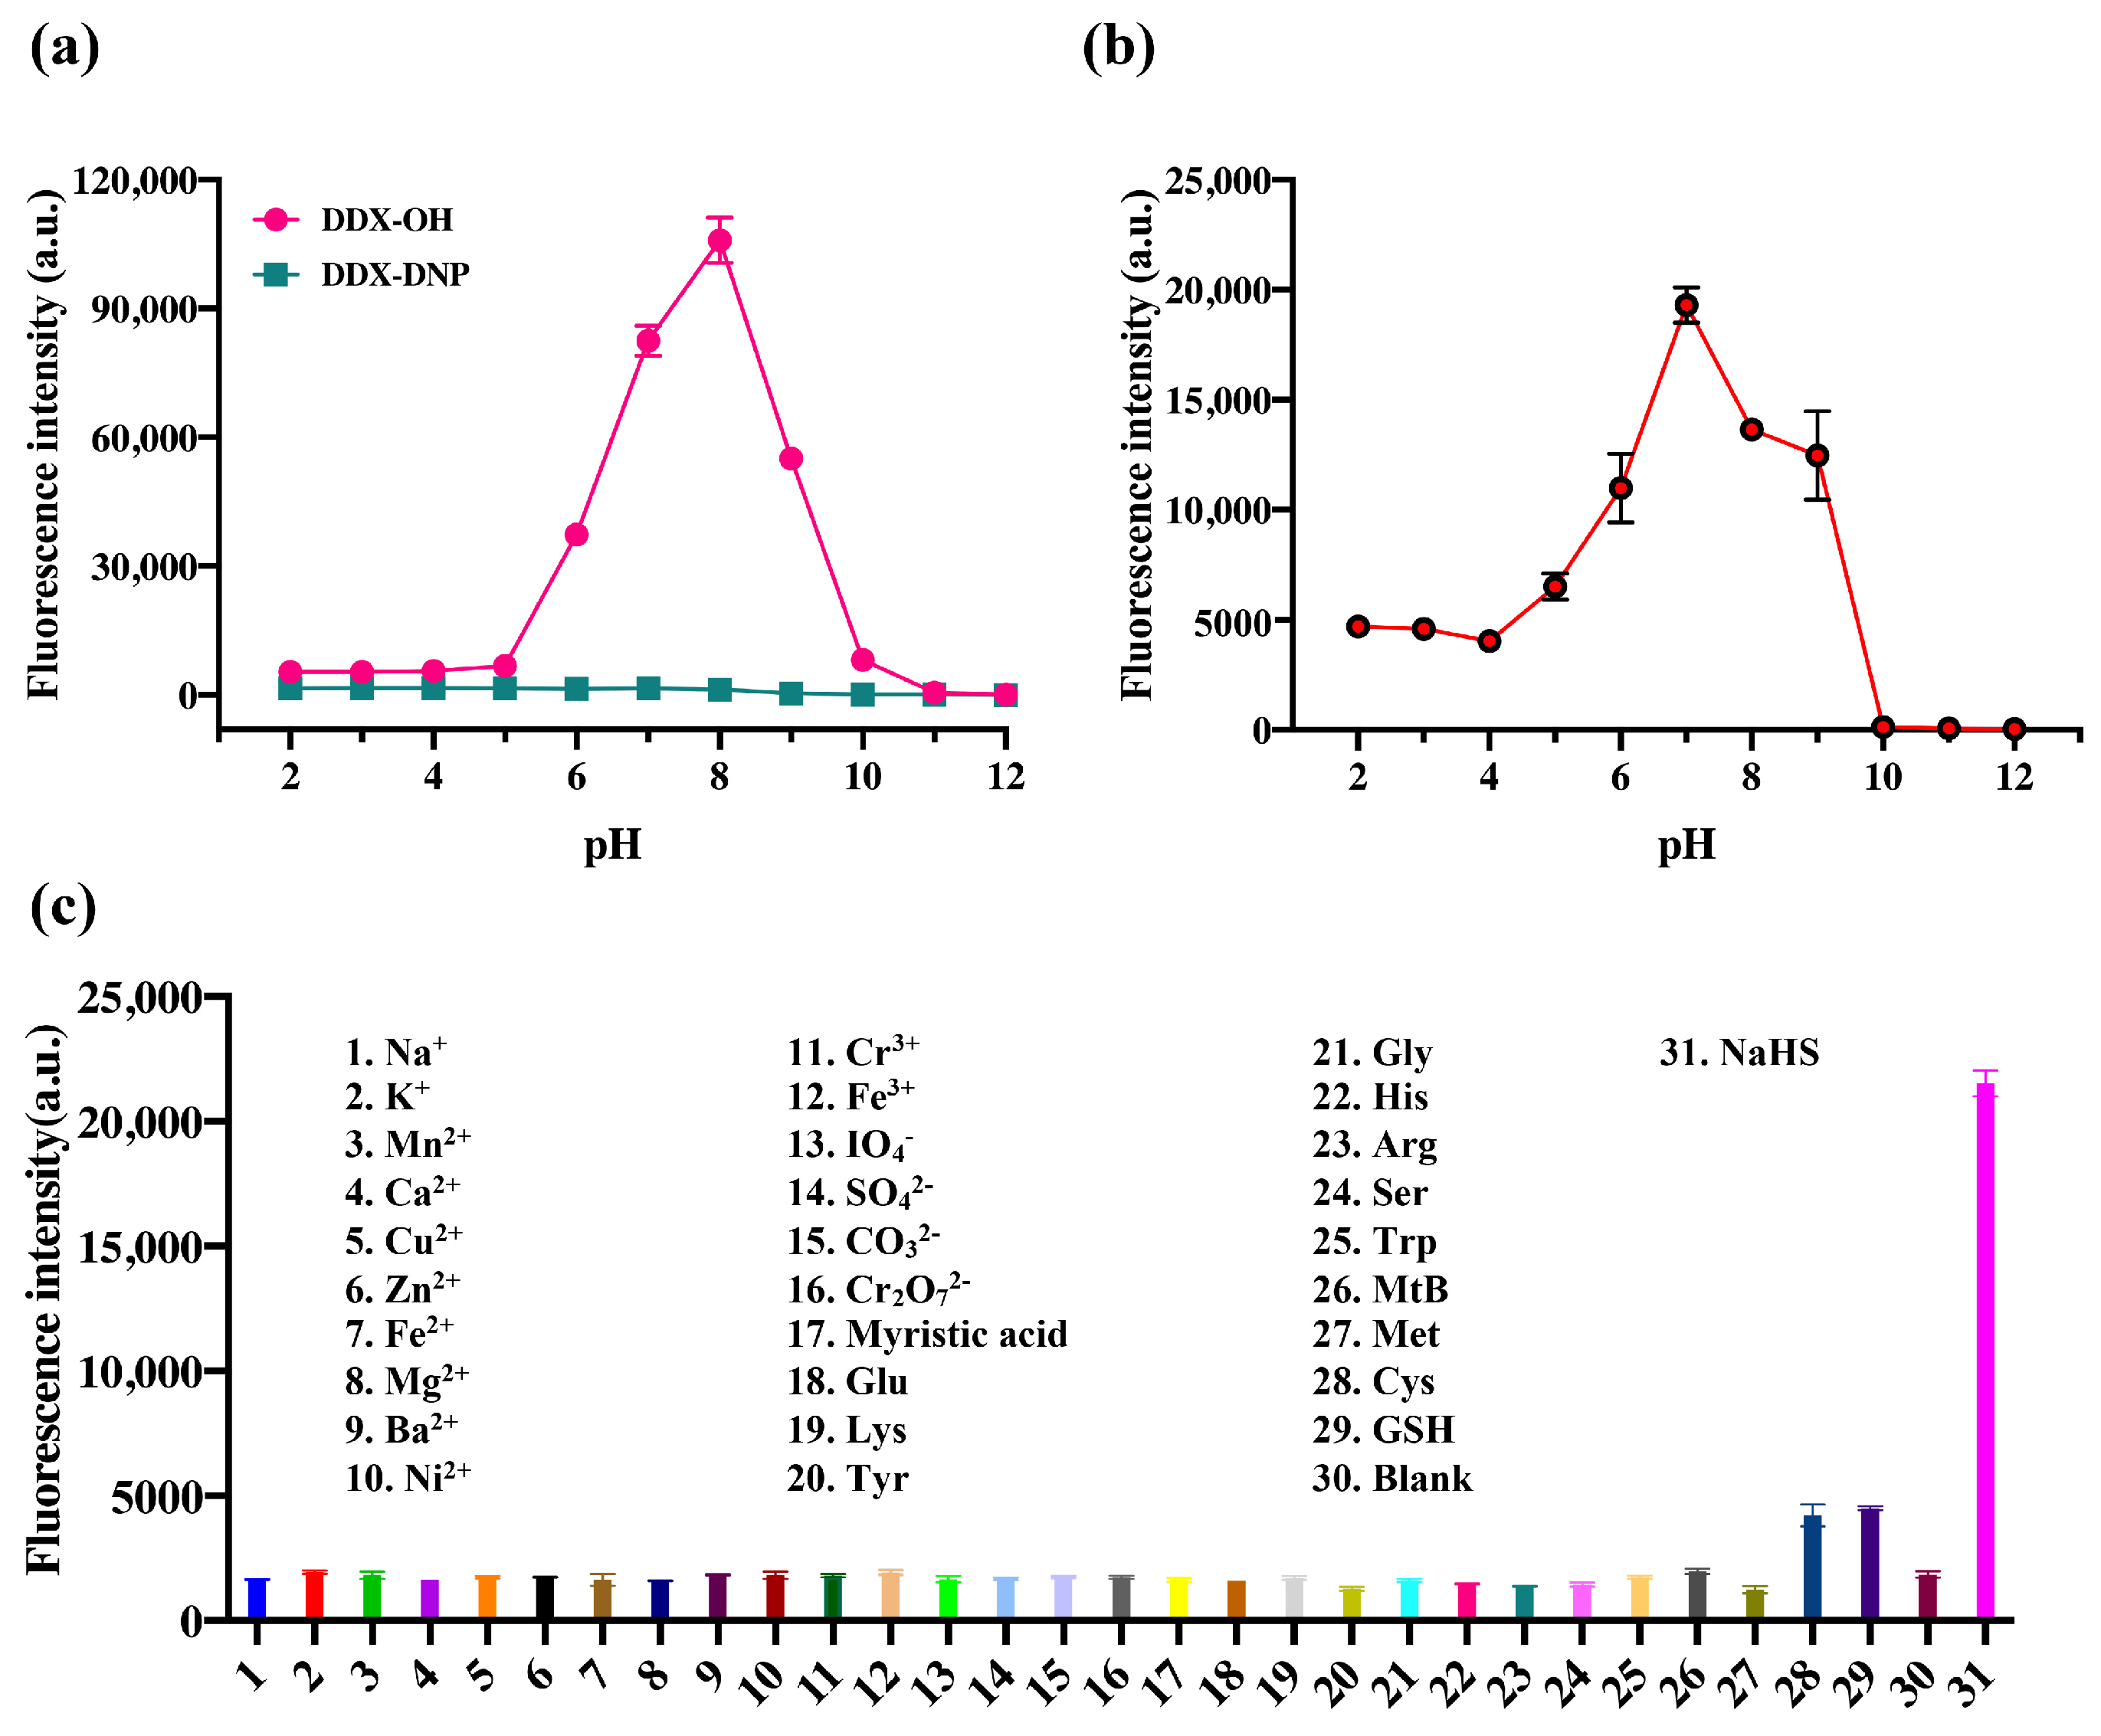
2.3. Selectivity of DDX-DNP for the Detection of H2S

In this study, the fluorescence intensities of DDX-DNP and DDX-OH under different pH conditions were determined and analyzed. As shown in Figure 4a, DDX-DNP showed almost no variation from pH 2.0 to 12.0, and DDX-OH with the hydroxyl group exposed to the outside manifested a strong fluorescence signal from pH 6.0 to 9.0.
In order to compare the reaction rates at different pH values and confirm whether the probe could function smoothly under the studied physiological conditions, the fluorescence intensity of probe DDX-DNP toward H2S was investigated at different pH values (Figure 4b). The probe DDX-DNP’s fluorescence intensity was enhanced noticeably from pH 4 to 9, and it reached the maximum fluorescent intensity at pH 7, while the other pH values did not exhibit any obvious fluorescence enhancement. In fact, fluorescence quenching occurred under strong alkali conditions. Therefore, pH 7.4 was determined to be the optimal pH for the incubation system. The incubation temperature was also measured, as shown in Figure S5. The reaction rate reached its maximum at 37 °C, and it did not continue to accelerate with the increasing temperature.
The excellent selectivity of the fluorescent probe for the target substance is an essential condition for its practical application. Thereby, we further explored the selectivity of DDX-DNP toward H2S. As shown in Figure 4c, in the presence of various substances such as common metal ions, Na+, K+, Mn2+, Ca2+, Cu2+, Zn2+, Fe2+, Mg2+, Ba2+, Ni2+, Cr3+, Fe3+, IO4, SO42−, CO32−, and Cr2O72−, and natural amino acids, Glu, Lys, Tyr, Gly, His, Arg, Ser, Trp, and biothiols (Cys, Met, GSH), the fluorescence intensity of DDX-DNP was measured. Notably, only glutathione and cysteine could trigger a weak fluorescence signal enhancement and cause hardly any interference in H2S detection. Other species could not render an apparent change in fluorescence intensity, which demonstrated that DDX-DNP displayed a good selectivity for the detection of endogenous H2S.

2.4. Confirmation about the Reaction between DDX-DNP and H2S

In order to confirm the sensing mechanism of DDX-DNP for H2S, HPLC-combined electrospray ionization–mass spectrometry (ESI-MS) analysis experiments were performed. As illustrated in Figure S11, after incubation with NaHS, a new ion peak at m/z 320.40 was observed, which could be assigned to the product DDX-OH [M − H]. Therefore, the reaction mechanism of DDX-DNP for sensing H2S is proposed, as shown in Scheme S2.
Moreover, the chromatograms were also recorded using LC–MS/MS data for the fluorescent probe DDX-DNP, product DDX-OH, and reaction solution. As shown in Figure S6, a chromatographic peak of the probe DDX-DNP at the retention time of 3.44 min was observed, and DDX-DNP displayed a narrow peak at 3.29 min. Upon the addition of NaHS, a peak at 3.44 min (DDX-DNP) along with a peak at 3.29 min (DDX-OH) was recorded. Altogether, these results convey that the H2S-triggered thiolysis of dinitrophenyl ether occurred, releasing the target fluorophore.

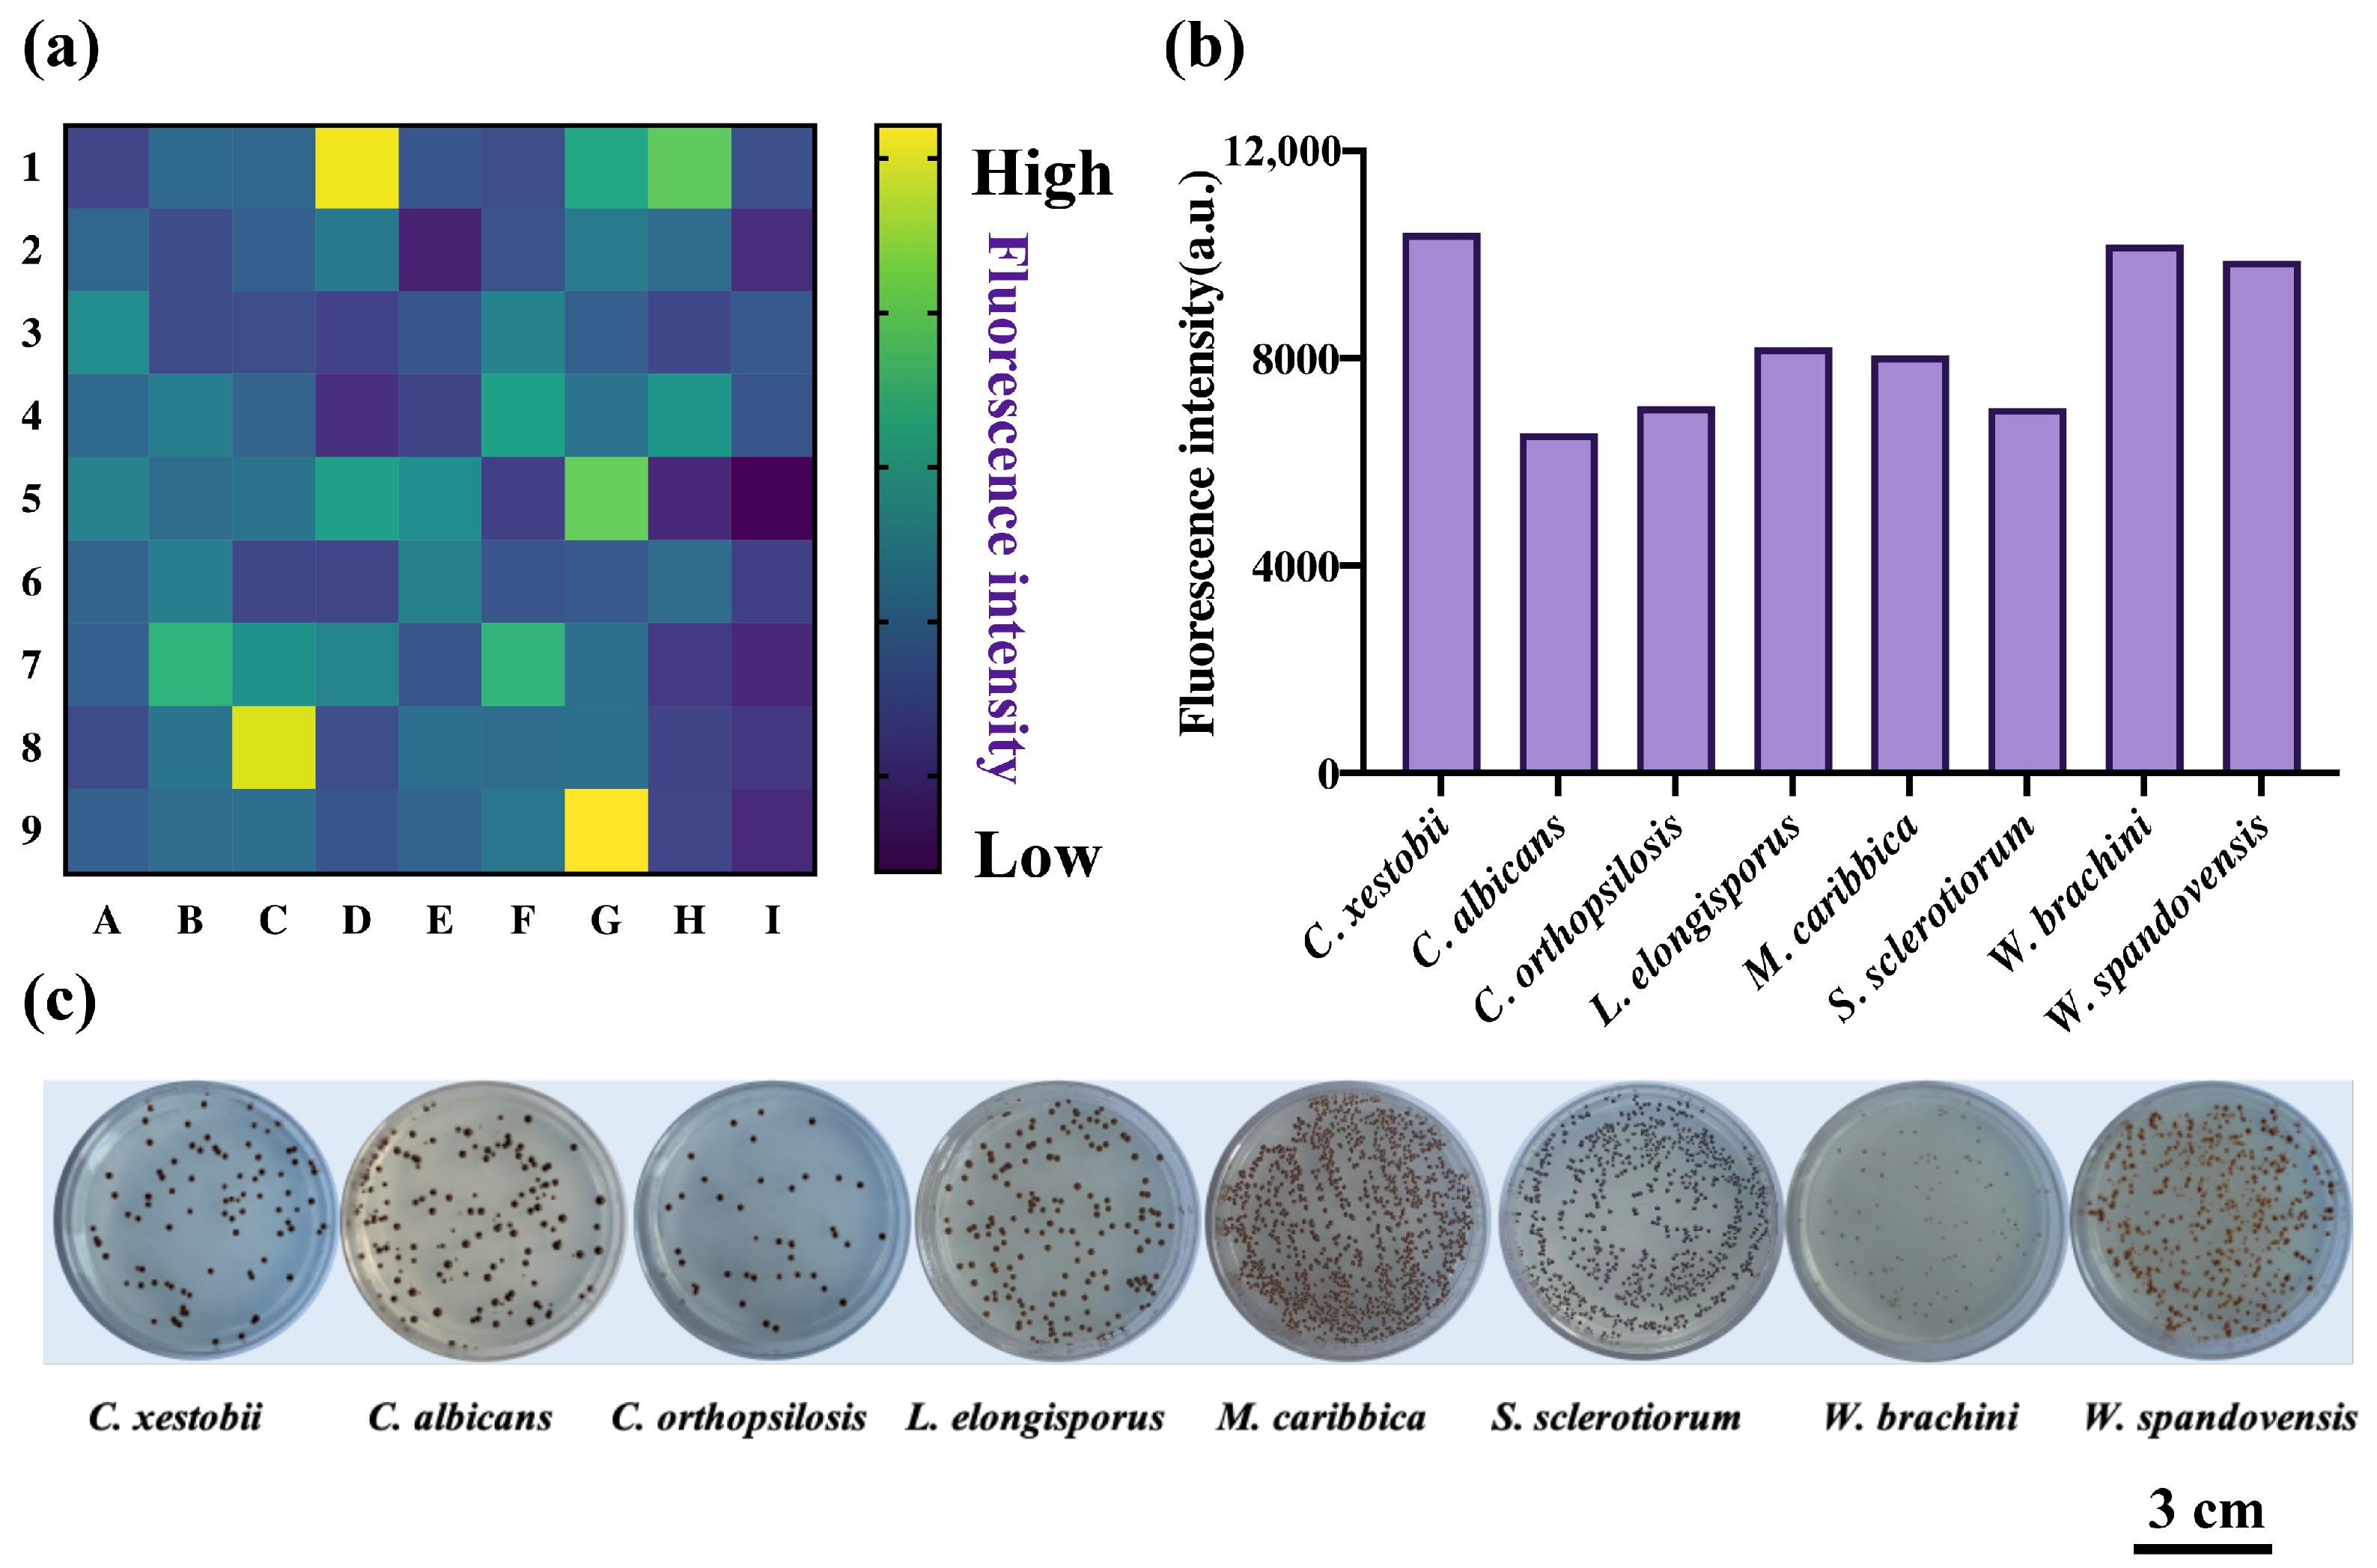
2.5. High-Throughput Screening for Fungi-Produced H2S from Tongue-Coating Fungi Strains Based on DDX-DNP

As it is well known, redox homeostasis is essential for host colonization by pathogens, while H2S has antioxidative properties and a protective bacterial effect against antibiotics [4], thus further aggravating the pathogenicity of pathogens. H2S is not only generated by bacteria, but also it has been previously reported that some fungi can produce H2S. In our previous work, we leveraged the cultivation and sequencing of tongue-coating samples from healthy individuals to create a massive fungi bank. Thus, we created sufficient and convenient fungi strains for the high-throughput screening of fungi-produced H2S based on DDX-DNP. As displayed in Figure 5a,b, eight yeast strains were identified with high yields of H2S production from tongue-coating fungi, among which the Candida xestobii and Wickerhamiella spandovensis strains were the most active H2S-producing strains. Candida albicans, as a pathogen, was also previously discovered to be a H2S-producing fungus [4].
In addition, we used the BiGGY (bismuth sulfite glucose glycine yeast) agar plate to verify the production of H2S by these identified yeasts. Before the formal experiments, first, we measured the selectivity of the BiGGY medium toward H2S. In the medium, bismuth ammonium citrate could be reduced by the H2S donor NaHS to yield a brownish-black color, while failing to react with glutathione, methionine, cysteine, and other thiol-containing compounds (Figure S7). Therefore, this assay acts as a specific indicator to evaluate the H2S production of fungi. As we expected, when the identified eight yeast stains were grown in the BiGGY agar, the brownish-black color of the colonies appeared (Figure 5c), which was consistent with the results identified using DDX-DNP, further indicating that the developed fluorescent probe was feasible for detecting H2S.

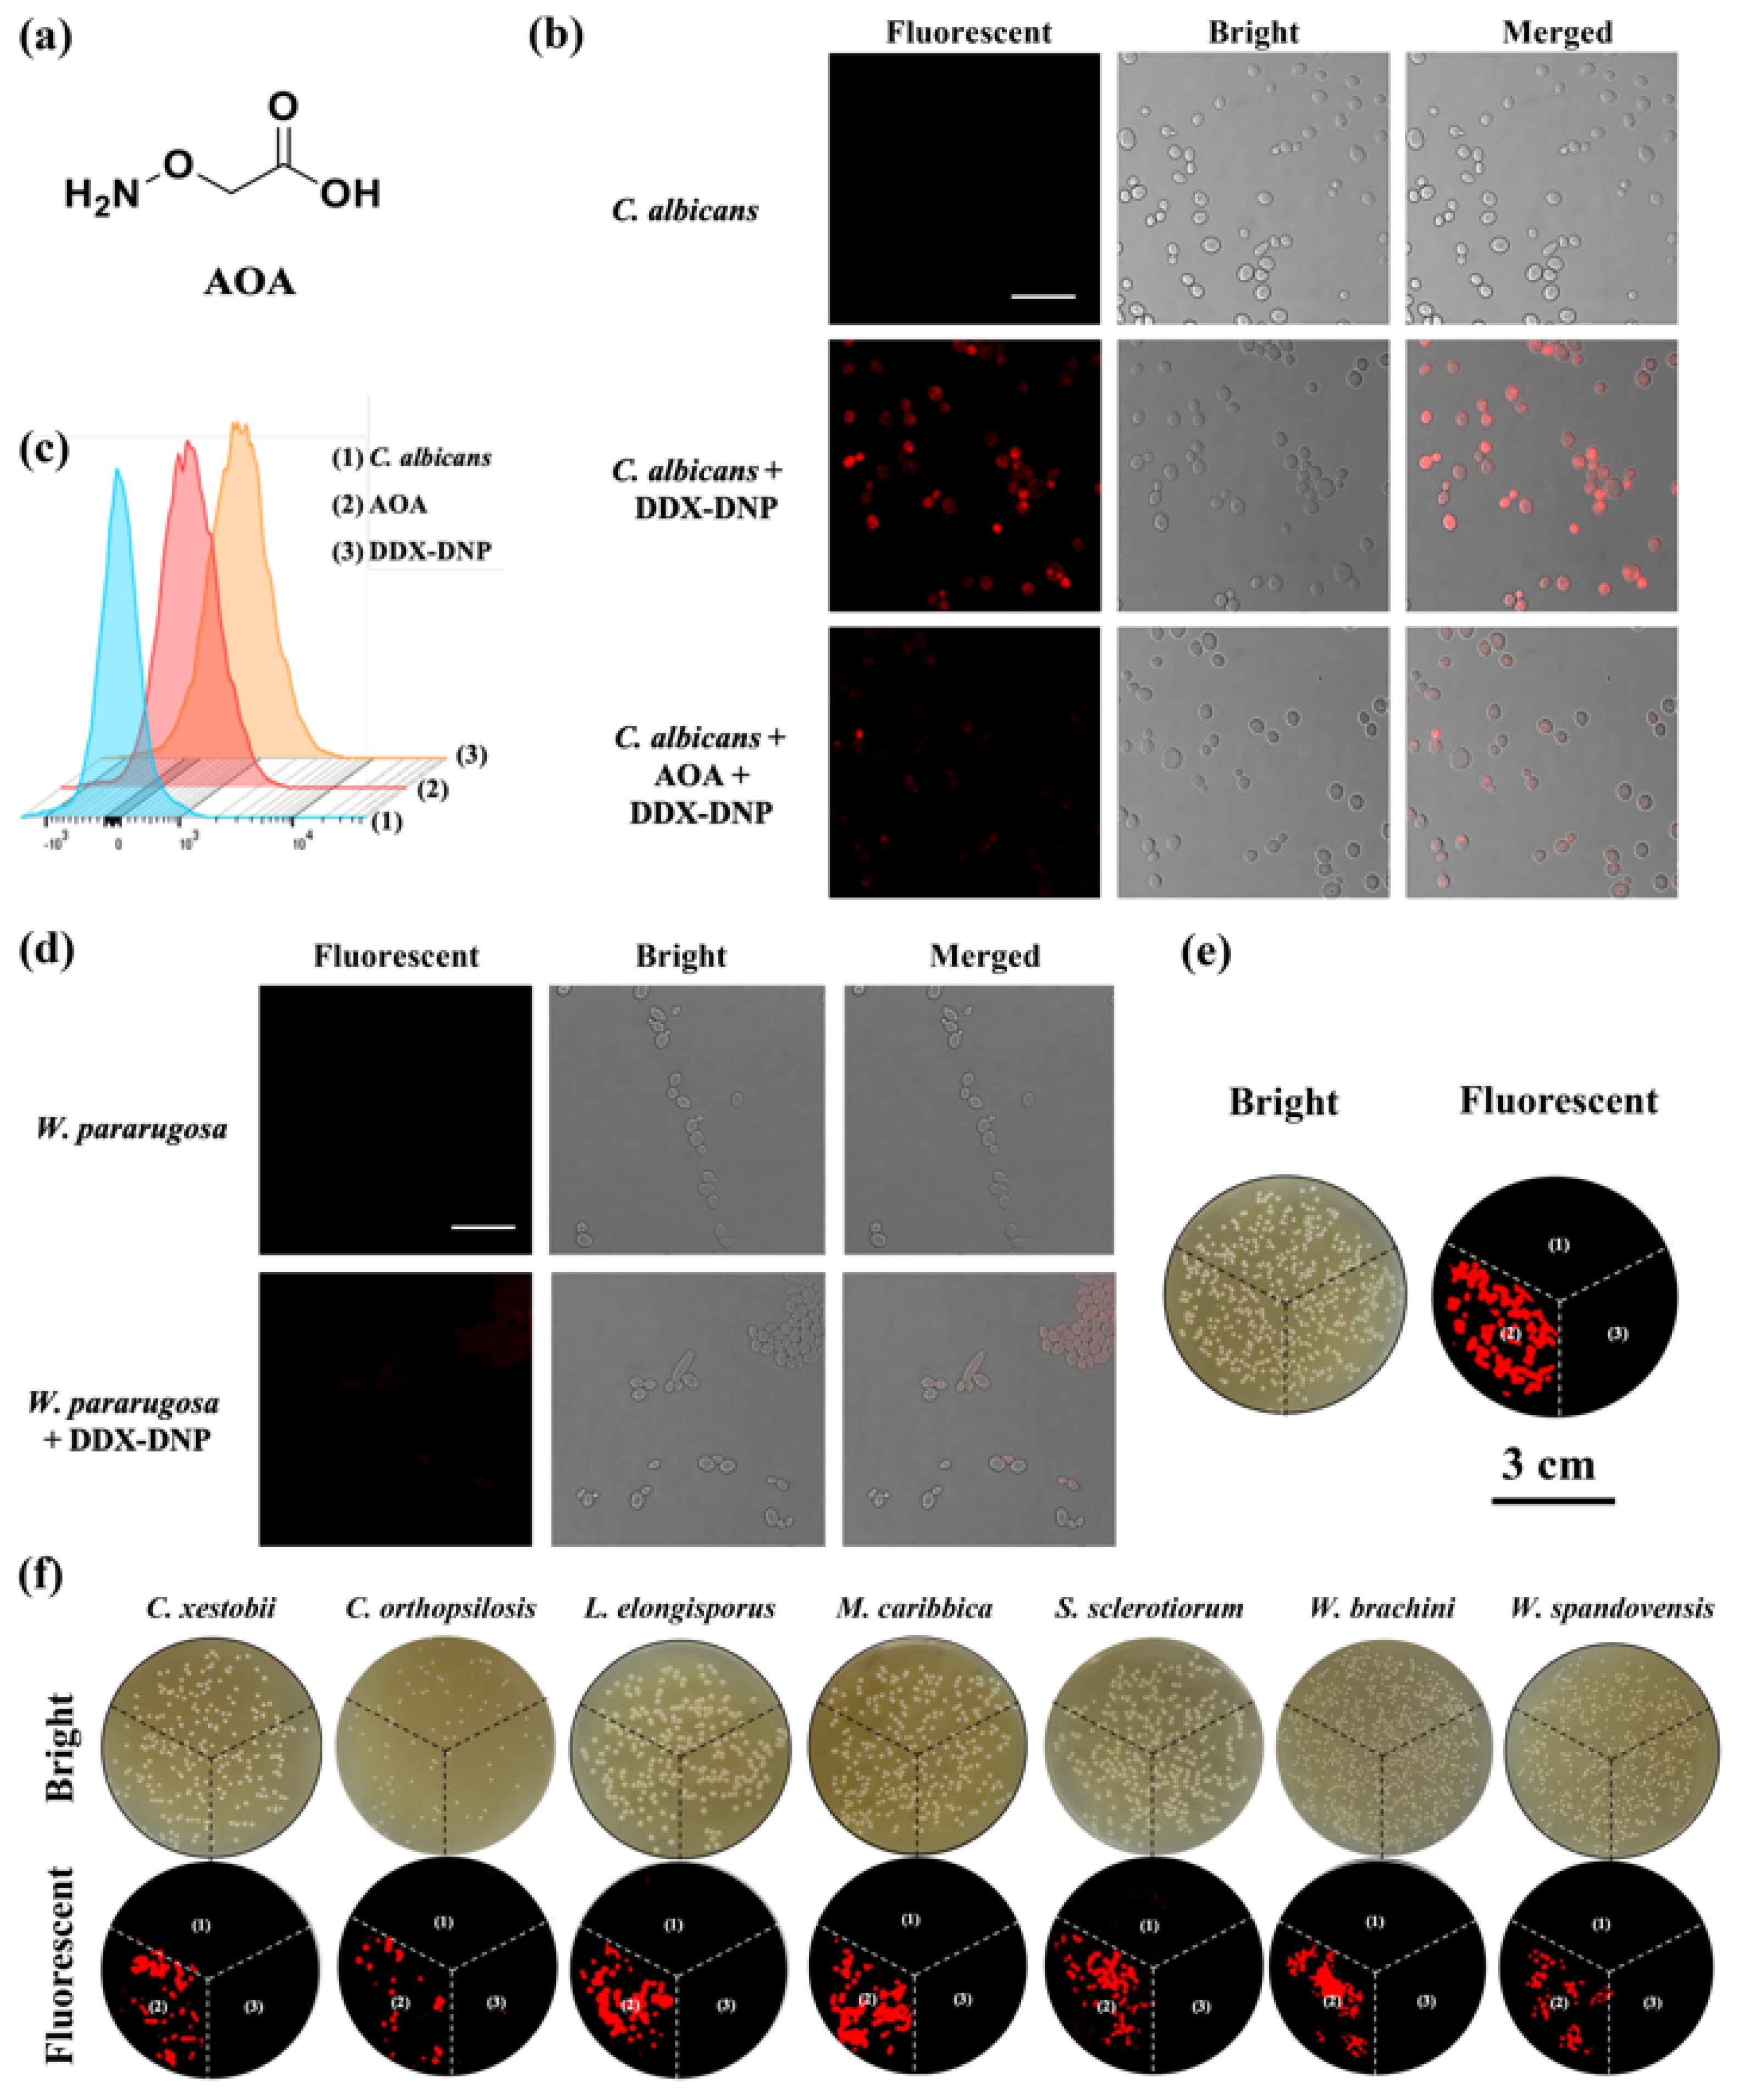
2.6. Fluorescence Imaging of Fungi via H2S Monitoring

Inspired by its satisfying sensing performance and good selective ability, the sensing of endogenous H2S in fungi by DDX-DNP was performed with validation using 2-(Aminooxy) acetic acid (AOA) as the inhibitor of H2S production in cells. Then, a fungi imaging experiment was carried out using Candida albicans. As shown in Figure 6b, a non-fluorescence signal was observed in the blank group, and a strong fluorescence signal was detected for fungal cells after the co-incubation of DDX-DNP, which indicated the abundant generation of endogenous H2S in Candida albicans. Furthermore, in the presence of AOA, the Candida albicans cells co-incubated with DDX-DNP, showing weak fluorescence intensity, which validated the specific detection of endogenous H2S by DDX-DNP. Subsequently, the ability of the fluorescent probe DDX-DNP to detect endogenous H2S in Candida albicans was also verified using a flow cytometric assay. As shown in Figure 6c, compared with the blank group (blue line), Candida albicans incubated with DDX-DNP displayed a significant shift (orange line); however, the shift in the inhibitor group (red line) was clearly reduced. At the same time, we also selected a fungus, W. paraugosa, which released almost no H2S as a negative strain for fluorescence imaging experiments. There is no doubt that no fluorescence intensity was observed in its fluorescence field (Figure 6d), which was in accordance with the results obtained in the fungi solution detection (Figure 5b). This further demonstrates the highly selective characteristic of endogenous H2S sensing using DDX-DNP. Additionally, the fluorescence imaging of Candida albicans and other yeast strains was also determined using agar plates. The fungal colonies displayed a significant fluorescence signal after being incubated with DDX-DNP, and the signal was measured using the Typhoon imager (Figure 6e,f). Thus, DDX-DNP has good biocompatibility and can achieve the detection and visualization of endogenous H2S created by living fungi, which suggests its potential applications for fungi identification or activity assays regarding H2S production.

3. Materials and Methods

3.1. Materials and Instruments

Unless otherwise noted, all the chemical reagents and solvents were purchased from commercial suppliers Maclin Biochemical Co., Ltd. (Shanghai, China) and Kermel Chemical Reagent Co., Ltd. (Tianjin, China) and used without further refinement. Pepton, yeast extract, and agar were purchased from Solarbio Science & Technology Co., Ltd. (Beijing, China). BiGGY (bismuth sulfite glucose glycine yeast) agar medium was obtained from Hope Bio-Technology Co., Ltd. (Qingdao, China).
1H-NMR and 13C-NMR spectra of synthesized products were measured on a Bruker-600 spectrometer (Bruker, Madison, WI, USA), using tetramethylsilane (TMS) as an internal standard. High-resolution mass spectra (HRMS) of synthesized products were measured using an AB SciexX500r TOF mass spectrometer (AB SCIEX, Framingham, MA, USA). The fluorescence microscopic images of fungal cells were obtained using a confocal microscope (Leica, Wetzlar, Germany). The fluorescence images of fungous colonies on agar plates were recorded using a fluorescence image analyzer (Amersham Typhoon, Tokyo, Japan). The bioassay solutions in 96-well plates were also analyzed using an microplate reader (Tecan, Männedorf, Switzerland). All pH measurements were taken using a pHS-3C pH meter (INESA, Shanghai, China).

3.2. Synthetic Procedure of Probe DDX-DNP

The fluorescent probe DDX-DNP was synthesized according to the methodology shown in Scheme S1, and the NMR and HRMS data are provided in the Supplementary Materials.

3.2.1. Synthesis of DDX-OH

DDX-OH was synthesized according to a previously reported procedure [40]. 4-(Diethylamino)salicylaldehyde (1.93 g, 10 mmol) and 6-Hydroxy-1-tetralone (1.62 g, 10 mmol) were dissolved in concentrated sulfuric acid (10 mL), and the solution was stirred at 90 °C in an argon atmosphere for 6 h. The solution was cooled to room temperature and then poured into ice water (100 mL) containing HClO4 (4 mL). The mixture was filtered to obtain the product DDX-OH as a red solid (2.15 g, 51.2%), which was used for the next step without further purification. 1H NMR (500 MHz, DMSO-d6) δH 8.62 (s, 1H), 8.16 (d, J = 8.7 Hz, 1H), 7.91 (d, J = 9.4 Hz, 1H), 7.41 (dd, J = 9.3, 2.3 Hz, 1H), 7.27 (d, J = 2.0 Hz, 1H), 6.94 (dd, J = 8.7, 2.3 Hz, 1H), 6.87 (d, J = 2.2 Hz, 1H), 3.67 (q, J = 7.0 Hz, 4H), 3.01 (s, 4H), 1.24 (t, J = 7.1 Hz, 6H).

3.2.2. Synthesis of DDX-DNP

DDX-OH (210 mg, 0.50 mmol), 2,4-dinitrofluorobenzene (93 mg, 0.50 mmol), and K2CO3 (207 mg, 1.5 mmol) were dissolved in CH3CN (20 mL), and the solution was stirred at room temperature in an argon atmosphere for 1 h. The mixture was evaporated under reduced pressure, and the crude product was purified using silica gel chromatography (CH2Cl2: MeOH = 15:1, v:v) to obtain the product DDX-DNP as a red solid (150 mg, 51.1%). 1H NMR (600 MHz, CDCl3) δH 8.88 (d, J = 2.6 Hz, 1H), 8.51 (s, 1H), 8.48 (dd, J = 9.4, 2.6 Hz, 1H), 8.40 (d, J = 8.6 Hz, 1H), 7.90 (d, J = 9.4 Hz, 1H), 7.38 (d, J = 9.1 Hz, 1H), 7.25 (dd, J = 9.6, 2.2 Hz, 1H), 7.17 (dd, J = 8.7, 2.2 Hz, 1H), 7.12 (d, J = 2.2 Hz, 1H), 7.07 (d, J = 2.2 Hz, 1H), 3.69 (m, 4H), 3.13 (m, 4H), 1.37 (t, J = 7.0 Hz, 6H). 13C NMR (150 MHz, CDCl3) δC 162.0, 159.2, 159.0, 156.2, 153.7, 148.9, 144.9, 143.0, 140.6, 132.6, 129.6, 129.3, 123.7, 122.1, 121.8, 121.1, 119.6, 119.3, 118.8, 118.3, 96.2, 46.5, 27.1, 24.9, 12.7. HR-MS m/z 486.1645 (C27H24N3O6+), calcd for 486.1660.

3.3. Density Functional Theory (DFT) Calculations

All computations were performed in GaussView 6.0.16 using Gaussian 16. The B3LYP/6-31G(d) basis set method was applied to optimize the low-energetic conformations of DDX-DNP and DDX-OH using density functional theory (DFT). Then, the lowest unoccupied molecular orbital (LUMO) and highest occupied molecular orbital (HOMO) calculations were performed using Mos tool in GaussView 6.0.16, through a fchk-type file. The calculation was not limited by bonds/angles/dihedral angles, and all atoms could be freely optimized.

3.4. High-Performance Liquid Chromatography–Mass Spectrometry of DDX-DNP and DDX-OH

An HPLC–MS/MS-system Triple Quad 4500 MD (AB SCIEX, USA) was utilized to identify DDX-DNP and DDX-OH in the reacted solution. The MS parameters were optimized as follows: for DDX-DNP, Q1 Mass 487.1Da, Q3 Mass 440.0 Da, Declustering Potential (DP) 110.0 volts, collision energy (CE) 50.0 volts; and for DDX-OH, Q1 Mass 321.2 Da, Q3 Mass 277.0 Da, DP 110.0 volts, CE 53.0 volts. The mobile phase was composed of A (0.1% v/v formic acid aqueous solution) and B (acetonitrile). Next, the HPLC elution conditions were optimized as follows: 0–1 min: 90% A; 1–2.5 min: 90–0% A; 2.5–4 min: 0% A; 4.0–5.5 min: 0–90% A; and 5.5–6.5 min: 90% A. The flow rate and the column temperature were set to 0.3 mL/min and 40 °C, respectively. Subsequently, the solutions of DDX-DNP and DDX-OH and the reacted solution of DDX-DNP and NaHS were injected, respectively. Finally, all the data were collected and processed using Analyst 1.6.3 software.

3.5. Spectroscopic Measurements

Unless otherwise noted, all measurements were performed in KH2PO4-K2HPO4 buffer (50 mM, pH 7.4). H2S was prepared from NaHS, which is a common donor and a standard source for H2S. The stock solution of the probe DDX-DNP (25 mM) was prepared in DMSO and then diluted to the desired concentration prior to the next experiment. The fluorescence spectra of the resultant solution were recorded using the maximum absorbance wavelength of the corresponding fluorophores as the excited wavelength (DDX-OH: λex = 580 nm).
Fluorescence response tests of DDX-DNP (10 μM) towards NaHS at different concentrations (0–100 μM) were performed in KH2PO4-K2HPO4 buffer for 60 min, incubated at 37 °C. Meanwhile, the fluorescence responses of DDX-DNP (10 μM) towards NaHS (0, 40, 80, and 100 μM) with different incubation times (0–180 min) were investigated in phosphate buffer, when incubated at 37 °C.
For the effect of pH on the fluorescence probe, different pH values of the phosphate buffer from 2.0 to 12.0 were adjusted by supplementing appropriate volumes of standard phosphoric acid or potassium hydroxide, which were used for the fluorescence intensity detection of DDX-DNP.

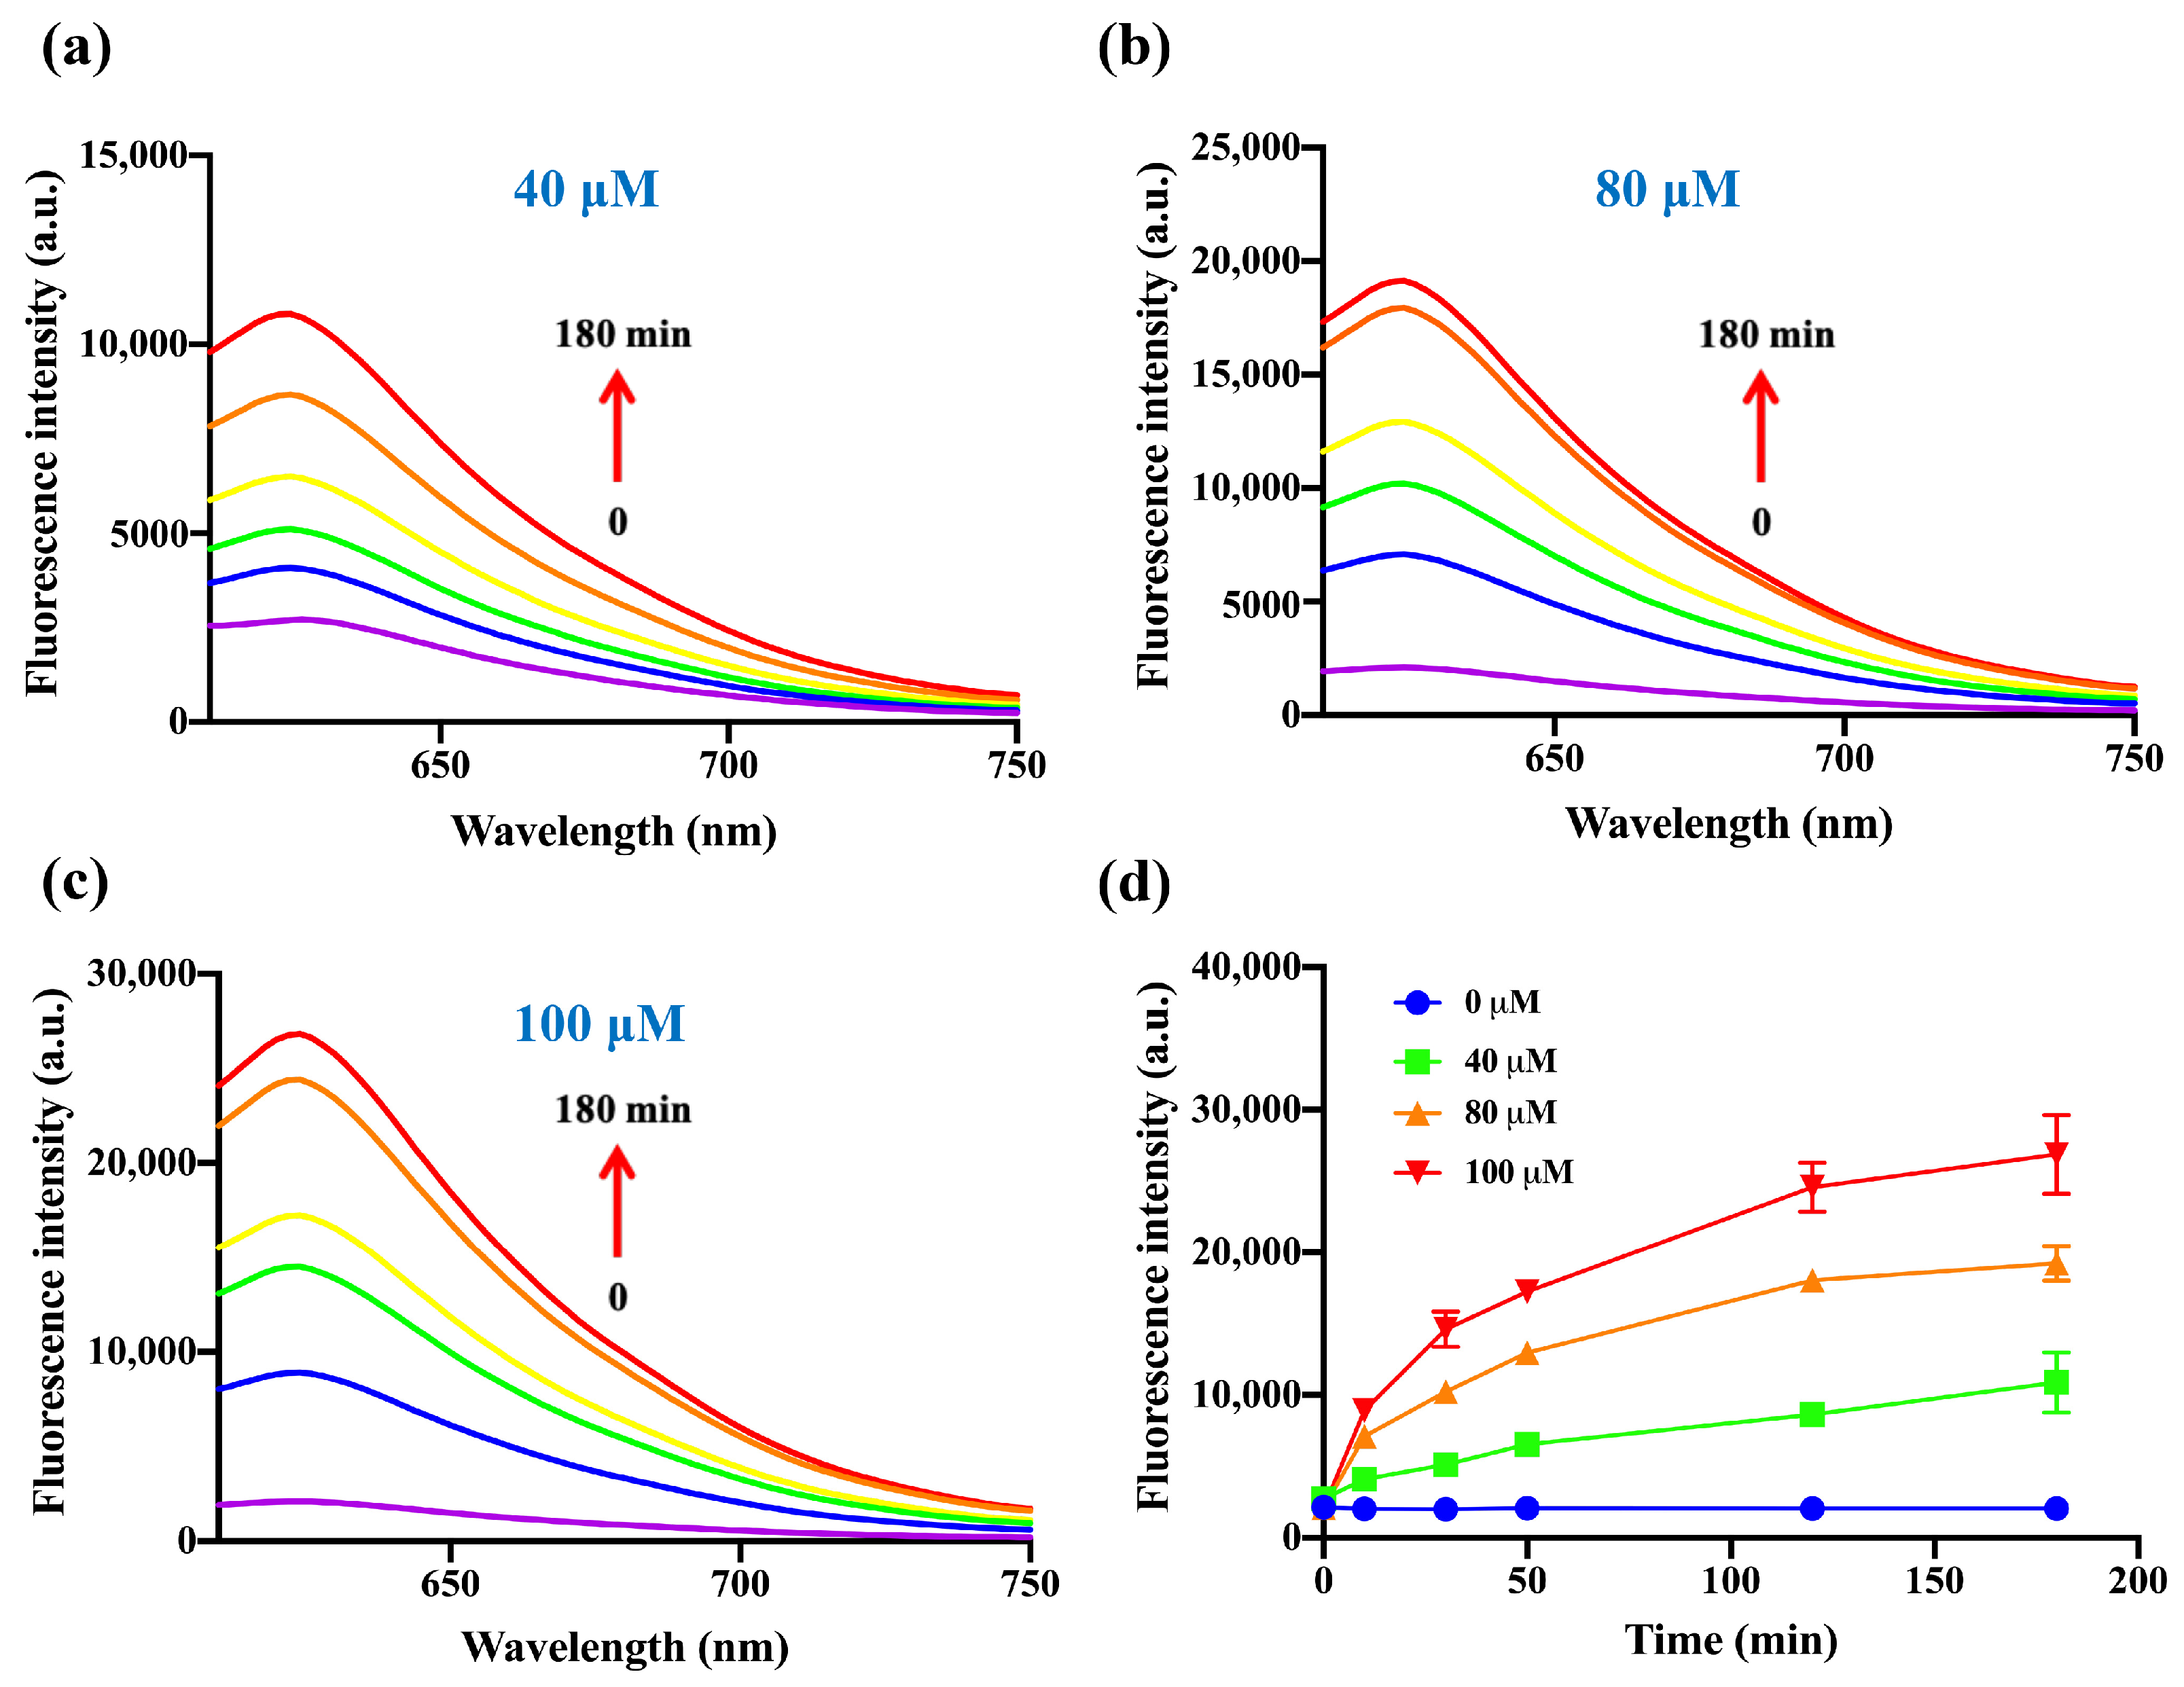
3.6. Kinetic Studies [38]

The reaction of DDX-DNP (10 μM) with H2S in KH2PO4-K2HPO4 buffer (50 mM, pH 7.4) at 37 °C was monitored by measuring the fluorescence intensity (E). The apparent rate constant for the reaction was determined by fitting the fluorescence intensity of the samples to the pseudo- first-order equation:
ln((EmaxEt)/Emax) = −kt
where Et and Emax are the fluorescent intensities at 620 nm at times t and the maximum value obtained during the reaction. k′ is the apparent rate constant. The pseudo-first-order rate constant k (M−1 s−1) was obtained from Equation (2),
k′ = kC
where C is the concentration of H2S.

3.7. Selectivity Evaluation

The selectivity of DDX-DNP toward H2S and other species regarding the fluorescence intensity of DDX-DNP was evaluated in the presence of various ions and amino acids, such as NaCl, KCl, MnCl2, CaCl2, CuSO4, MgCl2, BaCl2, ZnCl2, FeCl2, FeCl3, CaCO3, KIO4, K2Cr2O7, tyrosine (Tyr), glycine (Gly), histidine (His), arginine (Arg), serine (Ser), tryptophan (Trp), glutathione (GSH), methionine (Met), lysine (Lys), cysteine (Cys), and myristic acid. All species’ concentrations were 100 μM.

3.8. Fungi Strains and Cultivation

All the yeast strains from a single colony were initially propagated in liquid martin broth modified medium (MtB), supplemented with or without 2% agar, at 32 °C in an orbital shaker (130 rpm) or a constant-temperature incubator. The yeast strains studied in this work are listed in Table S1. The fugal cells were cultured to an optical density at 600 nm (OD600) of 0.8 to 1.0, namely, culturing up to the logarithmic phase for experiments.

3.9. DDX-DNP High-Throughput Screening for H2S Production by Tongue-Coating Fungi

All the yeast strains were cultured in the MTB medium for at least 24 h to obtain enough fungal cells with an OD value of 1.0. Then, the probe DDX-DNP (25 μM) was added into the culture for co-incubation with yeast for about 4 h at 32 °C. After the fungal supernatants were harvested using centrifugation at 20,000× g for 10 min, the supernatant solutions were used to measure the fluorescence spectra using a microplate reader (λex 580/λem 620 nm).

3.10. Fluorescence Imaging of Fungi via the Detection of H2S

The potential hydrogen sulfide-producing strains were cultured on MTB agar for 3–5 days. Fungal colonies were observed on the plates at 32 °C; then, the plates were divided into three regions, and DDX-DNP (25 μM) was sprayed on to the fungal colonies and incubated for 4 h at 32 °C. The inhibitor group were preincubated with AOA (1 mM) for 2 h at 32 °C. Finally, the plates were scanned using an Amersham Typhoon RGB (λex = 532 nm).
Candida albicans and negative strains were cultured in the MTB medium; then, DDX-DNP was added into the medium with a final concentration of 25 μM and incubated at 32 °C for 4 h. The inhibitor group were preincubated with AOA (1 mM) for 2 h at 32 °C. After washing the whole cells three times with PBS, they were dropped into glass slides and immobilized with coverslips for imaging experiments. Finally, the imaging cells were observed using a Leica Confocal Microscope with λex 561/λem 602–650 nm. The fluorescent signal was also recorded using flow cytometry. A total of about 10,000 events were collected for data analysis, without using specific gating policies. The data were analyzed using FlowJoversion v10.8.1 software.

4. Conclusions

To sum up, we designed and synthesized a turn-on fluorescent probe for monitoring H2S based on the H2S-triggered thiolysis of the dinitrophenyl ether strategy. In the presence of H2S, the fluorescent probe DDX-DNP exhibits a remarkable fluorescence enhancement at 620 nm. More importantly, DDX-DNP was the first fluorescent probe successfully used for the fluorescence bioimaging of H2S in fungi. In short, DDX-DNP, as a turn-on fluorescent probe activated by H2S, can be used for H2S detection, as well as for the visual sensing of endogenous H2S in living fungi.

Supplementary Materials

The following supporting information can be downloaded at: https://www.mdpi.com/article/10.3390/molecules29030577/s1.

Author Contributions

Q.Y.: investigation and writing. S.H.: synthesis. L.F.: synthesis, NMR spectra and editing. M.Z.: fungi culture. C.H.: fluorescence imaging. Y.W.: validation. C.W.: design, validation, and funding acquisition. X.M.: writing—review and editing and funding acquisition. T.M.: design and writing—review and editing. All authors have read and agreed to the published version of the manuscript.

Funding

This work was supported financially by the Dalian Science Technology Leading Talents Project (2020RJ09).

Institutional Review Board Statement

Not applicable.

Informed Consent Statement

Not applicable.

Data Availability Statement

Data are contained within the article or Supplementary Material.

Conflicts of Interest

The authors declare no conflict of interest.

References

  1. Lefer, D. A new gaseous signaling molecule emerges: Cardioprotective role of hydrogen sulfide. Proc. Natl. Acad. Sci. USA 2007, 104, 17907–17908. [Google Scholar] [CrossRef] [PubMed]
  2. Wang, R. Hydrogen sulfide: The third gasotransmitter in biology and medicine. Antioxid. Redox Signal. 2010, 12, 1061–1064. [Google Scholar] [CrossRef] [PubMed]
  3. Li, L.; Rose, P.; Moore, P. Hydrogen sulfide and cell signaling. Annu. Rev. Pharmacol. 2011, 51, 169–187. [Google Scholar] [CrossRef] [PubMed]
  4. Chang, W.; Zhang, M.; Jin, X.; Zhang, H.; Zheng, H.; Zheng, S.; Qiao, Y.; Yu, H.; Sun, B.; Hou, X.; et al. Inhibition of fungal pathogenicity by targeting the H2S-synthesizing enzyme cystathionine β-synthase. Sci. Adv. 2022, 8, eadd5366. [Google Scholar] [CrossRef] [PubMed]
  5. Shatalin, K.; Shatalina, E.; Mironov, A.; Nudler, E. H2S: A universal defense against antibiotics in bacteria. Science 2011, 334, 986–990. [Google Scholar] [CrossRef] [PubMed]
  6. Zhang, H.; Zhu, M.; Jiang, D.; Xue, X.; Zhang, J.; Zhang, G.; Wang, Y.; Zhao, H. Ultrafast response fluorescent probe with red-emission for monitoring hydrogen sulfide in vivo and in vitro. J. Photochem. Photobiol. A 2019, 382, 111974. [Google Scholar] [CrossRef]
  7. Yang, G.; Wu, L.; Jiang, B.; Yang, W.; Qi, J.; Cao, K.; Meng, Q.; Mustafa, A.; Mu, W.; Zhang, S.; et al. H2S as a Physiologic Vasorelaxant: Hypertension in Mice with Deletion of Cystathionine γ-Lyase. Science 2008, 322, 587. [Google Scholar] [CrossRef] [PubMed]
  8. Kimura, H. Hydrogen sulfide: Its production, release and functions. Amino Acids 2011, 41, 113–121. [Google Scholar] [CrossRef]
  9. Li, L.; Bhatia, M.; Zhu, Y.; Zhu, Y.; Ramnath, R.; Wang, Z.; Whiteman, M.; Salto-Tellez, M.; Moore, P. Hydrogen sulfide is a novel mediator of lipopolysaccharide-induced inflammation in the mouse. FASEB J. 2005, 19, 1196–1198. [Google Scholar] [CrossRef]
  10. Kamoun, P.; Belardinelli, M.; Chabli, A.; Lallouchi, K.; Chadefaux-Vekemans, B. Endogenous Hydrogen Sulfide Overproduction in Down Syndrome. Am. J. Med. Genet. A 2003, 116, 310–311. [Google Scholar] [CrossRef]
  11. Eto, K.; Asada, T.; Arima, K.; Makifuchi, T.; Kimura, H. Brain hydrogen sulfide is severely decreased in Alzheimer’s disease. Biochem. Biophys. Res. Commun. 2002, 293, 1485–1488. [Google Scholar] [CrossRef]
  12. Wang, R. Physiological implications of hydrogen sulfide: A whiff exploration that blossomed. Physiol. Rev. 2012, 92, 791–896. [Google Scholar] [CrossRef] [PubMed]
  13. Vadovics, M.; Igaz, N.; Alfldi, R. Candida albicans enhances the progression of oral squamous cell cancrinoma in vitro and in vivo. mBio 2021, 13, e03144-21. [Google Scholar] [PubMed]
  14. Ma, Z.; Bi, Q.; Wang, Y. Hydrogen sulfide accelerates cell cycle progression in oral squamous cell carcinoma cell lines. Oral Dis. 2015, 21, 156–162. [Google Scholar] [CrossRef] [PubMed]
  15. Suzuki, N.; Yoneda, M.; Hanioka, T.; Takeshita, T.; Hirofuji, T. Induction and inhibition of oral malodor. Mol. Oral Microbiol. 2019, 34, 85–96. [Google Scholar] [CrossRef] [PubMed]
  16. Zhong, K.; Deng, L.; Zhao, J.; Yan, X.; Sun, T.; Li, J.; Tang, L. A novel near-infrared fluorescent probe for highly selective recognition of hydrogen sulfide and imaging in living cells. RSC Adv. 2018, 8, 23924–23929. [Google Scholar] [CrossRef] [PubMed]
  17. Jimnez, D.; Martinez-Manez, R.; Sancenon, F.; Ros-Lis, J.V.; Benito, A.; Soto, J. A new chromo-chemodosimeter selective for sulfide anion. J. Am. Chem. Soc. 2003, 125, 9000–9001. [Google Scholar] [CrossRef] [PubMed]
  18. Zeng, L.; He, M.; Yu, H.; Li, D. An H2S Sensor Based on Electrochemistry for Chicken Coops. Sensors 2016, 16, 1398. [Google Scholar] [CrossRef] [PubMed]
  19. Vitvitsky, V.; Banerjee, R. H2S analysis in biological samples using gas chromatography with sulfur chemiluminescence detection. Methods Enzymol. 2015, 554, 111–123. [Google Scholar]
  20. Feng, L.; Yan, Q.; Zhang, B.; Tian, X.; Wang, C.; Yu, Z.; Cui, J.; Guo, D.; Ma, X.; James, T. Ratiometric fluorescent probe for sensing Streptococcus mutans glucosyltransferase, a key factor in the formation of dental caries. Chem. Commun. 2019, 55, 3548–3551. [Google Scholar] [CrossRef]
  21. Tian, Z.; Yan, Q.; Feng, L.; Deng, S.; Wang, C.; Cui, J.; Wang, C.; Zhang, Z.; James, T.; Ma, X. A far-red fluorescent probe for sensing laccase in fungi and its application in developing an effective biocatalyst for the biosynthesis of antituberculous dicoumarin. Chem. Commun. 2019, 55, 3951–3954. [Google Scholar] [CrossRef] [PubMed]
  22. Yan, F.; Zhao, X.; Li, R.; Han, X.; Yan, Q.; Feng, L.; Xin, X.; Cui, J.; Ma, X. High-throughput fluorescent screening of thioredoxin reductase inhibitors to inhibit Mycobacterium tuberculosis. Chin. Chem. Lett. 2024, 35, 108504. [Google Scholar] [CrossRef]
  23. Ji, G.; Zheng, T.; Gao, X.; Liu, Z. A highly selective turn-on luminescent logic gates probe based on post-synthetic MOF for aspartic acid detection. Sens. Actuators B 2019, 284, 91–95. [Google Scholar] [CrossRef]
  24. Liu, C.; Pan, J.; Li, S.; Zhao, Y.; Berkman, C.; Whorton, A.; Xian, M. Capture and visualization of Hydrogen Sulfide by a fluorescent probe. Angew. Chem. Int. Ed. 2011, 50, 10327–10329. [Google Scholar] [CrossRef] [PubMed]
  25. Zhao, Q.; Huo, F.; Zhang, Y.; Wen, Y.; Yin, C. HS induced thiolysis reaction to regulate UV- and fluorescence spectra change and their bioimaging in living cells. Spectrochim. Acta A 2019, 215, 297–302. [Google Scholar] [CrossRef] [PubMed]
  26. Hammers, M.; Taormina, M.; Cerda, M.; Montoya, L.; Seidenkranz, D.; Parthasarathy, R.; Pluth, M. A bright fluorescent probe for H2S enables analyte-responsive, 3D imaging in live Zebrafish using light sheet fluorescence microscopy. J. Am. Chem. Soc. 2015, 137, 10216–10223. [Google Scholar] [CrossRef]
  27. Lin, V.; Lippert, A.; Chang, C. Azide-based fluorescent probes: Imaging hydrogen sulfide in living systems. Methods Enzymol. 2015, 554, 63–80. [Google Scholar]
  28. Men, J.; Yang, X.; Zhang, H.; Zhou, J. A near-infrared fluorescent probe based on nucleophilic substitution−cyclization for selective detection of hydrogen sulfide and bioimaging. Dye. Pigment. 2018, 153, 206–212. [Google Scholar] [CrossRef]
  29. Kaushik, R.; Ghosh, A.; Jose, D. Recent progress in hydrogen sulphide (H2S) sensors by metal displacement approach. Coord. Chem. Rev. 2017, 347, 141–157. [Google Scholar] [CrossRef]
  30. Sasakura, K.; Hanaoka, K.; Shibuya, N.; Mikami, Y.; Kimura, Y.; Komatsu, T.; Ueno, T.; Terai, T.; Kimura, H.; Nagano, T. Development of a highly selective fluorescence probe for hydrogen sulfide. J. Am. Chem. Soc. 2011, 133, 1803–1805. [Google Scholar] [CrossRef]
  31. Jose, D.; Sakla, R.; Sharma, N.; Gadiyaram, S.; Kaushik, R.; Ghosh, A. Sensing and Bioimaging of the Gaseous Signaling Molecule Hydrogen Sulfide by Near-Infrared Fluorescent Probes. ACS Sens. 2020, 5, 3365–3391. [Google Scholar] [CrossRef]
  32. Wan, D.; Pan, T.; Ou, P.; Zhou, R.; Ouyang, Z.; Luo, L.; Xiao, Z.; Peng, Y. Construct a lysosome-targeting and highly selective fluorescent probe for imaging of hydrogen sulfide in living cells and inflamed tissues. Spectrochim. Acta A 2021, 249, 119311. [Google Scholar] [CrossRef]
  33. Montoya, L.; Pluth, M. Selective turn-on fluorescent probes for imaging hydrogen sulfide in living cells. Chem. Commun. 2012, 48, 4767–4769. [Google Scholar] [CrossRef] [PubMed]
  34. Li, W.; Shen, Y.; Gong, X.; Zhang, X.; Yuan, L. Highly Selective Fluorescent Probe Design for Visualizing Hepatic Hydrogen Sulfide in the Pathological Progression of Nonalcoholic Fatty Liver. Anal. Chem. 2021, 93, 16673–16682. [Google Scholar] [CrossRef] [PubMed]
  35. Zhang, Y.; Zhang, L. A novel “turn-on” fluorescent probe based on hydroxy functionalized naphthalimide as a logic platform for visual recognition of H2S in environment and living cells. Spectrochim. Acta A 2020, 235, 11833. [Google Scholar] [CrossRef] [PubMed]
  36. Qian, M.; Zhang, L.; Pu, Z.; Xia, J.; Chen, L.; Xia, Y.; Cui, H.; Wang, J.; Peng, X. A NIR fluorescent probe for the detection and visualization of hydrogen sulfide using the aldehyde group assisted thiolysis of dinitrophenyl ether strategy. J. Mater. Chem. B 2018, 6, 7916–7925. [Google Scholar] [CrossRef]
  37. Zhang, Z.; Lin, Y.; Li, Z.; Dong, G.; Guo, Y.; Ma, S.; Li, J.; Du, L.; Li, M. Bright chemiluminescent dioxetane probes for the detection of gaseous transmitter H2S. Bioorganic Med. Chem. Lett. 2021, 46, 128148. [Google Scholar] [CrossRef] [PubMed]
  38. Zhang, J.; Wang, J.; Liu, J.; Ning, L.; Zhu, X.; Yu, B.; Liu, X.; Yao, X.; Zhang, H. Near-Infrared and Naked-Eye Fluorescence Probe for Direct and Highly Selective Detection of Cysteine and Its Application in Living Cells. Anal. Chem. 2015, 87, 4856–4863. [Google Scholar] [CrossRef] [PubMed]
  39. Liu, Y.; Zhang, J.; Ru, J.; Yao, X.; Yang, Y.; Li, X.; Tang, X.; Zhang, G.; Liu, W. A naked-eye visible and turn-on fluorescence probe for Fe3+ and its bioimaging application in living cells. Sens. Actuators B 2016, 237, 501–508. [Google Scholar] [CrossRef]
  40. Jiang, W.; Chen, H.; Pan, Y.; Lin, W. A long-wavelength fluorescent turn-on probe for video detection of biological thiols in living cells. Anal. Methods 2015, 7, 4168–4172. [Google Scholar] [CrossRef]
Scheme 1. Schematic illustration of DDX-DNP detection of H2S.
Molecules 29 00577 sch001
Figure 1. The absorption (a) and fluorescence (b) spectra of DDX-DNP (10 μM) and DDX-OH (10 μM) in KH2PO4–K2HPO4 buffer (50 mM, pH 7.4), gain = 80 (b); (c) density functional theory (DFT)–based optimized structures and frontier molecular orbitals (MOs) of DDX-DNP and DDX-OH.
Molecules 29 00577 g001
Figure 2. (a) Fluorescence spectra of reaction solutions of DDX-DNP (10 μM) with NaHS at different concentrations (0–100 μM) and (b) the linear relationship between fluorescence intensity at 620 nm and NaHS concentrations. (c) Fluorescence imaging of NaHS at different concentrations (0–100 μM) using DDX-DNP (10 μM) and (d) DDX-OH (0–1 μM) in 96 plates. The time for the incubation was 1 h, at 37 °C in KH2PO4-K2HPO4 buffer (50 mM, pH 7.4) (a,c). λex/λem = 580/620 nm.
Molecules 29 00577 g002
Figure 3. The fluorescence spectra of DDX-DNP (10 μM) toward NaHS 40 μM (a), 80 μM (b), and 100 μM (c) with different incubation times (0–180 min). (d) Time-dependent fluorescence intensity of DDX-DNP in the presence of various concentrations of NaHS (0, 40, 80, and 100 μM, respectively). λex/λem = 580/620 nm.
Molecules 29 00577 g003
Figure 4. (a) Fluorescence intensity of DDX-DNP (10 μM) and product DDX-OH (10 μM) in various phosphate solutions at different pHs (2–12), gain = 85%. (b) The reaction rate of DDX-DNP (10 μM) toward H2S in various phosphate buffers with different pH values (2–12). (c) Fluorescence signal changes in DDX-DNP (10 μM) in phosphate buffer upon the sequential addition of various species. The time for the incubation was 1 h (b,c). All species’ concentrations were 100 μM. λex/λem = 580/620 nm.
Molecules 29 00577 g004
Figure 5. (a) The heat map of high-throughput screening of H2S-producing strains of tongue-coating fungi generated using DDX-DNP (25 μM); (b) the quantization results of 8 potential yeast strains with high yields of H2S; and (c) the visual detection of H2S generation of 8 yeast strains using BiGGY agar plates.
Molecules 29 00577 g005
Figure 6. (a) Chemical structure of the CBS inhibitor AOA; (b) fluorescence images of C. albicans incubated with DDX-DNP (25 μM) and in the presence of inhibitor AOA, scale bar = 25 μm; (c) flow cytometric analysis of C. albicans (blue) with DDX-DNP (orange) or both AOA and DDX-DNP (red); (d) fluorescence images of W. paraugosa incubated with DDX-DNP, scale bar = 20 μm; and (e,f) fluorescence images of yeast colonies on MtB agar plates along with bright fields. The plate was divided into three sections: (1) yeast colonies as the blank section in absence of DDX-DNP; (2) yeast colonies incubated with 25 μM DDX-DNP; and (3) yeast colonies incubated with 1 mM AOA and 25 μM DDX-DNP.
Molecules 29 00577 g006
Disclaimer/Publisher’s Note: The statements, opinions and data contained in all publications are solely those of the individual author(s) and contributor(s) and not of MDPI and/or the editor(s). MDPI and/or the editor(s) disclaim responsibility for any injury to people or property resulting from any ideas, methods, instructions or products referred to in the content.

