

New Dual Inhibitors of Tyrosyl-DNA Phosphodiesterase 1 and 2 Based on Deoxycholic Acid: Design, Synthesis, Cytotoxicity, and Molecular Modeling

 ,
,  ,
,  and
and 
Abstract
1. Introduction
2. Results and Discussion
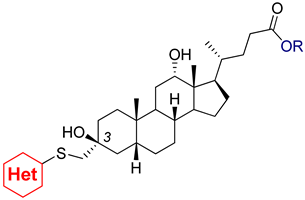
2.1. Chemistry
2.2. Biology
2.2.1. Inhibition of Recombinant Enzymes TDP1 and TDP2
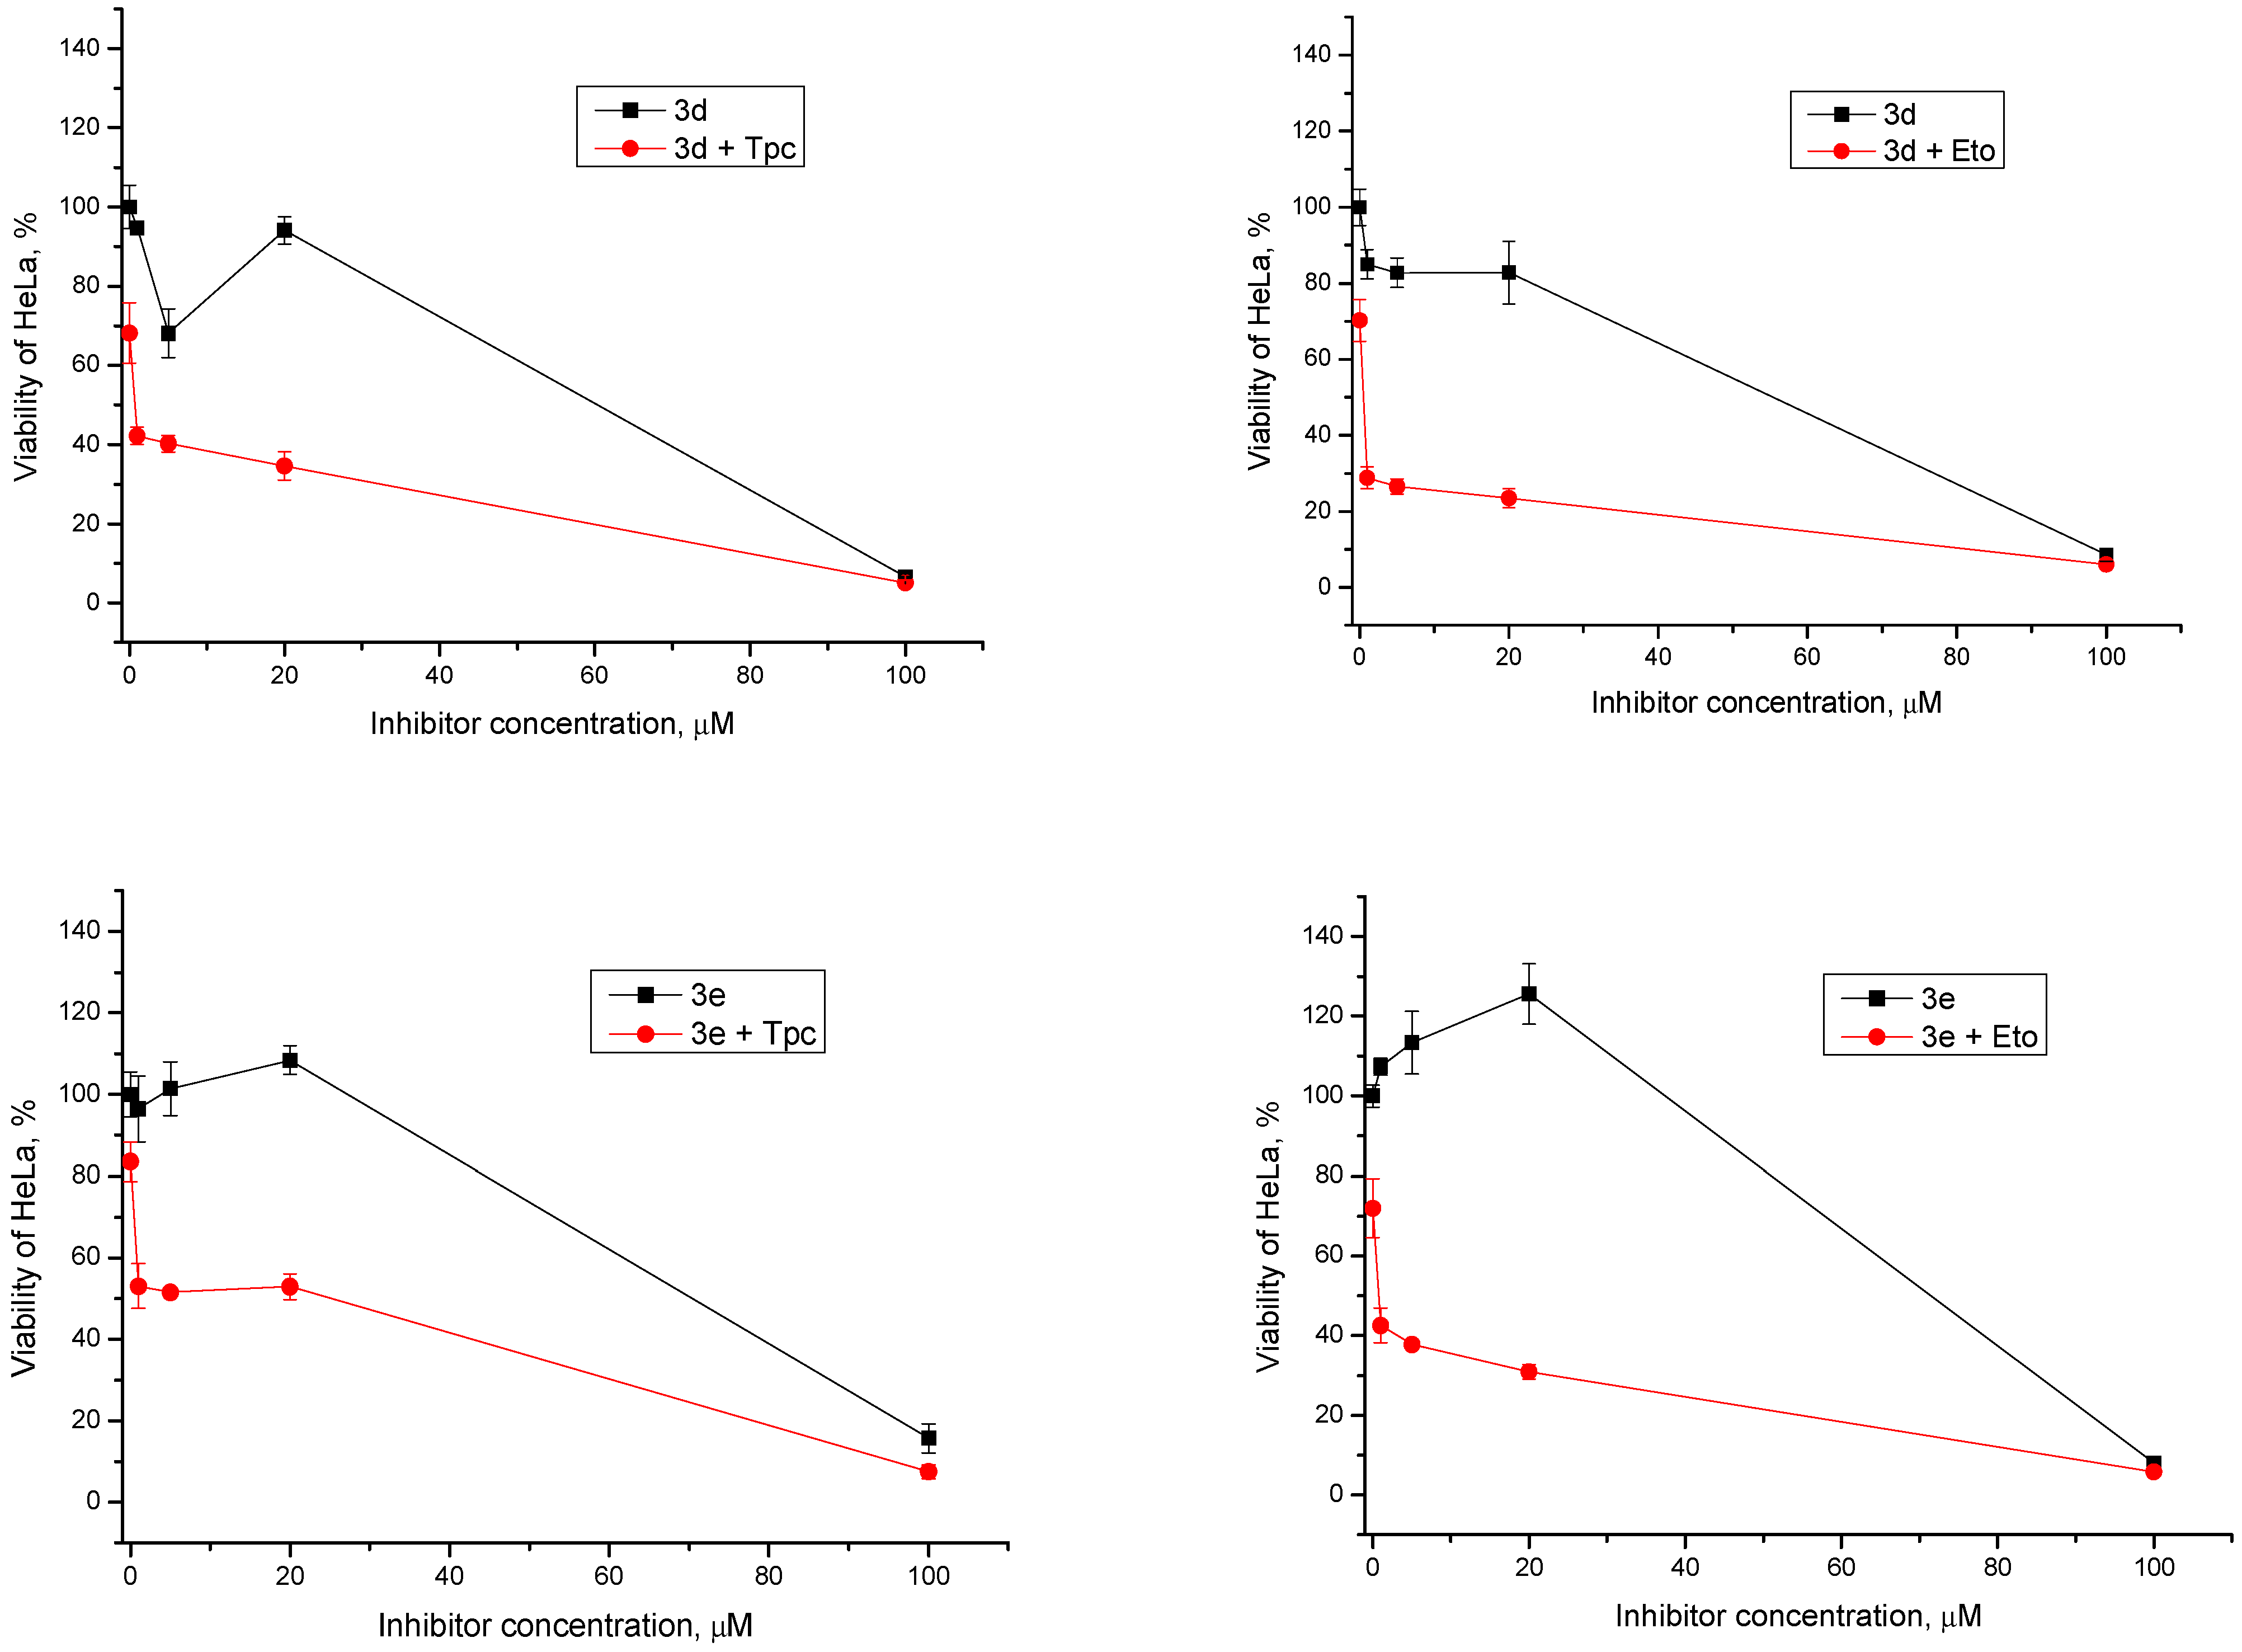
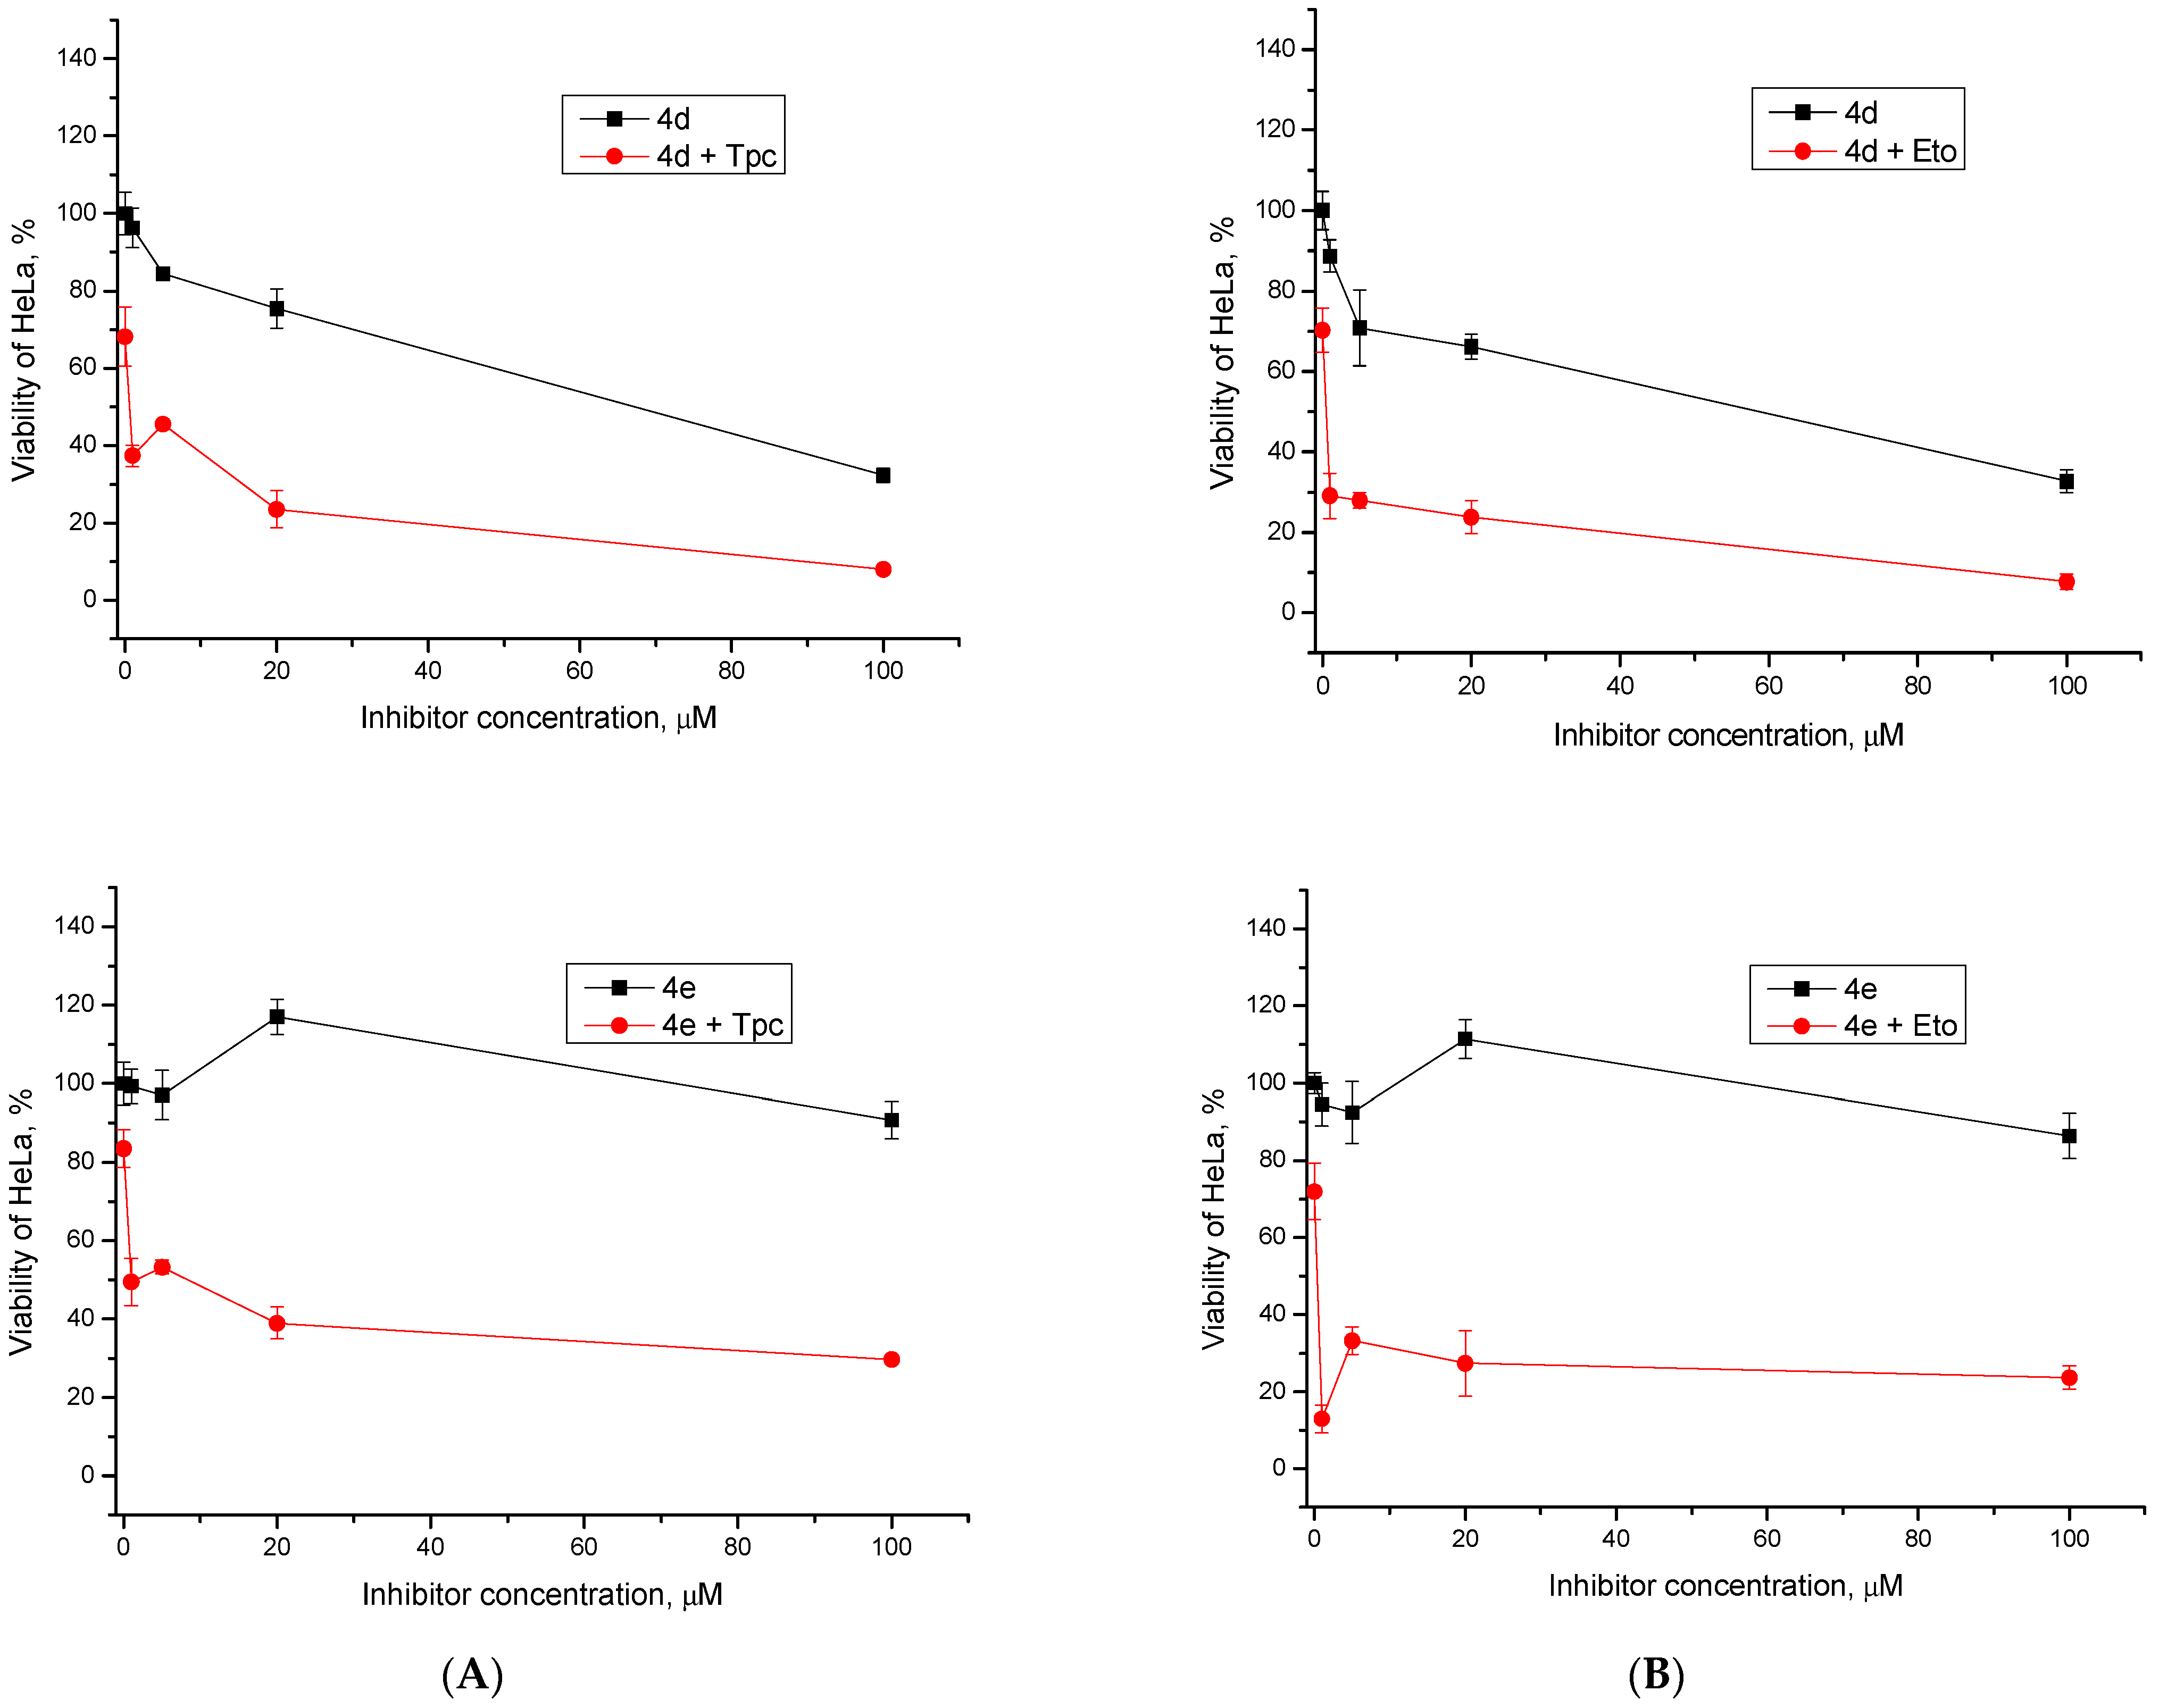
2.2.2. Cytotoxic/Antiproliferative Action of Combination with Topotecan and Etoposide
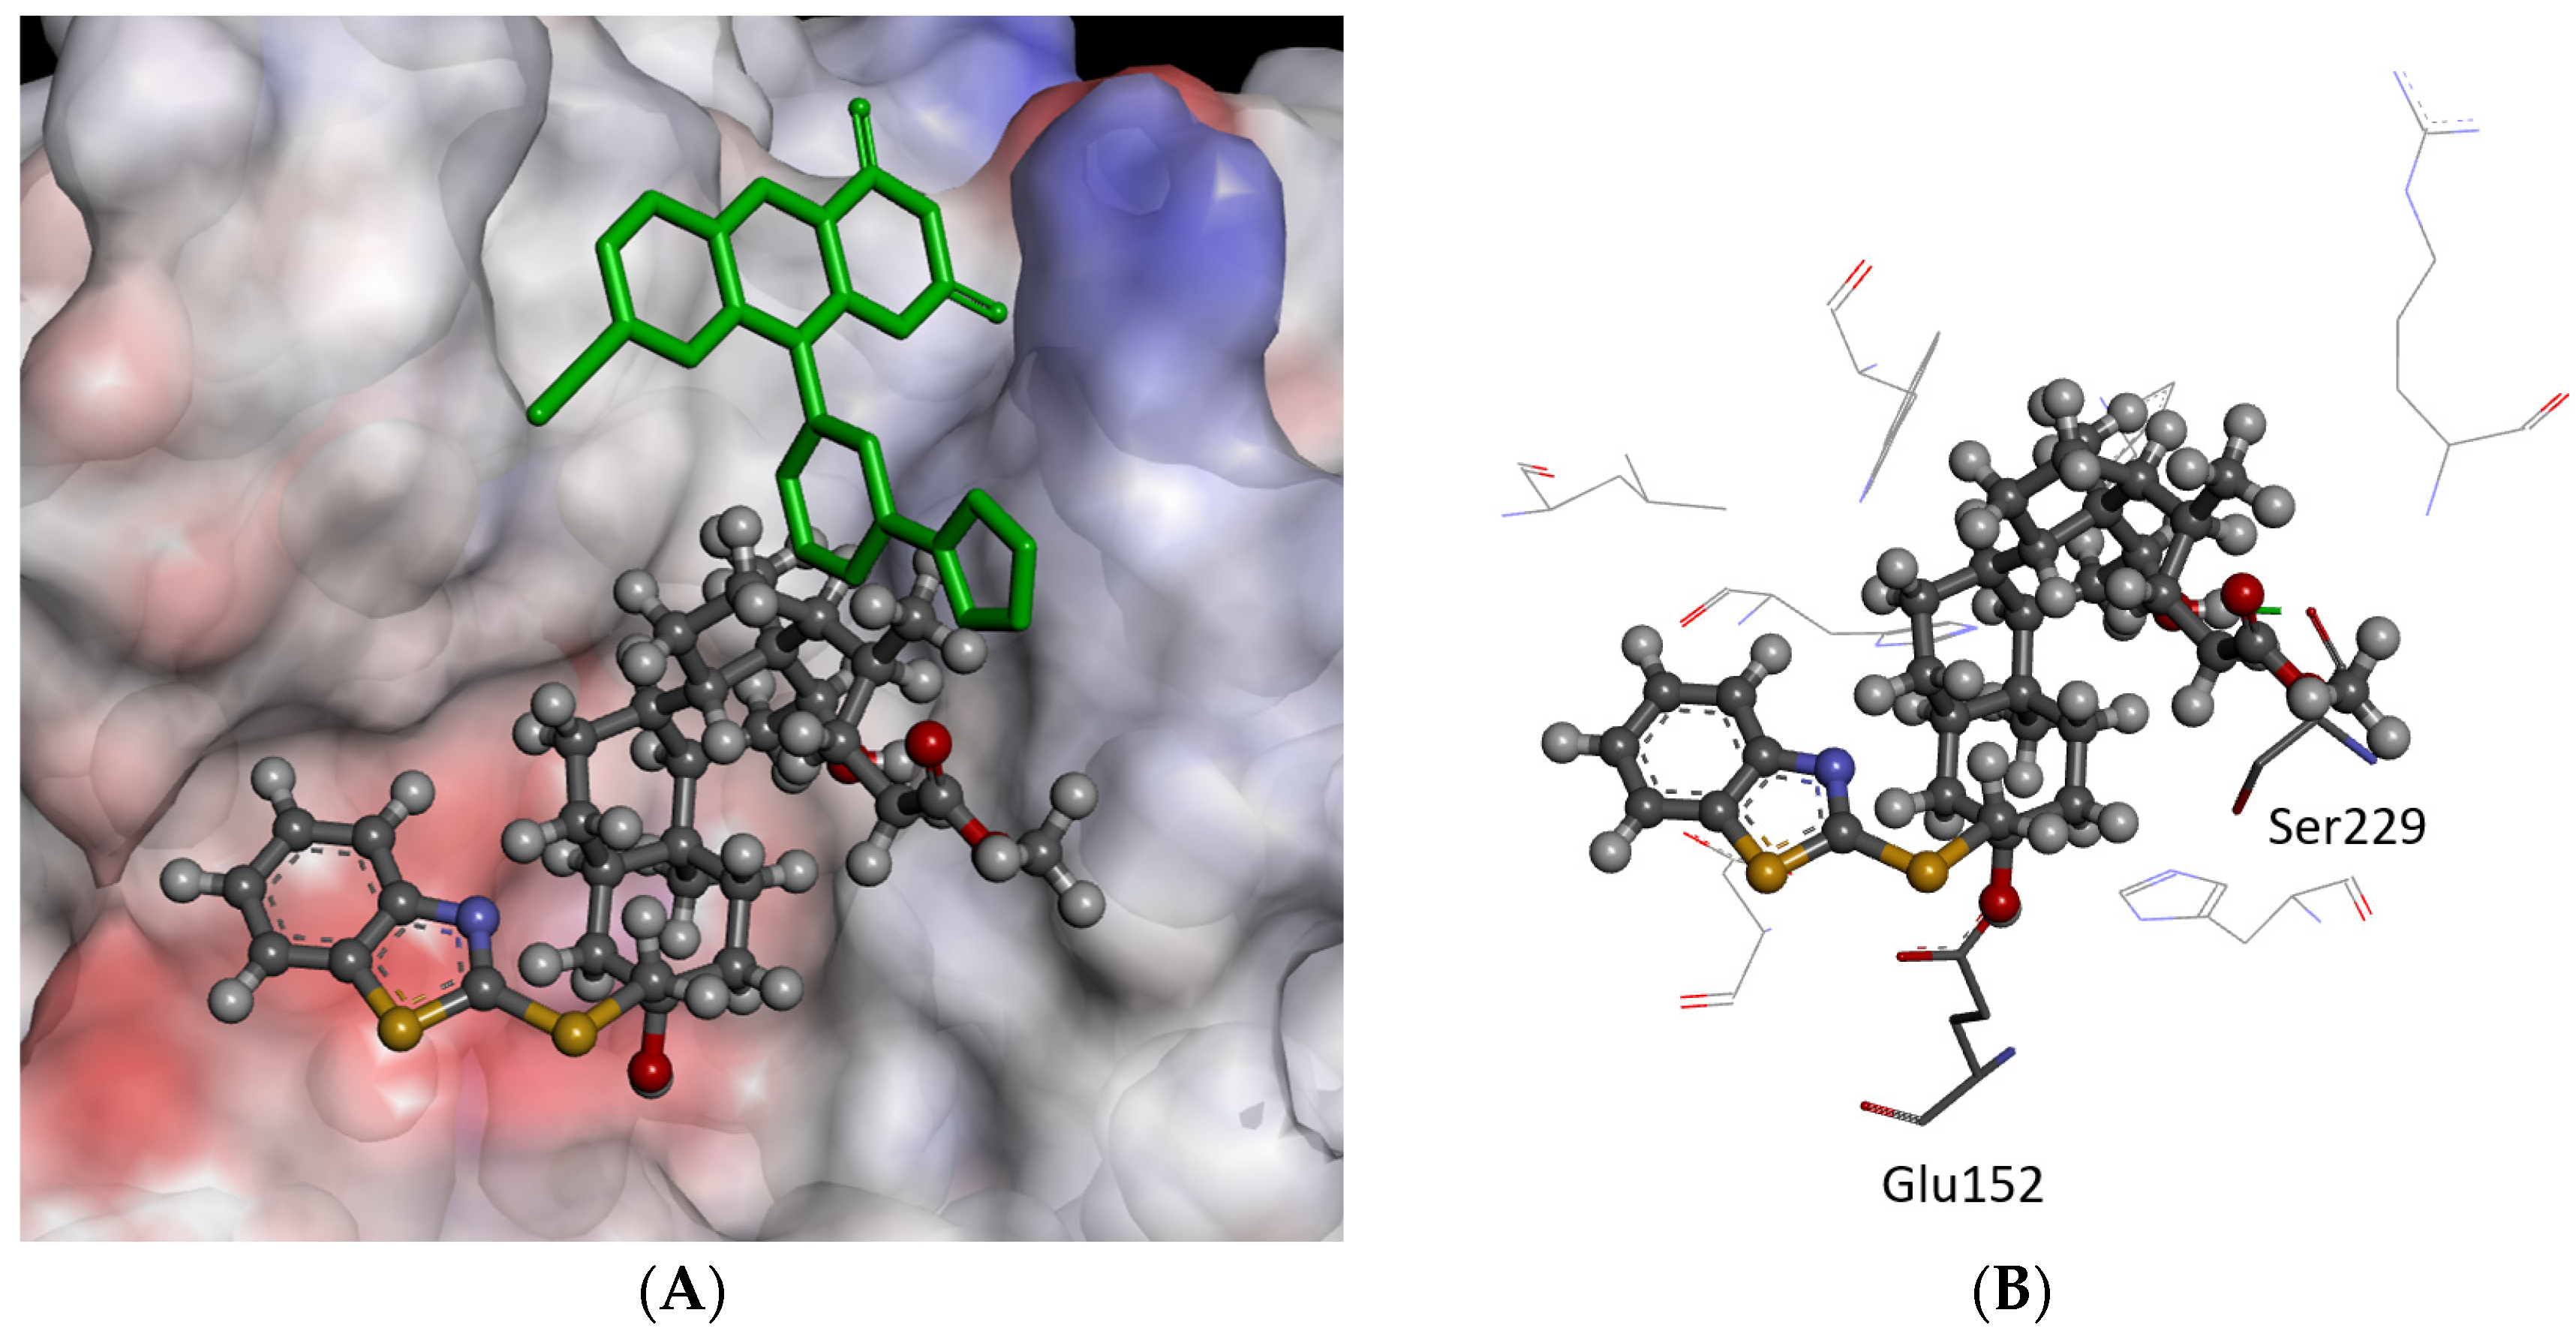
2.3. Molecular Modeling
2.4. Prediction of Physicochemical and Drug-like Properties
2.5. Solubility Evaluation of Compounds (3a–e and 4d–f) and in Aqueous Media
3. Materials and Methods
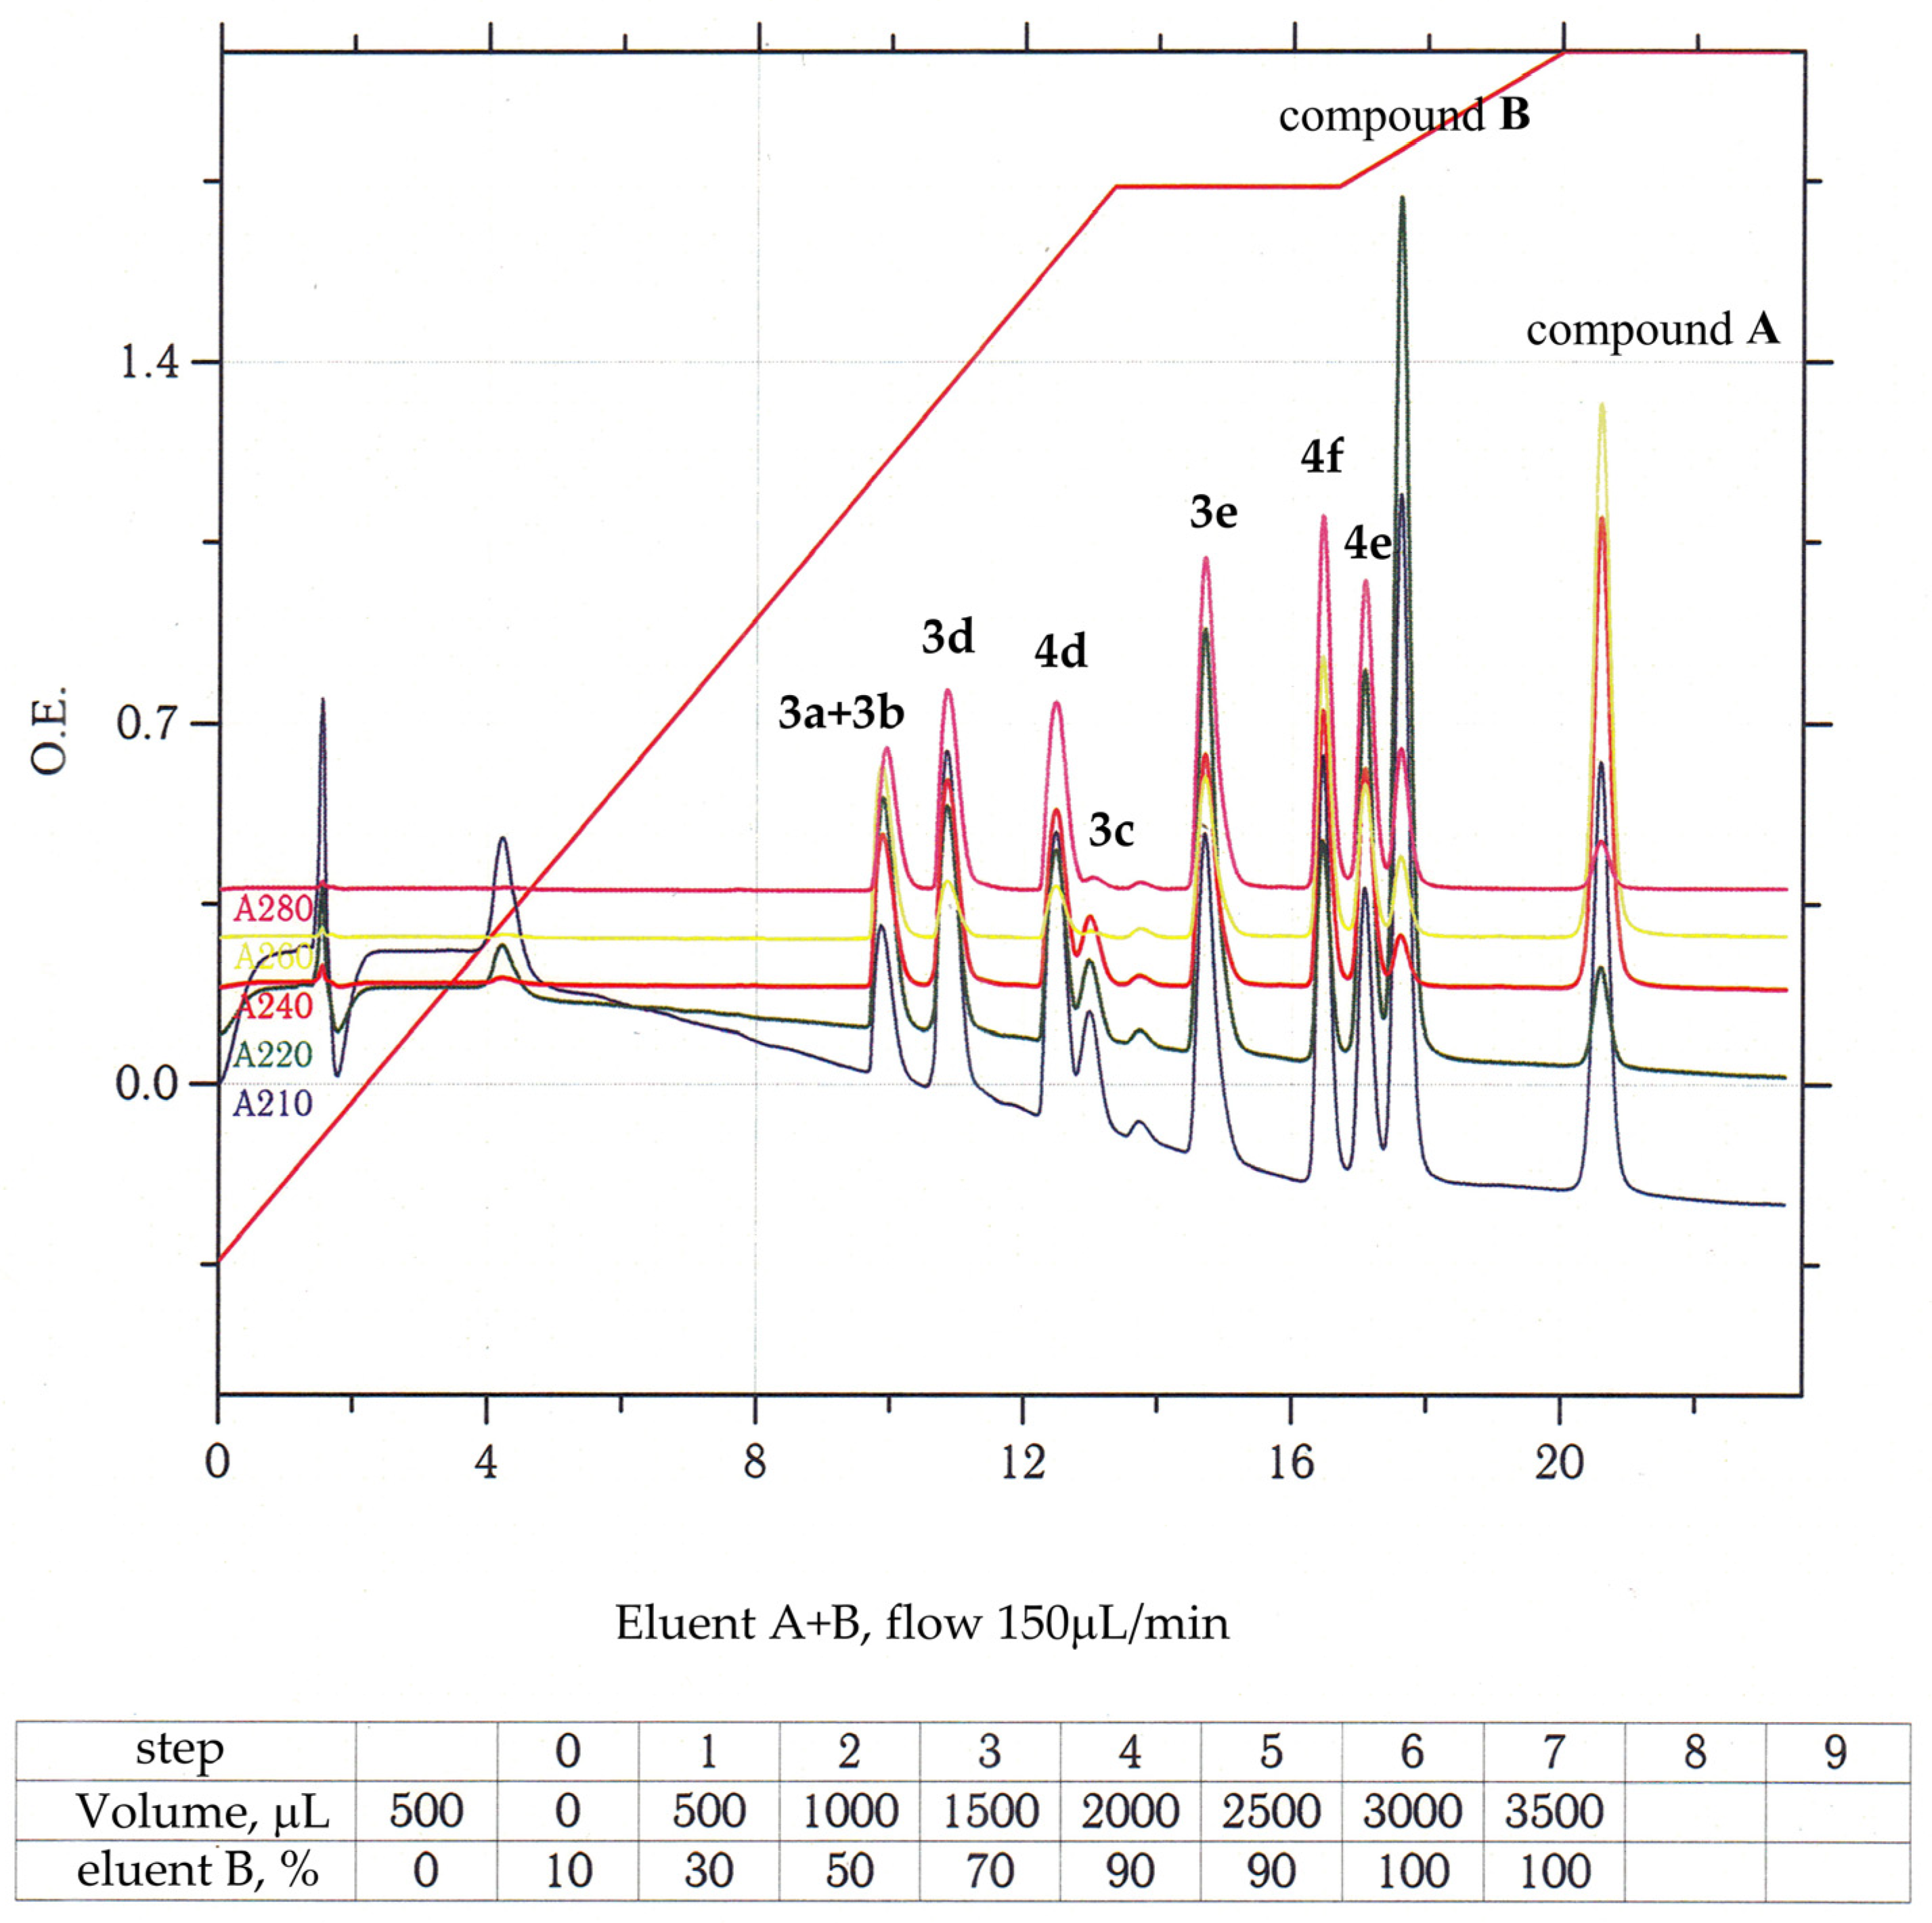
3.1. Chemistry and General Experimental Procedures
3.2. Reagents
3.2.1. General Procedure A for Epoxide Ring Opening with S-Nucleophiles
3.2.2. General Procedure B for Epoxide Ring Opening with S-Nucleophiles
3.2.3. 3β,12α-Dihydroxy-3α-((pyrydin-4-ylthio)methyl)-5β-cholan-24-oic Acid (3a)
3.2.4. 3β,12α-Dihydroxy-3α-((1-methyl-1H-imidazol-2-ylthio)methyl)-5β-cholan-24-oic Acid (3b)
3.2.5. 3β,12α-Dihydroxy-3α-((1H-1,2,4-triazol-5-ylthio)methyl)-5β-cholan-24-oic Acid (3c)
3.2.6. 3β,12α-Dihydroxy-3α-(5-methyl-1H-benzo[d]imidazol-2-ylthio)methyl)-5β-cholan-24-oic Acid (3d)
3.2.7. 3β,12α-Dihydroxy-3α-(benzo[d]thiazol-2-ylthio)methyl)-5β-cholan-24-oic Acid (3e)
3.2.8. Methyl 3α-(5-methyl-1H-benzo[d]imidazol-2-ylthio)methyl)-3β,12α-dihydroxy-5β-cholan-24-oate (4d)
3.2.9. Methyl 3α-(benzo[d]thiazol-2-ylthio)methyl)-3β,12α-dihydroxy-5β-cholan-24-oate (4e)
3.2.10. Methyl 3α-(benzo[d]oxazol-2-ylthio)methyl)-3β,12α-dihydroxy-5β-cholan-24-oate (4f)
3.3. Biology
3.3.1. Detection of TDP1 Activity
3.3.2. Gel-Based TDP2 Activity Assay
3.3.3. Study of Cytotoxic/Antiproliferative Effects of Compounds
3.4. Modeling and Screening
4. Conclusions
Supplementary Materials
Author Contributions
Funding
Institutional Review Board Statement
Informed Consent Statement
Data Availability Statement
Acknowledgments
Conflicts of Interest
References
- Hosoya, N.; Miyagawa, K. Targeting DNA damage response in cancer therapy. Cancer Sci. 2014, 105, 370–388. [Google Scholar] [CrossRef] [PubMed]
- Kelley, M.R.; Fishel, M.L. DNA repair proteins as molecular targets for cancer therapeutics. Anticancer Agents Med. Chem. 2008, 8, 417–425. [Google Scholar] [CrossRef] [PubMed]
- Visnes, T.; Grube, M.; Hanna, B.M.F.; Benitez-Buelga, C.; Cázares-Körner, A.; Helleday, T. Targeting BER enzymes in cancer therapy. DNA Repair 2018, 71, 118–126. [Google Scholar] [CrossRef]
- Obata, H.; Ogawa, M.; Zalutsky, M.R. DNA Repair Inhibitors: Potential Targets and Partners for Targeted Radionuclide Therapy. Pharmaceutics 2023, 15, 1926. [Google Scholar] [CrossRef] [PubMed]
- Li, L.Y.; Guan, Y.D.; Chen, X.S.; Yang, J.M.; Cheng, Y. DNA Repair Pathways in Cancer Therapy and Resistance. Front. Pharmacol. 2021, 11, 629266. [Google Scholar] [CrossRef]
- Huang, R.; Zhou, P.K. DNA damage repair: Historical perspectives, mechanistic pathways and clinical translation for targeted cancer therapy. Sig. Transduct. Target. Ther. 2021, 6, 254. [Google Scholar] [CrossRef]
- Champoux, J.J. DNA topoisomerases: Structure, function, and mechanism. Annu. Rev. Biochem. 2001, 70, 369–413. [Google Scholar] [CrossRef]
- Bush, N.G.; Evans-Roberts, K.; Maxwell, A. DNA Topoisomerases. EcoSal Plus 2015, 6. [Google Scholar] [CrossRef]
- Nitiss, J.L.; Kiianitsa, K.; Sun, Y.; Nitiss, K.C.; Maizels, N. Topoisomerase Assays. Curr. Protoc. 2021, 1, e250. [Google Scholar] [CrossRef]
- McKie, S.J.; Neuman, K.C.; Maxwell, A. DNA topoisomerases: Advances in understanding of cellular roles and multi-protein complexes via structure-function analysis. Bioessays 2021, 43, e2000286. [Google Scholar] [CrossRef]
- Seddek, A.; Madeira, C.; Annamalai, T.; Mederos, C.; Tiwari, P.B.; Welch, A.Z.; Tse-Dinh, Y.C. A Yeast-Based Screening System for Differential Identification of Poisons and Suppressors of Human Topoisomerase I. Front. Biosci. 2022, 27, 93. [Google Scholar] [CrossRef] [PubMed]
- Delgado, J.L.; Hsieh, C.M.; Chan, N.L.; Hiasa, H. Topoisomerases as anticancer targets. Biochem. J. 2018, 475, 373–398. [Google Scholar] [CrossRef] [PubMed]
- Kathiravan, M.K.; Kale, A.N.; Nilewar, S. Discovery and Development of Topoisomerase Inhibitors as Anticancer Agents. Med. Chem. 2016, 16, 1219–1229. [Google Scholar] [CrossRef] [PubMed]
- Singh, S.; Pandey, V.P.; Yadav, K.; Yadav, A.; Dwivedi, U.N. Natural Products as Anti-Cancerous Therapeutic Molecules Targeted towards Topoisomerases. Curr. Protein Pept. Sci. 2020, 21, 1103–1142. [Google Scholar] [CrossRef]
- Pommier, Y.; Huang, S.N.; Rui, G.; Das, B.B.; Murai, J.; Marchand, C. Tyrosyl-DNA-phosphodiesterases (TDP1 and TDP2). DNA Repair 2014, 19, 114–129. [Google Scholar] [CrossRef] [PubMed]
- Tsuda, M.; Kitamasu, K.; Kumagai, C.; Sugiyama, K.; Nakano, T.; Ide, H. Tyrosyl-DNA phosphodiesterase 2 (TDP2) repairs topoisomerase 1 DNA-protein crosslinks and 3′-blocking lesions in the absence of tyrosyl-DNA phosphodiesterase 1 (TDP1). DNA Repair 2020, 91–92, 102849. [Google Scholar] [CrossRef] [PubMed]
- Murai, J.; Huang, S.N.; Das, B.B.; Dexheimer, T.S.; Takeda, S.; Pommier, Y. Tyrosyl-DNA Phosphodiesterase 1 (TDP1) Repairs DNA Damage Induced by Topoisomerases I and II and Base Alkylation in Vertebrate Cells. J. Biol. Chem. 2012, 287, 12848–12857. [Google Scholar] [CrossRef] [PubMed]
- Ribeiro, C.J.A.; Kankanala, J.; Xie, J.; Williams, J.; Aihara, H.; Wang, Z. Triazolopyrimidine and triazolopyridine scaffolds as TDP2 inhibitors. Bioorganic Med. Chem. Lett. 2019, 29, 257–261. [Google Scholar] [CrossRef]
- Kiselev, E.; Ravji, A.; Kankanala, J.; Xie, J.; Wang, Z.; Pommier, Y. Novel deazaflavin tyrosyl-DNA phosphodiesterase 2 (TDP2) inhibitors. DNA Repair 2020, 85, 102747. [Google Scholar] [CrossRef]
- Salomatina, O.V.; Popadyuk, I.I.; Zakharenko, A.L.; Zakharova, O.D.; Fadeev, D.S.; Komarova, N.I.; Reynisson, J.; Arabshahi, H.J.; Chand, R.; Volcho, K.P.; et al. Novel Semisynthetic Derivatives of Bile Acids as Effective Tyrosyl-DNA Phosphodiesterase 1 Inhibitors. Molecules 2018, 23, 679. [Google Scholar] [CrossRef]
- Salomatina, O.V.; Popadyuk, I.I.; Zakharenko, A.L.; Zakharova, O.D.; Chepanova, A.A.; Dyrkheeva, N.S.; Komarova, N.I.; Reynisson, J.; Anarbaev, R.O.; Salakhutdinov, N.F.; et al. Deoxycholic acid as a molecular scaffold for tyrosyl-DNA phosphodiesterase 1 inhibition: A synthesis, structure-activity relationship and molecular modeling study. Steroids 2021, 165, 108771. [Google Scholar] [CrossRef] [PubMed]
- Salomatina, O.V.; Dyrkheeva, N.S.; Popadyuk, I.I.; Zakharenko, A.L.; Ilina, E.S.; Komarova, N.I.; Reynisson, J.; Salakhutdinov, N.F.; Lavrik, O.I.; Volcho, K.P. New Deoxycholic Acid Derived Tyrosyl-DNA Phosphodiesterase 1 Inhibitors Also Inhibit Tyrosyl-DNA Phosphodiesterase 2. Molecules 2022, 27, 72. [Google Scholar] [CrossRef] [PubMed]
- Aher, N.G.; Pore, V.S.; Mishra, N.N.; Shukla, P.K.; Gonnade, R.G. Design and synthesis of bile acid-based amino sterols as antimicrobial agents. Bioorg. Med. Chem. Lett. 2009, 19, 5411–5414. [Google Scholar] [CrossRef] [PubMed]
- Elberembally, K. A new procedure for the synthesis of α-acyloxy aldehydes from ketones via α,β-epoxy sulfides. J. Sulfur. Chem. 2015, 36, 482–493. [Google Scholar] [CrossRef]
- Startseva, V.A.; Bodrov, A.V.; Aref’ev, A.V.; Kuznetsov, I.V.; Lodochnikova, O.A.; Klochkov, V.V.; Nikitina, L.E. Synthesis of New Pinane-Type Hetarylsulfides. Chem. Nat. Compd. 2014, 50, 652–657. [Google Scholar] [CrossRef]
- Das, B.; Damodar, K. Epoxides and Oxetanes. In Heterocycles in Natural Product Synthesis; Majumdar, K.C., Chattopadhyay, S.K., Eds.; John Wiley & Sons: Hoboken, NJ, USA, 2011. [Google Scholar] [CrossRef]
- Saddique, F.A.; Zahoor, A.F.; Faiz, S.; Naqvi, S.A.R.; Usman, M.; Ahmad, M. Recent trends in ring opening of epoxides by amines as nucleophiles. Synth. Commun. 2016, 46, 831–868. [Google Scholar] [CrossRef]
- Choo, K.; Mirabi, B.; Demmans, K.Z.; Lautens, M. Enantioselective Synthesis of Spiro-oxiranes: An Asymmetric Addition/Aldol/Spirocyclization Domino Cascade. Angew. Chem. Int. Ed. 2021, 60, 21189. [Google Scholar] [CrossRef]
- Zakharenko, A.L.; Khomenko, T.M.; Zhukova, S.V.; Koval, O.A.; Zakharova, O.D.; Anarbaev, R.O.; Lebedeva, N.A.; Korchagina, D.V.; Komarova, N.I.; Vasiliev, V.G.; et al. Synthesis and biological evaluation of novel tyrosyl-DNA phosphodiesterase 1 inhibitors with a benzopentathiepine moiety. Bioorg. Med. Chem. 2015, 23, 2044–2052. [Google Scholar] [CrossRef]
- Antony, S.; Marchand, C.; Stephen, A.G.; Thibaut, L.; Agama, K.K.; Fisher, R.J.; Pommier, Y. Novel high-throughput electrochemiluminescent assay for identification of human tyrosyl–DNA phosphodiesterase (Tdp1) inhibitors and characterization of furamidine (NSC 305831) as an inhibitor of Tdp1. Nucleic Acids Res. 2007, 35, 4474–4484. [Google Scholar] [CrossRef]
- Zhao, X.Z.; Kiselev, E.; Lountos, G.T.; Wang, W.; Tropea, J.E.; Needle, D.; Hilimire, T.A.; Schneekloth, J.S.; Waugh, D.S.; Pommier, Y.; et al. Small Molecule Microarray Identifies Inhibitors of Tyrosyl-DNA Phosphodiesterase 1 that Simultaneously Access the Catalytic Pocket and Two Substrate Binding Sites. Chem. Sci. 2021, 12, 3876–3884. [Google Scholar] [CrossRef]
- Hornyak, P.; Askwith, T.; Walker, S.; Komulainen, E.; Paradowski, M.; Pennicott, L.E.; Bartlett, E.J.; Brissett, N.C.; Raoof, A.; Watson, M.; et al. Mode of Action of DNA-Competitive Small Molecule Inhibitors of Tyrosyl DNA Phosphodiesterase 2. Biochem. J. 2016, 473, 1869–1879. [Google Scholar] [CrossRef] [PubMed]
- Jones, G.; Willet, P.; Glen, R.C.; Leach, A.R.; Taylor, R. Development and Validation of a Genetic Algorithm for Flexible Docking. J. Mol. Biol. 1997, 267, 727–748. [Google Scholar] [CrossRef] [PubMed]
- Eldridge, M.D.; Murray, C.; Auton, T.R.; Paolini, G.V.; Mee, P.M. Empirical Scoring Functions: I. the Development of a Fast Empirical Scoring Function to Estimate the Binding Affinity of Ligands in Receptor Complexes. J. Comp. Aided Mol. Des. 1997, 11, 425–445. [Google Scholar] [CrossRef] [PubMed]
- Verdonk, M.L.; Cole, J.C.; Hartshorn, M.J.; Murray, C.W.; Taylor, R.D. Improved Protein-Ligand Docking using GOLD. Proteins 2003, 52, 609–623. [Google Scholar] [CrossRef] [PubMed]
- Korb, O.; Stützle, T.; Exner, T.E. Empirical Scoring Functions for Advanced Protein−Ligand Docking with PLANTS. J. Chem. Inf. Model. 2009, 49, 84–96. [Google Scholar] [CrossRef] [PubMed]
- Mooij, W.T.M.; Verdonk, M.L. General and Targeted Statistical Potentials for Protein–ligand Interactions. Proteins 2005, 61, 272–287. [Google Scholar] [CrossRef] [PubMed]
- Wang, Z.; Sun, H.; Yao, X.; Li, D.; Xu, L.; Li, Y.; Tian, S.; Hou, T. Comprehensive Evaluation of Ten Docking Programs on a Diverse Set of Protein–ligand Complexes: The Prediction Accuracy of Sampling Power and Scoring Power. Phys. Chem. Chem. Phys PCCP 2016, 18, 12964–12975. [Google Scholar] [CrossRef] [PubMed]
- Bissantz, C.; Folkers, G.; Rognan, D. Protein-Based Virtual Screening of Chemical Databases. 1. Evaluation of Different Docking/Scoring Combinations. J. Med. Chem. 2000, 43, 4759–4767. [Google Scholar] [CrossRef]
- Zakharenko, A.; Luzina, O.; Koval, O.; Nilov, D.; Gushchina, I.; Dyrkheeva, N.; Švedas, V.; Salakhutdinov, N.; Lavrik, O. Tyrosyl-DNA Phosphodiesterase 1 Inhibitors: Usnic Acid Enamines Enhance the Cytotoxic Effect of Camptothecin. J. Nat. Prod. 2016, 79, 2961–2967. [Google Scholar] [CrossRef]
- Eurtivong, C.; Reynisson, J. The Development of a Weighted Index to Optimise Compound Libraries for High Throughput Screening. Mol. Inf. 2018, 37, 1800068. [Google Scholar] [CrossRef]
- Dyrkheeva, N.S.; Filimonov, A.S.; Luzina, O.A.; Orlova, K.A.; Chernyshova, I.A.; Kornienko, T.E.; Malakhova, A.A.; Medvedev, S.P.; Zakharenko, A.L.; Ilina, E.S.; et al. New Hybrid Compounds Combining Fragments of Usnic Acid and Thioether Are Inhibitors of Human Enzymes TDP1, TDP2 and PARP1. Int. J. Mol. Sci. 2021, 22, 11336. [Google Scholar] [CrossRef] [PubMed]
- Berman, H.M.; Westbrook, J.; Feng, Z.; Gilliland, G.; Bhat, T.N.; Weissig, H.; Shindyalov, I.N.; Bourne, P.E. The Protein Data Bank. Nuc. Acids Res. 2000, 28, 235–242. [Google Scholar] [CrossRef] [PubMed]
- Berman, H.; Henrick, K.; Nakamura, H. Announcing the Worldwide Protein Data Bank. Nat. Struct. Biol. 2003, 10, 980. [Google Scholar] [CrossRef]
- Scigress. Vers. F.Q 3.4.4. Kyushu Systems Ltd. 2008–2023. Available online: http://www.scigress.com (accessed on 1 November 2023).
- Allinger, N.L.; Yuh, Y.H.; Lii, J.H. Molecular Mechnics. The MM3 Force Field for Hydrocarbons. 1. J. Am. Chem. Soc. 1989, 111, 8551–8565. [Google Scholar] [CrossRef]
- Lii, J.H.; Allinger, N.L. Molecular Mechanics. The MM3 FOrce Field for Hydrocarbons. 2. Vibrational Frequencies and Thermodynamics. J. Am. Chem. Soc. 1989, 111, 8566–8575. [Google Scholar] [CrossRef]
- Lii, J.H.; Allinger, N.L. Molecular Mechanics. The MM3 Force Field for Hydrocarbons. 3. The Van Der Waals’ Potentials and Crystal Data for Aliphatic and Aromatic Hydrocarbons. J. Am. Chem. Soc. 1989, 111, 8576–8582. [Google Scholar] [CrossRef]
- Gotō, H.; Ōsawa, E. An Efficient Algorithm for Searching Low-Energy Conformers of Cyclic and Acyclic Molecules. J. Chem. Soc. 1993, 2, 187–198. [Google Scholar] [CrossRef]
- QikProp, Version 6.2; Schrödinger: New York, NY, USA, 2021.
- Ioakimidis, L.; Thoukydidis, L.; Naeem, S.; Mirza, A.; Reynisson, J. Benchmarking the Reliability of QikProp. Correlation between Experimental and Predicted Values. QSAR Comb. Sci. 2008, 27, 445–456. [Google Scholar] [CrossRef]


| Compound | TDP1 IC50 1, μM | TDP2 IC50 1, μM | TDP2 2, % | HeLa CC50 3, μM | |
|---|---|---|---|---|---|
 | |||||
| 3a |  | 22 ± 2 | ND | 92 ± 3 | ND |
| 3b | 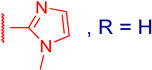 | 30 ± 7 | ND | ≥100 | ND |
| 3c |  | 32 ± 4 | ND | ≥100 | ND |
| 3d |  | 25 ± 4 | 250 ± 30 | 24 ± 5 | 63 ± 6 |
| 3e |  | 14 ± 2 | 76 ± 13 | 2 ± 3 | 75 ± 13 |
| 4d | 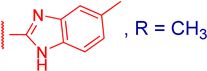 | 0.94 ± 0.04 | 218 ± 7 | 14 ± 5 | 50 ± 13 |
| 4e | 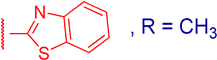 | 0.63 ± 0.03 | ND | 49 ± 2 | >100 |
| 4f |  | 1.8 ± 0.5 | ND | ≥100 | ND |
| Fur 4 | 1.2 ± 0.3 | ND | ND | ND | |
| Topotecan | ND | ND | ND | 0.9 ± 0.1 | |
| Etoposide | ND | ND | ND | 6.2 ± 0.6 | |
Disclaimer/Publisher’s Note: The statements, opinions and data contained in all publications are solely those of the individual author(s) and contributor(s) and not of MDPI and/or the editor(s). MDPI and/or the editor(s) disclaim responsibility for any injury to people or property resulting from any ideas, methods, instructions or products referred to in the content. |
© 2024 by the authors. Licensee MDPI, Basel, Switzerland. This article is an open access article distributed under the terms and conditions of the Creative Commons Attribution (CC BY) license (https://creativecommons.org/licenses/by/4.0/).
Share and Cite
Salomatina, O.V.; Kornienko, T.E.; Zakharenko, A.L.; Komarova, N.I.; Achara, C.; Reynisson, J.; Salakhutdinov, N.F.; Lavrik, O.I.; Volcho, K.P. New Dual Inhibitors of Tyrosyl-DNA Phosphodiesterase 1 and 2 Based on Deoxycholic Acid: Design, Synthesis, Cytotoxicity, and Molecular Modeling. Molecules 2024, 29, 581. https://doi.org/10.3390/molecules29030581
Salomatina OV, Kornienko TE, Zakharenko AL, Komarova NI, Achara C, Reynisson J, Salakhutdinov NF, Lavrik OI, Volcho KP. New Dual Inhibitors of Tyrosyl-DNA Phosphodiesterase 1 and 2 Based on Deoxycholic Acid: Design, Synthesis, Cytotoxicity, and Molecular Modeling. Molecules. 2024; 29(3):581. https://doi.org/10.3390/molecules29030581
Chicago/Turabian StyleSalomatina, Oksana V., Tatyana E. Kornienko, Alexandra L. Zakharenko, Nina I. Komarova, Chigozie Achara, Jóhannes Reynisson, Nariman F. Salakhutdinov, Olga I. Lavrik, and Konstantin P. Volcho. 2024. "New Dual Inhibitors of Tyrosyl-DNA Phosphodiesterase 1 and 2 Based on Deoxycholic Acid: Design, Synthesis, Cytotoxicity, and Molecular Modeling" Molecules 29, no. 3: 581. https://doi.org/10.3390/molecules29030581
APA StyleSalomatina, O. V., Kornienko, T. E., Zakharenko, A. L., Komarova, N. I., Achara, C., Reynisson, J., Salakhutdinov, N. F., Lavrik, O. I., & Volcho, K. P. (2024). New Dual Inhibitors of Tyrosyl-DNA Phosphodiesterase 1 and 2 Based on Deoxycholic Acid: Design, Synthesis, Cytotoxicity, and Molecular Modeling. Molecules, 29(3), 581. https://doi.org/10.3390/molecules29030581