Article

Exploration of the Dynamic Variations of the Characteristic Constituents and the Degradation Products of Catalpol during the Process of Radix Rehmanniae

1
National Key Laboratory of Chinese Medicine Modernization, State Key Laboratory of Component-Based Chinese Medicine, Tianjin Key Laboratory of TCM Chemistry and Analysis, Tianjin University of Traditional Chinese Medicine, Tianjin 301617, China
2
Haihe Laboratory of Modern Chinese Medicine, Tianjin 301617, China
*
Authors to whom correspondence should be addressed.
These authors contributed equally to this work.
Molecules 2024, 29(3), 705; https://doi.org/10.3390/molecules29030705
Submission received: 3 January 2024 / Revised: 30 January 2024 / Accepted: 1 February 2024 / Published: 3 February 2024
(This article belongs to the Section Analytical Chemistry)

Abstract

:
Radix Rehmanniae (RR), a famous traditional Chinese medicine (TCM) widely employed in nourishing Yin and invigorating the kidney, has three common processing forms in clinical practice, including fresh Radix Rehmanniae (FRR), raw Radix Rehmanniae (RRR), and processed Radix Rehmanniae (PRR). However, until now, there has been less exploration of the dynamic variations in the characteristic constituents and degradation products of catalpol as a representative iridoid glycoside with the highest content in RR during the process from FRR to PRR. In this study, an ultra-performance liquid chromatography coupled with photodiode array detector (UPLC-PDA) method was successfully established for the simultaneous determination of ten characteristic components to explore their dynamic variations in different processed products of RR. Among them, iridoid glycosides, especially catalpol, exhibited a sharp decrease from RRR to PRR. Then, three degradation products of catalpol were detected under simulated processing conditions (100 °C, pH 4.8 acetate buffer solution), which were isolated and identified as jiofuraldehyde, cataldehyde, and norviburtinal, respectively. Cataldehyde was first reported as a new compound. Moreover, the specificity of norviburtinal in self-made PRR samples was discovered and validated, which was further confirmed by testing in commercially available PRR samples. In conclusion, our study revealed the decrease in iridoid glycosides and the production of new degradation substances during the process from FRR to PRR, which is critical for unveiling the processing mechanism of RR.

Graphical Abstract

1. Introduction

Rehmannia glutinosa Libosch., a member of the Scrophulariaceae family, is widely distributed in different regions of China, such as Henan, Hebei, and Shanxi Provinces [1]. Radix Rehmanniae (RR) is the root of R. glutinosa [2], which is classified into the top grade by Shennong’s Classic of Materia Medica. RR is employed in a variety of famous traditional Chinese medicine (TCM) prescriptions, such as Liuwei Dihuang Pill, Zhibai Dihuang Pill, Qiju Dihuang Pill, and Dihuang Yinzi, owing to its ability to nourish Yin and tonify the kidney [3,4]. There are three processing forms frequently used in clinic, including fresh Radix Rehmanniae (FRR), raw Radix Rehmanniae (RRR), and processed Radix Rehmanniae (PRR), with their pharmacological actions varying greatly from heat-clearing to tonification [5].
There must be chemical variations behind the change in their efficacy, giving rise to different clinical applications. At present, hundreds of chemical constituents have been isolated and identified from R. glutinosa, including iridoids, ionones, phenylethanoid glycosides, triterpenoids, flavonoids, saccharides, amino acids, and so on [6,7]. It was also reported that the degradation of certain components, such as catalpol (Cat), leonuride (Leo), rehmannioside A, rehmannioside D (RhD), stachyose, raffinose, sucrose, and amino acids, and the formation of fructose, glucose, and 5-hydroxymethylfurfural synchronously occurred in the process from RRR to PRR [8,9]. As the characteristic compounds of iridoids, Cat is stipulated as the indicator for the quality evaluation of RRR by the Chinese pharmacopoeia (ChP), which has been proven to exhibit cardioprotective [10], anti-osteoporotic [11], anti-atherosclerotic [12], anti-inflammatory [13], antidiabetic [14], neuroprotective [15], and liver protective effects [16]. However, it is hard to detect Cat in PRR, suggesting the occurrence of a series of hydrolysis and polymerization reactions during the steaming process [17]. Researchers investigated the degradation characteristics of Cat under different exposure conditions [18,19]. However, the kinds of degradation products generated from Cat have not yet been studied.
Processing plays a crucial role in the quality and application of PRR. However, specific processing parameters such as processing cycles, steaming time, and subsidiary material are not yet clear. Moreover, it is too subjective to determine the endpoint of the preparation of PRR by the criterion of “color black as lacquer, sweet as candy” [20]. At the same time, it is infeasible to distinguish RRR and PRR only through appearance identification by virtue of their similar colors, giving rise to misuse and failure to achieve their clinical efficacy [21]. Therefore, it is necessary to search for a specific chemical marker to distinguish RRR from PRR.
In this study, we focused on dynamic variations of representative compounds in the process from FRR to PRR, including iridoid glycosides, nucleosides, and phenylethanol glycosides, using ultra-performance liquid chromatography with the photo-diode array detector (UPLC-PDA) method, which was first investigated. Among them, iridoid glycosides gained our attention because their contents presented a sharp decrease from RRR to PRR, especially Cat. Then, three degradation products of Cat were successfully discovered and elucidated under simulated processing conditions (100 °C, pH 4.8 acetate buffer solution). Cataldehyde, one of the degradation products from Cat, was reported as a new compound. Moreover, the specificity of degradation products of Cat was explored by comparing RRR and PRR samples. This paper aims to demonstrate that quantitative and qualitative changes occur in the process from FRR to PRR, which will contribute to illumination on the processing-induced chemical transformations in RR, providing a reliable reference for the development of quality standards for PRR.

2. Results and Discussions

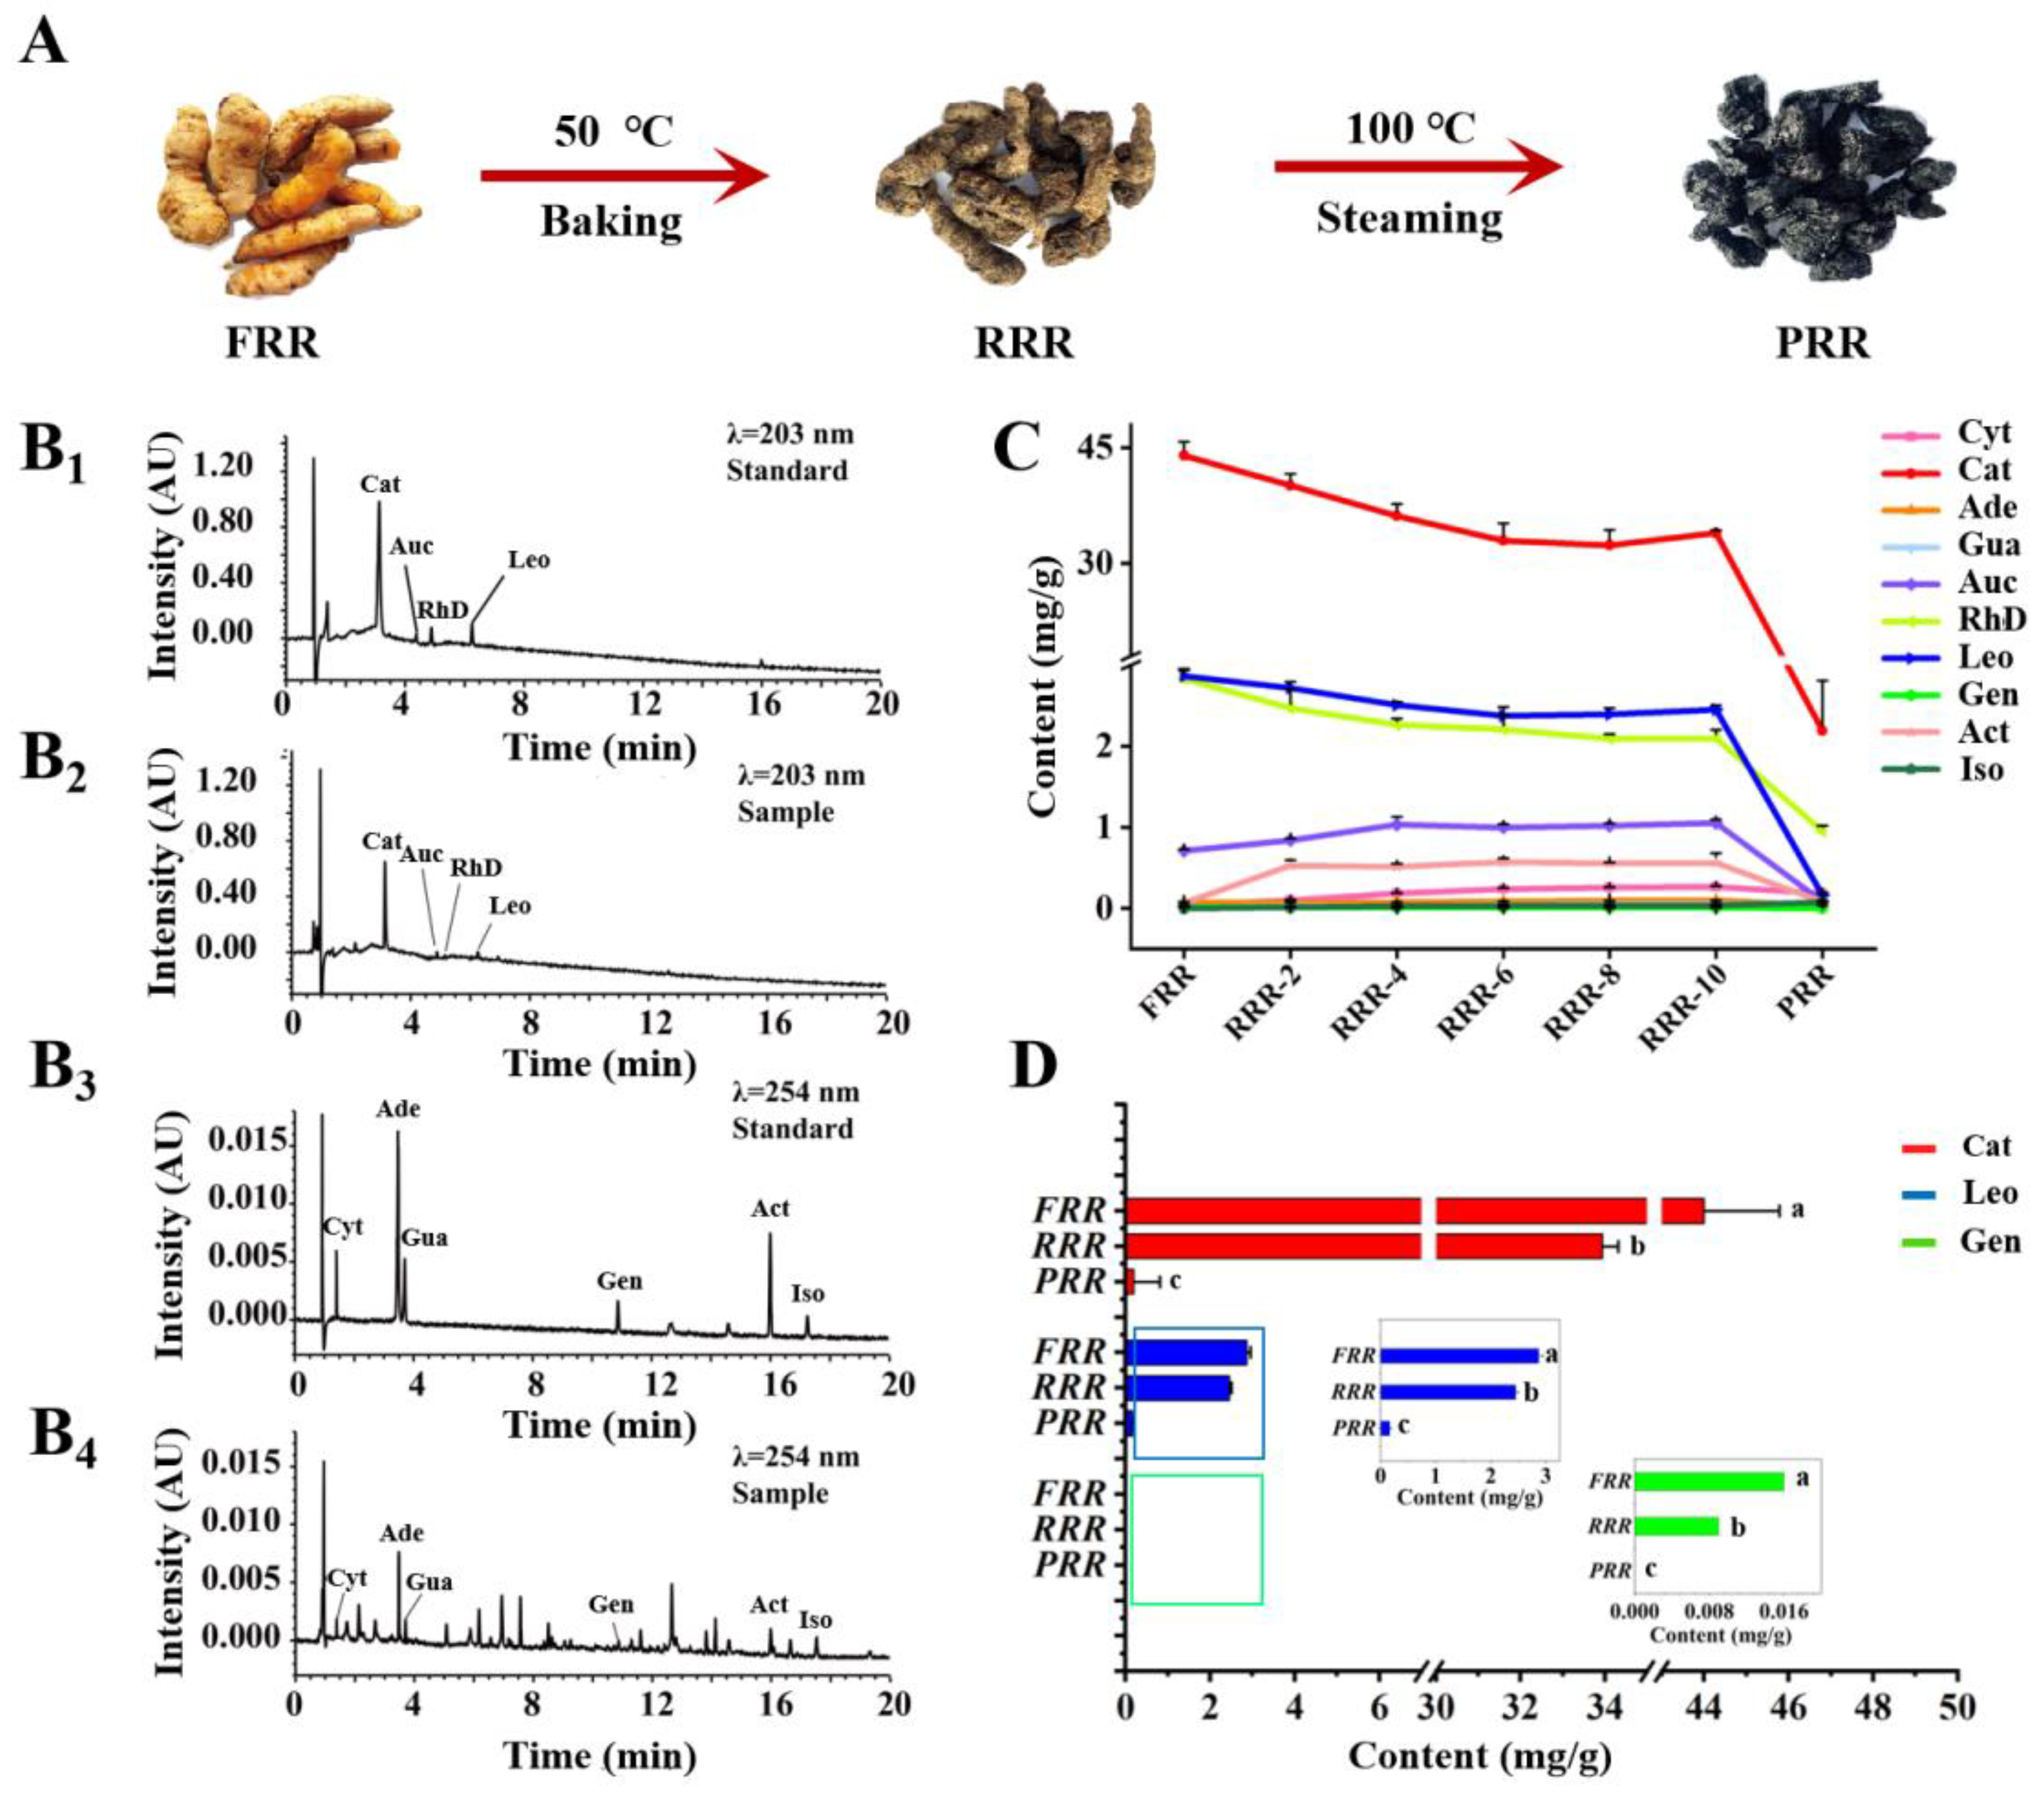
2.1. Methodological Validation of UPLC-PDA Analysis for Quantitation of Ten Compounds in RR

As shown in Figure 1A, after baking at 50 °C and steaming at 100 °C, the color of RR samples gradually darkened and the texture became sticky. A rapid UPLC-PDA quantification was further developed to investigate content changes behind the variations in appearance. To improve the resolution and sensitivity of the tested compounds, gradient elution, column temperature, and detection wavelength were systematically optimized. In addition, the sample preparation method of ten compounds was optimized by investigating the extraction solvent, extraction temperature, material/solvent ratio, and ultrasonic time to achieve the highest extracting efficiency (see Supplementary Materials, Table S1). The typical chromatograms of the sample and mixed standard solution are displayed in Figure 1(B1–B4).
The systematical method validation was carried out in terms of linearity, the limit of detection (LOD), the limit of quantitation (LOQ), precision, repeatability, stability, and recovery. As shown in Table 1, the calibration curves of ten compounds were established with the determination coefficient (r2) exceeding 0.9990, indicating a good linear correlation within the tested ranges. The LOD and LOQ values were in the range of 0.0138–9.3334 µg/mL and 0.0414–28.000 µg/mL, respectively. The relative standard deviation (RSD) values of intra- and inter-day precisions were less than 2.6% and 3.0%, respectively. Repeatability and stability were evidenced to be acceptable with RSD values below 2.9% and 2.8%. The mean recovery was in the range of 91.5–101.6%, with RSD values below 4.9%. In summary, all these results showed the stability, accuracy, and feasibility of the established UPLC-PDA method.

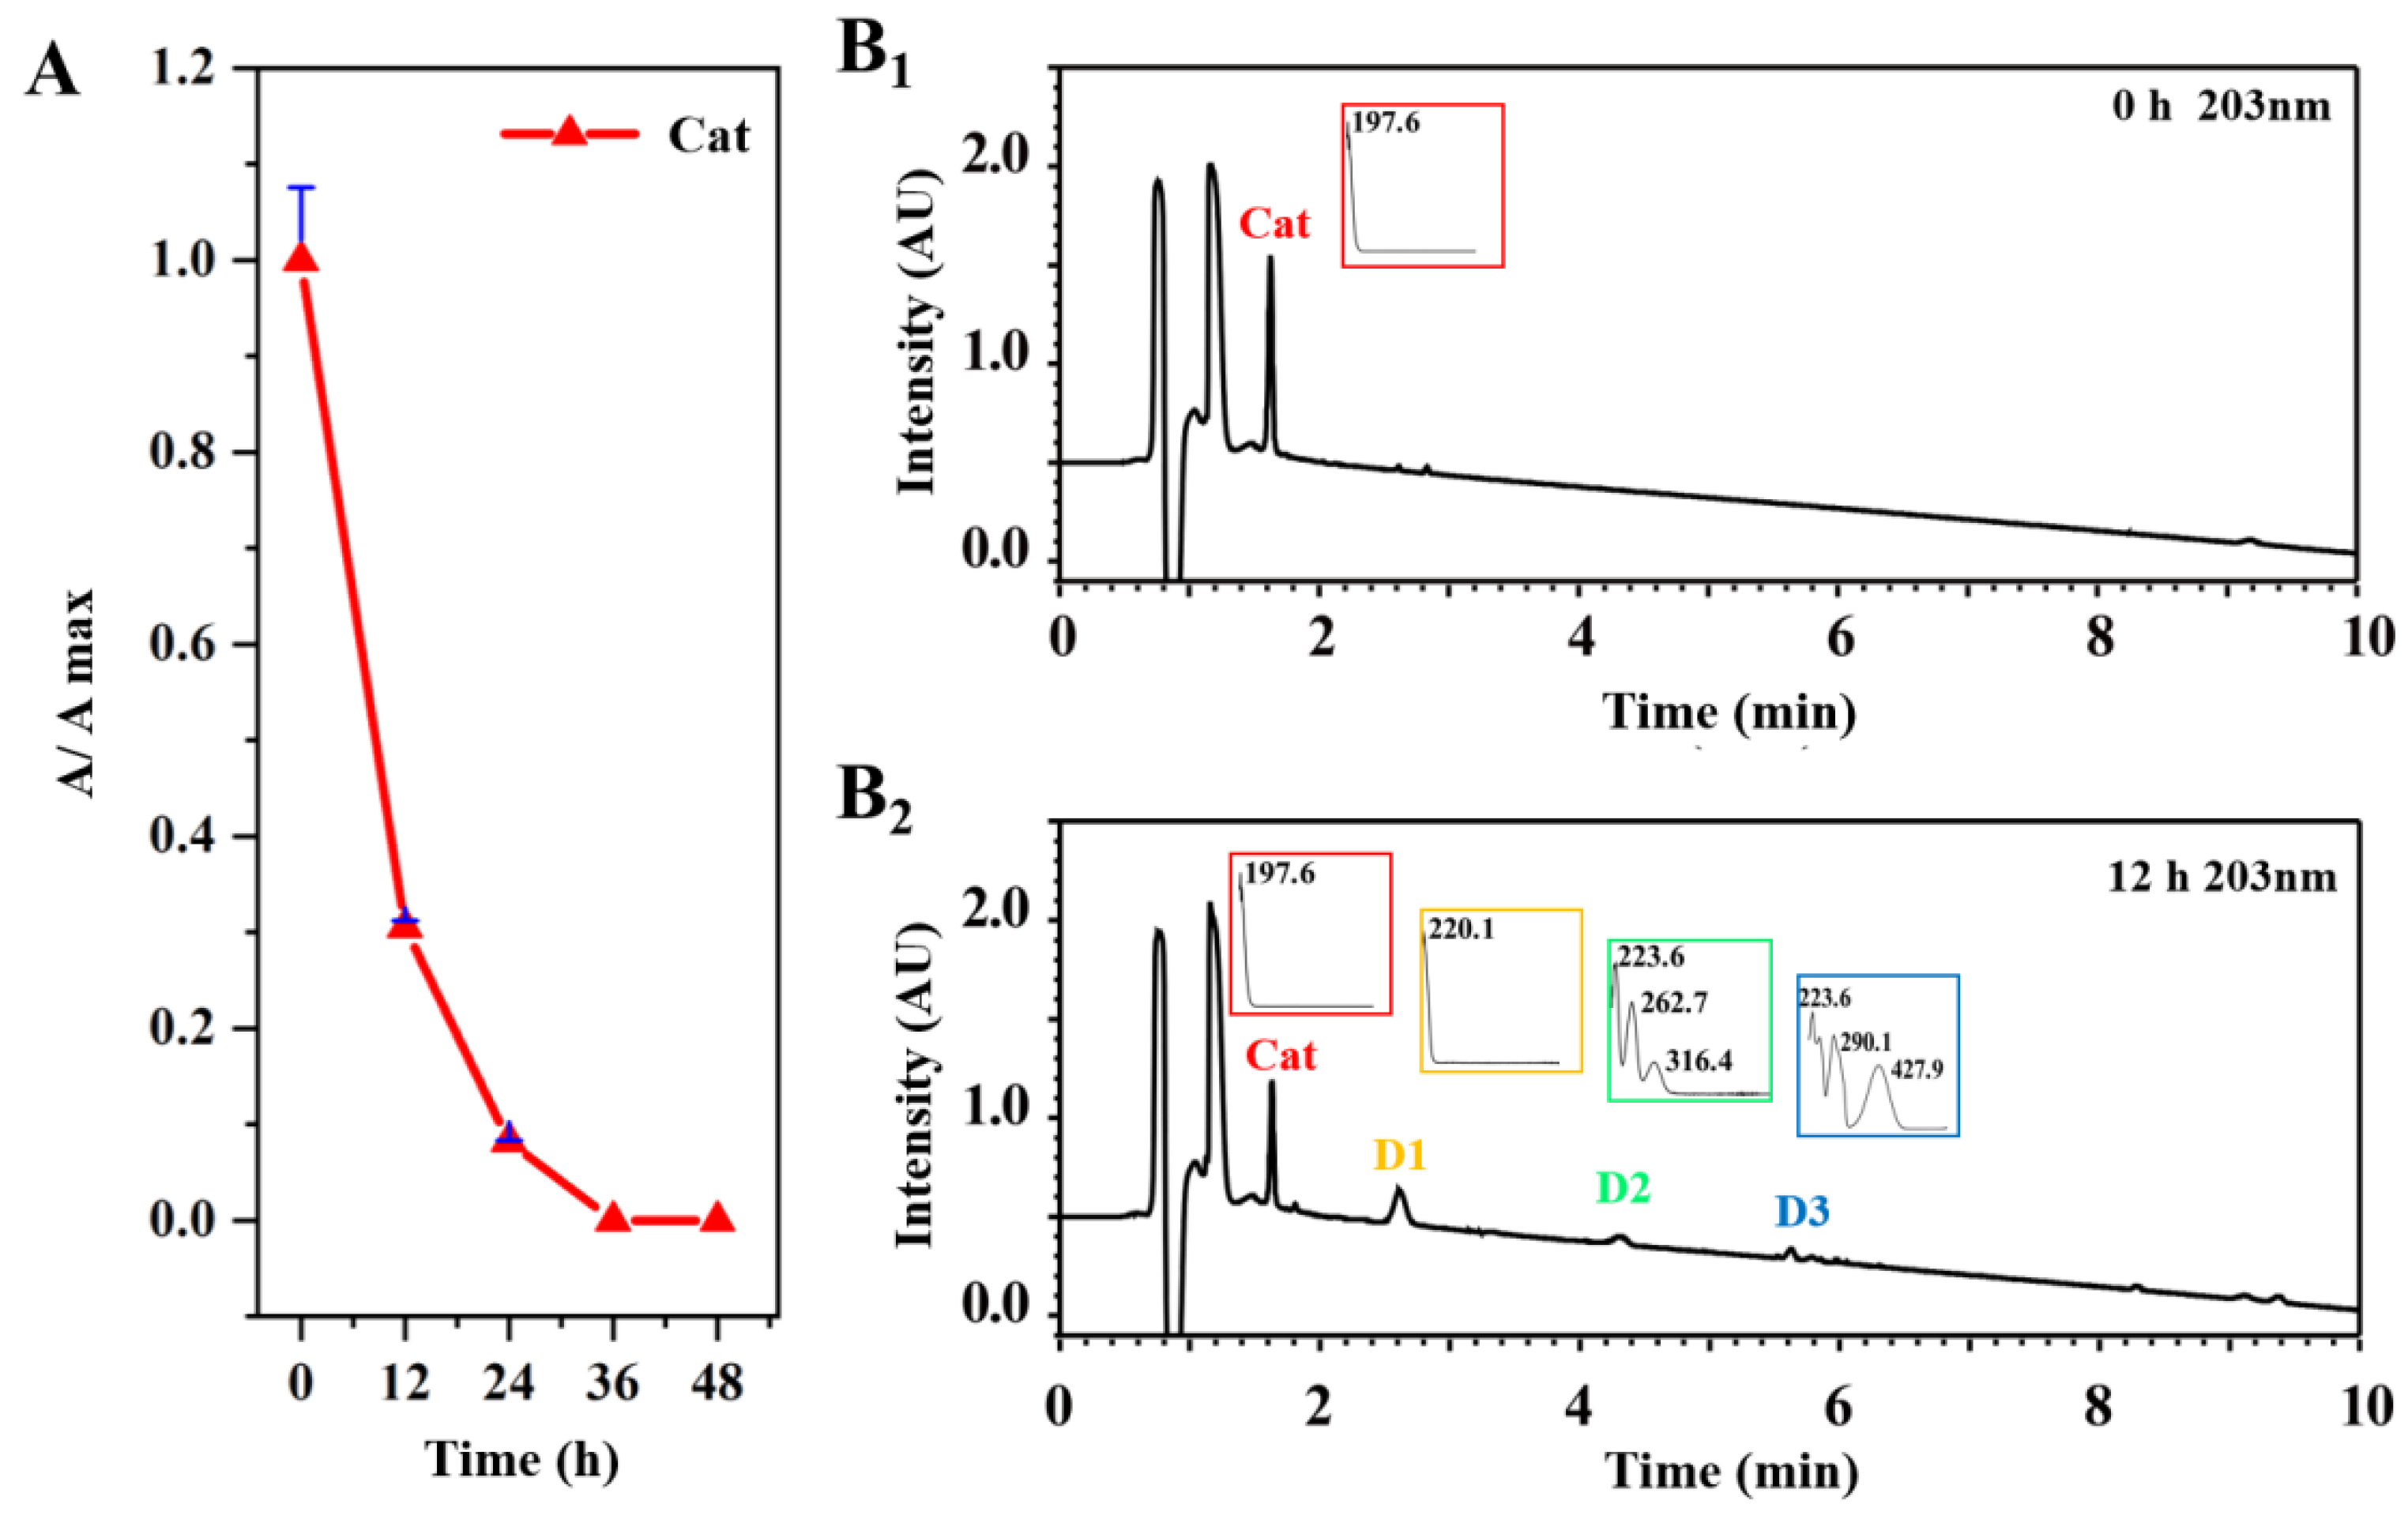
2.2. The Content Variations of Tested Compounds and the Degradation of Cat That Occurred in the Processing of RR

The variations in the characteristic components in the procedure of processing are related to the efficacy differences in different processed products of TCMs. In this study, the contents of ten crucial components in different processed products of RR deriving from iridoid glycosides, nucleosides, and phenylethanol glycosides were determined using the established UPLC-PDA method. As displayed in Figure 1C, iridoid glycosides including Cat, RhD, aucubin (Auc), Leo, and geniposide (Gen) showed an increased or decreased tendency to different extents from FRR to RRR, while all of them presented a sharp decrease from RRR to PRR. Nevertheless, no obvious changes were witnessed in the contents of nucleosides and phenylethanol glycosides. From Figure 1D, Cat, Leo, and Gen represented by the epoxy ether[c]pyran, cyclopentano[c]pyran, and cyclopentenyl[c]pyran ring systems, respectively, were degraded gradually from FRR to RRR, yet rapidly destroyed from RRR to PRR. Among them, the most significant declining tendency was observed for Cat with its content decreasing from 44.00 mg/g in FRR to 2.192 mg/g in PRR.
High temperature and long-term heating are indispensable for the processing of PRR, leading to the decomposition of the proteins into acidic peptides or free amino acids [22] and the formation of an acidic environment in the PRR. Therefore, Cat mainly exists as aglycone or its rearranged products instead of a prototype component in PRR [23]. The content variations of Cat at different heating time points are illustrated in Figure 2A. After 12 h, the content decreased remarkably to about 30% and even nearly disappeared after 36 h due to steaming. After heating for 12 h, the new peaks detected at three different retention times were recognized as unknown degradation products of Cat, which were referred to as D1D3 according to retention time, separately Figure 2(B1,B2). The discovery of degradation products is meaningful for clarification of the processing mechanism of RR.

2.3. Characterization of the Degradation Products of Cat

In the current study, the isolation and purification of Cat degradation products were carried out using various methods, such as column chromatography (CC) with D101 macroporous resin and preparative high-performance liquid chromatography (preparative HPLC), and nuclear magnetic resonance (NMR) spectroscopic analysis was used for structure elucidation. Key heteronuclear multiple bond correlation (HMBC) and 1H-1H correlated spectroscopy (1H-1H COSY) correlations of compounds D1D3 are shown in Figure 3. 1H NMR (600 MHz) and 13C NMR (150 MHz) spectroscopic data of compounds D1D3 are presented in Table 2.

2.3.1. Spectroscopic Analysis of D1

D1 was obtained as a white amorphous powder. The HR-ESI-MS (negative-ion mode) exhibited a quasi-molecular ion peak at m/z 181.0487 ([M − H], calcd. for 181.0579) that corresponded to molecular formula C9H10O4, marking the presence of five degrees of unsaturation.
The 1H NMR spectrum of D1 revealed an aldehyde proton signal at δH 9.82 (1H, t, J = 1.8 Hz, H-10) and a methylene group at δH 2.60 (1H, ddd, J = 1.8, 9.0, 17.4 Hz) and δH 2.85 (1H, ddd, J = 1.8, 5.4, 17.4 Hz). Three signals at δH 4.60 (1H, d, J = 4.8 Hz), δH 3.79 (1H, d, J = 4.8, 8.4 Hz), and δH 3.15 (1H, m) were assigned to the methine protons at C-4, C-5, and C-6, respectively. Signals at δH 7.52 (1H, s) and δH 7.17 (1H, s) were attributed to two olefinic protons. The 13C NMR spectrum demonstrated nine carbon signals, including one carbonyl at δC 202.9 and four olefinic carbons at δC 136.0, 134.3, 130.5, and 130.2. 1H-1H COSY analysis demonstrated the existence of ‘-CH(4)-CH(5)-CH(6)-CH2(9)-CH(10)-’. The two five-member rings were fused by the key HMBC correlations of H-4 (δH 4.60) with C-2 (δC 136.0) and C-7 (δC 130.2), H-6 (δH 3.15) with C-3 (δC 130.5) and C-8 (δC 134.3), H-2 (δH 7.52) with C-7 (δC 130.2), and H-8 (δH 7.17) with C-3 (δC 130.5). Furthermore, the position of attachment of the aldehyde moiety to C-9 was deduced by the HMBC correlation observed between H-10 (δH 9.82) and C-9 (δC 45.8) (see Supplementary Materials, Figures S1–S6).
The signal patterns of the NMR spectra were similar to those of jiofuran isolated from steamed root of Rehmannia glutinosa var. hueichingensis [24], except that D1 had an aldehyde moiety instead of the C-10 hydroxy methyl moiety in jofuran. Given that the chemical shifts and coupling constants of H-4 and H-5 were consistent with those reported in the literature, the stereo-configurations of H-4 and H-5 should be identical to those in the literature. The 1H NMR and 13C NMR spectral data were in line with published data [25], so D1 was identified as jiofuraldehyde.

2.3.2. Spectroscopic Analysis of D2

D2 was obtained as a brown powder. The molecular formula was deduced to be C9H8O3 from HR-ESI-MS (negative-ion mode) with a quasi-molecular ion peak at m/z [M–H] 163.0398 (calcd. for 163.0473), which suggested six degrees of unsaturation.
The 1H NMR spectrum of D2 revealed an aldehyde proton signal at δH 9.85 (1H, s, H-10), an oxymethine proton at δH 4.85 (1H, m, H-9), and a methylene group at δH 2.98 (1H, dd, J = 5.4, 13.8 Hz, H-8a) and δH 2.90 (1H, dd, J = 5.4, 13.8 Hz, H-8b). Signals at δH 7.27 (1H, s, H-3), 7.33 (1H, brs, H-5), and 7.33 (1H, s, H-6) were attributed to aromatic protons. The 13C NMR spectrum of D2 showed nine resonating signals, comprising one carbonyl at δC 194.0 and six aromatic carbons at δC 157.6, 137.9, 133.4, 133.2, 123.1, and 115.1. In the 1H-1H COSY spectrum, H-8 (δH 2.98 and 2.90) protons showed coupling with H-9 (δH 4.85). In the HMBC spectrum, correlations were found between H-3 (δH 7.27) and C-7 (δC 133.2), H-6 (δH 7.33) and C-2 (δC 157.5), H-6 (δH 7.33) and C-8 (δC 39.6), and H-8 (δH 2.98 and 2.90) and C-2 (δC 157.5), indicating that the five- and six-member rings were fused by C-2 and C-7. Moreover, H-10 (δH 9.85) was associated with C-4 (δC 137.9), showing that the aldehyde group was connected to C-4 (See Supplementary Materials, Figures S7–S12). Thus, the structure of D2 was deduced as 9-hydroxy-8,9-dihydrobenzofuran-4-carbaldehyde, designated as cataldehyde.

2.3.3. Spectroscopic Analysis of D3

D3 was isolated as a yellow powder. Its molecular formula is C9H6O2, from its HR-ESI-MS (positive-ion mode) with a quasi-molecular ion peak at m/z 147.0442 [M+H]+ (calcd. for 147.0368), indicating seven degrees of unsaturation.
The 1H NMR spectrum of D3 showed an aldehyde proton signal at δH 9.66 (1H, s, H-10) and five olefinic protons at δH 8.11 (1H, d, J = 4.8 Hz, H-2), δH 7.56 (1H, d, J = 4.8 Hz, H-3), δH 6.71 (1H, d, J = 3.6 Hz, H-5), δH 8.09 (1H, d, J = 3.6 Hz, H-6), and δH 9.27 (1H, s, H-9). The relatively large chemical shifts of H-2 and H-9 and the small coupling constant of H-2 and H-3 supported the presence of an oxygen atom linking H-2 with H-9. Nine carbon signals were observed in the 13C NMR spectrum, including one carbonyl at δC 187.3 and eight olefin carbons. In the 1H-1H COSY spectrum, correlations were found between H-2 (δH 8.11) and H-3 (δH 7.56), and H-5 (δH 6.71) and H-6 (δH 8.09). The key HMBC correlations of H-9 (δH 9.27) with C-4 (δC 139.0) and C-7 (δC 123.2), H-2 (δH 8.11) with C-4 (δC 139.0), H-5 (δH 6.71) with C-3 (δC 112.3) and C-8 (δC 124.0), and H-3 (δH 7.56) with C-8 (δC 124.0) were observed, suggesting the two rings fused by C-4 and C-8. In addition, H-10 (δH 9.66) exhibited an interaction with C-7 (δC 123.2), which indicated that the aldehyde group was attached to C-7 (See Supplementary Materials, Figures S13–S18). Thus, the structure of D3 was in line with published data, deduced as cyclopenta[c]pyran-7-carbaldehyde, named as norviburtinal [26,27].

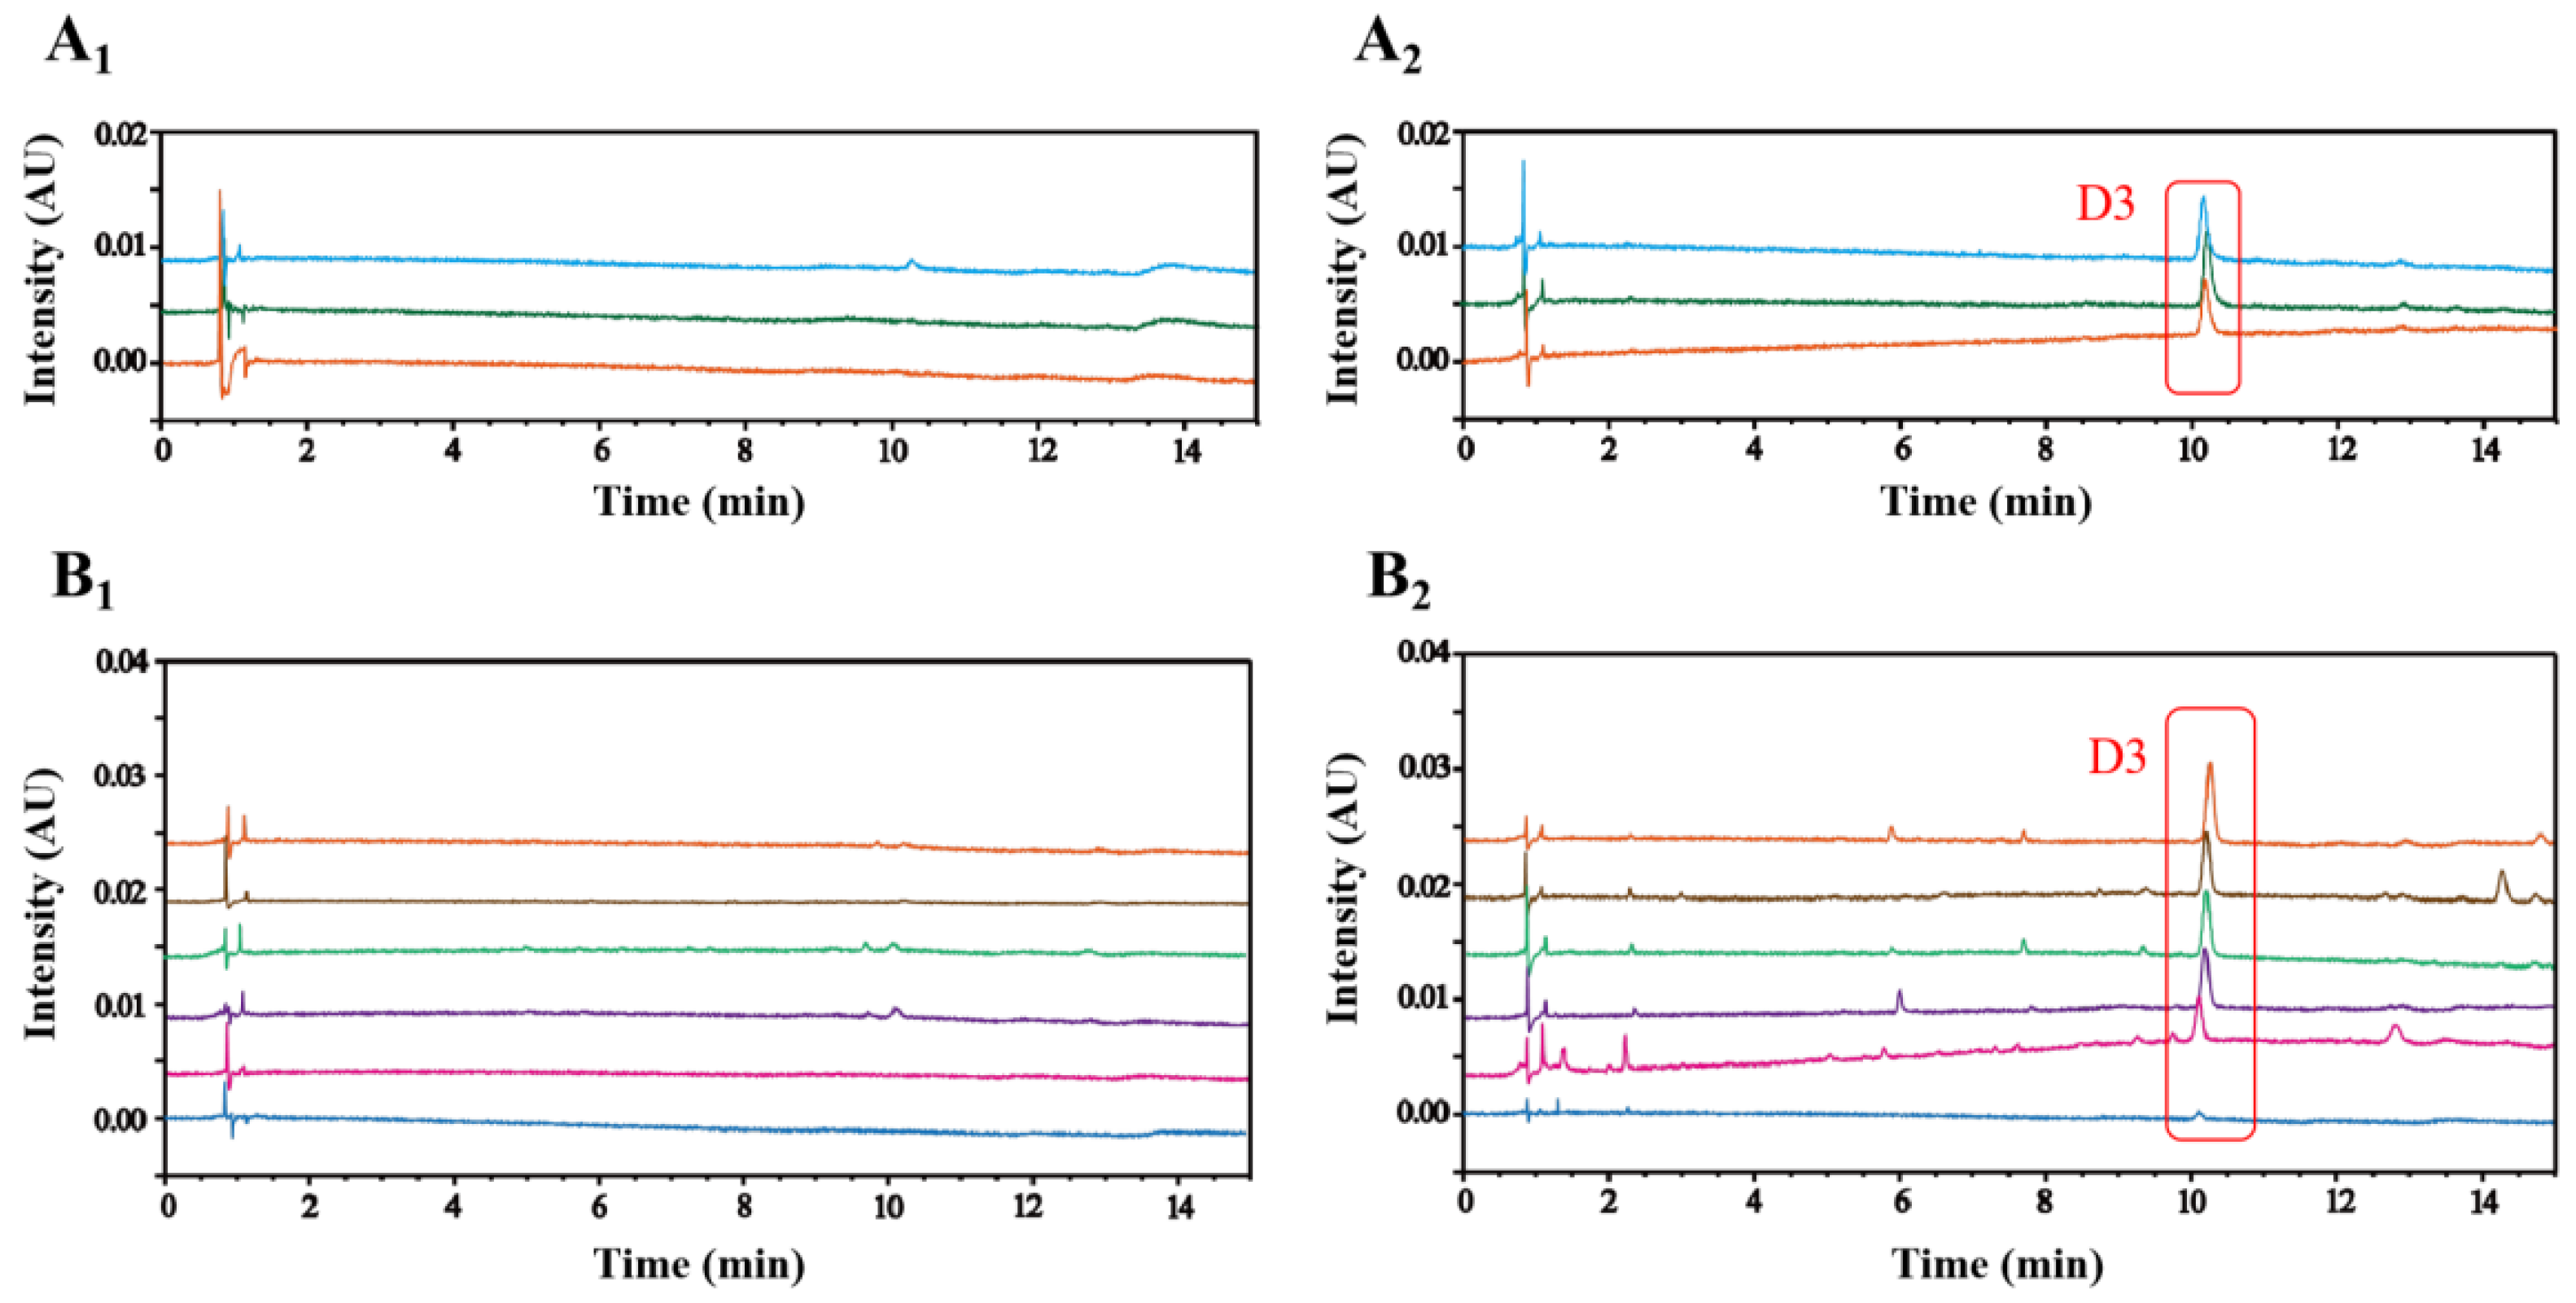
2.4. Specificity of D3 as a Degradation Product of Cat in PRR

In order to validate the specificity of Cat degradation products in PRR under real processing conditions, comparative experiments between PRR and RRR samples were conducted using liquid chromatography-tandem mass spectrometry (LC-MS) analysis. As a result, D3 was monitored by the mass spectrometry, while D1 and D2 were barely detected in PRR (see Supplementary Materials, Figure S19). Then, an MCI CC method was adopted for the enrichment of degradation products to further verify their unique presence in PRR. Only D3 was detected from fractions eluted with 60% ethanol in PRR, while none of them were monitored in RRR. As shown in Figure 4(A1,A2), D3 was presented exclusively in self-made PRR. This finding provides stronger evidence that steaming induces the production of D3, which is absent in the non-steaming-treated samples. To demonstrate the feasibility of D3 as a specific marker for determining whether RR products have been treated with steaming or not, we detected the enriched-D3 in six batches of commercially available RRR and PRR samples, respectively. From Figure 4(B1,B2), D3 was detected in commercially available PRR with a relatively high content, and it could barely be detected in commercially available RRR. Noteworthily, D3 was almost not detected in one batch of PRR samples, possibly arising from inadequate processing, which importantly reminds us that the standardized processing cycles and steaming time are necessary to ensure consistent quality in different batches of PRR.
Based on our results, samples containing D3 were PRR with steaming treatment and D3 was hardly detected in RRR without steaming, suggesting that D3 can be served as a potential characteristic marker for differentiating RRR from PRR. However, D1 and D2 were not discovered even in enriched PRR samples, which can probably be attributed to the fact that D3 was produced in great abundance and can be readily available. Moreover, all of them contain carbonyl groups, which can undergo nucleophilic reactions with amino acids to generate more stable nitrogen-containing compounds [28]. Furthermore, intermediate products are likely to undergo further condensation and polymerization reactions to form complex polymer pigments [29].

3. Materials and Methods

3.1. Reagents and Materials

LC-MS-grade acetonitrile was purchased from Fisher Chemical (Pittsburg, PA, USA). LC-grade methanol and acetonitrile were purchased from Sigma-Aldrich Inc. (St. Louis, MO, USA). LC-grade formic acid was obtained from Shanghai Aladdin Biochemical Technology Co., Ltd. (Shanghai, China). Dimethyl sulfoxide (DMSO) and acetonitrile were both analytical-grade products, provided by Tianjin Damao Chemical Reagent Factory (Tianjin, China). CC was carried out using D101 macroporous resin (Tianjin Chemical Co., Ltd., Tianjin, China) and MCI Gel (CHP20/P120, Mitsubishi Chemical Corporation, Tokyo, Japan). Reference standards including cytidine (Cyt, 18041902), adenosine (Ade, 18041902), guanosine (Gua, 19081902), acteoside (Act, 19082201), and isoacteoside (Iso, 19092702) were acquired from Chengdu Pufei De Biotech Co., Ltd. (Chengdu, China). Cat (1321678), Auc (B21238), RhD (B20293), and Gen (B21661) were obtained from Shanghai Yuanye Biotech Co., Ltd. (Shanghai, China). Leo (Y222002004018) was provided by Chengdu Ruifen Si Biotech Co., Ltd. (Chengdu, China). The purity of all standards was above 98% following liquid chromatography–ultraviolet (LC-UV) analysis. Yellow wine was purchased from Zhejiang Guyuelongshan Shaoxing Wine Co., Ltd. (Zhejiang, China).
Three batches of FRR samples were collected from Jiaozuo city, Henan province of China, in November 2020. Nine batches of RRR and six batches of PRR were purchased from Hebei Chunkai Pharmaceutical Co., Ltd. (Hebei, China) and were all authenticated by Prof. Tianxiang Li of Tianjin University of Traditional Chinese Medicine (Tianjin, China).

3.2. Preparation of RRR and PRR

To acquire RRR, three batches (2500 g/batch) of FRR with a uniform size (weight of 110 ± 15 g, diameter of 58 ± 10 mm) were selected, with their fibrous roots removed. The FRR samples were then cut and dried at 50 °C for 10 days (10 h per day), and they were collected on days 2, 4, 6, 8, and 10 marked as RRR-2, RRR-4, RRR-6, RRR-8, and RRR-10, respectively.
PRRs were obtained through the following procedure: RRR-10 samples were picked and mixed with yellow wine at a weight ratio of 10:4, followed by steaming for 12 h until softened. The softened samples were then blended with steaming liquid, steamed for another 6 h, and then dried for 6 h at 60 °C until the texture became viscous and dark-black colored. Samples were finally cut into homogeneous pieces (about 2~4 mm) and dried for use. Moreover, three batches of commercially available RRR samples were randomly selected and then processed to PRR, named PRR-1, PRR-2, and PRR-3, using the above method.

3.3. Preparation of Standard and Sample Solutions

3.3.1. Preparation of Standard and Sample Solutions for Quantitative Analysis

Ten reference standards were accurately weighed and dissolved in methanol to obtain stock solutions separately, which were then used to prepare a mixed standard solution with final concentrations of 4.016 µg/mL Cyt, 3402 µg/mL Cat, 5.030 µg/mL Ade, 1.761 µg/mL Gua, 48.42 µg/mL Auc, 242.4 µg/mL RhD, 240.2 µg/mL Leo, 2.515 µg/mL Gen, 12.75 µg/mL Act, and 3.006 µg/mL Iso. Subsequently, the mixed standard solution was serially diluted with 50% methanol aqueous solution to obtain seven different concentrations for establishing the calibration curves.
Accurately weighed sample powder (0.5 g) was ultrasonically extracted (144 W, 135 kHz) with 20 mL 35% methanol aqueous solution at 30 ℃ for 50 min. Then, 35% methanol aqueous solution was added to compensate for weight lost during extraction. After centrifugation at 13,322 g for 10 min, the supernatant was collected and filtered through a 0.22 µm membrane filter, which was then diluted with ultrapure water (v:v, 1:1) to obtain the sample solution.

3.3.2. Preparation of Cat Standard Solution for Identification of Degradation Products

The acetate buffer solution at pH 4.8 was prepared by mixing 8.0 mL acetic acid and 9.0 g sodium acetate anhydrous dissolved in 500 mL ultrapure water. A stock solution of Cat was prepared at 3.620 mg/mL in acetate buffer solution. Afterwards, 1 mL stock solution was mixed with 9 mL buffer solution in centrifuge tube and incubated for 48 h at 100 °C.

3.3.3. Preparation of Sample Solutions for the Validation of Cat Degradation Products

About 5.0 g RRR/PRR powder was ultrasonically extracted with 200 mL of 50% methanol aqueous solution for 50 min. The filtrate (115 mL) was accurately measured and evaporated under reduced pressure to obtain 10 mL concentrated solution for isolation.
The concentrated solution was chromatographed on an MCI column, which was eluted with EtOH-H2O (30:70, 50:50, 70:30, v/v) to afford fractions with Cat degradation products. Each fraction was then concentrated using a rotary vacuum evaporator (EYELA, Tokyo, Japan) and diluted to 3 mL with methanol for LC-MS and UPLC-PDA analysis.

3.4. UPLC-PDA Conditions

An ACQUITY UPLC I-class system (Waters Corporation, Milford, MA, USA) was used to perform the chromatographic analysis by using ACQUITY UPLC® HSS T3 column (2.1 × 100 mm, 1.8 µm) at 35 °C for the quantitative analysis. The mobile phase was composed of 0.1% formic acid aqueous solution (A) and acetonitrile (B) and then implemented in the gradient elution as follows: 0–1 min, 0–1% B; 1–3 min, 1–5% B; 3–4 min, 5–5% B; 4–6 min, 5–8% B; 6–13 min, 8–17% B; 13–20 min, 17–22% B.
A Waters ACQUITY UPLC® BEH C18 (2.1 × 100 mm, 1.7 µm) maintained at 55 °C was used for the identification of Cat degradation products. The mobile phase consisted of 0.1% formic acid solution (A) and acetonitrile (B) using the following gradient program: 0–20 min, 1–95% B; 20–21 min, 95–1% B. Both of them were delivered at flow rate of 0.3 mL/min, and the sample injection was 2 µL. The detection wavelength was set at 203 and 254 nm.

3.5. Methodological Validation

According to the guidelines released by ChP [2], the analytical method established in this study was employed to validate linearity, LOD, LOQ, precision (intra- and inter-day), stability, repeatability, and a recovery test. The calibration curves were drawn using the peak area (y-axis) and the corresponding concentrations of the compounds (x-axis). The LOQ and LOD of the tested compounds were determined by gradually reducing the concentration of the standard solution until the signal-to-noise ratio (S/N) was about 10 and 3, respectively. In order to test the intra- and inter-day precisions, the sample solution was injected six times on the same day and for three consecutive days, subsequently. Repeatability was confirmed by preparing and analyzing six sample solutions. The stability was studied by injecting sample solution at 0, 2, 4, 6, 8, 10, 12, and 24 h. The recovery test was carried out by adding standard solution to 0.25 g sample powder (n = 6), which was processed according to the method of sample preparation.

3.6. Purification and Enrichment of Degradation Products of Cat

3.6.1. Isolation of Degradation Samples

Accurately weighed 905.8 mg of Cat was dissolved in pH 4.8 buffer solution to obtain 5 mM stock solution, which was incubated at 100 °C for 12 h. After cooling, the solution was evaporated to gain concentrated Cat reaction solution, which was subsequently loaded onto a D101 macroporous resin column and eluted with various ratios of EtOH-H2O solutions (0:100, 30:70, 50:50, 70:30, v:v) to give four fractions (Frs. 1–4).

3.6.2. Purification by Preparative HPLC

Fr. 2 was purified on an Agilent 1260 Infinity preparative HPLC system, which was equipped with Waters SunFire® C18 OBDTM Prep Column (10 × 250 mm, 5 µm). Then, 0.1% formic acid aqueous solution–acetonitrile was used as the mobile phase with isocratic elution (91:9, v/v) at a flow rate of 4.0 mL/min, and the column temperature was maintained at room temperature. The injection volume was 100 µL and the detector was set at 203 and 254 nm to obtain D1. The purification of Fr. 3 was chromatographed in an isocratic elution of 0.1% formic acid aqueous solution–methanol (65:35, v/v) to give D2. Fr. 4 was also chromatographed in an isocratic elution of 0.1% formic acid aqueous solution–methanol (55:45, v/v) to yield D3. The final products were subjected to NMR analysis for structural elucidation.

3.7. NMR Spectroscopic Analysis

For NMR analysis, we used deuterated dimethylsulfoxide (DMSO-d6) and methanol-d4 as the solvents, and tetramethylsilane (TMS) as the internal standard. Then, 1D (1H NMR and 13C NMR) and 2D (1H-1H COSY, HSQC, and HMBC) NMR experiments were performed on a Bruker AVIII 600 spectrometer (Bruker, Zug, Switzerland). The chemical shifts (δ) are in ppm and the coupling constants (J) are in Hz.

3.8. LC-MS Analysis

The chromatographic separation was performed on Vanquish UHPLC System (Thermo Fisher Scientific, San Jose, CA, USA) with an ACQUITY UPLC® HSS T3 column (2.1 × 100 mm, 1.8 µm) maintained at 55 °C. Mobile phases consisted of 0.1% formic acid aqueous solution (A) and acetonitrile (B), with the following gradient elution procedure: 0–15 min, 5–27% B; 15–16 min, 27–95% B. The flow rate of elution solvent was 0.3 mL/min and the injection volume of samples was 2 µL. UV detection wavelength was set at 203 and 254 nm.
The mass spectrometry analysis was performed on an Orbitrap Exploris 120 Mass Spectrometer (Thermo Fisher Scientific). The ESI source parameters were set as follows: spray voltage, −3.0 kV/+3.5 kV; ion transfer tube temperature, 320 °C; vaporizer temperature, 350 °C; normalized collision energy, 20/40/60 V; sheath gas (N2), 35 arb; aux gas (N2), 10 arb; sweep gas (N2), 0 arb. Moreover, the scanning method of full MS was adopted. The full scan range of MS1 was 50–1500 m/z acquired with resolution R = 120,000.

3.9. Data Analysis

The data were presented as mean ± SD and analyzed using one-way ANOVA by SPSS 19.0 (IBM, Armonk, NY, USA). The difference was considered to be statistically significant if p < 0.05. Graphs were created using Origin 9.1 (Originlab Corp., Northampton, MA, USA). The RSD value reflects the precision of the analytical results in the assay.

4. Conclusions

In this study, the UPLC-PDA method for the quantitative analysis of iridoid glycosides, nucleosides, and phenylethanoid glycosides was successfully established and applied in clarifying the dynamic variations of compounds during the process from FRR to PRR. A sharp decrease in iridoid glycosides was noticed in content from RRR to PRR, which was successfully simulated under processing conditions by employing Cat as an example. From Cat, jiofuraldehyde, cataldehyde, and norviburtinal were obtained and elucidated as the degradation products and cataldehyde was reported as a new compound. By unveiling the specificity of norviburtinal in PRR, the RRR samples can be easily distinguished from the PRR. Overall, our study further revealed the processing mechanism of RR, providing insights into the transformation of effective constituents. However, it still leaves a large space for us to explore the relationship between Cat degradation products and the changes in the pharmacological effects of different RR products.

Supplementary Materials

The following supporting information can be downloaded at https://www.mdpi.com/article/10.3390/molecules29030705/s1, Table S1: Optimization of the extracting method for the sample preparation of RR; Figure S1: 1H NMR spectrum of D1 in DMSO-d6 (600 MHz); Figure S2: 13C NMR spectrum of D1 in DMSO-d6 (150 MHz); Figure S3: 1H-1H COSY spectrum of D1 in DMSO-d6; Figure S4: HSQC spectrum of D1 in DMSO-d6; Figure S5: HMBC spectrum of D1 in DMSO-d6; Figure S6: HR-ESI-MS spectrum of D1; Figure S7: 1H NMR spectrum of D2 in CD3OD (600 MHz); Figure S8: 13C NMR spectrum of D2 in CD3OD (150 MHz); Figure S9: 1H-1H COSY spectrum of D2 in CD3OD; Figure S10: HSQC spectrum of D2 in CD3OD; Figure S11: HMBC spectrum of D2 in CD3OD; Figure S12: HR-ESI-MS spectrum of D2; Figure S13: 1H NMR spectrum of D3 in CD3OD (600 MHz); Figure S14: 13C NMR spectrum of D3 in CD3OD (150 MHz); Figure S15: 1H-1H COSY spectrum of D3 in CD3OD; Figure S16: HSQC spectrum of D3 in CD3OD; Figure S17: HMBC spectrum of D3 in CD3OD; Figure S18: HR-ESI-MS spectrum of D3; Figure S19. Representative total ion current (TIC) chromatogram of PRR sample in the positive ion mode (A) and MS spectrum of D3 in PRR sample (B).

Author Contributions

Y.W. and X.C. designed and directed the study; J.Y. (Jingjing Yang) and L.Z. (Lihua Zhang) performed the research; L.Z. (Lihua Zhang), M.Z., M.Y., and L.Z. (Lin Zou) analyzed the data; Y.C. and J.Y. (Jing Yang) provided help and suggestions for this study; J.Y. (Jingjing Yang) and X.C. drafted the manuscript. Y.W. and X.C. revised the manuscript for important intellectual content. All authors have read and agreed to the published version of the manuscript.

Funding

This research was funded by the Science and Technology Project of Haihe Laboratory of Modern Chinese Medicine (grant number 22HHZYSS00007 and 22HHZYJC00007), the Science and Technology Program of Tianjin (grant number 22ZYJDSS00100), and Shandong Provincial Natural Science Foundation (grant number ZR2021LZY035).

Institutional Review Board Statement

Not applicable.

Informed Consent Statement

Not applicable.

Data Availability Statement

Data are contained within the article and Supplementary Materials.

Conflicts of Interest

The authors declare no conflicts of interest.

Abbreviations

RRRadix Rehmanniae
R. glutinosaRehmannia glutinosa Libosch.
TCMtraditional Chinese medicine
FRRfresh Radix Rehmanniae
RRRraw Radix Rehmanniae
PRRprocessed Radix Rehmanniae
Catcatalpol
Leoleonuride
RhDrehmannioside D
ChPChinese pharmacopoeia
UPLC-PDAultra-performance liquid chromatography with photo-diode array detector
LODthe limit of detection
LOQthe limit of quantitation
RSDrelative standard deviation
Aucaucubin
Gengeniposide
CCcolumn chromatography
preparative HPLCpreparative high-performance liquid chromatography
NMRnuclear magnetic resonance
HMBCheteronuclear multiple bond correlation
1H-1H COSY1H-1H correlated spectroscopy
LC-MSliquid chromatography–tandem mass spectrometry
DMSOdimethyl sulfoxide
Cytcytidine
Adeadenosine
Guaguanosine
Actacteoside
Isoisoacteoside
LC-UVliquid chromatography–ultraviolet
S/Nsignal-to-noise ratio
TMStetramethylsilane

References

  1. Zhang, R.X.; Li, M.X.; Jia, Z.P. Rehmannia glutinosa: Review of botany, chemistry and pharmacology. J. Ethnopharmacol. 2008, 117, 199–214. [Google Scholar] [CrossRef]
  2. Chinese Pharmacopoeia Commission. ChP 2020; China Medical Science Press: Beijing, China, 2020; Volume I and IV. [Google Scholar]
  3. Li, M.M.; Jiang, H.J.; Hao, Y.L.; Du, K.Q.; Du, H.L.; Ma, C.; Tu, H.; He, Y. A systematic review on botany, processing, application, phytochemistry and pharmacological action of Radix rehmnniae. J. Ethnopharmacol. 2022, 285, 114820. [Google Scholar] [CrossRef]
  4. Zhang, X.Y.; Xu, J.D.; Wang, Y.; Wu, C.Y.; Zhou, J.; Shen, H.; Zou, Y.T.; Zhu, J.H.; Zhou, S.S.; Li, S.L.; et al. Comparing steamed and wine-stewed Rehmanniae Radix in terms of Yin-nourishing effects via metabolomics and microbiome analysis. J. Ethnopharmacol. 2023, 311, 116424. [Google Scholar] [CrossRef]
  5. Xia, F.B.; Liu, C.H.; Wan, J.B. Characterization of the cold and hot natures of raw and processed Rehmanniae Radix by integrated metabolomics and network pharmacology. Phytomedicine 2020, 74, 153071. [Google Scholar] [CrossRef]
  6. Cui, W.; Zheng, X.M.; Li, H.X.; Feng, Y.F.; Xu, Z. Chemical constituents of Fresh Rehmannia glutinosa. Zhongcaoyao 2022, 45, 2369–2375. [Google Scholar] [CrossRef]
  7. Liu, Y.F.; Liang, D.; Luo, H.; Hao, Z.Y.; Yu, D.Q. Chemical constituents from root tubers of Rehmannia glutinosa. Zhongcaoyao 2014, 45, 16–22. [Google Scholar]
  8. Yue, C.; Gao, J.; Shi, S.M.; Zhang, W.T. Simultaneous determination of three components in crude and processed Rehmanniae Radix by HPLC. Zhongguo Shiyan Fangjixue Zazhi 2015, 21, 71–74. [Google Scholar] [CrossRef]
  9. Youn, U.J.; Gu, B.S.; Kim, K.H.; Ha, C.; Jung, I.C. Variation of main components according to the number of steaming and drying of Rehmanniae radix preparata. J. Pharmacopunct. 2018, 21, 112–119. [Google Scholar] [CrossRef]
  10. Liu, J.Y.; Zhang, D.J. Amelioration by catalpol of atherosclerotic lesions in hypercholesterolemic rabbits. Planta Med. 2015, 81, 175–184. [Google Scholar] [CrossRef] [PubMed]
  11. Liu, C.Y.; Ma, R.F.; Wang, L.L.; Zhu, R.Y.; Liu, H.X.; Guo, Y.B.; Zhao, B.S.; Zhao, S.G.; Tang, J.F.; Li, Y.Y.; et al. Rehmanniae radix in osteoporosis: A review of traditional Chinese medicinal uses, phytochemistry, pharmacokinetics and pharmacology. J. Ethnopharmacol. 2017, 198, 351–362. [Google Scholar] [CrossRef] [PubMed]
  12. He, L.; Zhao, R.S.; Wang, Y.H.; Liu, H.B.; Wang, X.H. Research progress on catalpol as treatment for atherosclerosis. Front. Pharmacol. 2021, 12, 716125. [Google Scholar] [CrossRef]
  13. Han, Y.; Shen, M.; Tang, L.Y.; Tan, G.; Yang, Q.C.; Ye, L.; Ye, L.H.; Jiang, N.; Gao, G.P.; Shao, Y. Antiangiogenic effects of catalpol on rat corneal neovascularization. Mol. Med. Rep. 2018, 17, 2187–2194. [Google Scholar] [CrossRef] [PubMed]
  14. Lin, C.M.; Wang, B.W.; Fang, W.J.; Pan, C.M.; Shyu, K.G.; Hou, S.W. Catalpol ameliorates neointimal hyperplasia in diabetic rats. Planta Med. 2019, 85, 406–411. [Google Scholar] [CrossRef]
  15. Yuan, H.X.; Ni, X.Q.; Zheng, M.; Han, X.M.; Song, Y.C.; Yu, M.F. Effect of catalpol on behavior and neurodevelopment in an ADHD rat model. Biomed. Pharmacother. 2019, 118, 109033. [Google Scholar] [CrossRef]
  16. Liu, Z.G.; Zhu, P.T.; Zhang, L.; Xiong, B.; Tao, J.H.; Guan, W.; Li, C.L.; Chen, C.; Gu, J.Y.; Duanmu, J.X.; et al. Autophagy inhibition attenuates the induction of anti-inflammatory effect of catalpol in liver fibrosis. Biomed. Pharmacother. 2018, 103, 1262–1271. [Google Scholar] [CrossRef]
  17. Qiu, J.G.; Zhang, R.X.; Jia, Z.P.; Li, M.X.; Zhang, Q.L.; Zhou, J.; Wei, L.L. Change of oligosaccharide and catalpol contents in Rehmanniae Radix at various processing phases. Zhongcaoyao 2011, 42, 2434–2437. [Google Scholar] [CrossRef]
  18. Wei, G.D.; Wen, X.S. Characteristics and kinetics of catalpol degradation and the effect of its degradation products on free radical scavenging. Pharmacogn. Mag. 2014, 10, S122–S129. [Google Scholar] [CrossRef]
  19. Du, Y.P.; Wang, M.; Li, L.Y.; Zhou, K.; Bai, Y.J.; Li, Y.; Wang, S.W.; Wang, M.; Zhao, Y.; Zheng, X.H. Research progress on effect of processing on properties and efficacy of traditional Chinese medicine containing iridoid terpenoids based on stability of compounds. Zhongcaoyao 2021, 52, 5039–5051. [Google Scholar] [CrossRef]
  20. Jiang, Y.; Zhang, C. Discussion on the processing technology and quality standards of Rehmanniae Radix Praeparata. Pharm. Clin. Chin. Mater. Medica 2017, 8, 21–25. [Google Scholar]
  21. Ji, Y.H.; Wang, W.L.; Yang, Z.; Gan, L.F.; Xu, J.; Deng, T.; Zhang, Z.P. Study on the difference comparison of Rehmanniae Radix and Rehmanniae Radix Praeparata based on characteristic spectrum and color image technology. Zhongyaocai 2023, 46, 1912–1918. [Google Scholar] [CrossRef]
  22. Gao, G.Z.; Zhou, J.W.; Wang, H.Q.; Rao, P.F.; Ke, L.J. Analysis of Amino Acids in Rehmannia glutinosa Libosch. during Heating Process. Anjisuan He Shengwu Ziyuan 2010, 32, 52–54. [Google Scholar] [CrossRef]
  23. Xue, S.J.; Fu, Y.; Sun, X.Y.; Chen, S.Q. Changes in the Chemical Components of Processed Rehmanniae Radix Distillate during Different Steaming Times. Evid. Based Complement. Alternat. Med. 2022, 2022, 3382333. [Google Scholar] [CrossRef]
  24. Takashi, M.; Hiroaki, N.; Hiroshi, S.; Masao, C.; Ko, S.; Takao, K.; Hiroshi, M. Five cyclopentanoid monoterpenes from Rehmannia glutinosa. Phytochemistry 1989, 28, 2385–2391. [Google Scholar] [CrossRef]
  25. Machida, K.; Ikeda, C.; Kakuda, R.; Yaoita, Y.; Kikuchi, Y. Studies on the constituents of Catalpa species. v. iridoids from catalpae fructus. Nat. Med. 2001, 55, 61–63. [Google Scholar] [CrossRef]
  26. Joshi, K.C.; Singh, P.; Taneja, S.; Cox, P.J.; Howie, R.A.; Thomson, R.H. New terpenoid aldehydes from Kigelia pinnata: Crystal structure of pinnatal. Tetrahedron 1982, 38, 2703–2708. [Google Scholar] [CrossRef]
  27. Liu, C.L.; Cheng, L.; Kwok, H.F.; Ko, C.H.; Lau, T.W.; Koon, C.M.; Zhao, M.; Lau, C.P.; Lau, K.M.; Wong, C.W.; et al. Bioassay-guided isolation of norviburtinal from the root of Rehmannia glutinosa, exhibited angiogenesis effect in zebrafish embryo model. J. Ethnopharmacol. 2011, 137, 1323–1327. [Google Scholar] [CrossRef]
  28. Meng, X.L.; Wang, B.; Zhang, X.Y.; Lyu, C.Z.; Su, X.J.; Ning, C.X.; Zhang, S.S. The dynamic changes and mechanisms of Rehmanniae radix processing based on Maillard reaction. Tradit. Med. Res. 2021, 6, 63–73. [Google Scholar] [CrossRef]
  29. Zhang, X.Y.; Dong, X.Y.; Zhang, R.H.; Hao, D.Z.; Zhang, J.X.; Shen, Y.H.; Chai, X.; Wang, H.X.; Wang, Y.F.; Wang, Y.F. Unraveling the mechanism of the supramolecular self-assembly during the in vivo metabolism of geniposide from Chinese medicine. Mater. Des. 2023, 225, 111546. [Google Scholar] [CrossRef]
Figure 1. Dynamic changes in appearance and contents of the detected compounds during the process from FRR to PRR. (A) Variations in the appearance in the process from FRR to PRR. UPLC-PDA chromatograms of the mixed standard solution (B1) and sample solution (B2) under the detection wavelength of 203 nm (for Cat, Auc, RhD, and Leo), and the mixed standard solution (B3) and sample solution (B4) under the detection wavelength of 254 nm (for Cyt, Ade, Gua, Gen, Act, and Iso). (C) Dynamic variations in the detected compounds’ contents from FRR to PRR. (D) The histograms of the contents of Cat, Leo, and Gen in FRR, RRR, and PRR. Different letters indicated that data were significantly different at p < 0.05 when ANOVA analysis was applied. Abbreviation notes: FRR: fresh Radix Rehmanniae; RRR: raw Radix Rehmanniae; PRR: processed Radix Rehmanniae; Cyt: cytidine; Cat: catalpol; Ade: adenosine; Gua: guanosine; Auc: aucubin; RhD: rehmannioside D; Leo: leonuride; Gen: geniposide; Act: acteoside; Iso: isoacteoside.
Molecules 29 00705 g001
Figure 2. The discovery of the degradation products of Cat under simulated preparation conditions. (A) The dynamic variations in Cat content at different heating time points. Typical UPLC-PDA chromatograms of the degradation products of Cat for 0 h (B1) and 12 h (B2) under simulated processing conditions. Abbreviation notes: Cat: catalpol; D1: compound D1; D2: compound D2; D3: compound D3.
Molecules 29 00705 g002
Figure 3. Key HMBC and 1H-1H COSY correlations of degradation products D1D3.
Molecules 29 00705 g003
Figure 4. Validation of the specificity of D3 in PRR. Validation of D3 in three batches of RRR samples (A1) and their corresponding self-made PRR samples (A2). Validation of D3 in commercially available RRR samples (B1) and PRR samples (B2).
Molecules 29 00705 g004
Table 1. Methodological validation for simultaneous quantification of ten compounds in different RR products.
CompoundsLinear RegressionLODsLOQsPrecision (RSD,%)RepeatabilityStabilityRecovery
Regression Equationr2Linear Range (μg/mL)(μg/mL)(μg/mL)Intra-Day
(n = 6)
Inter-Day
(n = 3)
(n = 6, RSD, %)(n = 7, RSD, %)(n = 6, Mean ± SD, %)
Cyty = 4204.9x − 297.170.99970.0992–2.0080.03310.09922.01.90.62.3101.58 ± 1.7
Caty = 1326.1x + 7233.50.999684.00–17019.333428.0001.31.00.90.898.30 ± 3.0
Adey = 22932x + 324.901.00000.1242–2.5150.01380.04142.62.92.02.898.31 ± 3.6
Guay = 18807x + 203.550.99960.04347–0.88030.01450.04352.02.71.52.196.66 ± 1.0
Aucy = 16688x − 2154.90.99961.196–24.210.39851.19562.32.82.42.599.36 ± 3.3
RhDy = 5738.1x + 195520.99935.985–121.21.99515.98521.12.32.82.799.90 ± 3.2
Leoy = 8574.4x + 294660.99905.931–120.10.65901.97700.82.21.51.692.87 ± 4.5
Geny = 13584x − 8.97940.99990.06210–1.2580.02070.06212.62.41.82.091.49 ± 2.8
Acty = 13794x + 307.191.00000.3148–6.3750.03500.10492.13.02.91.893.41 ± 4.9
Isoy = 13299x + 431.850.99960.07422–1.5030.02470.074296.92 ± 1.2
Abbreviation notes: Cyt: cytidine; Cat: catalpol; Ade: adenosine; Gua: guanosine; Auc: aucubin; RhD: rehmannioside D; Leo: leonuride; Gen: geniposide; Act: acteoside; Iso: isoacteoside.
Table 2. 1H NMR (600 MHz) and 13C NMR (150 MHz) spectroscopic data of compounds D1D3.
PositionD1 (in DMSO-d6)D2 (in CD3OD)D3 (in CD3OD)
δHδCδHδCδHδC
27.52 (1H, s)136.0157.58.11 (1H, d, 4.8)146.5
3130.57.27 (1H, s)115.07.56 (1H, d, 4.8)112.3
44.60 (1H, d, 4.8)65.9137.9139.0
53.79 (1H, dd, 4.8, 8.4)83.27.33 (1H, brs)123.16.71 (1H, d, 3.6)112.7
63.15 (1H, m)36.37.33 (1H, s)133.48.09 (1H, d, 3.6)146.5
7130.2133.2123.2
87.17 (1H, s)134.32.98 (1H, dd, 5.4, 13.8)
2.90 (1H, dd, 5.4, 13.8)
39.6124.0
92.60 (1H, ddd, 1.8, 9.0, 17.4)
2.85 (1H, ddd, 1.8, 5.4, 17.4)
45.84.85 (1H, m, overlapped)98.79.27 (1H, s)152.6
109.82 (1H, t, 1.8)202.99.85 (1H, s)194.09.66 (1H, s)187.3
Disclaimer/Publisher’s Note: The statements, opinions and data contained in all publications are solely those of the individual author(s) and contributor(s) and not of MDPI and/or the editor(s). MDPI and/or the editor(s) disclaim responsibility for any injury to people or property resulting from any ideas, methods, instructions or products referred to in the content.

