
Volatile Organic Compounds (VOCs) Produced by Levilactobacillus brevis WLP672 Fermentation in Defined Media Supplemented with Different Amino Acids


Abstract
:1. Introduction
2. Results and Discussion
2.1. Development of Defined Medium
2.2. Physiochemical Properties
2.3. Volatile Organic Compounds (VOCs) after Fermentation
2.4. Phe-Derived VOCs
2.5. Met-Derived VOCs
2.6. Leu/Ile-Derived VOCs
3. Materials and Methods
3.1. LAB Strain
3.2. Medium Compositions
3.3. Fermentation
3.4. Determination of Volatile Organic Compounds
3.5. Data Analysis
3.5.1. GC-MS Data Extraction
3.5.2. Statistical Analysis
4. Conclusions
Supplementary Materials
Author Contributions
Funding
Institutional Review Board Statement
Informed Consent Statement
Data Availability Statement
Acknowledgments
Conflicts of Interest
References
- Lea, E.J.; Crawford, D.; Worsley, A. Consumers’ readiness to eat a plant-based diet. Eur. J. Clin. Nutr. 2006, 60, 342–351. [Google Scholar] [CrossRef] [PubMed]
- Szejda, K.; Urbanovich, T.; Wilks, M. Accelerating Consumer Adoption of Plant-Based Meat: An Evidence-Based Guide for Effective Practice; The Good Food Institute: Washington, DC, USA, 2020. [Google Scholar]
- Austgulen, M.; Skuland, S.; Schjøll, A.; Alfnes, F. Consumer readiness to reduce meat consumption for the purpose of environmental sustainability: Insights from Norway. Sustainability 2018, 10, 3058. [Google Scholar] [CrossRef]
- Clem, J.; Barthel, B. A look at plant-based diets. Mo. Med. 2021, 118, 233–238. [Google Scholar] [PubMed]
- Alcorta, A.; Porta, A.; Tarrega, A.; Alvarez, M.D.; Vaquero, M.P. Foods for plant-based diets: Challenges and innovations. Foods 2021, 10, 293. [Google Scholar] [CrossRef] [PubMed]
- Lima, M.; Costa, R.; Rodrigues, I.; Lameiras, J.; Botelho, G. A narrative review of alternative protein sources: Highlights on meat, fish, egg and dairy analogues. Foods 2022, 11, 2053. [Google Scholar] [CrossRef] [PubMed]
- Bryant, C.J. Plant-based animal product alternatives are healthier and more environmentally sustainable than animal products. Future Foods 2022, 6, 100174–100186. [Google Scholar] [CrossRef]
- Ishaq, A.; Irfan, S.; Sameen, A.; Khalid, N. Plant-based meat analogs: A review with reference to formulation and gastrointestinal fate. Curr. Res. Food Sci. 2022, 5, 973–983. [Google Scholar] [CrossRef]
- Michel, F.; Hartmann, C.; Siegrist, M. Consumers’ associations, perceptions and acceptance of meat and plant-based meat alternatives. Food Qual. Prefer. 2021, 87, 104063–104073. [Google Scholar] [CrossRef]
- Aschemann-Witzel, J.; Gantriis, R.F.; Fraga, P.; Perez-Cueto, F.J.A. Plant-based food and protein trend from a business perspective: Markets, consumers, and the challenges and opportunities in the future. Crit. Rev. Food Sci. Nutr. 2021, 61, 3119–3128. [Google Scholar] [CrossRef]
- Pointke, M.; Pawelzik, E. Plant-based alternative products: Are they healthy alternatives? Micro- and macronutrients and nutritional scoring. Nutrients 2022, 14, 601. [Google Scholar] [CrossRef]
- Szenderak, J.; Frona, D.; Rakos, M. Consumer acceptance of plant-based meat substitutes: A narrative review. Foods 2022, 11, 1274. [Google Scholar] [CrossRef]
- Reineccius, G. Flavor Chemistry and Technology, 2nd ed.; Taylor & Francis Group: Boca Raton, FL, USA, 2006. [Google Scholar]
- Lawless, H. The sense of smell in food quality and sensory evaluation. J. Food Qual. 1991, 14, 33–60. [Google Scholar] [CrossRef]
- Astray, G.; García-Río, L.; Mejuto, J.C.; Pastrana, L. Chemistry in food: Flavours. Electron. J. Environ. Agric. Food Chem. 2007, 6, 1742–1763. [Google Scholar]
- Paravisini, L.; Guichard, E. Interactions between aroma compounds and food matrix. In Flavour: From Food to Perception; Wiley: New York, NY, USA, 2016; pp. 208–234. [Google Scholar]
- Small, D.M.; Gerber, J.C.; Mak, Y.E.; Hummel, T. Differential neural responses evoked by orthonasal versus retronasal odorant perception in humans. Neuron 2005, 47, 593–605. [Google Scholar] [CrossRef]
- Dastager, S.G. Aroma Compounds; Springer: Berlin/Heidelberg, Germany, 2009. [Google Scholar]
- Janssens, L.; De Pooter, H.L.; Schamp, N.M.; Vandamme, E.J. Production of flavours by microorganisms. Process Biochem. 1992, 27, 195–215. [Google Scholar] [CrossRef]
- Longo, M.A.; Sanromán, M.A. Production of food aroma compounds: Microbial and enzymatic methodologies. Food Technol. Biotechnol. 2006, 44, 335–353. [Google Scholar] [CrossRef]
- Bamforth, C.W.; Cook, D.J. Food, Fermentation, and Micro-Organisms, 2nd ed.; Wiley: New York, NY, USA, 2019. [Google Scholar] [CrossRef]
- Petrovici, A.R.; Ciolacu, D.E. Natural flavours obtained by microbiological pathway. In Generation of Aromas and Flavours; InTech: London, UK, 2018; pp. 33–52. [Google Scholar]
- Rajendran, S.; Silcock, P.; Bremer, P. Flavour volatiles of fermented vegetable and fruit substrates: A review. Molecules 2023, 28, 3236. [Google Scholar] [CrossRef]
- Szutowska, J. Functional properties of lactic acid bacteria in fermented fruit and vegetable juices: A systematic literature review. Eur. Food Res. Technol. 2020, 246, 357–372. [Google Scholar] [CrossRef]
- Teusink, B.; Molenaar, D. Systems biology of lactic acid bacteria: For food and thought. Curr. Opin. Syst. Biol. 2017, 6, 7–13. [Google Scholar] [CrossRef]
- Hayek, S.A.; Gyawali, R.; Aljaloud, S.O.; Krastanov, A.; Ibrahim, S.A. Cultivation media for lactic acid bacteria used in dairy products. J. Dairy Res. 2019, 86, 490–502. [Google Scholar] [CrossRef]
- Wegkamp, A.; Teusink, B.; de Vos, W.M.; Smid, E.J. Development of a minimal growth medium for Lactobacillus plantarum. Lett. Appl. Microbiol. 2010, 50, 57–64. [Google Scholar] [CrossRef] [PubMed]
- Kwoji, I.D.; Okpeku, M.; Adeleke, M.A.; Aiyegoro, O.A. Formulation of chemically defined media and growth evaluation of Ligilactobacillus salivarius ZJ614 and Limosilactobacillus reuteri ZJ625. Front. Microbiol. 2022, 13, 1450. [Google Scholar] [CrossRef] [PubMed]
- Jensen, P.R.; Hammer, K. Minimal requirements for exponential growth of Lactococcus lactis. Appl. Environ. Microbiol. 1993, 59, 4363–4366. [Google Scholar] [CrossRef] [PubMed]
- Niven, C.F. Nutrition of Streptococcus lactis. J. Bacteriol. 1944, 47, 343–350. [Google Scholar] [CrossRef]
- Cocaign-Bousquet, M.; Garrigues, C.; Novak, L.; Lindley, N.D.; Loublere, P. Rational development of a simple synthetic medium for the sustained growth of Lactococcus lactis. J. Appl. Bacteriol. 1995, 79, 108–116. [Google Scholar] [CrossRef]
- van Niel, E.W.J.; Hahn-Hägerdal, B. Nutrient requirements of lactococci in defined growth media. Appl. Microbiol. Biotechnol. 1999, 52, 617–627. [Google Scholar] [CrossRef]
- Pastink, M.I.; Teusink, B.; Hols, P.; Visser, S.; de Vos, W.M.; Hugenholtz, J. Genome-scale model of Streptococcus thermophilus LMG18311 for metabolic comparison of lactic acid bacteria. Appl. Environ. Microbiol. 2009, 75, 3627–3633. [Google Scholar] [CrossRef]
- Kranenburg, R.V.; Kleerebezem, M.; van Hylckama Vlieg, J.; Ursing, B.M.; Boekhorst, J.; Smit, B.A.; Ayad, E.H.E.; Smit, G.; Siezen, R.J. Flavour formation from amino acids by lactic acid bacteria: Predictions from genome sequence analysis. Int. Dairy J. 2002, 12, 111–121. [Google Scholar] [CrossRef]
- Christensen, J.E.; Dudley, E.G.; Pederson, J.A.; Steele, J.L. Peptidases and amino acid catabolism in lactic acid bacteria. Antonie Van Leeuwenhoek 1999, 76, 217–246. [Google Scholar] [CrossRef]
- Fernandez, M.; Zuniga, M. Amino acid catabolic pathways of lactic acid bacteria. Crit. Rev. Microbiol. 2006, 32, 155–183. [Google Scholar] [CrossRef]
- Teixeira, P. Lactobacillus, Lactobacillus brevis. In Encyclopedia of Food Microbiology; Elsevier: Amsterdam, The Netherlands, 2014; Volume 2, pp. 418–424. [Google Scholar] [CrossRef]
- Chen, D.; Chia, J.Y.; Liu, S.Q. Impact of addition of aromatic amino acids on non-volatile and volatile compounds in lychee wine fermented with Saccharomyces cerevisiae MERIT.ferm. Int. J. Food Microbiol. 2014, 170, 12–20. [Google Scholar] [CrossRef]
- Fairbairn, S.; McKinnon, A.; Musarurwa, H.T.; Ferreira, A.C.; Bauer, F.F. The impact of single amino acids on growth and volatile aroma production by Saccharomyces cerevisiae strains. Front. Microbiol. 2017, 8, 2554. [Google Scholar] [CrossRef]
- Chua, J.Y.; Tan, S.J.; Liu, S.Q. The impact of mixed amino acids supplementation on Torulaspora delbrueckii growth and volatile compound modulation in soy whey alcohol fermentation. Food Res. Int. 2021, 140, 109901–109913. [Google Scholar] [CrossRef]
- Lee, P.-R.; Yu, B.; Curran, P.; Liu, S.-Q. Impact of amino acid addition on aroma compounds in papaya wine fermented with Williopsis mrakii. S. Afr. J. Enol. Vitic. 2011, 32, 220–228. [Google Scholar] [CrossRef]
- Wang, Y.-Q.; Ye, D.-Q.; Liu, P.-T.; Duan, L.-L.; Duan, C.-Q.; Yan, G.-L. Synergistic effects of branched-chain amino acids and phenylalanine addition on major volatile compounds in wine during alcoholic fermentation. S. Afr. J. Enol. Vitic. 2016, 37, 169–175. [Google Scholar] [CrossRef]
- Meza, J.C.; Christen, P.; Revah, S. Effect of added amino acids on the production of a fruity aroma by Ceratocystis fimbriata. Sci. Aliment. 1998, 18, 627–636. [Google Scholar]
- Gutsche, K.A.; Tran, T.B.; Vogel, R.F. Production of volatile compounds by Lactobacillus sakei from branched chain alpha-keto acids. Food Microbiol. 2012, 29, 224–228. [Google Scholar] [CrossRef]
- Tavaria, F.K.; Dahl, S.; Carballo, F.J.; Malcata, F.X. Amino acid catabolism and generation of volatiles by lactic acid bacteria. J. Dairy Sci. 2002, 85, 2462–2470. [Google Scholar] [CrossRef]
- Canon, F.; Maillard, M.B.; Henry, G.; Thierry, A.; Gagnaire, V. Positive interactions between lactic acid bacteria promoted by nitrogen-based nutritional dependencies. Appl. Environ. Microbiol. 2021, 87, e01055-21. [Google Scholar] [CrossRef]
- Henderson, L.M.; Snell, E.E. A uniform medium for determination of amino acids with various microorganisms. J. Biol. Chem. 1948, 172, 15–29. [Google Scholar] [CrossRef]
- De man, J.C.; Rogosa, M.; Sharpe, M.E. A medium for the cultivation of lactobacilli. J. Appl. Bacteriol. 1960, 23, 130–135. [Google Scholar] [CrossRef]
- Russell, C.; Bhandari, R.R.; Walker, T.K. Vitamin requirements of thirty-four lactic acid bacteria associated with brewery products. J. Gen. Microbiol. 1954, 10, 371–376. [Google Scholar] [CrossRef] [PubMed]
- Hébert, E.M.; Raya, R.R.; Savoy de Giori, G. Evaluation of Minimal Nutritional Requirements of Lactic Acid Bacteria Used in Functional Foods; Humana Press Inc.: Totowa, NJ, USA, 2004. [Google Scholar]
- MacLeod, R.A.; Snell, E.E. Some mineral requirements of the lactic acid bacteria. J. Biol. Chem. 1947, 170, 351–365. [Google Scholar] [CrossRef]
- Zacharof, M.-P.; Lovitt, R.W. Partially chemically defined liquid medium development for intensive propagation of industrial fermentation lactobacilli strains. Ann. Microbiol. 2012, 63, 1235–1245. [Google Scholar] [CrossRef]
- Liu, M.; Nauta, A.; Francke, C.; Siezen, R.J. Comparative genomics of enzymes in flavor-forming pathways from amino acids in lactic acid bacteria. Appl. Environ. Microbiol. 2008, 74, 4590–4600. [Google Scholar] [CrossRef] [PubMed]
- Makarova, K.; Slesarev, A.; Wolf, Y.; Sorokin, A.; Mirkin, B.; Koonin, E.; Pavlov, A.; Pavlov, N.; Karamychev, V.; Polouchine, N.; et al. Comparative genomics of the lactic acid bacteria. Proc. Natl. Acad. Sci. USA 2006, 103, 15611–15616. [Google Scholar] [CrossRef]
- Klompong, V.; Benjakul, S.; Kantachote, D.; Shahidi, F. Characteristics and use of yellow stripe trevally hydrolysate as culture media. J. Food Sci. 2009, 74, 219–225. [Google Scholar] [CrossRef]
- Foudin, A.S.; Wynn, W.K. Growth of Puccinia graminis f. sp. tritici. Phytopathology 1972, 62, 1032–1040. [Google Scholar] [CrossRef]
- Li, T.; Jiang, T.; Liu, N.; Wu, C.; Xu, H.; Lei, H. Biotransformation of phenolic profiles and improvement of antioxidant capacities in jujube juice by select lactic acid bacteria. Food Chem. 2021, 339, 127859–127869. [Google Scholar] [CrossRef]
- McSweeney, P.L.H.; Sousa, M.J. Biochemical pathways for the production of flavour compounds in cheeses during ripening: A review. Le Lait 2000, 80, 293–324. [Google Scholar] [CrossRef]
- Ricci, A.; Cirlini, M.; Levante, A.; Dall’Asta, C.; Galaverna, G.; Lazzi, C. Volatile profile of elderberry juice: Effect of lactic acid fermentation using L. plantarum, L. rhamnosus and L. casei strains. Food Res. Int. 2018, 105, 412–422. [Google Scholar] [CrossRef]
- Valera, M.J.; Boido, E.; Ramos, J.C.; Manta, E.; Radi, R.; Dellacassa, E.; Carrau, F. The mandelate pathway, an alternative to the phenylalanine ammonia lyase pathway for the synthesis of benzenoids in Ascomycete Yeasts. Appl. Environ. Microbiol. 2020, 86, e00701-20. [Google Scholar] [CrossRef]
- Yvon, M.; Rijnen, L. Cheese flavour formation by amino acid catabolism. Int. Dairy J. 2001, 11, 185–201. [Google Scholar] [CrossRef]
- Hu, S.; Zhang, X.; Lu, Y.; Lin, Y.-C.; Xie, D.-F.; Fang, H.; Huang, J.; Mei, L.-H. Cloning, expression and characterization of an aspartate aminotransferase gene from Lactobacillus brevis CGMCC 1306. Biotechnol. Biotechnol. Equip. 2017, 31, 544–553. [Google Scholar] [CrossRef]
- Marilley, L.; Casey, M.G. Flavours of cheese products: Metabolic pathways, analytical tools and identification of producing strains. Int. J. Food Microbiol. 2004, 90, 139–159. [Google Scholar] [CrossRef] [PubMed]
- Ardö, Y. Flavour formation by amino acid catabolism. Biotechnol. Adv. 2006, 24, 238–242. [Google Scholar] [CrossRef] [PubMed]
- Hols, P.; Ramos, A.; Hugenholtz, J.; Delcour, J.; de Vos, W.M.; Santos, H.; Kleerebezem, M. Acetate utilization in Lactococcus lactis deficient in lactate dehydrogenase: A rescue pathway for maintaining redox balance. J. Bacteriol. 1999, 181, 5521–5526. [Google Scholar] [CrossRef]
- Feyereisen, M.; Mahony, J.; Kelleher, P.; Roberts, R.J.; O’Sullivan, T.; Geertman, J.A.; van Sinderen, D. Comparative genome analysis of the Lactobacillus brevis species. BMC Genom. 2019, 20, 416–431. [Google Scholar] [CrossRef]
- Barker, H.A.; Kamen, M.D.; Bornstein, B.T. The synthesis of butyric and caproic acids from ethanol and acetic acid by Clostridium kluyveri. Proc. Natl. Acad. Sci. USA 1945, 31, 373–381. [Google Scholar] [CrossRef]
- Reed, L.J.; DeBusk, B.G.; Johnston, P.M.; Getzendaner, M.E. Acetate-replacing factors for lactic acid bacteria. J. Biol. Chem. 1951, 192, 851–858. [Google Scholar] [CrossRef]
- Lindinger, W.; Hansel, A.; Jordan, A. Proton-transfer-reaction mass spectrometry (PTR-MS): On-line monitoring of volatile organic compounds at pptv levels. Chem. Soc. Rev. 1998, 27, 347–354. [Google Scholar] [CrossRef]
- Ba, V.H.; Hwang, I.; Jeong, D.; Touseef, A. Principle of meat aroma flavors and future prospect. In Latest Research into Quality Control; InTech: London, UK, 2012; pp. 145–176. [Google Scholar]
- Marsili, R. Flavors and off-flavors in dairy foods. In Encyclopedia of Dairy Sciences; Elsevier: Amsterdam, The Netherlands, 2022; pp. 560–578. [Google Scholar] [CrossRef]
- Smit, G.; Smit, B.A.; Engels, W.J. Flavour formation by lactic acid bacteria and biochemical flavour profiling of cheese products. FEMS Microbiol. Rev. 2005, 29, 591–610. [Google Scholar] [CrossRef] [PubMed]
- Johnsen, L.G.; Skou, P.B.; Khakimov, B.; Bro, R. Gas chromatography—Mass spectrometry data processing made easy. J. Chromatogr. A 2017, 1503, 57–64. [Google Scholar] [CrossRef]
- Baccolo, G.; Quintanilla-Casas, B.; Vichi, S.; Augustijn, D.; Bro, R. From untargeted chemical profiling to peak tables—A fully automated AI driven approach to untargeted GC-MS. Trends Anal. Chem. 2021, 145, 116451–116459. [Google Scholar] [CrossRef]
- Halang, W.A.; Langlais, R.; Kugler, E. Cubic spline interpolation for the calculation of retention indices in temperature programmed gas-liquid chromatography. Anal. Chem. 1978, 50, 1829–1832. [Google Scholar] [CrossRef]


 and 1.2%
  acetate. Values are presented as mean ± standard error (n = 6). Different letters represent significant difference between the different medium compositions according to Tukey’s test at p < 0.05.
and 1.2% acetate. Values are presented as mean ± standard error (n = 6). Different letters represent significant difference between the different medium compositions according to Tukey’s test at p < 0.05.
acetate. Values are presented as mean ± standard error (n = 6). Different letters represent significant difference between the different medium compositions according to Tukey’s test at p < 0.05.
and 1.2% acetate. Values are presented as mean ± standard error (n = 6). Different letters represent significant difference between the different medium compositions according to Tukey’s test at p < 0.05.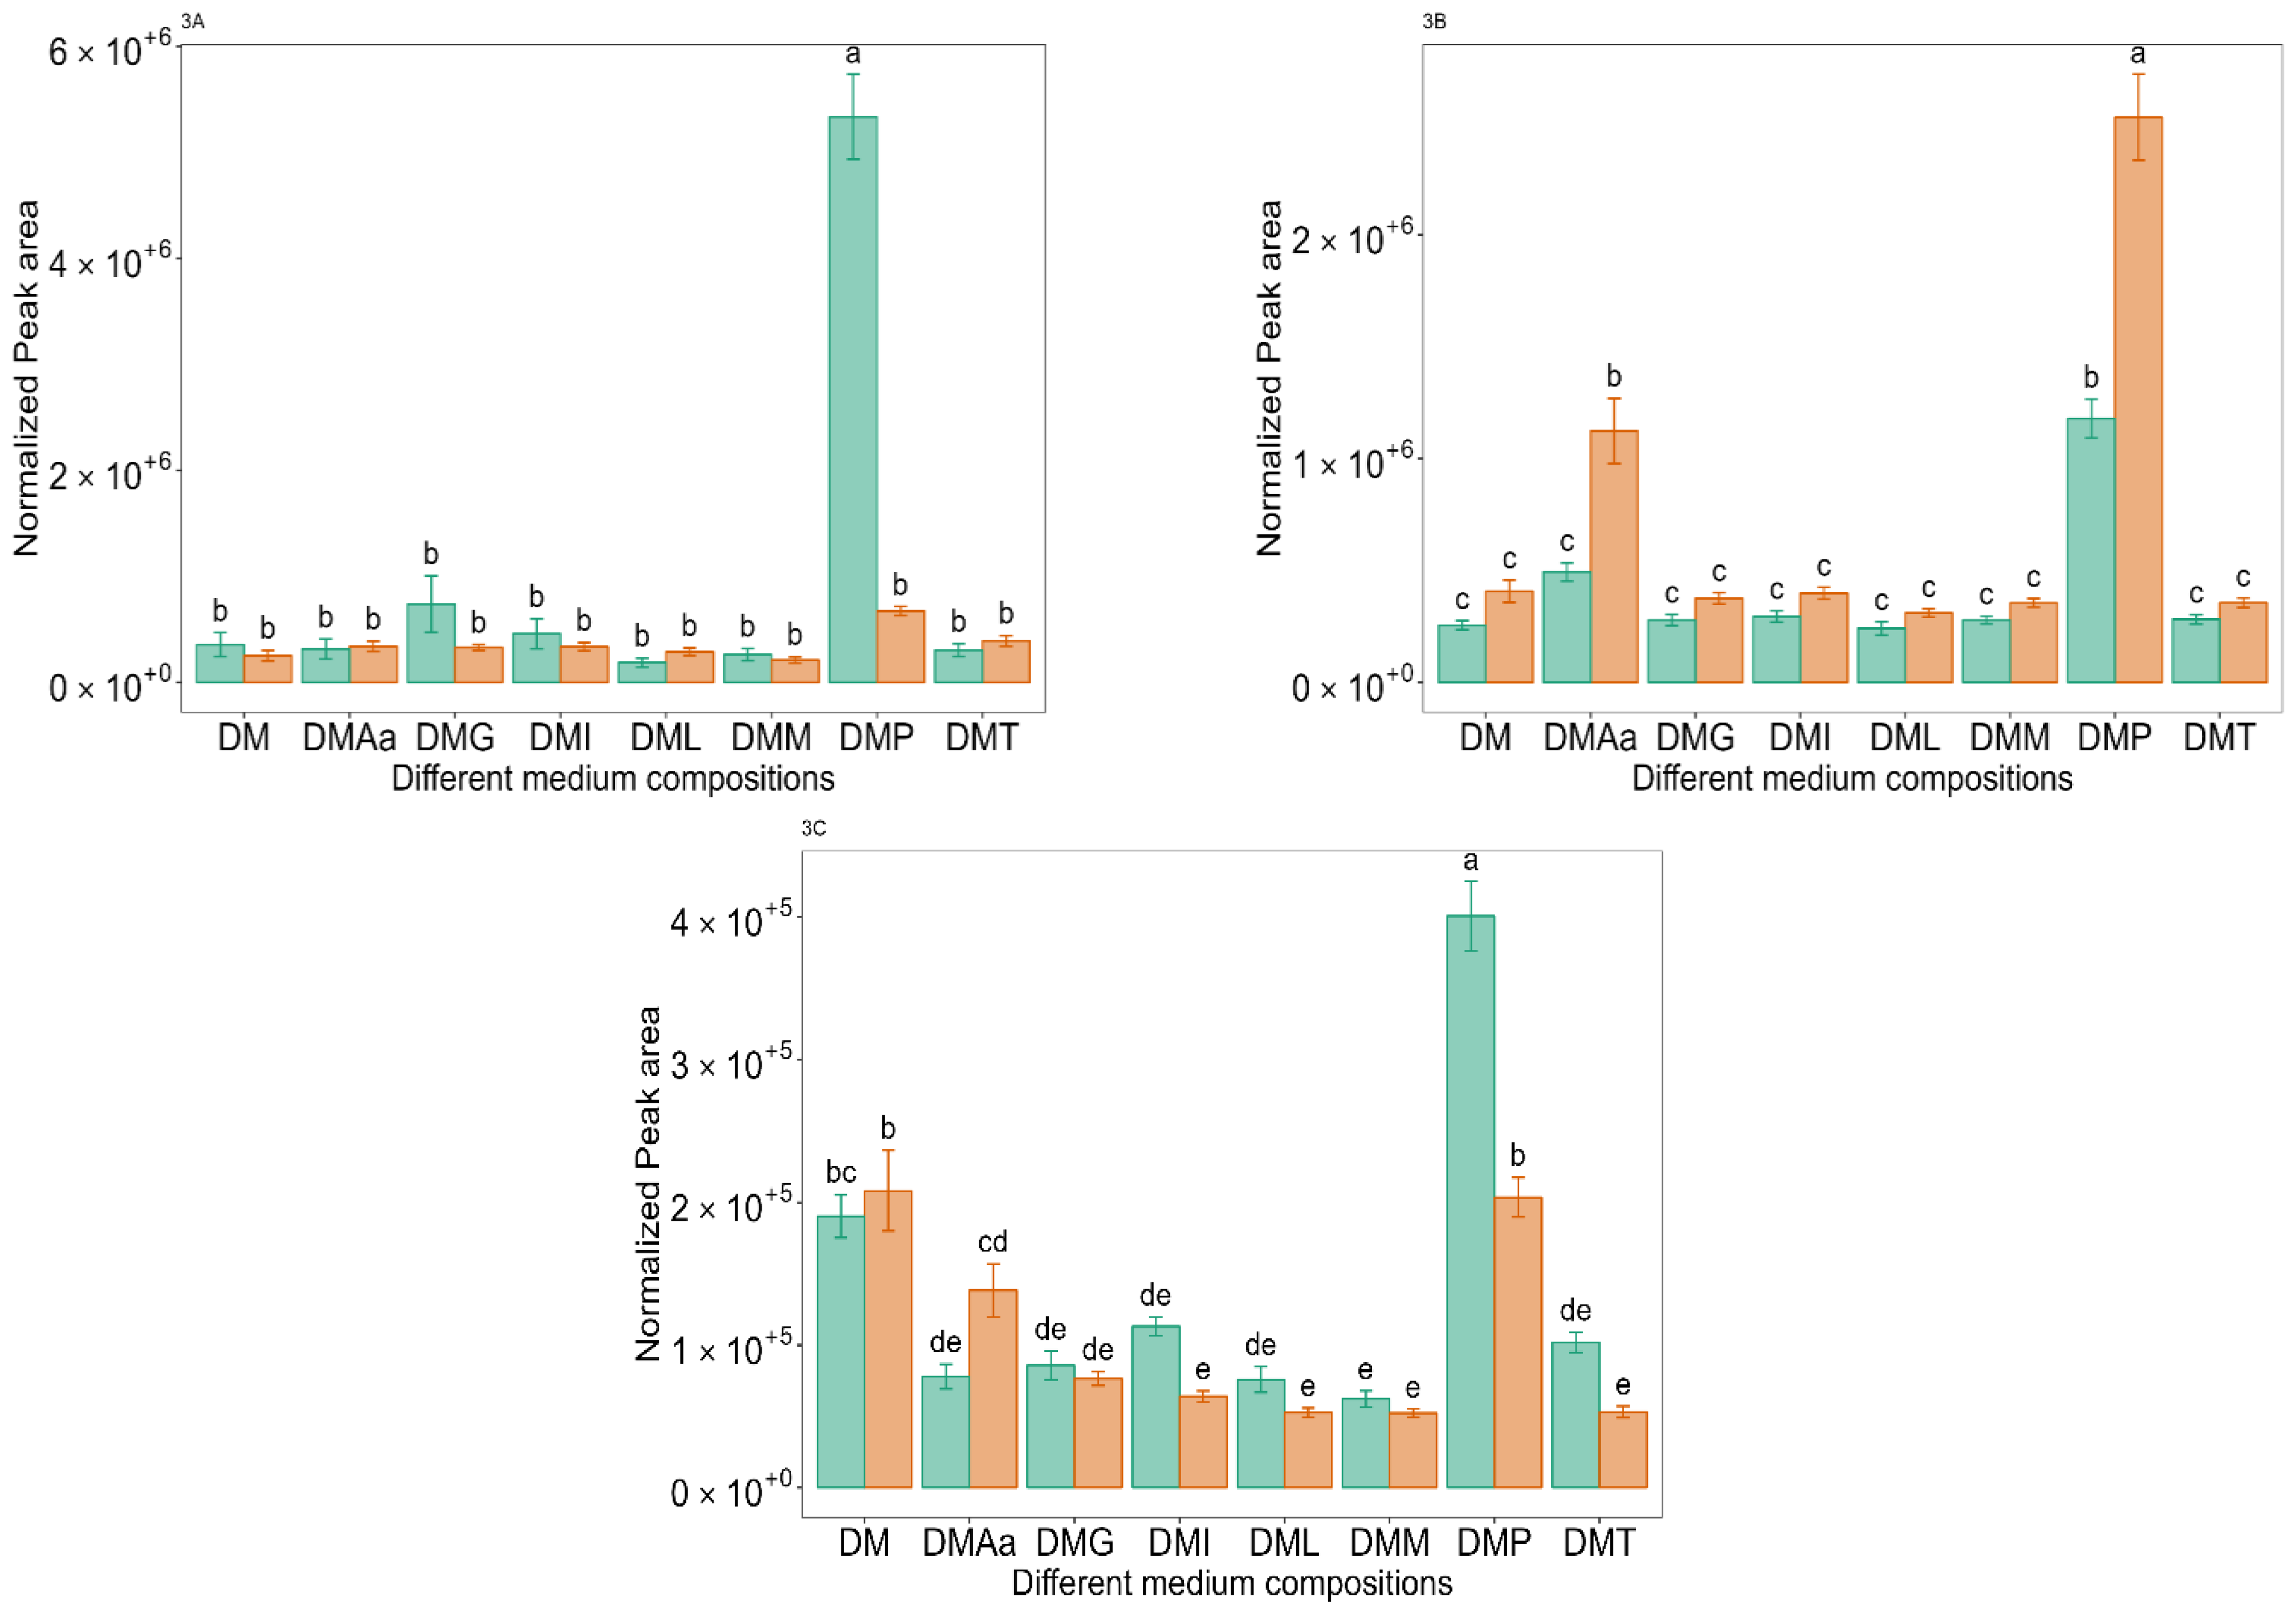 and 1.2% acetate. Values are presented as mean ± standard error (n = 6). Different letters represent significant difference between the different medium compositions according to Tukey’s test at p < 0.05.
and 1.2% acetate. Values are presented as mean ± standard error (n = 6). Different letters represent significant difference between the different medium compositions according to Tukey’s test at p < 0.05.
and 1.2% acetate. Values are presented as mean ± standard error (n = 6). Different letters represent significant difference between the different medium compositions according to Tukey’s test at p < 0.05.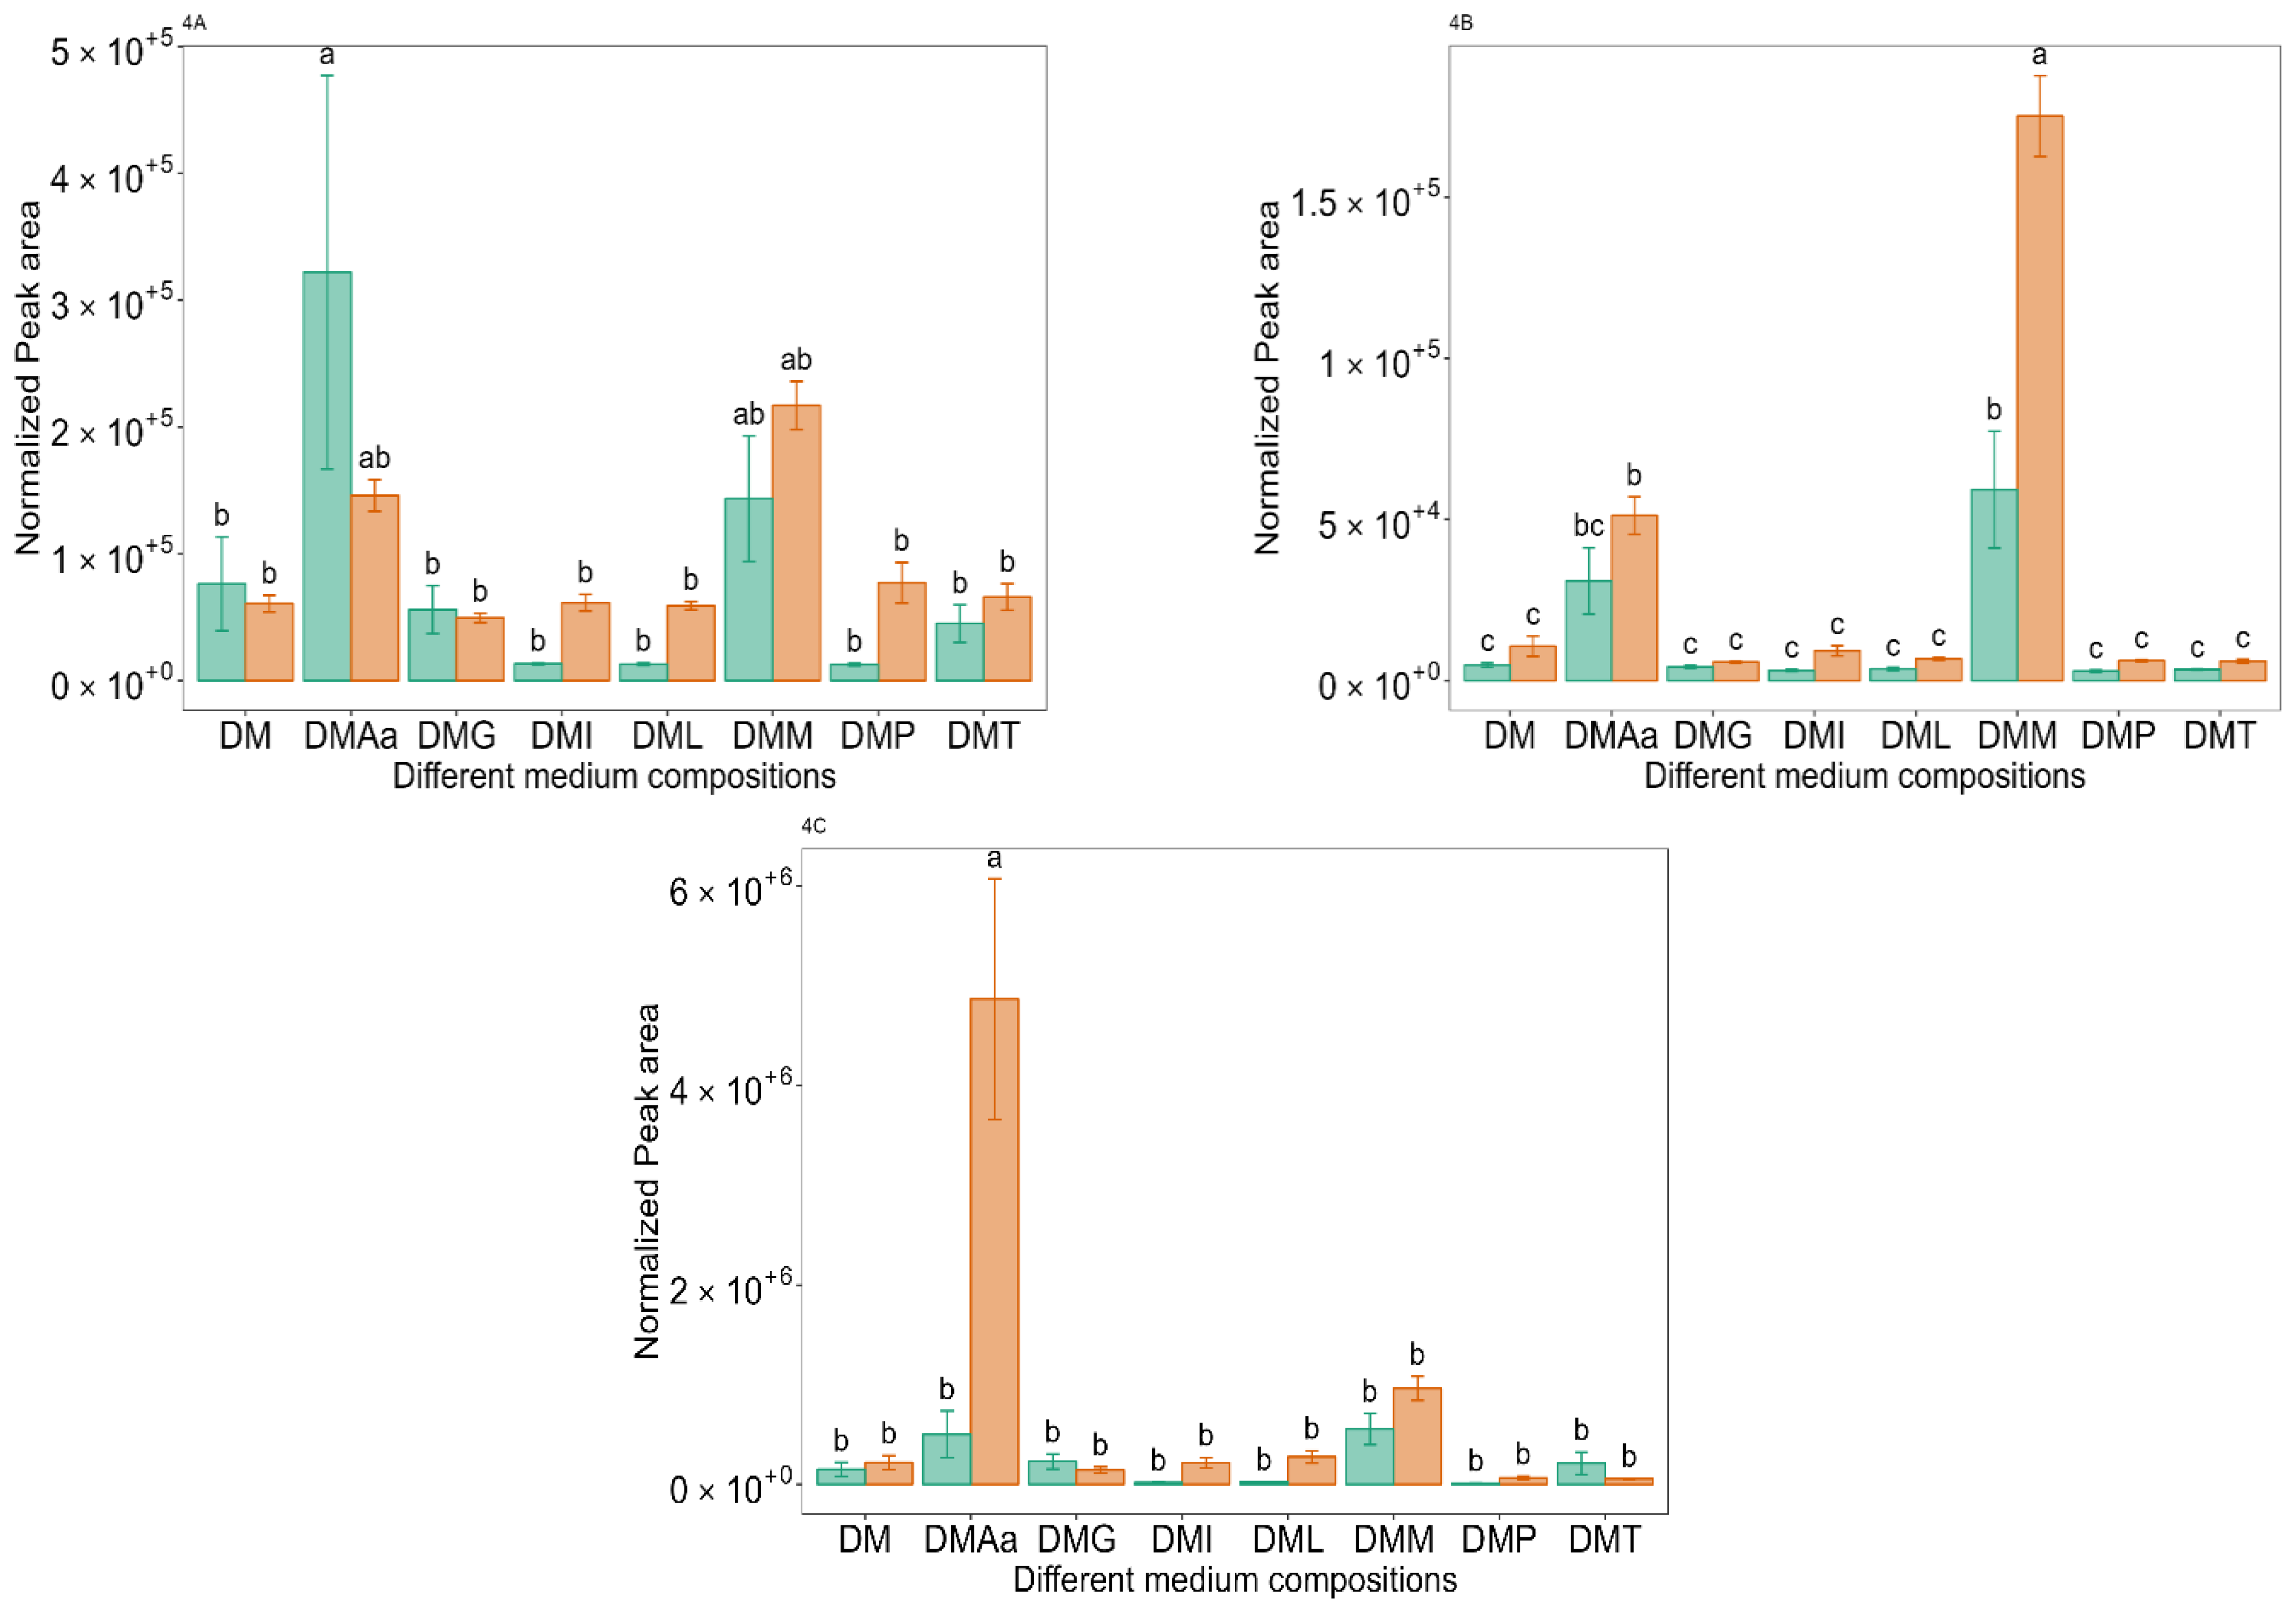 and 1.2% acetate. Values are presented as mean ± standard error (n = 6). Different letters represent significant difference between different medium compositions according to Tukey’s test at p < 0.05.
and 1.2% acetate. Values are presented as mean ± standard error (n = 6). Different letters represent significant difference between different medium compositions according to Tukey’s test at p < 0.05.
and 1.2% acetate. Values are presented as mean ± standard error (n = 6). Different letters represent significant difference between different medium compositions according to Tukey’s test at p < 0.05.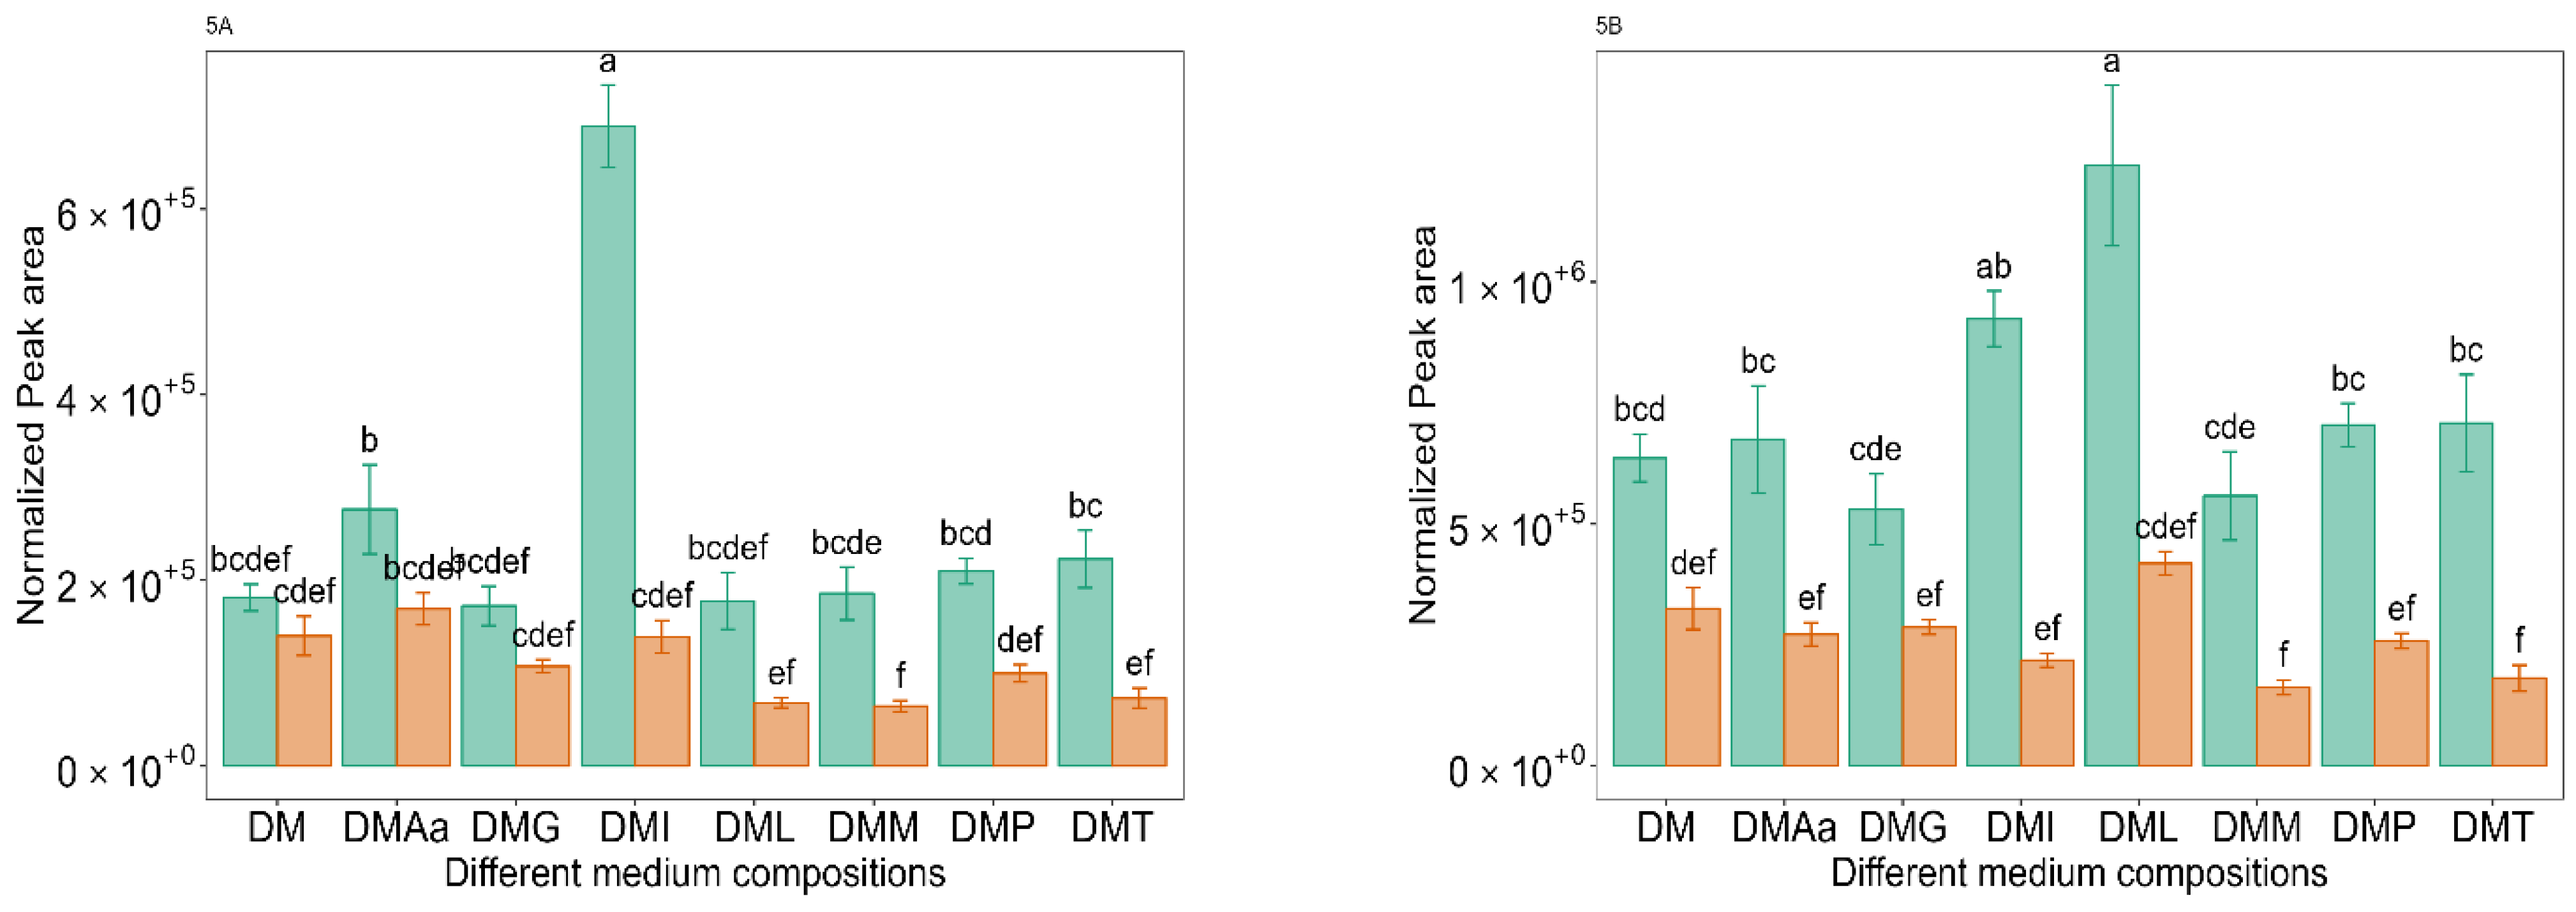 and 1.2% acetate. Values are presented as mean ± standard error (n = 6). Different letters represent significant difference between the different medium compositions according to Tukey’s test at p < 0.05.
and 1.2% acetate. Values are presented as mean ± standard error (n = 6). Different letters represent significant difference between the different medium compositions according to Tukey’s test at p < 0.05.
and 1.2% acetate. Values are presented as mean ± standard error (n = 6). Different letters represent significant difference between the different medium compositions according to Tukey’s test at p < 0.05.

| Media | Glucose | Peptone | Vitamins | Salt | Sodium Acetate | Glu | Leu | Ile | Phe | Thr | Met |
|---|---|---|---|---|---|---|---|---|---|---|---|
| DML0.1 | 2% | 0.5% | √ | √ | 0.1% | 0.2% | 0.2% | - | - | - | - |
| DMI0.1 | 2% | 0.5% | √ | √ | 0.1% | 0.2% | - | 0.2% | - | - | - |
| DMP0.1 | 2% | 0.5% | √ | √ | 0.1% | 0.2% | - | - | 0.2% | - | - |
| DMT0.1 | 2% | 0.5% | √ | √ | 0.1% | 0.2% | - | - | - | 0.2% | - |
| DMM0.1 | 2% | 0.5% | √ | √ | 0.1% | 0.2% | - | - | - | - | 0.2% |
| DMG0.1 | 2% | 0.5% | √ | √ | 0.1% | 0.2% | - | - | - | - | - |
| DM0.1 | 2% | 0.5% | √ | √ | 0.1% | - | - | - | - | - | - |
| DMAa0.1 | 2% | 0.5% | √ | √ | 0.1% | 0.2% | 0.04% | 0.04% | 0.04% | 0.04% | 0.04% |
| DML1.2 | 2% | 0.5% | √ | √ | 1.2% | 0.2% | 0.2% | - | - | - | - |
| DMI1.2 | 2% | 0.5% | √ | √ | 1.2% | 0.2% | - | 0.2% | - | - | - |
| DMP1.2 | 2% | 0.5% | √ | √ | 1.2% | 0.2% | - | - | 0.2% | - | - |
| DMT1.2 | 2% | 0.5% | √ | √ | 1.2% | 0.2% | - | - | - | 0.2% | - |
| DMM1.2 | 2% | 0.5% | √ | √ | 1.2% | 0.2% | - | - | - | - | 0.2% |
| DMG1.2 | 2% | 0.5% | √ | √ | 1.2% | 0.2% | - | - | - | - | - |
| DM1.2 | 2% | 0.5% | √ | √ | 1.2% | - | - | - | - | - | - |
| DMAa1.2 | 2% | 0.5% | √ | √ | 1.2% | 0.2% | 0.04% | 0.04% | 0.04% | 0.04% | 0.04% |
| Media | Initial pH | After 16 Days of Fermentation | |
|---|---|---|---|
| pH | OD600 | ||
| DML0.1 | 6.66 | 6.24 | 0.269 de |
| DMI0.1 | 6.64 | 6.30 | 0.271 de |
| DMP0.1 | 6.65 | 6.17 | 0.223 e |
| DMT0.1 | 6.68 | 6.10 | 0.297 de |
| DMM0.1 | 6.67 | 6.09 | 0.249 de |
| DMG0.1 | 6.83 | 6.20 | 0.286 de |
| DM0.1 | 7.85 | 7.28 | 0.391 cd |
| DMAa0.1 | 6.63 | 6.45 | 0.233 e |
| DML1.2 | 5.27 | 4.63 | 0.511 bc |
| DMI1.2 | 5.28 | 4.64 | 0.536 bc |
| DMP1.2 | 5.29 | 4.72 | 0.542 bc |
| DMT1.2 | 5.26 | 4.66 | 0.517 bc |
| DMM1.2 | 5.3 | 4.66 | 0.515 bc |
| DMG1.2 | 5.4 | 4.89 | 0.605 ab |
| DM1.2 | 7.01 | 5.0 | 0.711 a |
| DMAa1.2 | 5.31 | 4.87 | 0.492 bc |
| No. | Compound Name | RI (Calc.) | RI (Lit.) | R Match | Identification Method |
|---|---|---|---|---|---|
| Alcohols | |||||
| 1 | Ethanol | 930 | 932 | 942 | MS, RI |
| 2 | 2-Methyl propanol | 1086 | 1092 | 827 | MS, RI |
| 3 | 2-Pentanol | 1116 | 1119 | 881 | MS, RI |
| 4 | 2-Methyl butanol | 1199 | 1208 | 905 | MS, RI |
| 5 | 3-Methyl butanol (isoamyl alcohol) | 1200 | 1209 | 962 | MS, RI |
| 6 | 3-Heptanol | 1287 | 1290 | 959 | MS, RI |
| 7 | 2-Heptanol | 1310 | 1320 | 953 | MS, RI |
| 8 | 3-Methyl-2-buten-1-ol (prenol) | 1312 | 1320 | 815 | MS, RI |
| 9 | 1-Hexanol | 1343 | 1355 | 832 | MS, RI |
| 10 | 4-Methyl-2-heptanol | 1349 | 1372 | 900 | MS, RI |
| 11 | 2-Octanol | 1410 | 1412 | 849 | MS, RI |
| 12 | 2-Nonanol | 1508 | 1521 | 952 | MS, RI |
| 13 | 1-Octanol | 1545 | 1557 | 912 | MS, RI |
| 14 | 1-Nonanol | 1647 | 1660 | 883 | MS, RI |
| 15 | 1-Decanol | 1751 | 1760 | 824 | MS, RI |
| 16 | Citronellol | 1752 | 1765 | 801 | MS, RI |
| 17 | Geraniol | 1833 | 1847 | 879 | MS, RI |
| 18 | Benzyl alcohol | 1868 | 1870 | 924 | MS, RI |
| 19 | Phenylethyl alcohol | 1904 | 1906 | 914 | MS, RI |
| Acids | |||||
| 20 | Acetic acid | 1429 | 1449 | 946 | MS, RI |
| 21 | Butanoic acid | 1620 | 1625 | 905 | MS, RI |
| 22 | 2-Methyl butanoic acid | 1659 | 1662 | 929 | MS, RI |
| 23 | 3-Methyl butanoic acid (isovaleric acid) | 1658 | 1666 | 956 | MS, RI |
| 24 | Hexanoic acid | 1836 | 1846 | 903 | MS, RI |
| 25 | Heptanoic acid | 1944 | 1950 | 864 | MS, RI |
| 26 | Octanoic acid | 2049 | 2060 | 920 | MS, RI |
| 27 | Nonanoic acid | 2154 | 2171 | 912 | MS, RI |
| 28 | n-Decanoic acid | 2261 | 2276 | 801 | MS, RI |
| Esters | |||||
| 29 | Ethyl acetate | 889 | 888 | 957 | MS, RI |
| 30 | Butyl acetate | 1069 | 1074 | 959 | MS, RI |
| 31 | 3-Methylbutyl acetate | 1120 | 1122 | 867 | MS, RI |
| 32 | Ethyl hexanoate | 1230 | 1233 | 860 | MS, RI |
| 33 | Ethyl heptanoate * | 1331 | 1331 | 771 | MS, RI |
| 34 | 2-Phenylethyl acetate | 1813 | 1813 | 800 | MS, RI |
| Sulphur compounds | |||||
| 35 | Methanethiol * | 690 | 692 | 734 | MS, RI |
| 36 | Dimethyl disulphide | 1072 | 1077 | 965 | MS, RI |
| 37 | Dimethyl trisulphide | 1386 | 1377 | 935 | MS, RI |
| 38 | Methional | 1455 | 1454 | 809 | MS, RI |
| 39 | 5-Ethenyl-4-methyl thiazole | 1527 | 1520 | 917 | MS, RI |
| Ketones | |||||
| 40 | 4-Methyl-4-penten-2-one | 1069 | 1110 | 804 | MS, RI |
| 41 | 2-Heptanone | 1183 | 1182 | 921 | MS, RI |
| 42 | 2-Nonanone | 1390 | 1390 | 954 | MS, RI |
| 43 | 2-Undecanone | 1600 | 1598 | 939 | MS, RI |
| Aldehydes | |||||
| 44 | Benzaldehyde | 1530 | 1520 | 961 | MS, RI |
| Unknown compounds | |||||
| 45 | Unknown 1 | 1027 | NA | ||
| 46 | Unknown 2 | 1139 | NA | ||
| 47 | Unknown 3 | 1181 | NA | ||
| 48 | Unknown 4 | 1597 | NA | ||
| 49 | Unknown 5 | 1803 | NA | ||
Disclaimer/Publisher’s Note: The statements, opinions and data contained in all publications are solely those of the individual author(s) and contributor(s) and not of MDPI and/or the editor(s). MDPI and/or the editor(s) disclaim responsibility for any injury to people or property resulting from any ideas, methods, instructions or products referred to in the content. |
© 2024 by the authors. Licensee MDPI, Basel, Switzerland. This article is an open access article distributed under the terms and conditions of the Creative Commons Attribution (CC BY) license (https://creativecommons.org/licenses/by/4.0/).
Share and Cite
Rajendran, S.; Silcock, P.; Bremer, P. Volatile Organic Compounds (VOCs) Produced by Levilactobacillus brevis WLP672 Fermentation in Defined Media Supplemented with Different Amino Acids. Molecules 2024, 29, 753. https://doi.org/10.3390/molecules29040753
Rajendran S, Silcock P, Bremer P. Volatile Organic Compounds (VOCs) Produced by Levilactobacillus brevis WLP672 Fermentation in Defined Media Supplemented with Different Amino Acids. Molecules. 2024; 29(4):753. https://doi.org/10.3390/molecules29040753
Chicago/Turabian StyleRajendran, Sarathadevi, Patrick Silcock, and Phil Bremer. 2024. "Volatile Organic Compounds (VOCs) Produced by Levilactobacillus brevis WLP672 Fermentation in Defined Media Supplemented with Different Amino Acids" Molecules 29, no. 4: 753. https://doi.org/10.3390/molecules29040753
APA StyleRajendran, S., Silcock, P., & Bremer, P. (2024). Volatile Organic Compounds (VOCs) Produced by Levilactobacillus brevis WLP672 Fermentation in Defined Media Supplemented with Different Amino Acids. Molecules, 29(4), 753. https://doi.org/10.3390/molecules29040753