Article

Effects of Rhizopus-arrhizus-31-Assisted Pretreatment on the Extraction and Bioactivity of Total Flavonoids from Hibiscus manihot L.

1
College of Life Sciences and Medicine, Zhejiang Sci-Tech University, Hangzhou 310018, China
2
Suqian Product Quality Supervision and Testing Istitute, Suqian 223800, China
3
College of Biological, Chemical Sciences and Engineering, Jiaxing University, Jiaxing 314001, China
*
Author to whom correspondence should be addressed.
These authors contributed equally to this work.
Molecules 2024, 29(5), 1046; https://doi.org/10.3390/molecules29051046
Submission received: 26 December 2023 / Revised: 21 February 2024 / Accepted: 25 February 2024 / Published: 28 February 2024

Abstract

:
The Hibiscus manihot L. (HML) Medic, an edible hibiscus of the Malvaceae family, is abundant with flavonoids. The study investigated how Rhizopus-arrhizus-31-assisted pretreatment affects the extraction and bioactivity of flavonoids from HML. The fiber structure of the fermented flavonoid sample (RFF) appears looser, more porous, and more disordered than the unfermented flavonoid sample (RUF). RFF demonstrates milder conditions and yields higher extraction rates. According to the Box–Behnken response surface optimization experiment, the optimal conditions for RFF include a material–liquid ratio of 1:41 g/mL, a 2 h extraction time, a 57% ethanol concentration, and an extraction temperature of 800 °C, resulting in a 3.69% extraction yield, which is 39.25% higher than that of RUF. Additionally, RFF exhibits greater activity than RUF in the radical-scavenging system. The IC50 values for DPPH, OH, and ABTS radicals are 83.43 μg/mL and 82.62 μg/mL, 208.38 μg/mL and 175.99 μg/mL, and 108.59 μg/mL and 75.39 μg/mL for RUF and RFF, respectively. UPLC-QTOF-MS analysis of the active components in the HML flavonoid sample revealed significant differences in the chromatograms of RUF and RFF, indicating that biofermentation led to substantial changes in composition and content from HML.

Graphical Abstract

1. Introduction

Hibiscus manihot L. (HML), also known as vegetable hibiscus, is an annual herbaceous plant belonging to Malvaceae and Abelmoschus Medicus [1]. Its flowers emit a pleasant fragrance and have both medicinal and culinary applications. HML boasts a higher concentration of flavonoids compared to plants such as ginkgo and soybean. Key flavonoids found in HML include rutin, hyperin, isoquercitroside, quercetin 3-O-β-d-glucofuranoside, and quercetin 3-O-robinobiosid [2,3]. Additionally, it contains various other active compounds such as polysaccharides, organic acids, and trace elements [4,5]. These bioactive compounds exhibit a range of physiological benefits including strong antioxidant properties, anti-pain and anti-inflammatory effects, cholesterol reduction, anti-cancer activity, and immune enhancement [6,7,8,9]. Therefore, the extraction of flavonoids from HML holds significance in pharmaceuticals, food additives, and cosmetics industries.
Various methods can enhance the extraction of Chinese herbal medicine, including chemical and physical techniques, enzymes, and microbial fermentation [10]. Solid-state fermentation, in particular, is a widely utilized fermentation method in food processing, agriculture, biomass energy, bioconversion, and detoxification [11]. This technique offers several advantages: (1) it employs a straightforward process and can utilize diverse materials. Agricultural and other wastes can undergo bioconversion without prior treatment [12]. (2) It is associated with lower production costs and requires minimal equipment investment. (3) The process yields higher-quality and more active fermentation products [13]. (4) Microbial fermentation enhances Chinese herbal medicine, promoting water and energy conservation while reducing waste [14]. Microbial fermentation has therefore emerged as a sustainable, energy-efficient, and effective technique.
In recent years, there has been a growing interest in fermented foods due to their potential to enhance nutrition and health benefits. Early studies suggest that fermentation can elevate the antioxidant levels in food. For instance, fermenting black beans with Bacillus subtilis increases the total flavonoid and phenol content [15]. Aspergillus niger can ferment wheat bran, thereby improving its physical and chemical qualities [16]. Fungal fermentation of bran increases levels of phenols, alkyl resorcinol, and antioxidants. Liu et al. [17] demonstrated that fermenting dandelion with fungi significantly boosts the levels of total flavonoids, which can effectively eliminate harmful free radicals and enhance overall antioxidant capacity. Their study identified 57 different types of flavonoids present after fermentation, compared to none before. Further research on fungi fermenting HML revealed changes in flavonoid content and antioxidant activity, suggesting potential applications in developing and utilizing fermented HML foods. Rhizopus arrhizus [18], a filamentous fungus, is widely found in both plants and animals. It is a versatile and adaptable fungus and can convert various carbon and nitrogen sources. Additionally, it exhibits a strong ability to produce acids and enzymes, including lactic acid, ethanol, and amylase [19,20,21,22]. Enzymes, with their high specificity and catalytic efficiency, can break down cell walls, allowing active compounds within the cytoplasm to overcome the dual barriers of cell walls and the extracellular matrix. This results in more complete extraction of active substances, faster reaction rates, and ultimately, higher extraction efficiency.
This study optimized the pretreatment process for Rhizopus-arrhizus-31-assisted extraction of total flavonoids from HML. Single-factor experiments and Box–Behnken response surface optimization were used to determine the optimal extraction conditions. After purification with the macroporous resin LX-83, the in vitro antioxidant activity of the extracted total flavonoids was assessed using various methods, including DPPH-radical-scavenging, hydroxyl-radical-scavenging, ABTS-radical-scavenging, and Fe3+-reducing power assays. The findings of this study are expected to provide a theoretical basis for further optimizing the extraction of total flavonoids from HML.

2. Results and Discussion

2.1. Changes in the Fiber Structure of HML

Scanning electron microscopy was used to confirm the changes in the structure of HML caused by fermentation. Before fermentation, the surface of the HML cell wall was smooth, flat, and had a solid structure (Figure 1A,a). After fermentation, the cell wall surface became irregular and porous, with honeycomb-like holes, and was covered with inactivated Rhizopus arrhizus JHK31 bacteria (Figure 1B,b). Fungal fermentation disrupted the fiber structure, facilitating the release of active substances from the fibers and thereby boosting the extraction of total flavonoids.
Over the course of fermentation, the color of HML gradually transformed from a golden yellow to a light brown, ultimately deepening to a dark brown hue. Initially characterized by a sour scent, the aroma gradually shifted to a characteristically musty one. Similarly, the texture underwent a significant change, starting dry and fluffy and progressively becoming lumpy and sticky. Upon drying, the final texture transformed into a loose, gravel-like consistency.

2.2. Effects of Extraction Factors on Total Flavonoid Production

2.2.1. Determination of Solid–Liquid Ratio

We compared the extraction yield of total flavonoids from raw unfermented HML (RUF) and roasted fermented HML (RFF) at different material-to-liquid ratios. Consistently, RFF showed a higher extraction yield than RUF, demonstrating that fermentation pretreatment effectively reduces the required solvent volume. This translates to lower analysis costs and minimal organic solvent residues, making the process more environmentally friendly.
Figure 2A illustrates how increasing the material-to-liquid ratio of RFF from 1:30 to 1:40 enhances the extraction yield. This is due to two factors: (1) the larger contact area between the sample and solvent allows for better interaction and (2) enhanced cell swelling facilitates the release of total flavonoid content. At a ratio of 1:40, the release and diffusion of total flavonoids reach equilibrium, resulting in a significant 39.85% increase in extraction yield for RFF compared to RFF (3.65%). Increasing the ratio further (beyond 1:40) can lead to a decline in extraction yield due to the co-extraction of impurities with the flavonoids, forming precipitates and hindering the release of pure flavonoids [23].
An analysis of peak extraction yield at 1:40 compared to adjacent ratios of 1:35 and 1:45 revealed a significant 13% difference between the highest and lowest values (p < 0.05). This confirms that a material-to-liquid ratio of 1:40 is optimal for subsequent response surface analysis.

2.2.2. Determination of Extraction Time

Figure 2B illustrates the impact of extraction time on the yields of RUF and RFF. Extending the extraction time from 1 h to 1.5 h significantly increased the yield for both samples. However, for RFF, the increase in yield slowed down after 1.5 h, reaching a maximum of 3.65% at 2 h. In contrast, RUF reached its maximum yield (3.35%) only at 3 h. This difference likely reflects the fact that longer extraction times allowed for the release of more total flavonoids from HML, while also extracting other soluble substances. However, these non-flavonoid substances diminished as the extraction time was further extended, resulting in a plateau in the total flavonoid yield [24]. Since fermentation accelerates flavonoid diffusion, extending the extraction time beyond 2 h had little impact on the final yield for RFF. Therefore, 2 h was selected as the optimal extraction time for further analysis using the response surface method.

2.2.3. Determination of Ethanol Concentration

In Figure 2C, we show the extraction yields of RUF and RFF at different concentrations of ethanol. We found that the extraction yields initially increased and then decreased as the ethanol concentration increased, between 40% and 80%. When the ethanol concentration was between 40% and 60% and the water content was high, not all flavonoids were released. However, as the ethanol concentration increased, the solubility of flavonoids also increased, leading to higher extraction yields. At 60% ethanol, RFF had a 1.4 times higher extraction yield than RUF. However, when the ethanol concentration was higher than 60%, it became harder to release larger-polarity flavonoids [25]. Other substances like fats and alcohols posed challenges for separation, reducing the overall flavonoid extraction yield [26]. At this point, there was no significant difference in extraction yields between RUF and RFF. Therefore, we chose 60% ethanol as the central concentration for further experiments.

2.2.4. Determination of Extraction Temperature

Figure 2D shows that as the extraction temperature increased from 50 °C to 90 °C, the extraction yield of RFF remained consistently higher than that of RUF. For RFF, the yield initially increased with temperature, peaking at 3.65% at 80 °C, then decreased. In contrast, RUF reached its maximum yield of 3.23% only at 90 °C. This means RFF achieved a 1.13 higher yield than RUF at its peak. This trend can be explained by the impact of temperature on the diffusion and solubility of flavonoids. Within a certain temperature range, heating accelerates the diffusion and extraction of these compounds, leading to an increase in yield [27]. However, at higher temperatures, flavonoids become more susceptible to degradation, resulting in a decline in yield. Since fermentation allows for lower extraction temperatures while maximizing yield, it offers a more environmentally friendly and energy-conserving approach. Consequently, 80 °C was chosen as the optimal temperature for further analysis using the response surface method.

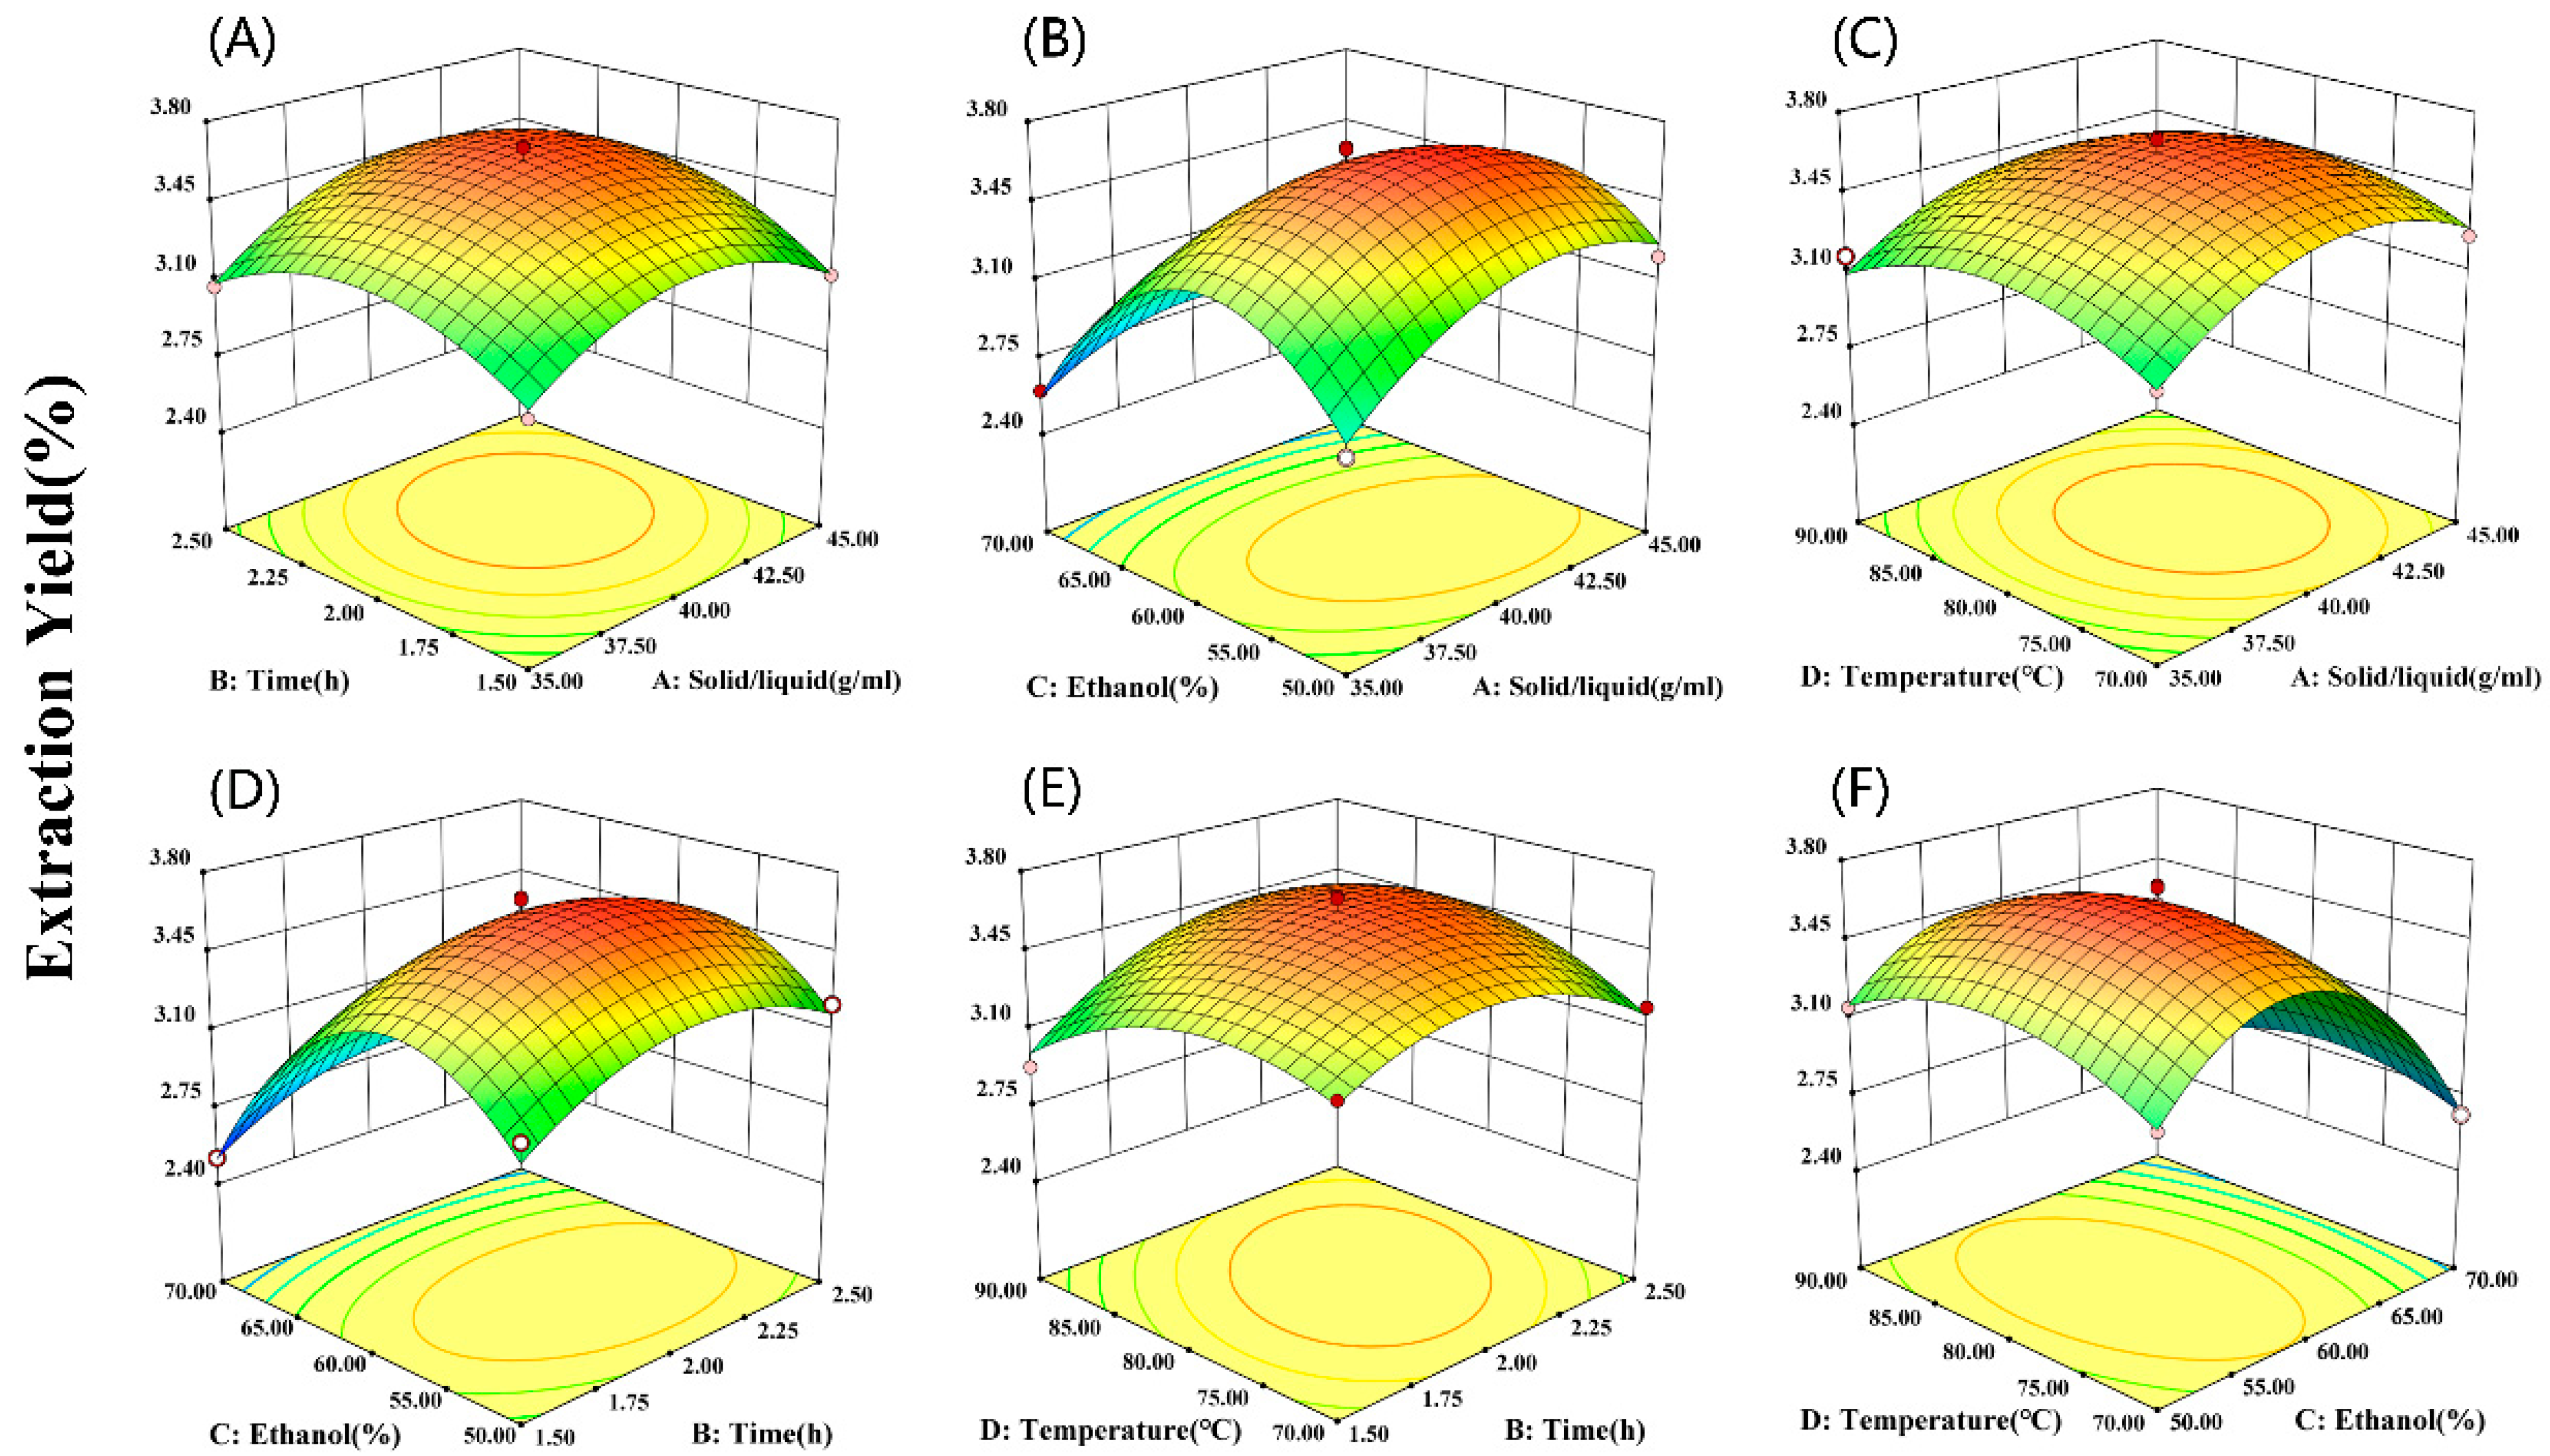
2.3. Response Surface Optimization Analysis

2.3.1. Box–Behnken Response Surface Optimization Experiment Results

According to the results of the single-factor experiments, the material–liquid ratio (A), extraction time (B), ethanol concentration (C), and extraction temperature (D) were selected as evaluation indices for response surface analysis. The results are described below (Table 1 and Table 2).

2.3.2. Parameter Optimization for RFF Extraction

Design-Expert (Version number 13.0.1.0) software was applied to analyze the experimental results using multiple quadratic regression. The regression model was subjected to variance analysis and the results are presented in Table 2. The extraction yield of RFF was predicted by a second-order polynomial.
Y = 3.62 + 0.0808 A + 0.0650 B − 0.2658 C − 0.0217 D + 0.0375 AB − 0.1000 AC − 0.0250 AD − 0.0100 BC +
0.1075 BD − 0.0475 CD − 0.2521 A2 − 0.2333 B2 − 0.5521 C2 − 0.2033 D2
The regression model demonstrated high significance with F = 48.64 and p < 0.01. The data fit the model well when the lack of fit p = 0.7972 > 0.05, The R2 = 0.9813 suggests a strong correlation. Both Adj-R2 and pred-R2 were reasonably consistent (p < 0.05), implying the model can effectively explain most of the variance and accurately predict optimal extraction conditions for RFF.
The influence of various factors on RFF extraction yield varied significantly, as indicated by the F-values. The order of decreasing impact was: ethanol concentration (C) > material–liquid ratio (A) > extraction time (B) > extraction temperature (D). Notably, temperature (D), and several interaction terms AB, AD, BC, and CD, exhibited no significant effects (p > 0.05). Conversely, the interaction term AC showed a significant influence (p < 0.05). Factors A, B, C, the interaction term BD, and secondary terms all possessed highly significant effects (p < 0.01). These findings suggest non-linear relationships between factors and response, highlighting the value of the regression equation in identifying optimal extraction conditions.

2.3.3. Response Surface Analysis and Process Optimization

To understand how the four factors (ethanol concentration, material–liquid ratio, extraction time, and extraction temperature) and their interactions affect RFF extraction yield, we analyzed contour plots. The steepness of the response surface, reflected by the contour shape and slope, indicates the magnitude of the impact on yield. As extraction conditions change, a greater sensitivity between factors, shown by steeper slopes or more eccentric ellipses in the contour shape, signifies a stronger interaction. Conversely, circular contours represent weaker interactions [28].
The interaction between the feed–liquid ratio and extraction time displayed a parabolic trend (Figure 3A). The RFF extraction yield increased initially with both factors, reaching a maximum, and then declined. The interaction surfaces between the material–liquid ratio and ethanol concentration suggested a significant effect on the extraction yield. However, ethanol concentration had a more pronounced impact compared to the material–liquid ratio (Figure 3B). There was an interaction between material–liquid ratio and extraction temperature. Similar to the previous interaction, the extraction yield initially increased with both parameters before decreasing (Figure 3C). The interaction between extraction time and ethanol concentration displayed a pronounced elliptical pattern (Figure 3D). The optimal ethanol concentration ranged between 55% and 60%, and the plot suggests a relationship between these factors, potentially influenced by the material’s cellular structure. Extraction time and temperature significantly affected the extraction yield, displaying a parabolic trend. Their interaction was also significant, with the yield initially rising and then falling with increasing extraction time and temperature (Figure 3E). By analyzing the contour plots, we determined the optimal ethanol concentration to be around 60% and the ideal extraction temperature to be 80 °C (Figure 3F).
The regression model predicted optimal RFF extraction conditions as material–liquid ratio 1:41.122 (g/mL), extraction time 2.082 h, ethanol concentration 57.373%, and extraction temperature 80.062 °C. Under these parameters, the anticipated RFF value was 3.672%. For practical purposes, the optimal conditions were adjusted to a material–liquid ratio of 1:41 (g/mL), extraction time of 2 h, ethanol concentration of 57%, and extraction temperature of 80 °C. Under the adjusted conditions, three concurrent validation tests resulted in an actual RFF extraction yield of 3.69%, with a relative error of 0.8%, closely matching the prediction. Compared to RUF, the Rhizopus-arrhizus-assisted pretreatment of HML resulted in significant benefits: reduced extraction time, lower temperature, less solvent, and a notably higher RFF extraction yield. This confirms the effectiveness of response surface analysis in optimizing the extraction process.

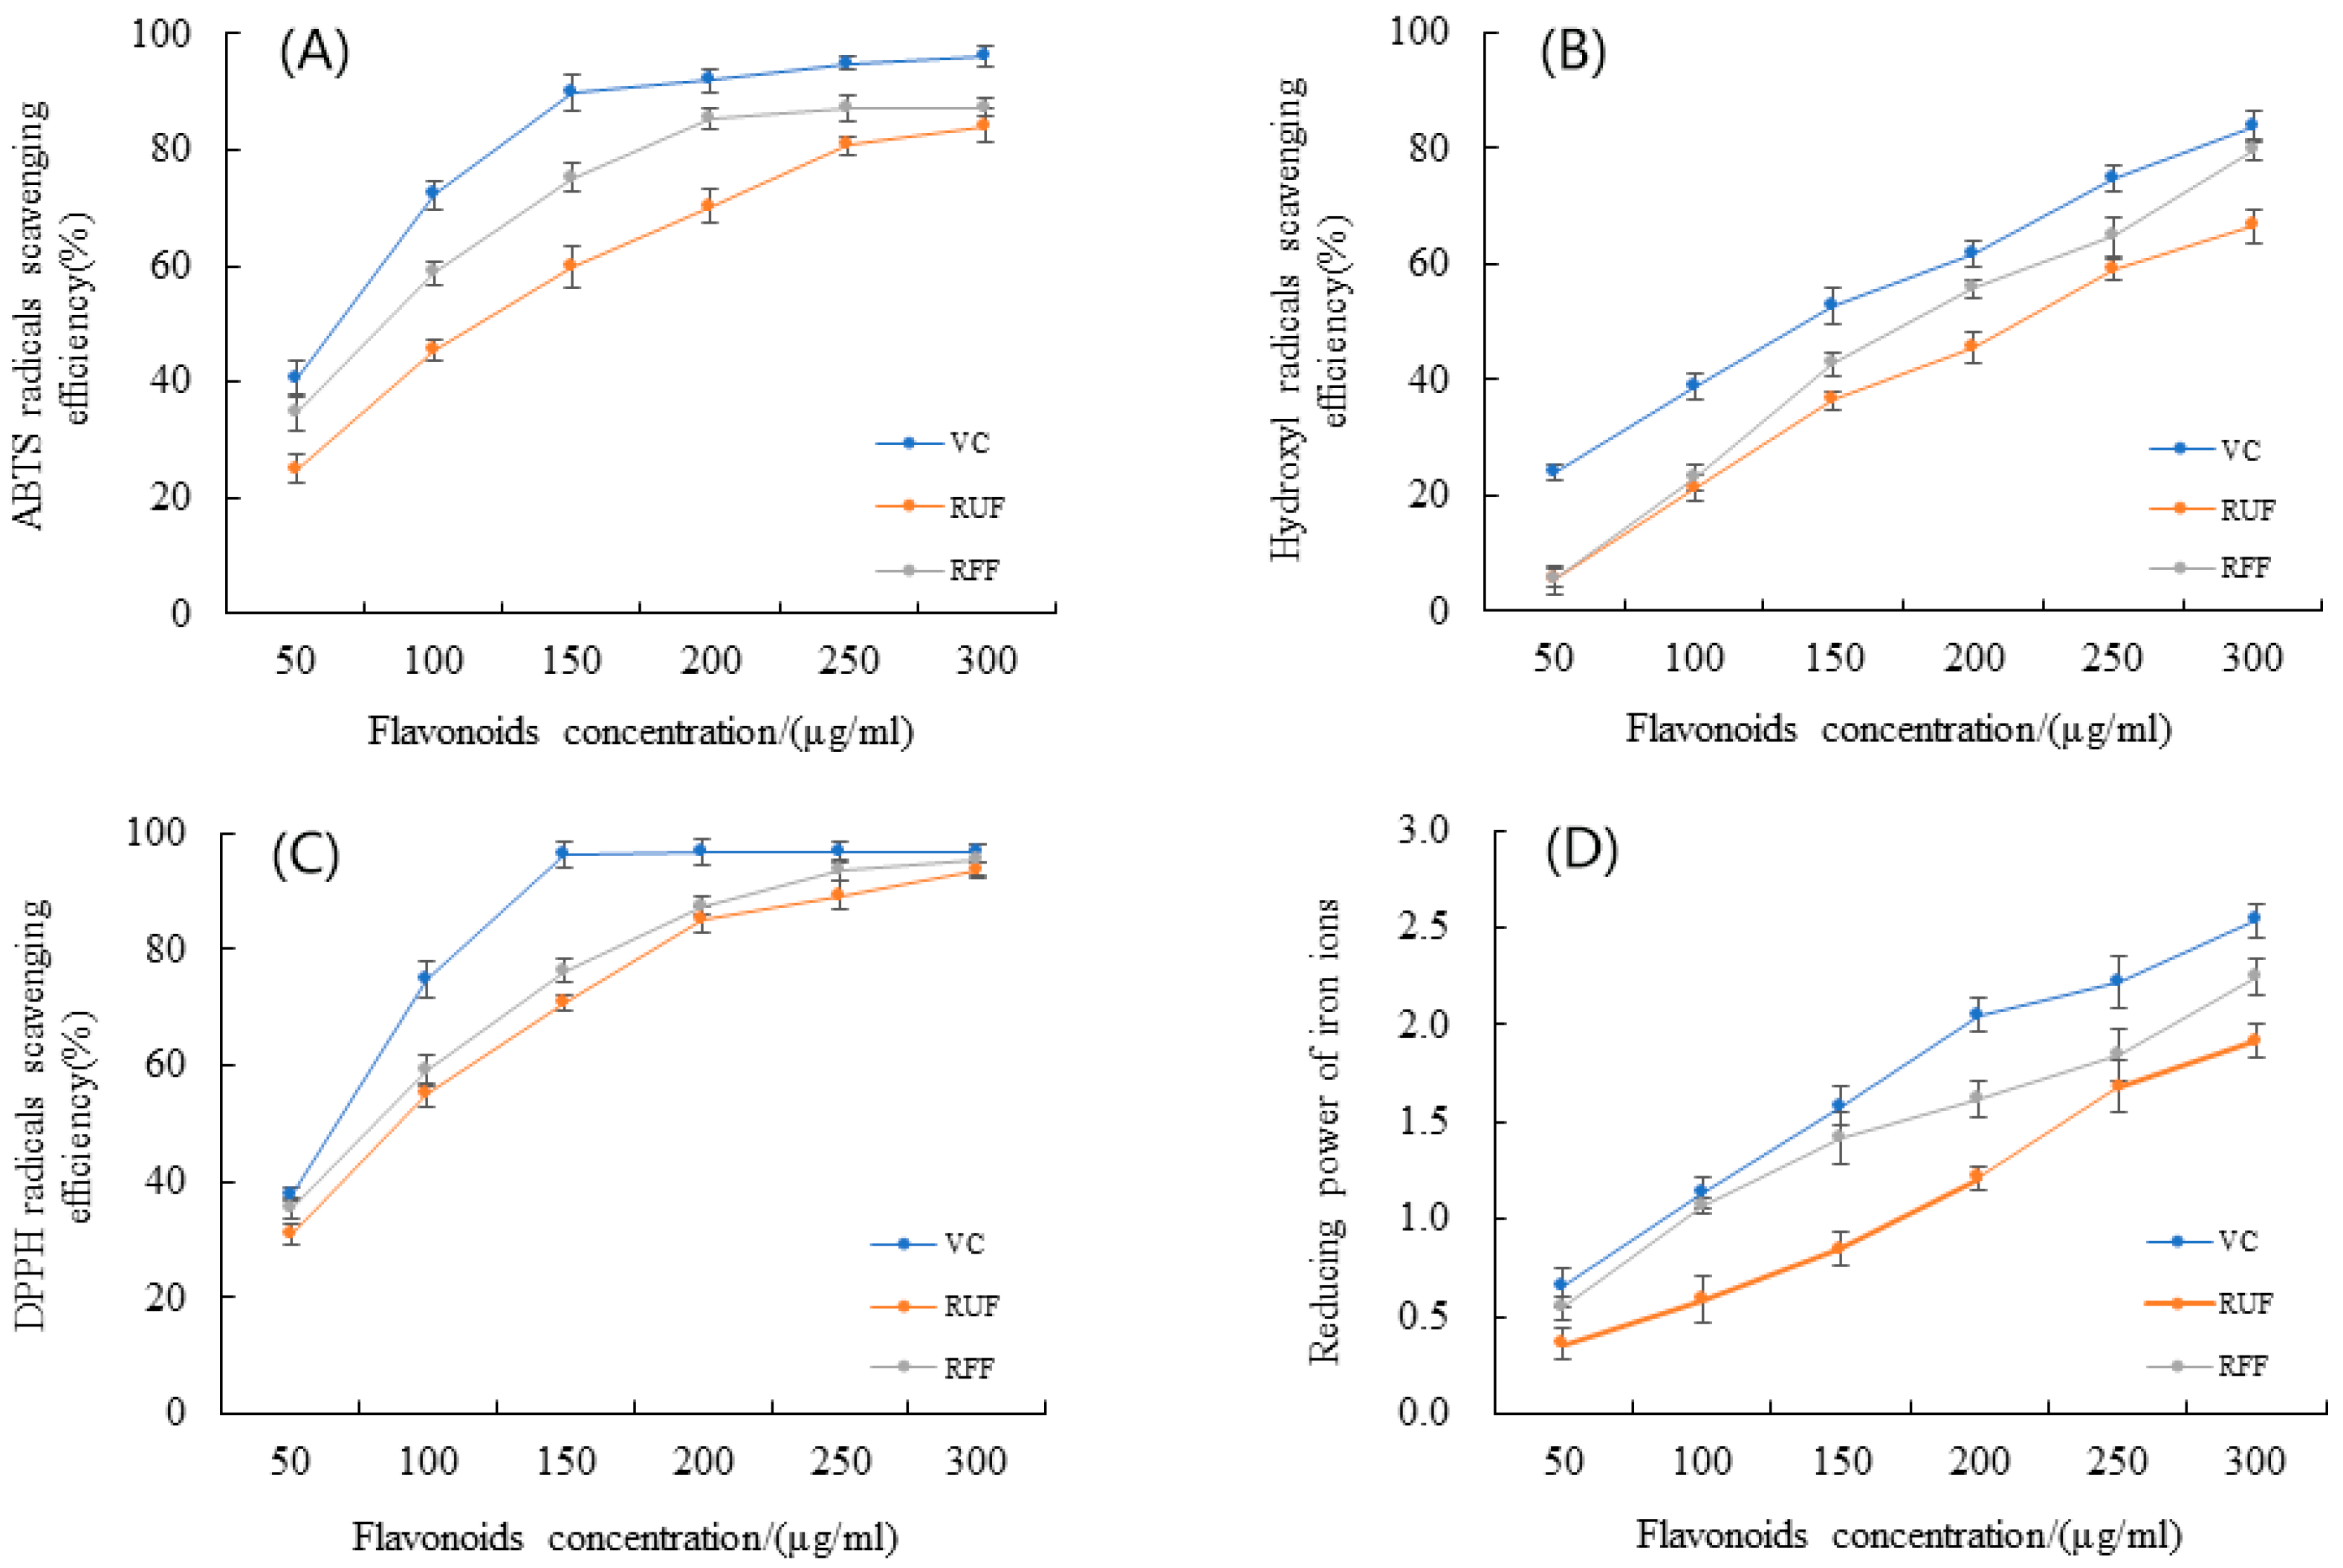
2.4. Comparison of Antioxidant Activity of RFF and RUF

Research on total flavonoid extraction mainly focuses on their ability to scavenge and reduce free radicals due to their antioxidant capacity. This ability stems from the reaction between their phenolic hydroxyl groups and free radicals, which results in the formation of stable semiquinone structures, effectively inhibiting the chain reactions that free radicals propagate. Considering that enzymatic activity can influence the antioxidant activity of flavonoids, we assessed the activity of RUF and RFF using multiple methods during fermentation.
This study revealed that both RUF and RFF exhibited significant scavenging and reducing abilities against DPPH, OH, ABTS radicals, and Fe3+. A notable positive correlation existed between the concentration of total flavonoid extract and these four indicators. When the concentration of total flavonoids was 300 μg/mL, the scavenging yields for RUF were 93.70% (DPPH), 66.51% (OH), and 84.24% (ABTS), whereas for RFF they were 95.45% (DPPH), 79.63% (OH), and 87.33% (ABTS) (Figure 4). This clearly shows that RFF significantly outperformed RUF in scavenging these radicals, with its antioxidant capacity for DPPH and ABTS approaching that of vitamin C. The IC50 values of RUF and RFF for DPPH, OH, and ABTS radicals were 83.43 μg/mL and 82.62 μg/mL, 208.38 μg/mL and 175.99 μg/mL, and 108.59 μg/mL and 75.39 μg/mL, respectively. These results confirm the significantly superior antioxidant capacity of RFF compared to RUF. Microbial pretreatment can potentially alter the original components of herbal medicines. Further research is needed to understand the specific transformation pathways involved and their impact on the biological activity of these components.

2.5. UPLC-QTOF-MS Analysis of RUF and RFF

2.5.1. UPLC-QTOF-MS Analysis of RUF and RFF Chemical Composition

Both RUF and RFF chromatograms exhibited well-separated peaks, indicating satisfactory resolution for various components. This good separation allows for an effective comparison of changes in these components between RUF and RFF.
Using the chromatography–mass spectrometry conditions described in Section 3.12, we analyzed and interpreted the compositions of RUF and RFF with the UPLC-QTOF-MS method. We acquired total ion chromatograms in both positive and negative ion modes, as presented in Figure 5. Significant differences were observed in the chromatograms of the two samples, indicating that the flavonoid composition changed substantially during fermentation. By analyzing primary and secondary mass spectrometry data, and comparing them with the PubMed database and Malvaceae family literature, we identified 63 and 87 compounds in RUF and RFF, respectively, as listed in Table 3 and Table 4.
Analysis showed 52 common peaks between RUF and RFF. Fermentation led to a decrease in the content percentage of 24 substances. The three most significant decreases were observed in hyperoside (12.26%), myricetin 3-O-β-d-glucoside (5.79%), and quercetin 3′-O-β-d-glucoside (4.82%). Conversely, 28 substances increased in content percentage after fermentation, with the most significant increases seen in quercetin (13.61%), hibifolin (12.26%), and rutin (2.64%). A comparison shows that flavonoids form a significant cluster in the tables. Among them, the eight most abundant compounds in RUF were hibifolin (23.17%), hyperoside (16.57%), isoquercetin (11.61%), quercetin (10.17%), myricetin (8.09%), quercetin 3′-O-β-d-glucoside (7.76%), myricetin 3-O-β-d-glucoside (6.98%), and cannabiscitrin (5.15%). The eight most abundant compounds in RUF were hibifolin (31.06%), quercetin (23.79%), isoquercetin (12.86%), myricetin (7.43%), rutin (6.81%), hyperoside (4.31%), quercetin 3′-O-β-d-glucoside (2.94%), and leeaoside (2.50%). Figure 6 illustrates the chemical structures of quercetin, cannabiscitrin, isoquercetin, hyperoside, myricetin, quercetin 3′-O-β-d-glucoside, rutin, and hibifolin.

2.5.2. Analysis of Metabolomic and Enzymes

Preliminary metabolomic analysis showed that the CAMKK2 pathway, vital in quercetin metabolism, significantly impacts biological processes such as cardiac contraction, neurotransmitter release, and cell apoptosis. Notably, this pathway is also associated with the development of neurodegenerative diseases, cancer, and inflammation [29]. Additionally, the AMPK signaling pathway in humans is closely related to various diseases, including diabetes, obesity, and cardiovascular disorders [30]. Digestion and absorption pathways play a crucial role in neural functions, hormonal actions, feeding behaviors, and intestinal microbial activities [31].
Plant enzymes are involved in the biosynthetic pathway of flavonoids [32]. Our review of the literature and subsequent analysis identified key enzymes crucial in the biosynthetic pathway of hibifolin, particularly glucuronosyltransferase [33]. This enzyme either forms or cleaves glycosidic bonds, linking glucuronic acid to hibifolin. This process results in the production of quercetin-8-O-glucuronide and free glucuronic acid. Additionally, glycosidases and glucuronidases contribute to hibifolin metabolism. Glycosidases hydrolyze (break down) glycosidic bonds in hibifolin, releasing quercetin-8-O-glucuronide and other metabolites. Glucuronidases target glucuronic acid, aiding in its metabolism and transformation [34].

3. Materials and Methods

3.1. Materials

Hibiscus manihot L. was provided and identified by Yulin Xinbang Pharmaceutical Co., Ltd. (Yulin, China). It was dried in a tray at 65 °C, destemmed and crushed (0.42 mm), and stored at 4 °C for further use.
The fermentation strain was Rhizopus arrhizus JHK31. We obtained it through pressure screening. It is stored in the China Center for Type Culture Collection under the deposit number CCTCC M 2023722.
Reagents including rutin (P98%), vitamin C (P99%), aluminum nitrate nonahydrate (P99%), DPPH (P96%), iron trichloride hexahydrate (P99%), trichloroacetic acid (P99%), dibasic sodium phosphate (P99%), and sodium dihydrogen phosphate (P99%) were from Shanghai Macklin Biochemical Co., Ltd. (Shanghai, China). Shanghai Aladdin Biochemical Technology Co., Ltd. (Shanghai, China) provided other chemicals such as ferrous sulfate (P98%), green vitriol (P99%), sodium hydroxide (P96%), Tris (P99.8%), and salicylic acid (P99%). Shanghai yuanye Bio-Technology Co., Ltd. (Shanghai, China) provided hyperoside (P98%), isoquercitrin (P98%), myricetin (P98%), and quercetin (P98%). Other chemicals such as sodium nitrite (P99%), potassium ferricyanide (P99.5%), and pyrogallol (P99%) were analytically pure. Acetonitrile and methanol were of chromatographic grades. The resin used was LX-83 macroporous resin from Sunresin New Materials Co., Ltd. (Xi’an, China). We used ultrapure water in all experiments.

3.2. Instruments

High-pressure sterilizer LDZH-150KBS, Shenan Medical Device Factory (Shanghai, China). Digital display thermostat water bath WB-6, MAIKENUO Instrument Co., Ltd. (Changzhou, China). Constant-temperature incubator LRH-150, Sapeen Scientific Instrument Co., Ltd. (Shanghai, China). Drying cabinet DGG-9150G, Senxin Experimental Instrument Co., Ltd. (Shanghai, China). Ultraviolet–visible spectrophotometer UV-1100, Mepada Instrument Co., Ltd. (Shanghai, China). Pipettor YE209AT0043015, DLAB Scientific Co.Ltd. (Beijing, China). Crusher FE220, Zhongxing weiye Instrument Co., Ltd. (Beijing, China). Circulating water vacuum pumps SHZ-DIII, Yarong biochemical instrument factory (Shanghai, China). High-speed centrifuge M18G, Magal Technology Instrument Co., Ltd. (Shanghai, China). Vacuum freeze dryer LGJ-10, Songyuan Huaxing Technology Development Co., Ltd. (Beijing, China).

3.3. Preparation of Spore Suspension

We grew the Rhizopus arrhizus JHK31 by putting it on a PDA solid medium. It was then incubated at 28 °C for 72 h. To collect the spores of Rhizopus arrhizus, sterile saline was poured into the plate, and the spores were scraped with an inoculating ring into a 50 mL centrifuge tube. The tube was then vortexed and shaken. To prepare a spore mixture, we filtered the solution with a lens wipe and cotton to dislodge the mycelium. We used a hematological counting plate to determine the spore concentration and adjusted it to 1 × 10⁸ cfu/mL for fermentation.

3.4. Process Flow of Total Flavonoid Preparation

HML was processed through the following steps: destemming, drying, crushing and sieving (40 mesh), sterilization, solid-state fermentation with Rhizopus arrhizus JHK31, ethanol reflux extraction, filtration and concentration to a constant volume, total flavonoid content determination, rotary evaporation and concentration, freeze drying, and purification using a macroporous resin. Finally, antioxidant activity was determined.
A fermented total flavonoid sample (RFF) was obtained using ethanol reflux extraction from the fermentation-treated HML. In contrast, unfermented HML was directly subjected to ethanol reflux extraction, resulting in an unfermented total flavonoid sample (RUF).

3.5. Preparation of Fermentation Substrate of HML

We used HML from the same batch and sterilized it for use as the experimental material. We took 10 g of HML and put it into 10 mL of sterile water. Then, we added 7.0% spore suspension of Rhizopus arrhizus JHK31, 0.2% ammonium sulfate, and 2.0% glucose. The mixture was then adjusted to an initial pH of 6 using a phosphate buffer. The mixture was fermented for 60 h at 28 °C. After fermentation, we spread the samples on a tray and dried them at 65 °C for 24 h. We crushed the samples and sifted them through a 40-mesh screen to acquire HML fermentation substrate. We stored the substrate in a sealed container at 4 °C.

3.6. Electron Microscopy Observation of HML Fibers

The powder of HML was evenly adhered to a sample stage equipped with double-sided adhesive tape. Observations and photography were conducted under an electron microscope. The microscope used 15.0 kV of power and magnifications of 1000× and 5000×.

3.7. Determination of the Extraction Yield of Total Flavonoid Content

3.7.1. Standard Curve

We used the method from the 2020 China Pharmacopoeia to measure flavonoid content in HML. We plotted the standard curve by using rutin concentration (C, mg/mL) as the x-axis and absorbance (A) as the y-axis. The rutin standard curve linear regression equation is y = 9.17143 x + 0.0052 (R2 = 0.9999).

3.7.2. Extraction of Total Flavonoids and Calculation of Extraction Yield

We extracted them with specific conditions. These conditions include the material–liquid ratio, ethanol concentration, extraction time, and temperature. We spun the mixture at 10,000 r/min for 10 min. The collected liquid was the total flavonoid extract. We transferred 3 mL of the extract to a 25 mL flask and measured its absorbance. The measurement was repeated three times. We used a specific formula to calculate the extraction yield of the total flavonoid content.
Y = C × V m × 1000 × 100 %
where: Y is the extraction yield of RUF and RFF (%); C is the total flavonoid concentration (mg/mL); V is the volume at the point of determination (mL); m is the weight of the sample (g).

3.8. Single-Factor Experiments on the Extraction Yield of RUF and RFF

Single-factor experiments were conducted to evaluate the influence of variables such as material-to-liquid ratio, ethanol concentration, extraction time, and temperature on the extraction yield of RUF and RFF. This assessment aims to define suitable parameter ranges and optimize the extraction process further.
An extraction process was conducted under the following conditions: 1 g sample of HML mixed with a certain amount of ethanol, 2 h extraction time, 80 °C temperature. The study aimed to assess the influence of various material–liquid ratios (1:30, 1:35, 1:40, 1:45, 1:50 (g/mL)) on the extraction efficiency of RUF and RFF. With a fixed material–liquid ratio of 1: 40, extraction time of 2.0 h, and extraction temperature of 80 °C, subsequent experiments were conducted to determine the extraction efficiency under varying ethanol concentrations (40, 50, 60, 70, 80 (%)). A fixed ethanol concentration of 60%, material–liquid ratio of 1:40, extraction temperature of 80 °C, and neutral pH were used to explore the effect of the extraction time (1.0, 1.5, 2.0, 2.5, 3.0 (h)) on the extraction yield of RUF and RFF. A fixed ethanol concentration of 60%, extraction time of 2 h, and material–liquid ratio of 1:40 were used to investigate the effect of the extraction temperature (50, 60, 70, 80, 90 (°C)) on the extraction yield of RUF and RFF.

3.9. Box–Behnken Response Surface Optimization Experiment Design for RFF

From the single-factor experiments results, we used the extraction yield of RFF as the response, and material–liquid ratio (A), extraction time (B), ethanol concentration (C), and maceration temperature (D) as the independent variables. A response surface analysis experiment with four factors and three levels had 29 experimental points (Table 5). We utilized the Box–Behnken model and the Design-Expert (Version number 13.0.1.0) software to determine the optimization conditions for total flavonoid extraction.

3.10. Purification of RUF and RFF with Macroporous Resin

First, 50 g of the pretreated LX-83 macroporous resin and 10 g of the sample (ultrapure water as the solvent) were weighed into a 250 mL stoppered triangular flask and agitated on a shaking bed at 28 °C for 24 h. The macroporous resin was filtered and transferred to a 250 mL triangular flask after complete adsorption. Then, 100 mL of 70% ethanol was added to the flask and desorbed for 24 h under the same conditions. The mixture was concentrated using rotary evaporation and subsequently freeze-dried to obtain the purified product.

3.11. In Vitro Antioxidant of RUF and RFF

3.11.1. Determination of DPPH-Radical-Scavenging Efficiency

The method was adapted from Zhang et al. [35] with modifications to test total flavonoid content at six different levels (50, 100, 150, 200, 250, 300 (μg/mL)). We compared them to a vitamin C solution of the same amount. We mixed 0.3 mL of the sample with 5 mL of 0.1 mM DPPH solution in a test tube and kept it in the dark for 30 min. The absorbance was then measured at 517 nm with 95% ethanol as a reference and absorbance was recorded as  A i . For another setup, we mixed 0.3 mL of the sample with 5 mL of 95% ethanol and recorded the absorbance as  A j . Additionally, a control was set up by replacing the sample with 0.2 mL of 95% ethanol and mixing it with 5 mL of DPPH solution, and absorbance was recorded as  A 0 . The formula for calculating the DPPH-radical-scavenging yield was as follows:
Y = 1 A i A j A 0 × 100 %

3.11.2. Determination of Hydroxyl-Radical-Scavenging Efficiency

The method was adapted with modifications from Zhang et al. [36]. To assess the scavenging activity of RFF and RUF, 1 mL of 3 mM H2O2 solution, 1 mL of 3 mM FeSO2 solution, and 0.5 mL of the total flavonoid (50, 100, 150, 200, 250, 300 (μg/mL)) extract were mixed. Then, 1 mL of 3 mM C7H6O3 ethanol solution was added. After thorough shaking, the mixture was incubated in a 37 °C water bath for 15 min. Distilled water was used as a reference. The absorbance at 510 nm was measured and recorded as  A X . The process was repeated, but H2O2 was replaced with distilled water and the absorbance was recorded as  A X 0 . Additionally, a control was prepared by measuring the absorbance without H2O2 or flavonoids, recorded as  A 0 . An equal concentration of vitamin  C  was used as a positive control. The scavenging effect of RFF and RUF was expressed as C and calculated using the following equation.
C = A 0 A X A X 0 A 0 × 100 %

3.11.3. Determination of ABTS-Radical-Scavenging Efficiency

This method, adapted from Tao et al. [37] with modifications. An ABTS stock solution was prepared by mixing 7 mM ABTS solution and 2.45 mM K2S2O8 solution at a 1:1 (v/v) ratio and storing it in the dark for 12–16 h. This stock was then diluted with ethanol to an approximate 1:46 (v/v) ratio, resulting in an absorbance of about 0.7 ± 0.2 at 734 nm. This diluted solution served as the ABTS working solution. For each test, 100 μL of different sample concentrations (50, 100, 150, 200, 250, 300 μg/mL) was added to 8 mL of the ABTS working solution and incubated in the dark for 6 min. Distilled water was used as a reference, and the absorbance at 734 nm was measured and recorded as  A 1 . A control was prepared by replacing the sample with ethanol, and the absorbance was recorded as  A 0 . Additionally, the absorbance of ethanol alone (replacing the ABTS working solution) was recorded as  A 2 . An equal concentration of vitamin C served as the positive control. The scavenging yield of ABTS radicals of RFF and RUF was expressed as  E  and calculated as follows:
E = 1 A 1 A 2 A 0 × 100 %

3.11.4. Determination of Reducing Power on Iron Ions

The method was adapted from Raza et al. [38] with modifications. Briefly, 1 mL of sample (50, 100, 150, 200, 250, 300 (μg/mL)), 2.5 mL of pH 6.6 phosphate buffer solution (PBS), and 2.5 mL of 1.0% potassium ferricyanide solution were mixed in a cuvette. Following incubation at 50 °C for 20 min, 2.5 mL of 10% trichloroacetic acid (TCA) solution was added to stop the reaction. The mixture was then centrifuged at 3000 rpm for 10 min. Next, 2.5 mL of the supernatant was combined with 2.5 mL of ultrapure water and 0.5 mL of 0.1% ferric chloride solution. After thorough mixing and a 10 min incubation, the absorbance at 700 nm was measured. Vitamin C served as the positive control and a blank without any sample was used for reference.

3.12. UPLC-QTOF-MS Analysis of Changes in Flavonoid Components of RUF and RFF

Extraction conditions: 0.1 g of fermented and unfermented powder of HML, 3 mL of methanol (chromatographically pure), extraction with ultrasound (power 200 W, frequency 53 kHz) for 45 min, passage through 0.22 μm microporous filter membrane. Chromatographic conditions: a combination of ACQUITY UPLCTM I-Class and XevoG3XS QTOF, Waters BEH T3 1.8 m chromatographic column (2.1 mm × 150 mm), column temperature of 40 °C. Mobile phase A = 0.1% formic acid solution, B = acetonitrile; gradient program: 0~1 min, 100%→97% A; 1~2 min, 97%→94% A; 2~2.5 min, 94%→88% A; 2.5~11 min, 88%→75% A; 11~13 min, 75%→50% A; 13~15 min, 50%→0% A; 15~17 min, 0% A; 17~20 min, 0%→97% A. Flow velocity 0.4 mL/min, detection wavelength 350 nm, injection volume 10 μL. Mass spectrometry conditions: electrospray ionization (ESI) ion source; a mass range of 50–1200 Da; ionization mode as ESI (+/−) collecting MSE; capillary voltage of 0.5 kV; ion source temperature of 100 °C; desolvation temperature of 280 °C; desolvation gas flow rate of 800 L/h; cone voltage of 40 V; collision energy of low energy 4 V and high energy 15–60 V; data-processing software is UNIFI 1.9.2.

3.13. Statistical Analysis

The experimental results were analyzed using Design-Expert (Version number 13.0.1.0) software and Adobe Photoshop CC 2018 (Adobe Photoshop (hjhvfh.top)). All experiments were conducted in triplicate unless otherwise noted.

4. Conclusions

This study employed Rhizopus arrhizus JHK3 fermentation to extract total flavonoids from HML. During fermentation, these microorganisms secrete powerful enzymes that break down complex molecules like cellulose and pectin in the plant cell wall, facilitating easier extraction of total flavonoids. This enzymatic breakdown reduces obstacles during solvent extraction, leading to faster, more efficient extraction and potentially stronger antioxidant activity in the final product. Optimal extraction conditions were determined through single-factor and response surface experiments, yielding a material–liquid ratio of 1:41 (g/mL), extraction time of 2 h, ethanol concentration of 57%, and extraction temperature of 80 °C. Under these conditions, the extraction yield of RFF (fermented total flavonoids) reached 3.69%. Additionally, both RUF and RFF exhibited significant scavenging abilities for DPPH, OH, and ABTS free radicals. They also displayed reducing power against ferric ions, with four antioxidant capacity indices of RFF surpassing RUF.
Using UPLC-QTOF-MS, specific chromatographic peaks present in the samples before and after fermentation were identified, leading to the determination of 63 and 87 corresponding compounds, respectively. Notably, a significant cluster of flavonoids was observed in both sets of compounds. Among these, 52 peaks remained unchanged, while 24 decreased and 28 increased in intensity after fermentation. This suggests that fermentation transformed certain flavonoids into compounds with potentially higher antioxidant activity. The pathways involved in quercetin metabolism include the CAMKK2 pathway, the AMPK signaling pathway—Homo sapiens (human), and digestion and absorption. Enzymes involved in hibifolin metabolism include glucuronosyltransferase, glycosidases, and glucuronidases.
This study suggests that the growth metabolism of Rhizopus arrhizus might convert and utilize flavonoid components, potentially generating new substances with enhanced antioxidant activity in vitro. This hypothesis aligns with findings from similar research conducted by other scholars. For example, a study on the biotransformation of filamentous fungi showed that Trichoderma harzianum NJ01 could convert puerarin to 3′-hydroxypuerarin under optimal conditions. Notably, 3′-hydroxypuerarin exhibited 20 times greater DPPH-radical-scavenging activity and 1.3 times higher solubility compared to puerarin [39]. Additionally, Yuri Lee et al. reported the conversion of flavonoid glycosides to flavonols (quercetin and kaempferol) in silkworm thorn leaves due to Lactobacillus fermentation, leading to a roughly 20% increase in radical-scavenging activity [40]. These findings provide valuable insights for optimizing RFF extraction and related research.

Supplementary Materials

The following supporting information can be downloaded at: https://www.mdpi.com/article/10.3390/molecules29051046/s1, Figure S1: Rutin standard curve determination of total flavonoid content.

Author Contributions

All authors contributed to the study conception and design. X.J., T.C. contributed to study design, material preparation, collection of data, and analyses, and wrote the original draft. Y.D., D.Y., J.Z., and X.W. contributed to data collection, interpretation of results, and preparation of the paper. J.L., R.Z., and contributed to review and editing of the manuscript and funding acquisition. Y.Z. provided experimental equipment and technical support. T.X. commented on previous versions. All authors have read and agreed to the published version of the manuscript.

Funding

This work was supported by the Zhejiang Provincial Natural Science Foundation of China (Grant No. LGN22C200009).

Institutional Review Board Statement

Not applicable.

Informed Consent Statement

Not applicable.

Data Availability Statement

The data presented in this study are available in article and supplementary materials.

Acknowledgments

We thank all the researchers and collaborators who participated in this study. We would like to acknowledge the College of Biological, Chemical Sciences and Engineering, Jiaxing University, Jiaxing for providing the necessary facilities for the research.

Conflicts of Interest

The authors declare no conflict of interest.

References

  1. Cui, Q.; Liu, J.Z.; Fu, Y.J. Chemical constituents from Hibiscus manihot. Chin. Tradit. Pat. Med. 2022, 44, 2187–2192. (In Chinese) [Google Scholar]
  2. Cui, Q.; Liu, J.Z.; Yu, L.; Gao, M.Z.; Wang, L.T.; Wang, W.; Zhao, X.H.; Fu, Y.J.; Jiang, J.C. Experimental and simulative studies on the implications of natural and green surfactant for extracting flavonoids. J. Clean. Prod. 2020, 274, 122652. [Google Scholar] [CrossRef]
  3. Wang, R.J.; Tian, Y.; Wu, J.W.; Wang, Y.F.; Jia, Z.H.; Bai, Z.Q.; Zhang, X.J. Analysis of medicinal components in the flower of Hibiseu manihot L. Nat. Prod. Res. Dev. 2022, 34, 588–597+721. [Google Scholar]
  4. Shi, H.; Li, J.; Yu, J.; Li, H.; Huang, G.; Zhang, T. Extraction, purification and antioxidant activity of polysaccharides from different parts of Hibiscus manihot L. J. Mol. Struct. 2024, 1295, 136598. [Google Scholar] [CrossRef]
  5. Liu, J.Z.; Zhang, C.C.; Fu, Y.J.; Cui, Q. Comparative analysis of phytochemical profile, antioxidant and anti-inflammatory activity from Hibiscus manihot L. flower. Arab. J. Chem. 2022, 15, 103503. [Google Scholar] [CrossRef]
  6. Xiao, M.; Zhang, T.; Cao, F.; Liang, W.; Yang, Y.; Huang, T.; Tang, Y.S.; Liu, B.; Zhao, X.; Shaw, P.C. Anti-influenza properties of tiliroside isolated from Hibiscus mutabilis L. J. Ethnopharmacol. 2023, 303, 115918. [Google Scholar] [CrossRef] [PubMed]
  7. Wang, Y.; Liu, X.J.; Chen, J.B.; Cao, J.P.; Li, X.; Sun, C.D. Citrus flavonoids and their antioxidant evaluation. Crit. Rev. Food Sci. Nutr. 2022, 62, 3833–3854. [Google Scholar] [CrossRef] [PubMed]
  8. Ai, G.; Liu, Q.; Hua, W.; Huang, Z.; Wang, D. Hepatoprotective evaluation of the total flavonoids extracted from flowers of Abelmoschus manihot (L.) Medic: In vitro and in vivo studies. J. Ethnopharmacol. 2013, 146, 794–802. [Google Scholar] [CrossRef]
  9. Zhang, X.; Liu, Z.; Li, S.; Wang, L.; Lv, J.; Li, J.; Ma, X.; Fan, L.; Qian, F. Identification and characterization of a cytotoxic polysaccharide from the flower of Abelmoschus manihot. Int. J. Biol. Macromol. 2016, 82, 284–290. [Google Scholar] [CrossRef]
  10. Liu, Y.; Jin, L.J.; Xu, Y.P.; Song, C.N.; Wang, X.Y. Optimization of the Mechanochemical Assisted Extraction of Total Flavonoids from Eleutherococcus senticosus. Lishizhen Med. Mater. Med. Res. 2007, 1, 2889–2891. [Google Scholar]
  11. Egbune, E.O.; Ezedom, T.; Orororo, O.C.; Egbune, O.U.; Avwioroko, O.J.; Aganbi, E.; Anigboro, A.A.; Tonukari, N.J. Solid-state fermentation of cassava (Manihot esculenta Crantz): A review. World J. Microbiol. Biotechnol. 2023, 39, 259. [Google Scholar] [CrossRef] [PubMed]
  12. García, I.L.; López, J.A.; Dorado, M.P.; Kopsahelis, N.; Alexandri, M.; Papanikolaou, S.; Villar, M.A.; Koutinas, A.A. Evaluation of by-products from the biodiesel industry as fermentation feedstock for poly(3-hydroxybutyrate-co-3-hydroxyvalerate) production by Cupriavidus necator. Bioresour. Technol. 2013, 130, 16–22. [Google Scholar] [CrossRef] [PubMed]
  13. Lomascolo, A.; Uzan-Boukhris, E.; Sigoillot, J.C.; Fine, F. Rapeseed and sunflower meal: A review on biotechnology status and challenges. Appl. Microbiol. Biotechnol. 2012, 95, 1105–1114. [Google Scholar] [CrossRef] [PubMed]
  14. Lee, S.; Reddy, C.K.; Ryu, J.J.; Kyung, S.; Lim, Y.; Park, M.S.; Kang, S.; Lee, C.H. Solid-State Fermentation With Aspergillus cristatus Enhances the Protopanaxadiol- and Protopanaxatriol-Associated Skin Anti-aging Activity of Panax notoginseng. Front. Microbiol. 2022, 14, 602135. [Google Scholar] [CrossRef]
  15. Juan, M.Y.; Chou, C.C. Enhancement of antioxidant activity, total phenolic and flavonoid content of black soybeans by solid state fermentation with Bacillus subtilis BCRC 14715. Food Microbiol. 2010, 27, 586–591. [Google Scholar] [CrossRef]
  16. Yin, Z.N.; Wu, W.J.; Sun, C.Z.; Lei, Z.G.; Chen, H.M.; Liu, H.F.; Chen, W.B.; Ma, J.J.; Min, T.; Zhang, M.M.; et al. Comparison of releasing bound phenolic acids from wheat bran by fermentation of three Aspergillus species. Int. J. Food Sci. Technol. 2018, 53, 1120–1130. [Google Scholar] [CrossRef]
  17. Liu, N.; Song, M.; Wang, N.F.; Wang, Y.; Wang, R.F.; An, X.P.; Qi, J.W. The effects of solid-state fermentation on the content, composition and in vitro antioxidant activity of flavonoids from dandelion. PLoS ONE 2020, 15, e0239076. [Google Scholar] [CrossRef]
  18. Corzo-León, D.E.; Uehling, J.K.; Ballou, E.R. Rhizopus arrhizus. Trends Microbiol. 2023, 31, 985–987. [Google Scholar] [CrossRef]
  19. Razak, A.L.D.; Rashid, A.Y.N.; Jamaluddin, A.; Sharifudin, A.S.; Kahar, A.A.; Long, K. Cosmeceutical potentials and bioactive compounds of rice bran fermented with single and mix culture of Aspergillus oryzae and Rhizopus oryzae. J. Saudi Soc. Agric. Sci. 2017, 16, 127–134. [Google Scholar]
  20. Zhang, Y.R.; Chang, C.X.; Liang, H.Q.; Yang, H.; Zhou, H.Z. Investigation on fermentation Conditions of a Rhizopus arrhizu producing fibrinolytic enzyme. Chin. J. Bioprocess. Eng. 2007, 5, 43–47. [Google Scholar]
  21. Long, K.; Zhao, Z.K.; Ma, Y.Y.; Yang, J.G. Progresses of Researches on Rhizopus for Liquor-makin. Mod. Food Sci. Technol. 2013, 29, 443–447. [Google Scholar]
  22. Liu, H.; Zhang, S.; Yu, N.; Dou, L.; Deng, L.; Wang, F.; Tan, T. Direct Utilization of Non-pretreated Hydrolytic Liquid of Dried Distiller’s Grains with Solubles for Bio-Ethanol by Rhizopus arrhizus RH 7-13-9#. Appl. Biochem. Biotechnol. 2018, 186, 590–596. [Google Scholar] [PubMed]
  23. Lei, Y.P.; Di, S.; Zhang, F.L.; Zhang, L. Study on Extraction of Flavonoids from Fruit of Rosa Davurica Pall by Different Methods and its Antioxidant Activity. In Proceedings of the 2018 International Conference on New Materials and Intelligent Manufacturing, Jilin City, China, 23–24 June 2018; pp. 428–431. [Google Scholar]
  24. Xu, J.; Cao, C.B.; Li, D.H.; Liu, Y.F.; Liang, Z.Y.; Yang, X.B. Study on the Optimization of Extraction Technology of Flavonoids in Clerodendrum inerme (L.) Gaertn. Roots. Adv. Mater. Res. 2012, 560–561, 349–354. [Google Scholar] [CrossRef]
  25. Chen, F.Z.; Wang, B.; Zhao, G.H.; Liang, X.P.; Liu, S.H.; Liu, J. Optimization extraction of flavonoids from peony pods by response surface methodology, antioxidant activity and bioaccessibility in vitro. J. Food Meas. Charact. 2023, 17, 460–471. [Google Scholar] [CrossRef]
  26. Huang, Q.P.; Huang, Q.C.; Zheng, Y.F.; Zen, Z.F.; Huang, L.B.; Wei, Y.H. Extraction and Antioxidant Activities of Total Flavonoids from Ficus Pumila Fruit. Chem. Reagents. 2021, 43, 1262–1267. [Google Scholar]
  27. Tham, M.W.; Liew, K.C. Influence of different extraction temperatures and methanol solvent percentages on the total phenols and total flavonoids from the heartwood and bark of Acacia auriculiformis. Eur. J. Wood Wood Prod. 2014, 72, 67–72. [Google Scholar] [CrossRef]
  28. You, J.; Song, F.F.; Wu, W.B. Optimization of fermentation technology of pine needle chestnut black rice wine by response surface method. Food Ferment. Ind. 2023, 50, 1–10. [Google Scholar]
  29. Marcelo, K.L.; Means, A.R.; York, B. The Ca(2+)/Calmodulin/CaMKK2 Axis: Nature’s Metabolic CaMshaft. Trends Endocrinol. Metab. 2016, 27, 706–718. [Google Scholar] [CrossRef] [PubMed]
  30. Steinberg, G.R.; Kemp, B.E. AMPK in Health and Disease. Physiol. Rev. 2009, 89, 1025–1078. [Google Scholar] [CrossRef]
  31. Adams, M.; Jia, Z. Structural and biochemical analysis reveal pirins to possess quercetinase activity. J. Biol. Chem. 2005, 280, 28675–28682. [Google Scholar] [CrossRef]
  32. Zha, J.; Wu, X.; Gong, G.; Koffas, M.A.G. Pathway enzyme engineering for flavonoid production in recombinant microbes. Metab. Eng. Commun. 2019, 9, e00104. [Google Scholar] [CrossRef] [PubMed]
  33. Robotham, S.A.; Brodbelt, J.S. Regioselectivity of human UDP-glucuronosyltransferase isozymes in flavonoid biotransformation by metal complexation and tandem mass spectrometry. Biochem. Pharmacol. 2011, 82, 1764–1770. [Google Scholar] [CrossRef] [PubMed]
  34. Park, S.; Shin, I. Profiling of glycosidase activities using coumarin-conjugated glycoside cocktails. Org. Lett. 2007, 9, 619–622. [Google Scholar] [CrossRef] [PubMed]
  35. Ayele, D.T.; Akele, M.L.; Melese, A.T. Analysis of total phenolic contents, flavonoids, antioxidant and antibacterial activities of Croton macrostachyus root extracts. BMC Chem. 2022, 16, 30. [Google Scholar] [CrossRef] [PubMed]
  36. Zhang, W.T.; Duan, W.; Huang, G.L.; Huang, H.L. Ultrasonic-assisted extraction, analysis and properties of mung bean peel polysaccharide. Ultrason. Sonochem. 2023, 98, 106487. [Google Scholar] [CrossRef]
  37. Tao, A.L.; Feng, X.H.; Sheng, Y.J.; Song, Z.R. Optimization of the Artemisia Polysaccharide Fermentation Process by Aspergillus niger. Front. Nutr. 2022, 9, 842766. [Google Scholar] [CrossRef]
  38. Raza, A.; Li, F.; Xu, X.Q.; Tang, J. Optimization of ultrasonic-assisted extraction of antioxidant polysaccharides from the stem of Trapa quadrispinosa using response surface methodology. Int. J. Biol. Macromol. 2017, 94, 335–344. [Google Scholar] [CrossRef]
  39. Ye, H.; Yuan, S.; Cong, X.D. Biotransformation of puerarin into 3’-hydroxypuerarin by Trichoderma harzianum NJ01. Enzyme Microb. Technol. 2007, 40, 594–597. [Google Scholar] [CrossRef]
  40. Lee, Y.; Oh, J.; Jeong, Y.S. Lactobacillus plantarum-mediated onversion of flavonoid glycosides into flavonols, quercetin, and kaempferol in Cudrania tricuspidata leaves. Food Sci. Biotechnol. 2015, 24, 1817–1821. [Google Scholar] [CrossRef]
Figure 1. Scanning electron microscope images of HML before and after fermentation. (A,a) are HML before fermentation, (B,b) are HML after fermentation; (A,B) magnification is 1000, (a,b) magnification is 5000.
Molecules 29 01046 g001
Figure 2. Effects of extraction factors on the total flavonoid extraction yield of RUF and RFF in single-factor experiments. (A) Effects of material–liquid ratio; (B) Effects of extraction time; (C) Effects of ethanol concentration; (D) Effects of extraction temperature. Values are expressed as means ± SD (n = 3). Different lowercase letters indicate significant differences between RUF and RFF under different extraction conditions (p < 0.05); Different uppercase letters indicate significant differences between RUF and RFF under the same extraction conditions (p < 0.05).
Molecules 29 01046 g002
Figure 3. The 3D response surface plots showing the effect of different interactions of factors on total flavonoid extraction yield of RFF, respectively. (A) Solid/liquid and extraction time; (B) solid/liquid and ethanol concentration; (C) solid/liquid and extraction temperature; (D) extraction time and ethanol concentration; (E) extraction time and extraction temperature; (F) ethanol concentration and extraction temperature.
Molecules 29 01046 g003
Figure 4. Effects of RFF on radical-scavenging efficiency in vitro antioxidant experiments. (A) Effects on ABTS radicals; (B) effects on hydroxyl radicals; (C) effects on DPPH radicals; (D) effects of reducing power on iron ions. Values are expressed as means ± SD (n = 3).
Molecules 29 01046 g004
Figure 5. Total ion chromatograms of HML extracts by UPLC-QTOF-MS. (A) RUF negative ion mode. (B) RUF positive ion mode. (C) RFF negative ion mode. (D) RFF positive ion mode.
Molecules 29 01046 g005
Figure 6. Chemical structures of eight target flavonoids. 1. Quercetin; 2. Cannabiscitrin; 3. Isoquercetin; 4. Hyperoside; 5. Myricetin; 6. Quercetin 3′-O-β-d-glucoside; 7. Rutin; 8. Hibifolin.
Molecules 29 01046 g006
Table 1. Experimental design and results of response surface analysis for the RFF extraction process.
RunA
Material–Liquid Ratio
(g/mL)
B
Extraction
Time
(h)
C
Ethanol
Concentration
(%)
D
Extraction Temperature
(°C)
Y
Total Flavonoid Extraction Yield (%)
1−1−1002.99
21−1003.11
3−11003.07
411003.34
500−1−13.10
6001−12.66
700−113.15
800112.52
9−100−13.08
10100−13.26
11−10013.17
1210013.25
130−1−103.11
1401−103.22
150−1102.52
1601102.59
17−10−102.85
1810−103.21
19−10102.60
2010102.56
210−10−13.27
22010−13.20
230−1012.93
2401013.29
2500003.80
2600003.51
2700003.61
2800003.69
2900003.68
Table 2. ANOVA for the response surface model.
SourceSum of
Squares
dfMean
Square
F-Valuep-Value
Prop > F
Salience
Model3.04140.217148.64<0.0001**
A0.078410.078417.560.0011**
B0.050710.050711.360.0050**
C0.84810.8480189.96<0.0001**
D5.6 × 10−315.6 × 10−31.260.2816
AB5.6 × 10−315.6 × 10−31.260.2819
AC0.0410.048.960.0104*
AD2.5 × 10−312.5 × 10−30.560.4676
BC4 × 10−414 × 10−40.08960.7694
BD0.046210.046210.350.0067**
CD9 × 10−319 × 10−32.020.1786
A20.381310.381385.41<0.0001**
B20.326710.326773.18<0.0001**
C21.8311.83409.66<0.0001**
D20.248110.248155.57<0.0001**
Residual0.0580134.5 × 10−3
Lack of fit0.0374103.7 × 10−30.54210.7972
Pure error0.020736.9 × 10−4
Cor total3.1027
R20.9813
Adj-R20.9611
Note: “**” is p < 0.01, indicating that the effect is highly significant, and “*” is p < 0.05, indicating that the effect is significant.
Table 3. Identified chemical constituents from RUF by UPLC-QTOF-MS in positive and negative ion mode.
No.RT/minPrecursor IonMeas.m/zm/zError/ppmFormulaFragmentsIdentificationResponse
10.667[M−H]266.0891266.08871.5C10H13N5O4217, 215, 179, 101Adenosine4336
21.232[M−H]610.1539610.15242.5C27H31O16471, 470, 443, 308, 279, 133, 128Enocyanin124
31.769[M−H]492.136492.13541.2C23H28Cl-N3O5S424, 358, 334, 213Glyburide239
43.553[M−H]153.0187153.01860.7C7H6O4Protocatechuic acid8653
53.692[M−H]369.0821369.08161.4C16H18O10247, 232, 216, 201, 191Fraxin893
63.718[M−H]677.1536677.14975.8C34H30O15611, 477, 305, 189, 146, 1443,4,5-Tricaffeoylquinic acid211
73.740[M−H]299.0765299.07524.3C13H16O8196, 146, 93Salicylic acid-β-d-glucoside36,072
83.795[M−H]479.0794479.0819−5.2C21H20O13447, 425, 333, 300, 175Myricetin-3-O-β-d-glucoside1,029,648
93.796[M−H]595.1263595.129−4.5C26H28O16495, 479, 447, 425, 333, 300, 271Quercetin-3-arabinoside-7-glucoside273,676
103.824[M−H]353.0856353.0867−3.1C16H18O9333, 316, 271, 191, 175Chlorogenic acid7520
113.876[M−H]325.0911325.0918−2.2C15H18O8318, 305, 181, 146, 1354-O-β-d-glucosy-l-4-coumarate6416
123.932[M−H]623.1583623.1602−3.0C28H32O16595, 480, 479, 463, 461, 301, 300Isorhamnetin-3-O-neohespeidoside3704
133.982[M−H]495.0743495.0768−5.0C21H20O14387, 334, 333, 316, 305, 179, 137Hibiscetin-3-O-glucoside195,097
143.987[M−H]741.1829741.1866−5.0C32H38O20611, 495, 387, 333, 300Quercetin-3-glucosyl-(1->4)-xylosyl-(1->4)-Rhamnoside13,845
153.993[M−H]137.0242137.02373.6C7H6O3Salicylic acid1120
164.026[M−H]479.0792479.0819−5.6C21H20O13447, 417, 223, 179, 61Cannabiscitrin759,151
174.067[M−H]625.1361625.1395−5.4C27H30O17521, 480, 479, 463, 337, 300, 271Myricetin-3-neohesperidoside197,243
184.080[M−H]289.0679289.0708−10.0C15H14O6271, 255, 210, 151Cianidanol855
194.101[M−H]609.1406609.1446−6.6C27H30O16542, 480, 479, 463, 385, 300, 210Rutin614,274
4.336[M+H]+611.1582611.1602−3.3C27H30O16531, 450, 447, 445, 439, 229Rutin959
204.120[M−H]179.0348179.03423.4C9H8O4167Caffeic acid181
214.233[M−H]463.0839463.087−6.7C21H20O12381, 273, 315, 151Hyperoside2,443,396
224.503[M−H]463.0839463.087−6.7C21H20O12461, 455, 301, 151Isoquercetin1,713,071
234.662[M−H]163.0391163.0393−1.2C9H8O3139Trans-p-coumaric acid1168
244.679[M−H]165.0546165.0549−1.8C9H10O3139Ethylparaben1965
254.854[M−H]447.0907447.0921−3.1C21H20O11326, 318, 317, 195, 139Astragalin1953
264.893[M−H]477.0999477.1026−5.7C22H22O12445, 429, 300, 271, 243, 242, 231Isorhamnetin-3-glucoside6568
274.928[M−H]447.0913447.0921−1.8C21H20O11301, 178, 151Isoorientin303
285.114[M−H]493.0577493.0614−7.5C21H18O14385, 339, 318, 243, 139Hibifolin3,417,545
295.171[M−H]463.0845463.087−5.4C21H20O12461, 439, 319, 301, 243, 165Quercetin 3′-O-β-d-glucoside1,144,905
305.248[M−H]447.0919447.0921−0.4C21H20O11385, 339, 323, 319, 300, 271, 137Quercitrin118
315.307[M−H]187.0962187.0966−2.1C9H16O4Nonanedioic acid985
325.396[M−H]505.0951505.0975−4.8C23H22O13445, 339, 317, 316, 315, 146, 137Quercetin-3-O-(6″-acetyl-glucoside)60,696
335.468[M−H]317.0271317.0294−7.3C15H10O8315, 178, 151, 109Myricetin1,193,716
345.672[M−H]505.0934505.0975−8.1C23H22O13445, 323, 301, 300, 202, 121Quercetin-3-(2″-acetyl-galactoside)52,592
356.028[M−H]489.105489.10264.9C23H22O12409, 3073-O-beta-d-Glucuronoside,etester-3,4′,5,7-tetrahydroxyflavone68
366.382[M−H]465.1732465.1752−4.3C23H30O10303, 259, 215Ilexin II1658
376.451[M−H]201.1123201.11220.5C10H18O4179Sebacic acid68
386.846[M−H]593.1281593.1287−1.0C30H26O13545, 401, 313, 285, 129Tribuloside219
396.949[M−H]301.0324301.0345−7.0C15H10O7249, 179, 151Quercetin1,500,688
407.794[M−H]395.2022395.2061−9.9C21H32O7327, 215Furonewguinone B792
418.101[M−H]269.0493269.044717.1C15H10O5Genistein38
428.435[M−H]285.0388285.0396−2.8C15H10O6Kaempferol2541
438.565[M−H]315.049315.0501−3.5C16H12O7300, 151Isorhamnetin6714
448.751[M−H]289.1433289.1434−0.3C17H22O4171, 1306-Isobutyryl-5,7-dimethoxy-2,2-dimethyl benzopyran378
458.831[M−H]491.118491.1182−0.4C23H24O12401, 357, 313, 121Yixingensin357
469.363[M−H]287.0933287.09156.3C16H16O5Alkannin112
4712.557[M−H]593.1258593.1287−4.9C30H26O13474, 397, 277, 239, 129, 112Kaempferol-3-glucoside-2″-p-coumaroyl5171
4813.537[M−H]255.2316255.23160.0C16H32O2145Palmitic acid1147
4913.880[M−H]361.1978361.2007−8.0C21H30O5293, 255, 130Enaimeone B1448
5014.022[M−H]277.144277.14342.2C16H22O4255, 179Diisobutyl phthalate539
5114.713[M−H]297.1505297.14856.7C19H22O3255, 183, 149Aurapten7267
5214.798[M−H]225.2195225.2211−7.1C15H30O1012-Pentadecanone61
5315.103[M−H]279.2301279.2316−5.4C18H32O2208, 150, 1009,12-Octadecadienoic acid4641
5416.199[M−H]389.2709389.26826.9C24H38O4313, 267Diisooctyl phthalate27
553.961[M+H]+525.229525.2325−6.7C26H36O11520, 213Neocaesalpin L229
564.370[M+H]+582.1758582.1813−9.4C26H28O14428, 425, 423, 417, 2293,4,5-Trihydroxy-6-[7-hydroxy-2-(3-hydroxy-4-methoxyphenyl)-6,8-dimethoxy-4-oxochromen-5-yl]oxyoxan-2-yl]methylacetate119
574.609[M+H]+563.236563.23482.1C27H34N5O7495, 494, 492, 489, 483, 4811-[2-(2-acetylammonium)-3-phenyl propionyl-pyrrolidine-2-carboxylic acid22
584.668[M+H]+505.2594505.2637−8.5C24H40O11479, 477, 470, 271, 163leeaoside323
598.178[M+H]+277.2848277.2862−5.0C18H38266, 261, 244, 213n-Octadecane207
6012.800[M+H]+522.114522.1183−8.2C30H16O8460, 454, 453, 437, 415, 299, 119Hypericin172
6112.801[M+H]+415.2805415.2838−7.9C26H38O4303, 299, 247, 135, 119Hyperpapuanone20,517
6215.393[M+H]+457.3708457.36698.5C30H48O3413, 371, 369, 355Ursolic acid1389
6316.636[M+H]+311.0865311.0891−8.4C16H16O5170, 140(2S)-5,3′4′-trihydroxy-7-methoxyflavane211
Note: ”—” means no Fragments.
Table 4. Identified chemical constituents from RFF by UPLC-QTOF-MS in positive and negative ion mode.
NO.RT/minPrecursor IonMeas.m/zm/zError/ppmFormulaFragmentsIdentificationResponse
10.614[M−H]289.0685289.0708−8.0C15H14O6191, 133, 128Cianidanol583
20.658[M−H]503.1603503.16020.2C18H32O16379, 377, 321, 215, 195, 161, 133Gentianose506
13.215[M+H]+522.2048522.20480.0C18H32O16 500, 478, 457, 384, 313, 188, 122Gentianose418
30.668[M−H]266.0871266.0887−6.0C10H13N5O4164, 150Adenosine6287
41.493[M−H]285.0588285.0606−6.3C12H14O8195Uralenneoside110
52.697[M−H]303.0843303.0864−6.9C16H16O6253, 249, 232, 164, 147, 943-Methoxypyrocatechol152
63.548[M−H]153.0178153.0186−5.2C7H6O4Protocatechuic acid62,326
73.549[M−H]109.0290109.02881.8C6H6O2Hydroquinone997
83.686[M−H]369.0851369.08169.5C16H18O10316, 291, 287, 203, 153Fraxin43
93.795[M−H]479.0791479.0819−5.8C21H20O13463, 339, 301, 271, 269, 190Myricetin-3-O-β-d-glucoside214,470
103.797[M−H]595.1255595.1290−5.9C26H28O16463, 439, 301, 255, 243Quercetin-3-arabinoside-7-glucoside308,061
16.912[M+H]+597.1513597.1556−7.2C26H28O16539, 496, 393, 355, 323, 263Quercetin-3-arabinoside-7-glucoside849
113.821[M−H]353.0850353.0867−4.8C16H18O9290, 200, 128, 161Chlorogenic acid6601
123.931[M−H]623.1574623.1602−4.5C28H32O16595, 479, 314, 281, 271, 255Isorhamnetin-3-O-neohespeidoside9866
133.932[M−H]179.0346179.03422.2C9H8O4147Caffeic acid2735
143.982[M−H]495.0747495.0768−4.2C21H20O14464, 463, 333, 303, 179Hibiscetin-3-O-glucoside10,639
153.984[M−H]741.1816741.1866−6.7C32H38O20612, 611, 495, 461, 323, 316, 300, 287, 151, 137Quercetin-3-glucosyl-(1->4)-xylosyl-(1->4)-rhamnoside15,593
163.988[M−H]137.0233137.0237−2.9C7H6O3124Salicylic acid5443
174.026[M−H]479.0780479.0819−8.1C21H20O13477, 318, 316, 291, 287, 179, 201Cannabiscitrin354,843
184.110[M−H]609.1393609.1446−8.7C27H30O16441, 300, 255, 243, 151Rutin1,226,910
5.367[M+H]+628.1877628.18671.6C27H30O16 551, 487, 481, 367, 352, 319, 254Rutin763
194.231[M−H]463.0832463.0870−8.2C21H20O12461, 303, 179Hyperoside776,080
204.307[M−H]625.1360625.1395−5.6C27H30O17565, 521, 477, 466, 319, 316, 303Myricetin-3-neohesperidoside153,458
12.994[M+H]+649.1419649.13717.4C27H30O17640, 556, 494, 337, 188, 184, 104Myricetin-3-neohesperidoside1343
214.498[M−H]463.0828463.0870−9.1C21H20O12455, 301, 151Isoquercetin2,318,366
1.090[M+H]+482.1275482.12750.0C21H20O12423, 330, 314, 296, 274, 203, 130Isoquercetin523
224.561[M−H]593.1506593.14971.5C27H30O15493, 479, 318, 317, 139Aempferol-3-O-rutinoside179
234.673[M−H]165.0541165.0549−4.8C9H10O3139Ethylparaben7244
244.691[M−H]167.0345167.03421.8C8H8O4165Vanillic acid846
254.888[M−H]477.0996477.1026−6.3C22H22O12345, 323, 300, 271, 245, 243, 164, 231, 169Isorhamnetin-3-glucoside4277
264.931[M−H]447.0938447.09213.8C21H20O11315, 301, 240, 151Isoorientin271
275.114[M−H]493.0565493.0614−9.9C21H18O14343, 243, 380, 339, 193Hibifolin5,596,770
1.624[M+H]+517.0566517.0588−4.3C21H18O14 365, 266, 210, 203, 140, 136Hibifolin89
285.175[M−H]463.0826463.0870−9.5C21H20O12323, 301, 178, 151Quercetin 3′-O-β-d-glucoside530,689
295.242[M−H]447.0896447.0921−5.6C21H20O11407, 385, 317, 285, 249, 150, 137Quercitrin64
305.307[M−H]187.0962187.0966−2.1C9H16O4179, 151Nonanedioicacid1519
315.396[M−H]505.0950505.0975−4.9C23H22O13406, 300, 137, 61Quercetin-3-O-(6″-acetyl-glucoside)34,203
1.689[M+H]+524.1377524.1396−3.6C23H22O13258, 176, 182, 165, 144, 91Quercetin-3-O-(6″-acetyl-glucoside)1155
325.462[M−H]317.0267317.0294−8.5C15H10O8300, 178, 62Myricetin1,338,137
335.665[M−H]505.0934505.0975−8.1C23H22O13445, 377, 301, 300, 121Quercetin-3-(2″-acetyl-galactoside)24,390
346.141[M−H]201.1136201.11227.0C10H18O4Sebacic acid202
356.763[M−H]287.0561287.05523.1C15H12O6137Steppogenin610
366.838[M−H]593.1276593.1287−1.9C30H26O13549, 505, 493, 319, 245, 167Tribuloside181
376.947[M−H]301.0320301.0345−8.3C15H10O7253, 271, 179, 151Quercetin4,286,867
388.424[M−H]285.0382285.0396−4.9C15H10O6255, 145Kaempferol11,321
398.555[M−H]315.0485315.0501−5.1C16H12O7300, 239, 151Isorhamnetin9328
408.738[M−H]289.1431289.1434−1.0C17H22O46-iso butyryl-5, 7-dimethoxy-2, 2-dimethyl-benzopyran1277
418.823[M−H]491.1168491.1182−2.9C23H24O12401, 393, 357, 313, 121Yixingensin319
4212.047[M−H]431.0931431.0972−9.5C21H20O10363, 295, 195Vitexin46
4312.555[M-H]593.1276593.1287−1.9C30H26O13474, 397, 386, 277, 196, 113Kaempferol-3-glucoside-2″-p-coumaroyl1854
4413.040[M−H]439.3537439.3564−6.1C30H48O2367, 313, 266, 149Roburic acid175
12.897[M+H]+458.4014458.39856.3C30H48O2444, 424, 390, 337, 335, 132, 124Roburic acid473
4513.529[M−H]255.2336255.23167.8C16H32O2Palmitic acid188
4613.883[M−H]361.1972361.2007−9.7C21H30O5327, 293Enaimeone B5252
4714.160[M−H]283.2634283.26282.1C18H36O2145, 125, 117Ethyl palmitate76
2.738[M+H]+285.2761285.2784−8.1C18H36O2153, 136Ethyl palmitate853
4814.405[M−H]345.2632345.26310.3C19H38O5342, 299, 267, 1501, 1, 3, 3-tetrabutoxy-2-propanone237
4914.716[M−H]297.1509297.14858.1C19H22O3265, 150, 100Aurapten2788
5014.795[M−H]225.2222225.22114.9C15H30O1832-Pentadecanone105
5114.795[M−H]371.1506371.14884.8C21H24O6273, 271, 265, 225, 183(-)-Arctigenin1025
3.613[M+H]+395.1451395.1464−3.3C21H24O6391, 367, 305, 300, 229, 192, 156(-)-Arctigenin233
5215.101[M−H]279.2299279.2316−6.1C18H32O2255, 1179, 12-O-ctadecadienoic acid5429
6.965[M+H]+303.2272303.2292−6.6C18H32O2233, 1539, 12-O-ctadecadienoic-acid147,858
5315.201[M−H]455.3493455.3513−4.4C30H48O3385, 265, 183, 150, 121Ursolic acid1416
15.397[M+H]+457.3698457.36696.3C30H48O3413, 369, 347, 270, 130Ursolic acid2232
5416.511[M−H]603.3875603.3882−1.2C35H56O8381, 356, 355, 309, 307, 119Ziyuglycoside II219
550.951[M+H]+397.2181397.2217−9.1C21H32O7383, 266, 248, 203, 191Furonewguinone B2102
560.983[M+H]+489.1688489.1728−8.2C23H30O10381, 365, 360, 203Ilexin II974
571.109[M+H]+522.1223522.11837.7C30H16O8423, 330, 314, 296, 274, 256Hypericin804
582.459[M+H]+263.2720263.27065.3C17H36120n-Heptadecane156
592.871[M+H]+345.2080345.20586.4C21H28O4328, 323, 298, 166, 146, 132, 120Ialibinone B4759
603.507[M+H]+311.3695311.36669.3C22H46298, 280Docosane5309
614.405[M+H]+960.5183960.51463.9C47H74O19814, 792, 487, 397, 319, 277, 114Deslanoside5645
624.623[M+H]+255.3029255.3042−5.1C18H38152, 120n-Octadecane2184
634.856[M+H]+341.3401341.3408−2.1C22H44O2287, 262Docosanoic acid68
645.814[M+H]+612.1946612.19184.6C27H30O15600, 580, 581, 579, 277, 233Glucosylvitexin2889
656.252[M+H]+554.4688554.4711−4.1C40H56473, 471, 303, 287, 247beta-Carotene79
666.285[M+H]+297.3528297.35106.1C21H44262, 222Heneicosane307
677.825[M+H]+687.6081687.60366.5C46H80O2Alpha-Amyrin palmitate666
688.324[M+H]+391.2804391.2838−8.7C24H38O4375, 354, 353, 348, 195Diisooctyl phthalate382
698.701[M+H]+612.1686612.16801.0C27H31O16610, 496, 351, 325, 249, 147Enocyanin388
709.048[M+H]+394.2550394.2584−8.6C22H32O5334, 277Enaimeone C242
719.101[M+H]+553.3833553.3879−8.3C35H52O5427, 351, 311Furohyperforin695
7211.743[M+H]+430.4040430.40360.9C29H48O421, 411, 378, 310, 307α-Spinasterol811
7312.904[M+H]+657.3733657.3753−3.0C39H54O7561, 554, 553, 303, 1963-O-trans-p-coumaroyltormentic acid292
7412.909[M+H]+651.4093651.40920.2C36H58O10599, 588, 453, 344, 335, 200, 124Pedunculoside254
7513.263[M+H]+547.2141547.2145−0.7C26H36O11543, 542, 520, 483, 313, 184Neocaesalpin L2487
7613.312[M+H]+625.1723625.1758−5.6C28H32O16616, 532, 437, 393, 372, 366, 307Narcissoside9633
7713.332[M+H]+339.3947339.3978−9.1C24H50299, 188Tetracosane4602
7813.469[M+H]+541.2522541.2528−1.1C27H34N5O7463, 391, 358, 339, 342, 283, 2771-[2-(2-acetyl ammonium)-3-phenylpropionate-pyrrolidine-2-carboxylic acid6476
7913.602[M+H]+661.1721661.1734−2.0C29H34O16569, 310, 309, 284, 133, 89Quercetin-3, 3′-dimethyl ether-7-rutinoside16,922
8013.729[M+H]+557.3544557.3594−9.0C35H50O4544, 522, 485, 480, 339, 184, 104Pyrano-[7, 28-b]-hyperforin386
8113.824[M+H]+757.2179757.21780.1C33H40O20699, 684, 640, 597, 330, 305, 118Kaempferol-3-sophoroside-7-rhamnoside361
8214.208[M+H]+527.2478527.24574.0C24H40O11395, 297, 279, 278leeaoside450,363
8314.327[M+H]+696.6235696.6274−5.6C46H78O3541, 349, 344, 22611α, 12α-Oxidotaraxerol palMitate767
8415.501[M+H]+701.1445701.1497−7.4C36H28O15690, 589, 567, 545, 501, 283Theaflavin gallate381
8515.513[M+H]+679.1591679.1653−9.1C34H30O15668, 593, 567, 545, 523, 457, 4133, 4, 5-Tricaffeoylquinic acid1207
8616.462[M+H]+575.3692575.3699−1.2C35H52O5559, 437, 2278-Hydroxyhyperforin-8, 1-hemiacetal437
8716.644[M+H]+594.4730594.47172.2C35H60O6546, 487, 145Daucosterol372
Note: ”—” means no Fragments.
Table 5. Factors and levels of response surface analysis test for the total flavonoid extraction process of fermented HML.
FactorsCoded
Symbols
Levels
−101
Material–liquid ratio (g/mL)A1:351:401:45
Extraction time (h)B1.522.5
Ethanol concentration (%)C506070
Extraction temperature (°C)D708090
Disclaimer/Publisher’s Note: The statements, opinions and data contained in all publications are solely those of the individual author(s) and contributor(s) and not of MDPI and/or the editor(s). MDPI and/or the editor(s) disclaim responsibility for any injury to people or property resulting from any ideas, methods, instructions or products referred to in the content.

