

Design, Synthesis, and Biological Evaluation of Novel Phenoxy Acetic Acid Derivatives as Selective COX-2 Inhibitors Coupled with Comprehensive Bio-Pharmacological Inquiry, Histopathological Profiling, and Toxicological Scrutiny

Abstract
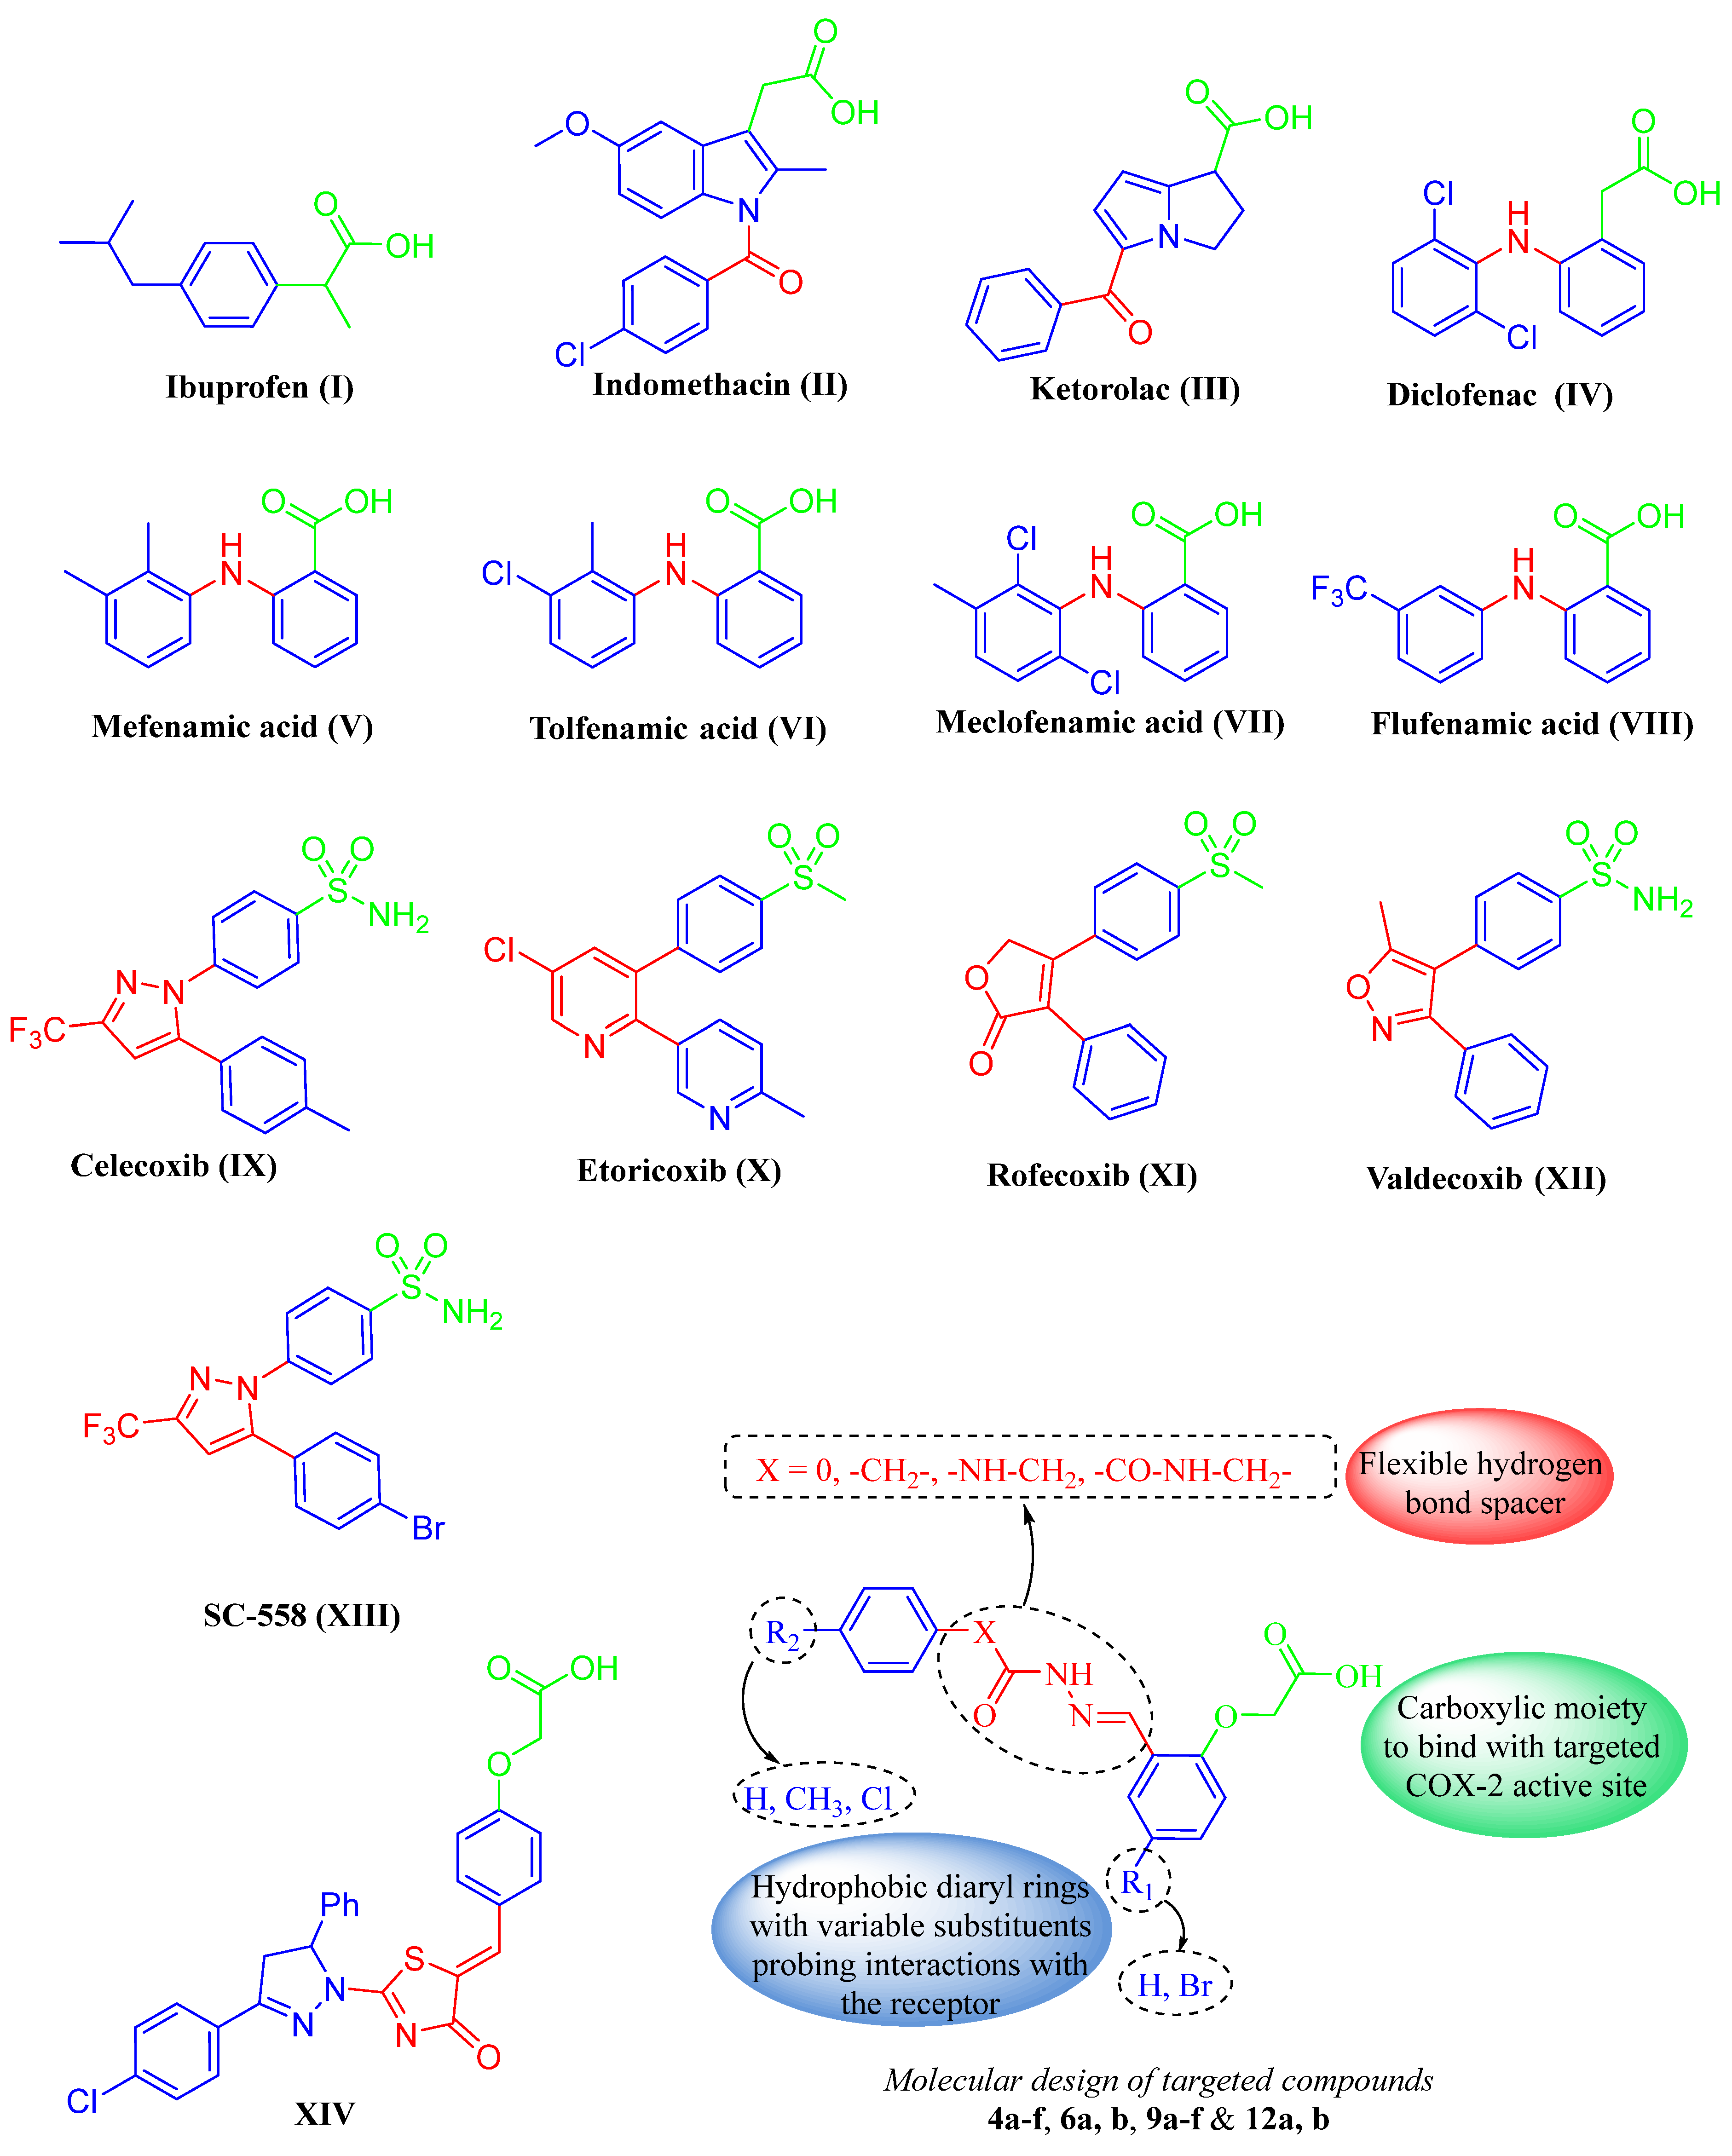
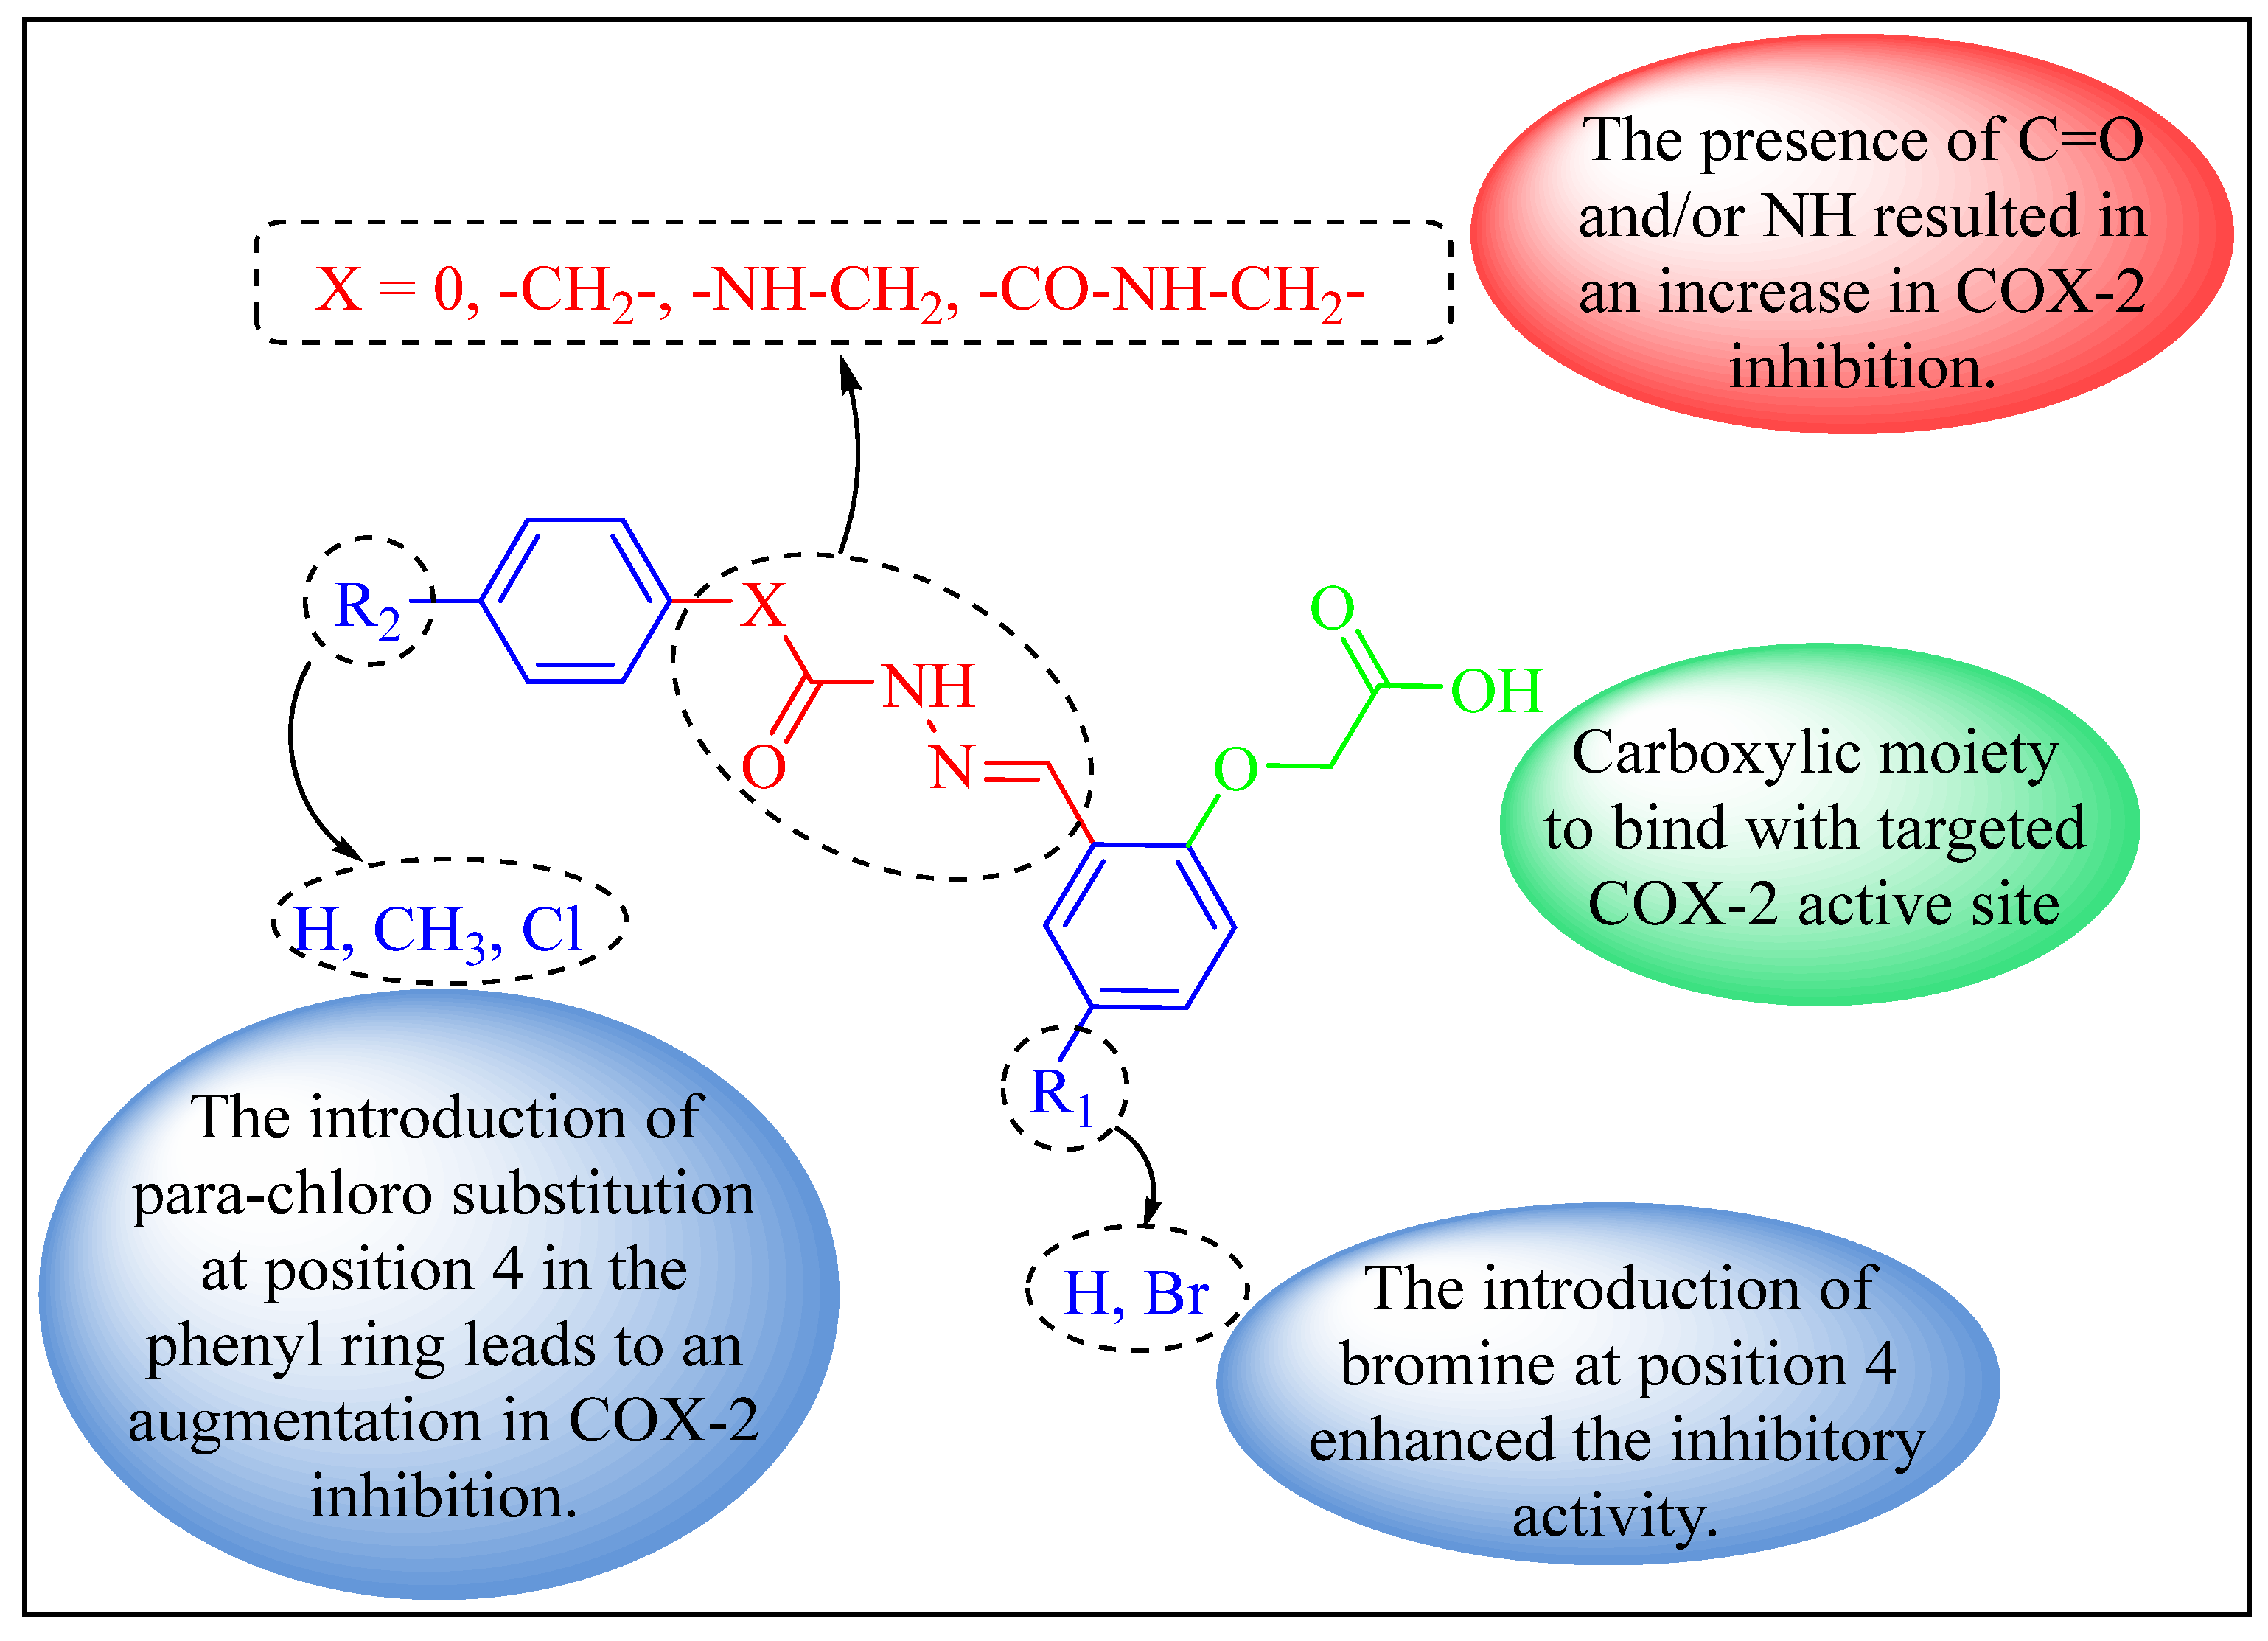
:1. Introduction
2. Results and Discussion
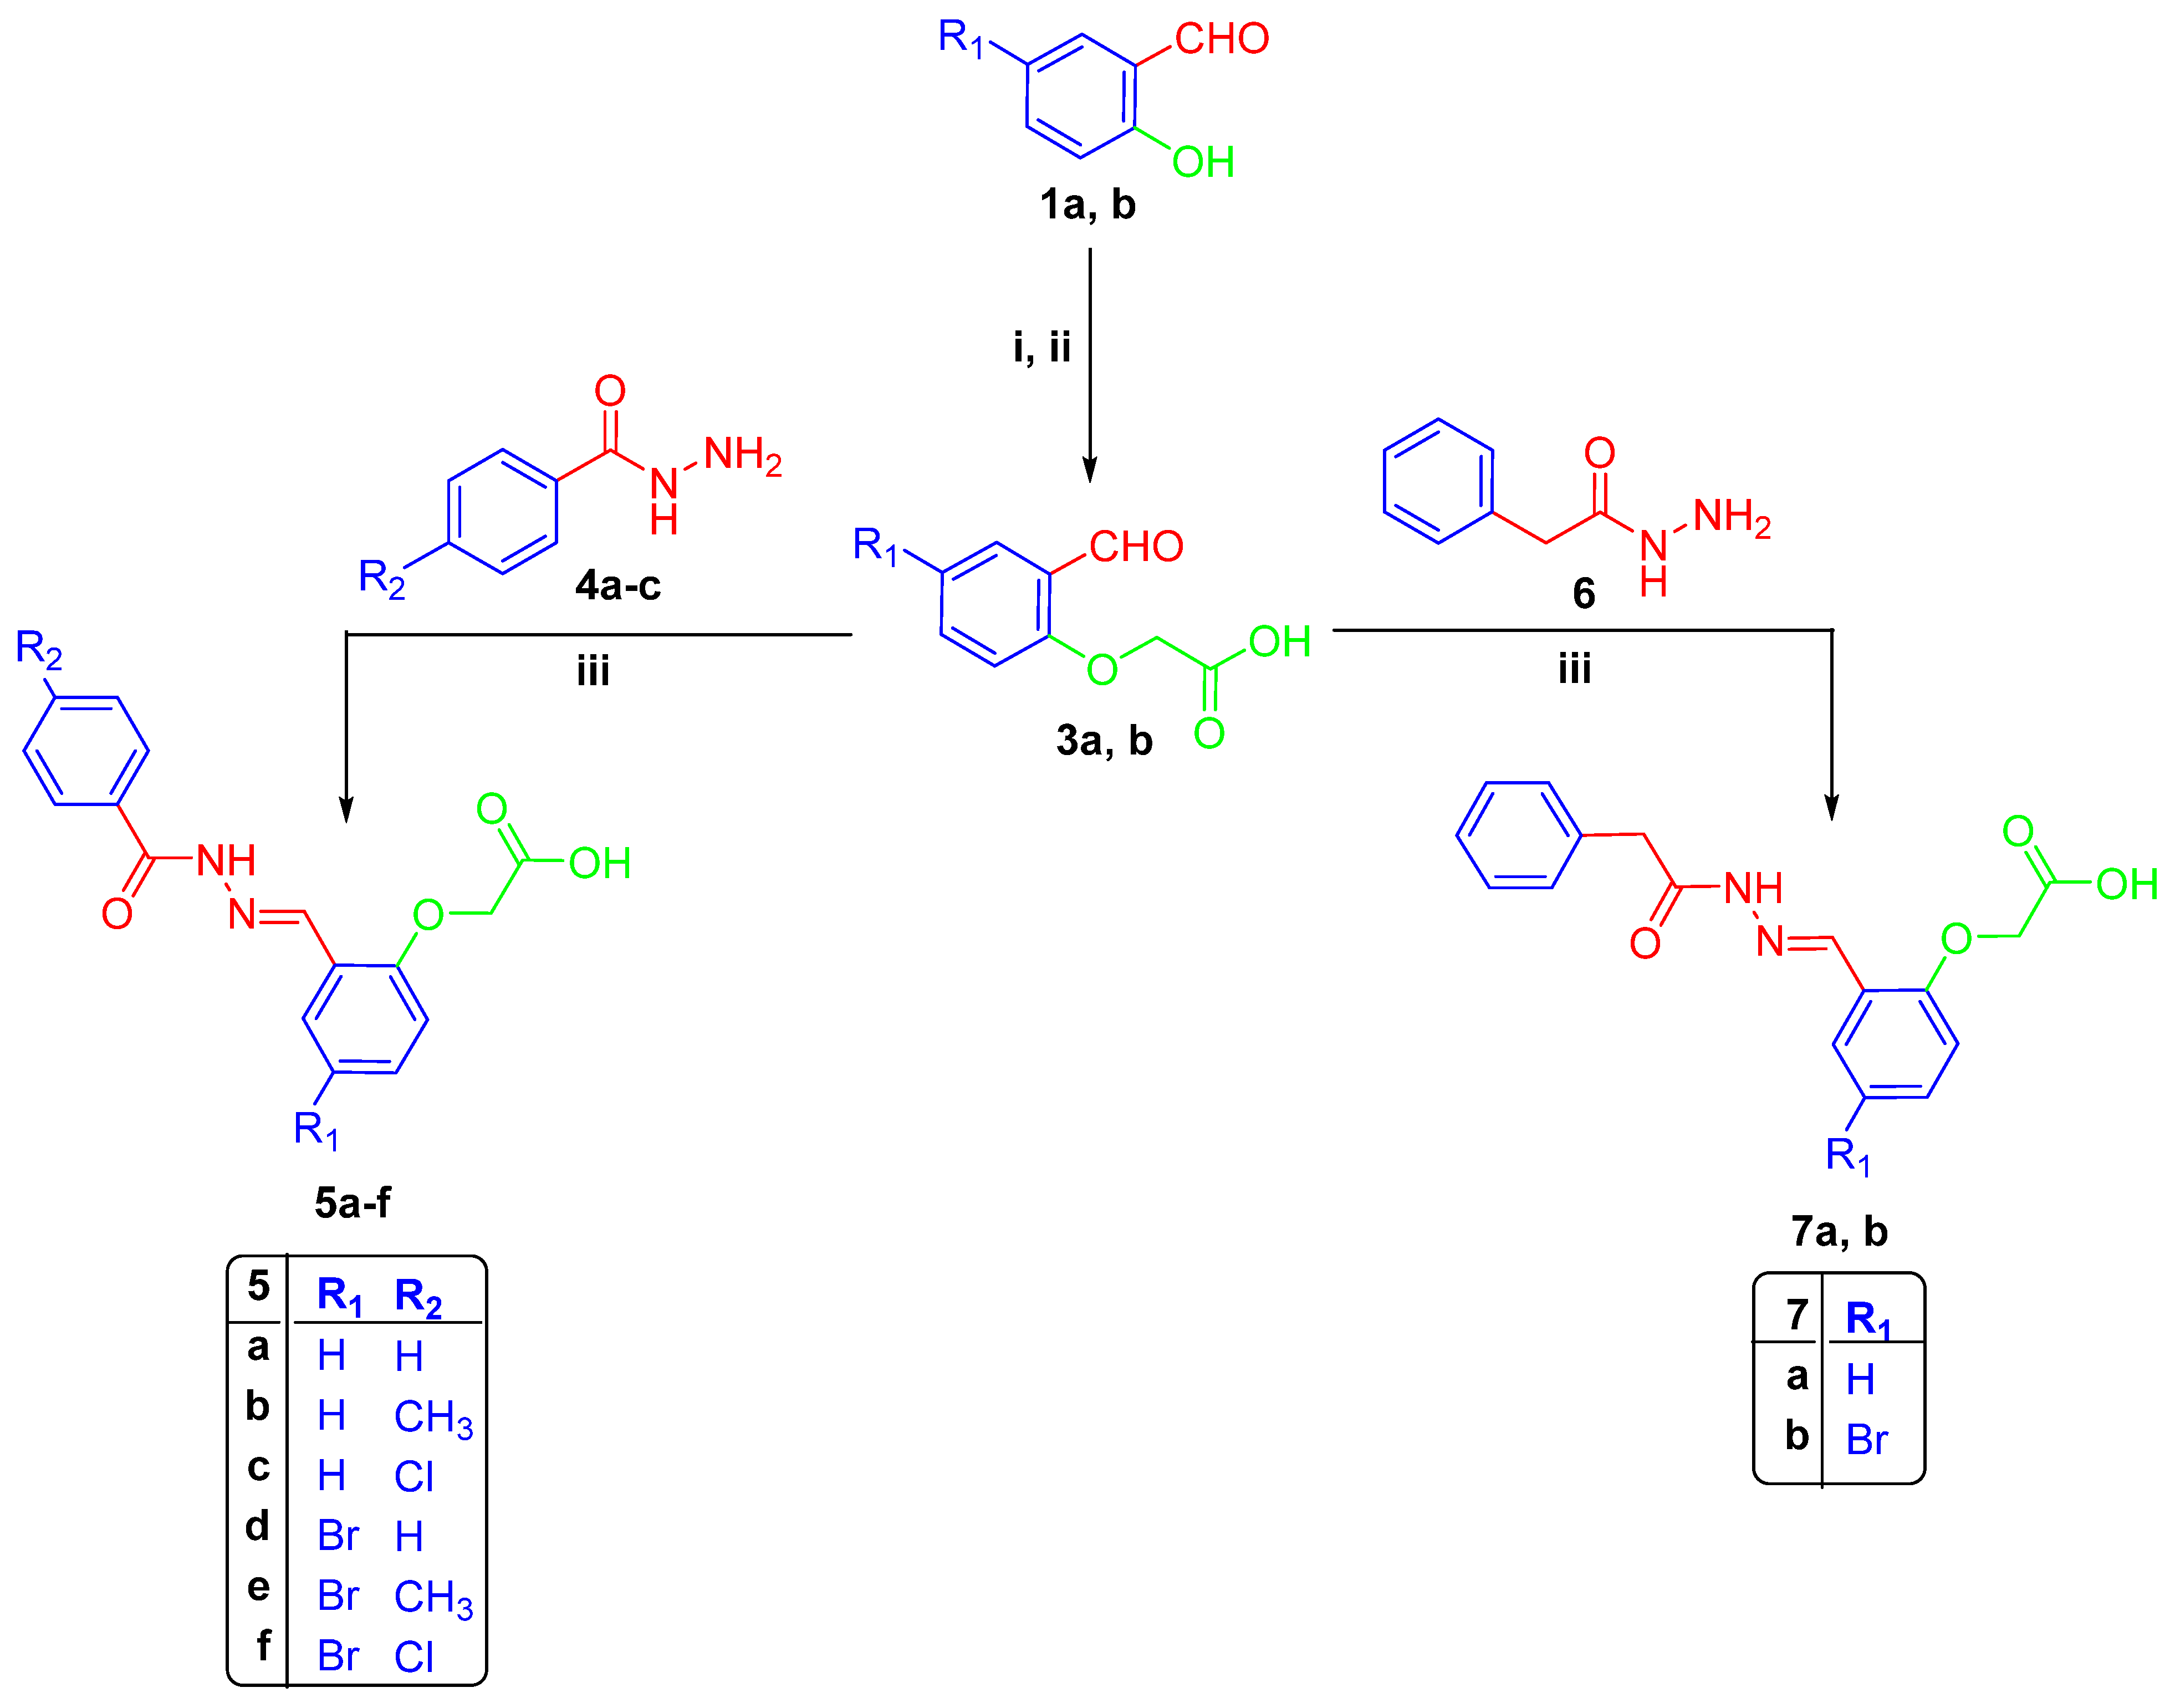
2.1. Chemistry
2.2. Biological Study
2.2.1. In Vitro COX-1 and COX-2 Inhibition Assays
2.2.2. Drug-Likeness and ADME Prediction
2.2.3. In Vivo Anti-Inflammatory Activity
2.2.4. Assessment of Inflammatory Biomarkers
2.2.5. Analgesic Activity
2.2.6. Histopathological Examination
2.2.7. Toxicity Assessment
Assessment of Liver and Kidney Function
Evaluation of Ulcerogenic Effects
2.3. Molecular Docking Study
2.3.1. Docking Validation Method
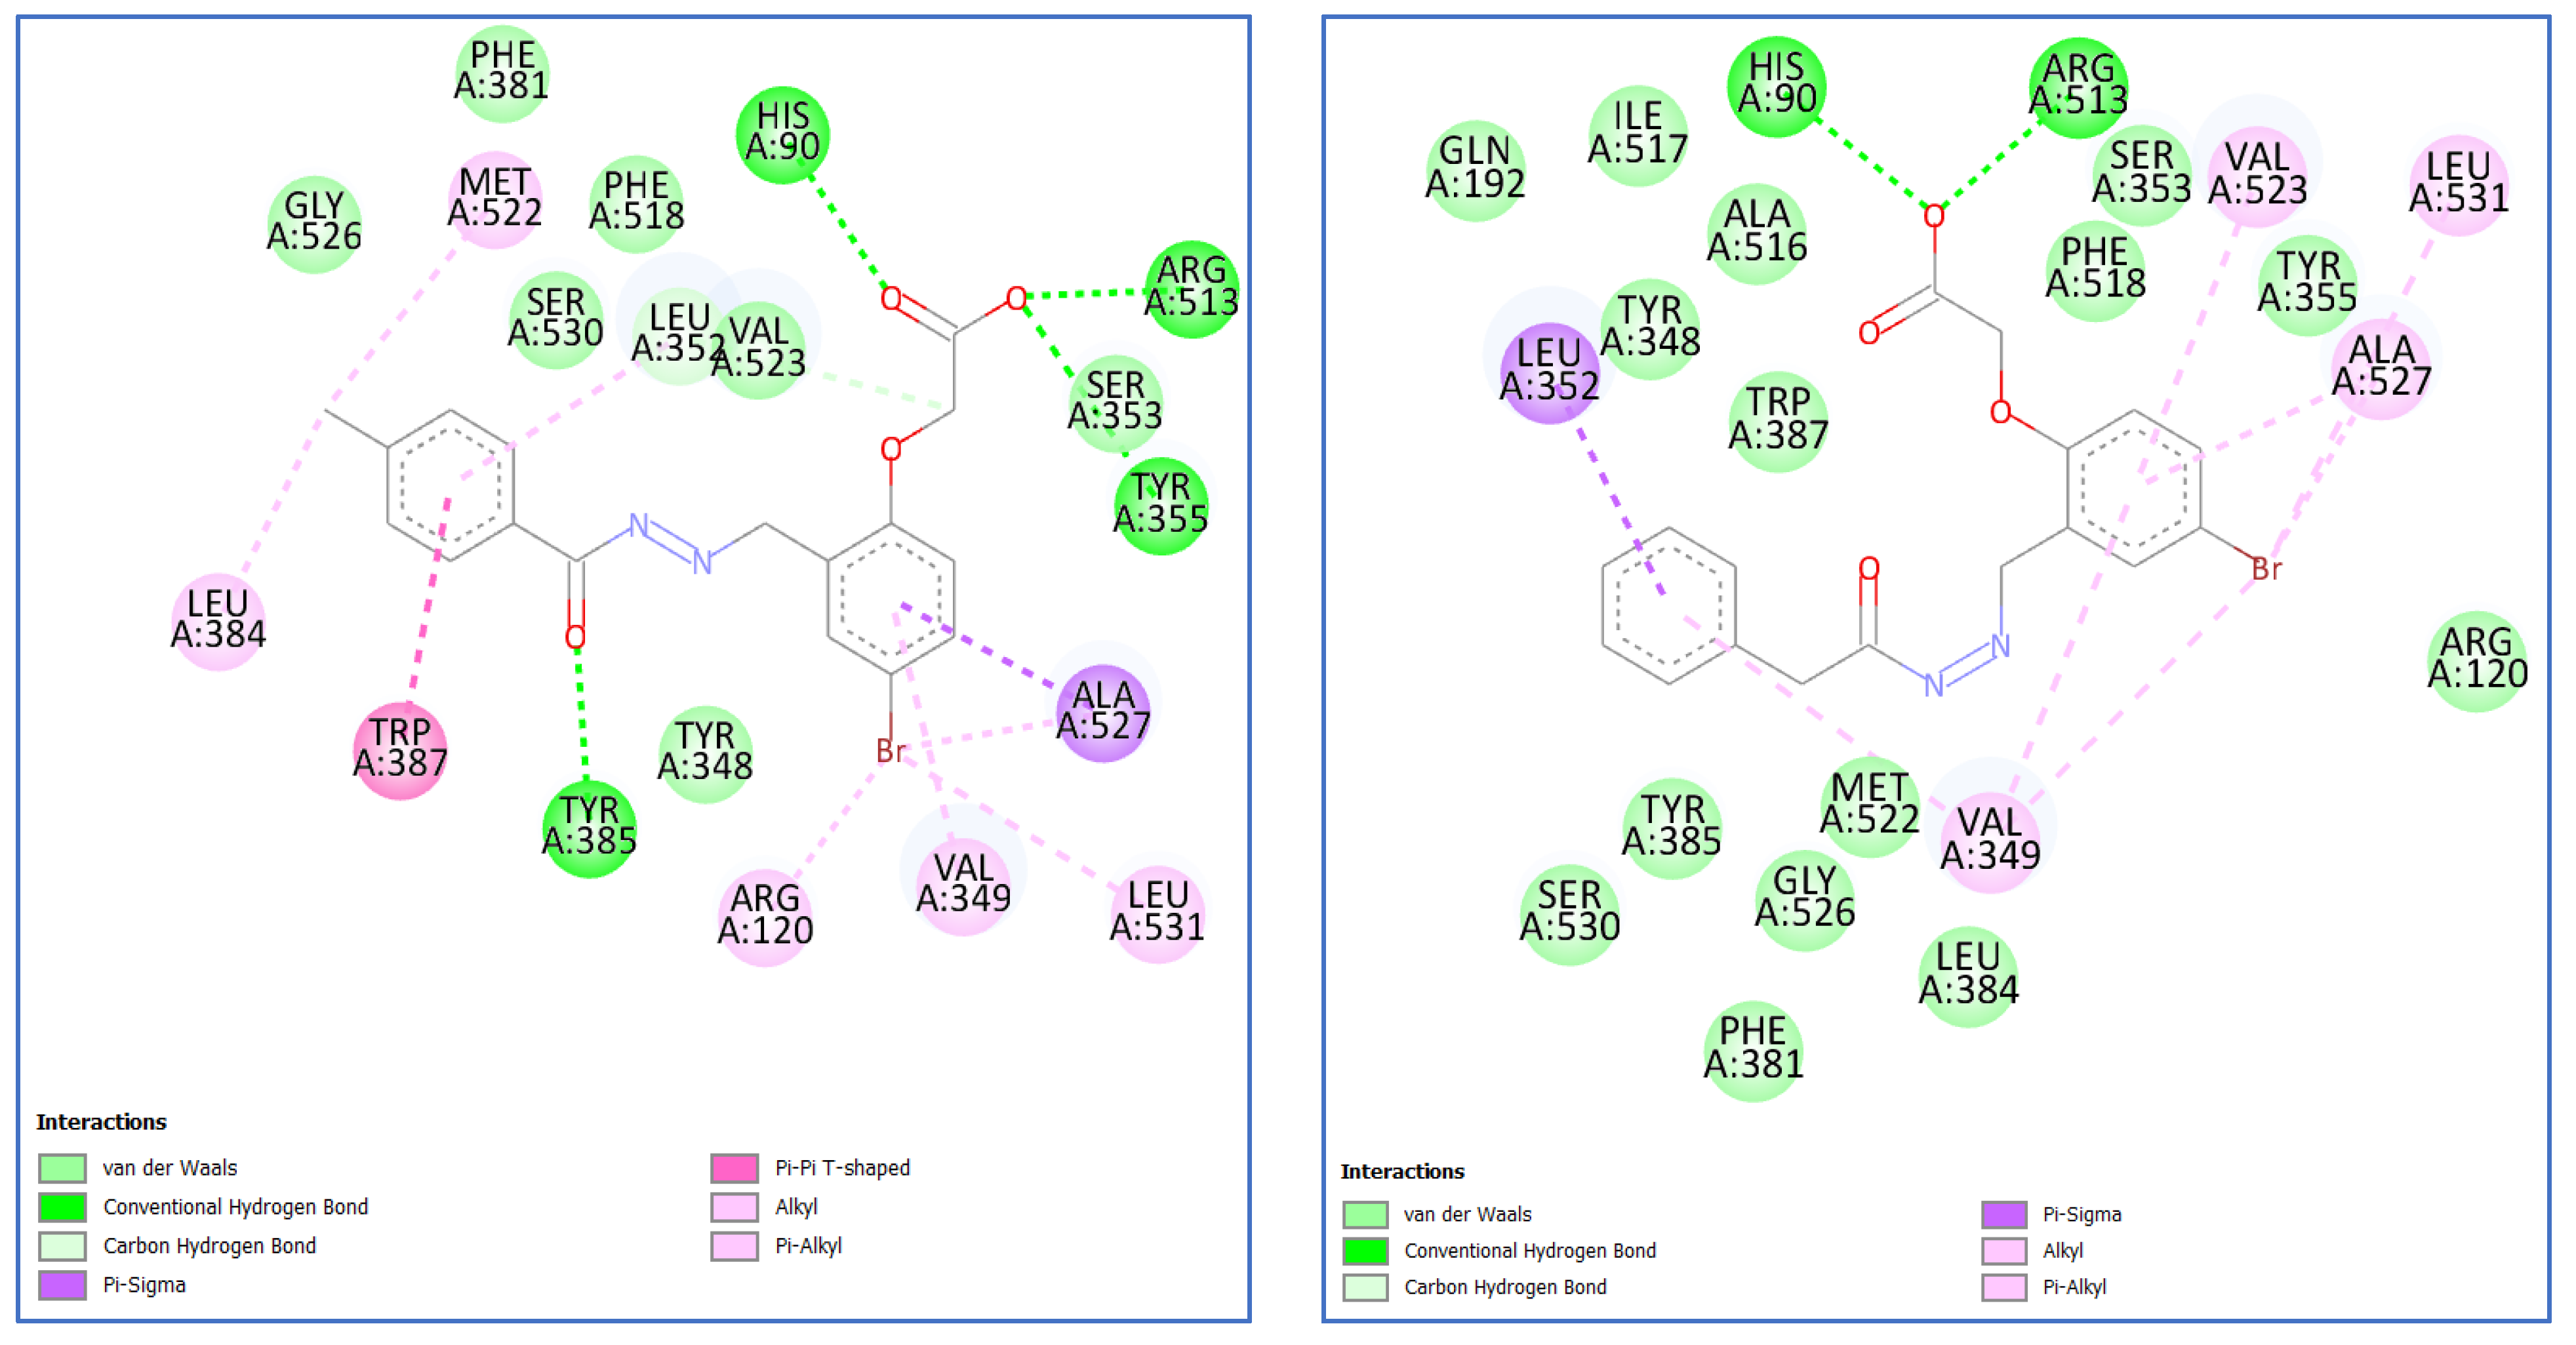
2.3.2. Molecular Docking of Most Potent Candidates 5f and 7b within COX-2 Active Sites
3. Materials and Methods
3.1. Chemistry
3.1.1. Synthesis of 2-(4-formylphenoxy)acetic Acids 3a–b
Synthesis of Hydrazones 5a–f, 7a–b, 10a–f, and 13a–b
- 2-(2-((2-Benzoylhydrazineylidene)methyl)phenoxy)acetic acid (5a)
- 2-(2-((2-(4-Methylbenzoyl)hydrazineylidene)methyl)phenoxy)acetic acid (5b)
- 2-(2-((2-(4-Chlorobenzoyl)hydrazineylidene)methyl)phenoxy)acetic acid (5c)
- 2-(2-((2-Benzoylhydrazineylidene)methyl)-4-bromophenoxy)acetic acid (5d)
- 2-(4-Bromo-2-((2-(4-methylbenzoyl)hydrazineylidene)methyl)phenoxy)acetic acid (5e)
- 2-(4-Bromo-2-((2-(4-chlorobenzoyl)hydrazineylidene)methyl)phenoxy)acetic acid (5f)
- 2-(2-((2-(2-Phenylacetyl)hydrazineylidene)methyl)phenoxy)acetic acid (7a)
- 2-(4-Bromo-2-((2-(2-phenylacetyl)hydrazineylidene)methyl)phenoxy)acetic acid (7b)
- 2-(2-((2-(Phenylglycyl)hydrazineylidene)methyl)phenoxy)acetic acid (10a)
- 2-(2-((2-(4-Tolylglycyl)hydrazineylidene)methyl)phenoxy)acetic acid (10b)
- 2-(2-((2-((4-Chlorophenyl)glycyl)hydrazineylidene)methyl)phenoxy)acetic acid (10c)
- 2-(4-Bromo-2-((2-(phenylglycyl)hydrazineylidene)methyl)phenoxy)acetic acid (10d)
- 2-(4-Bromo-2-((2-(p-tolylglycyl)hydrazineylidene)methyl)phenoxy)aceticacid (10e)
- 2-(4-Bromo-2-((2-((4 chlorophenyl)glycyl)hydrazineylidene)methyl)phenoxy) acetic acid (10f)
- 2-(2-((2-(Benzoylglycyl)hydrazineylidene)methyl)phenoxy)acetic acid (13a)
- 2-(2-((2-(Benzoylglycyl)hydrazineylidene)methyl)-4-bromophenoxy)acetic acid (13b)
3.2. Biological Activity
3.2.1. In Vitro Assessment [52]
3.2.2. Animals
3.2.3. Chemicals
3.2.4. In Vivo Assessment [53]
3.2.5. Assessment of Inflammatory Biomarkers Using ELISA [54]
3.2.6. Analgesic Activity [55]
3.2.7. Histopathological Examination [56]
3.2.8. Toxicity Assessment
Assessment of liver and kidney function
Evaluation of Ulcerogenic Effects
3.2.9. Statistical Analysis
3.2.10. Molecular Modeling Study
3.2.11. In Silico Drug-Likeness and ADME Prediction [58]
4. Conclusions
Supplementary Materials
Author Contributions
Funding
Institutional Review Board Statement
Informed Consent Statement
Data Availability Statement
Conflicts of Interest
References
- Chen, L.; Deng, H.; Cui, H.; Fang, J.; Zuo, Z.; Deng, J.; Li, Y.; Wang, X.; Zhao, L. Oncotarget 7204 www.impactjournals.com/oncotarget Inflammatory responses and inflammation-associated diseases in organs. Oncotarget 2018, 9, 7204–7218. [Google Scholar] [CrossRef] [PubMed]
- Vane, J.R.; Botting, R.M. The mechanism of action of aspirin. Thromb. Res. 2003, 110, 255–258. [Google Scholar] [CrossRef] [PubMed]
- Peng, W.; Ma, Y.-Y.; Zhang, K.; Zhou, A.-Y.; Zhang, Y.; Wang, H.; Du, Z.; Zhao, D.G. Synthesis and Biological Evaluation of Novel Resveratrol-NSAID Derivatives as Anti-inflammatory Agents. Chem. Pharm. Bull. 2016, 64, 609–615. [Google Scholar] [CrossRef] [PubMed]
- Ju, Z.; Li, M.; Xu, J.; Howell, D.C.; Li, Z.; Chen, F.E. Recent development on COX-2 inhibitors as promising anti-inflammatory agents: The past 10 years. Acta Pharm. Sin. B 2022, 12, 2790–2807. [Google Scholar] [CrossRef]
- Bertolini, A.; Ottani, A.; Sandrini, M. Dual acting anti-inflammatory drugs: A reappraisal. Pharmacol. Res. 2001, 44, 437–450. [Google Scholar] [CrossRef]
- Chowdhury, M.A.; Abdellatif, K.R.A.; Dong, Y.; Das, D.; Yu, G.; Velázquez, C.A.; Suresh, M.R.; Knaus, E.E. Synthesis and biological evaluation of salicylic acid and N-acetyl-2-carboxybenzenesulfonamide regioisomers possessing a N-difluoromethyl-1,2-dihydropyrid-2-one pharmacophore: Dual inhibitors of cyclooxygenases and 5-lipoxygenase with anti-inflammatory activity. Bioorg. Med. Chem. Lett. 2009, 19, 6855–6861. [Google Scholar] [CrossRef]
- Conaghan, P.G. A turbulent decade for NSAIDs: Update on current concepts of classification, epidemiology, comparative efficacy, and toxicity. Rheumatol. Int. 2012, 32, 1491–1502. [Google Scholar] [CrossRef]
- Cortes-Salva, M.Y.; Shrestha, S.; Singh, P.; Morse, C.L.; Jenko, K.J.; Montero Santamaria, J.A.; Zoghbi, S.S.; Innis, R.B.; Pike, V.W. 2-(4-methylsulfonylphenyl)pyrimidines as prospective radioligands for imaging cyclooxygenase-2 with PET—Synthesis, triage, and radiolabeling. Molecules 2018, 23, 2850. [Google Scholar] [CrossRef] [PubMed]
- Dvorakova, M.; Langhansova, L.; Temml, V.; Pavicic, A.; Vanek, T.; Landa, P. Synthesis, Inhibitory Activity, and in Silico Modeling of Selective COX-1 Inhibitors with a Quinazoline Core. ACS Med. Chem. Lett. 2021, 12, 610–616. [Google Scholar] [CrossRef] [PubMed]
- Palomer, A.; Cabré, F.; Pascual, J.; Campos, J.; Trujillo, M.A.; Entrena, A.; Gallo, M.A.; García, L.; Mauleón, D.; Espinosa, A. Identification of novel cyclooxygenase-2 selective inhibitors using pharmacophore models. J. Med. Chem. 2002, 45, 1402–1411. [Google Scholar] [CrossRef] [PubMed]
- Waterbury, L.D.; Silliman, D.; Jolas, T. Comparison of cyclooxygenase inhibitory activity and ocular anti-inflammatory effects of ketorolac tromethamine and bromfenac sodium. Curr. Med. Res. Opin. 2006, 22, 1133–1140. [Google Scholar] [CrossRef]
- Kato, M.; Nishida, S.; Kitasato, H.; Sakata, N.; Kawai, S. Cyclooxygenase-1 and cyclooxygenase-2 selectivity of non-steroidal anti-inflammatory drugs: Investigation using human peripheral monocytes. J. Pharm. Pharmacol. 2010, 53, 1679–1685. [Google Scholar] [CrossRef]
- Lamie, P.F.; Philoppes, J.N.; Azouz, A.A.; Safwat, N.M. Novel tetrazole and cyanamide derivatives as inhibitors of cyclooxygenase-2 enzyme: Design, synthesis, anti-inflammatory evaluation, ulcerogenic liability and docking study. J. Enzym. Inhib. Med. Chem. 2017, 32, 805–820. [Google Scholar] [CrossRef]
- Savjani, J.K.; Mulamkattil, S.; Variya, B.; Patel, S. Molecular docking, synthesis and biological screening of mefenamic acid derivatives as anti-inflammatory agents. Eur. J. Pharmacol. 2017, 801, 28–34. [Google Scholar] [CrossRef] [PubMed]
- Lees, P.; Giraudel, J.; Landoni, M.F.; Toutain, P.L. PK-PD integration and PK-PD modelling of nonsteroidal anti-inflammatory drugs: Principles and applications in veterinary pharmacology. J. Vet. Pharmacol. Ther. 2004, 27, 491–502. [Google Scholar] [CrossRef] [PubMed]
- Doiron, J.; Boudreau, L.H.; Picot, N.; Villebonet, B.; Surette, M.E.; Touaibia, M. Synthesis and 5-lipoxygenase inhibitory activity of new cinnamoyl and caffeoyl clusters. Bioorg. Med. Chem. Lett. 2009, 19, 1118–1121. [Google Scholar] [CrossRef]
- Rao, C.S.; Schoenwald, R.D.; Barfknecht, C.F.; Laban, S.L. Biopharmaceutical Evaluation of Ibufenac, Ibuprofen, and Their Hydroxyethoxy Analogs in the Rabbit Eye. J. Pharmacokinet. Biopharm. 1992, 20, 357–388. [Google Scholar] [CrossRef] [PubMed]
- Ho, K.Y.; Gwee, K.A.; Cheng, Y.K.; Yoon, K.H.; Hee, H.T.; Omar, A.R. Nonsteroidal anti-inflammatory drugs in chronic pain: Implications of new data for clinical practice. J. Pain Res. 2018, 11, 1937–1948. [Google Scholar] [CrossRef]
- Brune, K.; Hinz, B. Selective cyclooxygenase-2 inhibitors: Similarities and differences. Scand. J. Rheumatol. 2004, 33, 1–6. [Google Scholar] [CrossRef] [PubMed]
- Reale, A.; Brogi, S.; Chelini, A.; Paolino, M.; Di Capua, A.; Giuliani, G.; Cappelli, A.; Giorgi, G.; Chemi, G.; Grillo, A.; et al. Synthesis, biological evaluation and molecular modeling of novel selective COX-2 inhibitors: Sulfide, sulfoxide, and sulfone derivatives of 1,5-diarylpyrrol-3-substituted scaffold. Bioorg. Med. Chem. 2019, 27, 115045. [Google Scholar] [CrossRef]
- Gierse, J.K.; Zhang, Y.; Hood, W.F.; Walker, M.C.; Trigg, J.S.; Maziasz, T.J.; Koboldt, C.M.; Muhammad, J.L.; Zweifel, B.S.; Masferrer, J.L.; et al. Valdecoxib: Assessment of cyclooxygenase-2 potency and selectivity. J. Pharmacol. Exp. Ther. 2005, 312, 1206–1212. [Google Scholar] [CrossRef] [PubMed]
- Stacy, Z.A.; Dobesh, P.P.; Trujillo, T.C. Cardiovascular risks of cyclooxygenase inhibition. Pharmacotherapy 2006, 26, 919–938. [Google Scholar] [CrossRef] [PubMed]
- Sai Ram, K.V.V.M.; Rambabu, G.; Sarma, J.A.R.P.; Desiraju, G.R. Ligand coordinate analysis of SC-558 from the active site to the surface of COX-2: A molecular dynamics study. J. Chem. Inf. Model. 2006, 46, 1784–1794. [Google Scholar] [CrossRef] [PubMed]
- Elgohary, M.K.; Abd El Hadi, S.R.; Abo-Ashour, M.F.; Abo-El Fetoh, M.E.; Afify, H.; Abdel-Aziz, H.A.; Abou-Seri, S.M. Fragment merging approach for the design of thiazole/thiazolidine clubbed pyrazoline derivatives as anti-inflammatory agents: Synthesis, biopharmacological evaluation and molecular modeling studies. Bioorg. Chem. 2023, 139, 106724. [Google Scholar] [CrossRef] [PubMed]
- Abdel-Aziz, H.A.; Al-Rashood, K.A.; Eltahir, K.E.H.; Suddek, G.M. Synthesis of N-benzenesulfonamide-1H-pyrazoles bearing arylsulfonyl moiety: Novel celecoxib analogs as potent anti-inflammatory agents. Eur. J. Med. Chem. 2014, 80, 416–422. [Google Scholar] [CrossRef]
- Abdellatif, K.R.A.; Fadaly, W.A.A.; Elshaier, Y.A.M.M.; Ali, W.A.M.; Kamel, G.M. Non-acidic 1,3,4-trisubstituted-pyrazole derivatives as lonazolac analogs with promising COX-2 selectivity, anti-inflammatory activity and gastric safety profile. Bioorg. Chem. 2018, 77, 568–578. [Google Scholar] [CrossRef]
- Duchowicz, P.R.; Talevi, A.; Bellera, C.; Bruno-Blanch, L.E.; Castro, E.A. Application of descriptors based on Lipinski’s rules in the QSPR study of aqueous solubilities. Bioorg. Med. Chem. 2007, 15, 3711–3719. [Google Scholar] [CrossRef]
- Hamdy, S.A.; Menze, E.T.; El Hefnawy, H.M.; Azzam, S.M.; Aboutabl, E.A. In-vivo anti-inflammatory activity of Hydrocotyle umbellata L. Aerial parts and isolation of the main phytochemicals. Iran. J. Pharm. Res. 2020, 19, 34–44. [Google Scholar] [CrossRef]
- Solanki, H.K.; Shah, D.A.; Maheriya, P.M.; Patel, C.A. Evaluation of anti-inflammatory activity of probiotic on carrageenan-induced paw edema in Wistar rats. Int. J. Biol. Macromol. 2015, 72, 1277–1282. [Google Scholar] [CrossRef]
- Siqueira, M.D.F.G.D.; Jardim, M.C.D.A.M.; Sampaio, F.C.; Vasconcelos, L.C.D.S.; Vasconcelos, L.C.D. Evaluation of an oral health program for children in early childhood. Rev. Odonto Ciência 2010, 25, 350–354. [Google Scholar] [CrossRef]
- Mansouri, M.T.; Hemmati, A.A.; Naghizadeh, B.; Mard, S.A.; Rezaie, A.; Ghorbanzadeh, B. A study of the mechanisms underlying the anti-inflammatory effect of ellagic acid in carrageenan-induced paw edema in rats. Ind. J. Pharm. 2015, 47, 292–298. [Google Scholar] [CrossRef]
- Ma, Y.; Li, Y.; Li, X.; Wu, Y. Anti-inflammatory effects of 4-methylcyclopentadecanone on edema models in mice. Int. J. Mol. Sci. 2013, 14, 23980–23992. [Google Scholar] [CrossRef]
- Chattopadhyay Debprasad, C.D.; Mukherjee Hemanta, M.H.; Bag Paromita, B.P.; Ojha Durbadal, O.D.; Kumar, K.A.; Dutta Shanta, D.S.; Kumar, H.P.; Chatterjee Tapan, C.T.; Sharon Ashoke, S.A.; Chakraborti Sekhar, C.S. Inhibition of NO2, PGE2, TNF-α, and iNOS EXpression by Shorea robusta L.: An ethnomedicine used for anti-inflammatory and analgesic activity. Evid.-Based Complement. Altern. Med. 2012, 2012, 254849. [Google Scholar] [CrossRef]
- Pang, L.; Liu, C.Y.; Gong, G.H.; Quan, Z.S. Synthesis, in vitro and in vivo biological evaluation of novel lappaconitine derivatives as potential anti-inflammatory agents. Acta Pharm. Sin. B 2020, 10, 628–645. [Google Scholar] [CrossRef] [PubMed]
- Karim, N.; Khan, I.; Khan, W.; Khan, I.; Khan, A.; Halim, S.A.; Khan, H.; Hussain, J.; Al-Harrasi, A. Anti-nociceptive and anti-inflammatory activities of asparacosin a involve selective cyclooxygenase 2 and inflammatory cytokines inhibition: An in-vitro, in-vivo, and in-silico approach. Front. Immunol. 2019, 10, 581. [Google Scholar] [CrossRef]
- Du, Y.-H.; Feng, R.-Z.; Li, Q.; Wei, Q.; Yin, Z.-Q.; Zhou, L.-J.; Tao, C.; Jia, R.-Y. Anti-inflammatory activity of leaf essential oil from Cinnamomum longepaniculatum (Gamble) N. Chao. Int. J. Clin. Exp. Med. 2014, 7, 5612–5620. [Google Scholar] [PubMed]
- Jang, D.I.; Lee, A.H.; Shin, H.Y.; Song, H.R.; Park, J.H.; Kang, T.B.; Lee, S.R.; Yang, S.H. The role of tumor necrosis factor alpha (Tnf-α) in autoimmune disease and current tnf-α inhibitors in therapeutics. Int. J. Mol. Sci. 2021, 22, 2719. [Google Scholar] [CrossRef]
- Bai, L.L.; Chen, H.; Zhou, P.; Yu, J. Identification of Tumor Necrosis Factor-Alpha (TNF-α) Inhibitor in Rheumatoid Arthritis Using Network Pharmacology and Molecular Docking. Front. Pharmacol. 2021, 12, 690118. [Google Scholar] [CrossRef]
- Hijazi, M.A.; El-Mallah, A.; Aboul-Ela, M.; Ellakany, A. Evaluation of Analgesic Activity of Papaver libanoticum Extract in Mice: Involvement of Opioids Receptors. Evid.-Based Complement. Altern. Med. 2017, 2017, 8935085. [Google Scholar] [CrossRef]
- Szandruk-Bender, M.; Merwid-Ląd, A.; Wiatrak, B.; Danielewski, M.; Dzimira, S.; Szkudlarek, D.; Szczukowski, Ł.; Świątek, P.; Szeląg, A. Novel 1,3,4-oxadiazole derivatives of pyrrolo [3,4-d]pyridazinone exert anti-inflammatory activity without acute gastrotoxicity in the carrageenan-induced rat paw edema test. J. Inflamm. Res. 2021, 14, 5739–5756. [Google Scholar] [CrossRef]
- Bhandari, S.V.; Parikh, J.K.; Bothara, K.G.; Chitre, T.S.; Lokwani, D.K.; Devale, T.L.; Modhave, N.S.; Pawar, V.S.; Panda, S. Design, synthesis, and evaluation of anti-inflammatory, analgesic, ulcerogenicity, and nitric oxide releasing studies of novel indomethacin analogs as non-ulcerogenic derivatives. J. Enzym. Inhib. Med. Chem. 2010, 25, 520–530. [Google Scholar] [CrossRef]
- Clementi, G.; Caruso, A.; Maria, V.; Cutuli, C.; De Bernardis, E.; Prato, A.; Mangano, N.G.; Amico-Roxas, M. Effects of centrally or peripherally injected adrenomedullin on reserpine-induced gastric lesions. Eur. J. Pharmacol. 1998, 360, 51–54. [Google Scholar] [CrossRef]
- Sohail, R.; Mathew, M.; Patel, K.K.; Reddy, S.A.; Haider, Z.; Naria, M.; Habib, A.; Abdin, Z.U.; Chaudhry, W.R.; Akbar, A.; et al. Effects of Non-steroidal Anti-inflammatory Drugs (NSAIDs) and Gastroprotective NSAIDs on the Gastrointestinal Tract: A Narrative Review. Cureus 2023, 15, e37080. [Google Scholar] [CrossRef] [PubMed]
- Drini, M. Peptic ulcer disease and non-steroidal anti-inflammatory drugs. Aust. Prescr. 2017, 40, 91–93. [Google Scholar] [CrossRef] [PubMed]
- Blobaum, A.L.; Marnett, L.J. Structural and functional basis of cyclooxygenase inhibition. J. Med. Chem. 2007, 50, 1425–1441. [Google Scholar] [CrossRef]
- Mengle-Gaw, L.J.; Schwartz, B.D. Cyclooxygenase-2 inhibitors: Promise or peril? Mediat. Inflamm. 2002, 11, 275–286. [Google Scholar] [CrossRef]
- Mehr-Un-Nisa Munawar, M.A.; Chattha, F.A.; Kousar, S.; Munir, J.; Ismail, T.; Ashraf, M.; Khan, M.A. Synthesis of novel triazoles and a tetrazole of escitalopram as cholinesterase inhibitors. Bioorg. Med. Chem. 2015, 23, 6014–6024. [Google Scholar] [CrossRef] [PubMed]
- Kumar Reddy, A.L.V.; Kathale, N.E. Synthesis and anti-inflammatory activity of hydrazones bearing biphenyl moiety and vanillin based hybrids. Orient. J. Chem. 2017, 33, 971–978. [Google Scholar] [CrossRef]
- Harras, M.F.; Sabour, R.; Farghaly, T.A.; Ibrahim, M.H. Drug Repurposing Approach in Developing New Furosemide Analogs as Antimicrobial Candidates and Anti-PBP: Design, Synthesis, and Molecular Docking. Bioorg. Chem. 2023, 137, 106585. [Google Scholar] [CrossRef]
- Kuddus, M. Synthesis of Some Hippuric Acid Substrate Linked Novel Pyrazoles as Antimicrobial Agents. Asian J. Chem. 2019, 31, 522–526. [Google Scholar] [CrossRef]
- Fugard, A.J.; Thompson, B.K.; Slawin, A.M.Z.; Taylor, J.E.; Smith, A.D. Organocatalytic Synthesis of Fused Bicyclic 2,3-Dihydro-1,3,4-oxadiazoles through an Intramolecular Cascade Cyclization. Org. Lett. 2015, 17, 5824–5827. [Google Scholar] [CrossRef]
- Shaveta Singh, A.; Kaur, M.; Sharma, S.; Bhatti, R.; Singh, P. Rational design, synthesis and evaluation of chromone-indole and chromone-pyrazole based conjugates: Identification of a lead for anti-inflammatory drug. Eur. J. Med. Chem. 2014, 77, 185–192. [Google Scholar] [CrossRef]
- Li, L.S.; Chiroma, S.M.; Hashim, T.; Adam, S.K.; Mohd Moklas, M.A.; Yusuf, Z.; Rahman, S.A. Antioxidant and anti-inflammatory properties of Erythroxylum cuneatum alkaloid leaf extract. Heliyon 2020, 6, e04141. [Google Scholar] [CrossRef]
- Kruger, N.J. The Bradford method for protein quantitation. Methods Mol. Biol. 1994, 32, 9–15. [Google Scholar] [PubMed]
- Pallavi, H.M.; Al-Ostoot, F.H.; Vivek, H.K.; Khanum, S.A. Design, docking, synthesis, and characterization of novel N’(2-phenoxyacetyl) nicotinohydrazide and N’(2-phenoxyacetyl)isonicotinohydrazide derivatives as anti-inflammatory and analgesic agents. J. Mol. Struct. 2022, 1247, 131404. [Google Scholar] [CrossRef]
- Mert, T.; Yaman, S. Pro-inflammatory or anti-inflammatory effects of pulsed magnetic field treatments in rats with experimental acute inflammation. Environ. Sci. Pollut. Res. 2020, 27, 31543–31554. [Google Scholar] [CrossRef]
- Abouzid, K.A.M.; Khalil, N.A.; Ahmed, E.M.; Esmat, A.; Al-Abd, A.M. Design, synthesis, and evaluation of anti-inflammatory and ulcerogenicity of novel pyridazinone derivatives. Med. Chem. Res. 2012, 21, 3581–3590. [Google Scholar] [CrossRef]
- Daina, A.; Michielin, O.; Zoete, V. SwissADME: A free web tool to evaluate pharmacokinetics, drug-likeness and medicinal chemistry friendliness of small molecules. Sci. Rep. 2017, 7, 42717. [Google Scholar] [CrossRef] [PubMed]


 | ||||||
|---|---|---|---|---|---|---|
| Compound | X | R1 | R2 | COX-1 IC50 (µM) | COX-2 IC50 (µM) | SI |
| Mefenamic acid | – | – | – | 29.9 ± 0.09 | 1.98 ± 0.02 | 15.10 |
| Celecoxib | – | – | – | 14.93 ± 0.12 | 0.05 ± 0.02 | 298.6 |
| 5a | 0 | -H | -H | 10.00 ± 0.10 | 0.97 ± 0.06 | 10.31 |
| 5b | 0 | -H | -CH3 | 7.50 ± 0.20 | 0.37 ± 0.06 | 20.27 |
| 5c | 0 | -H | -Cl | 14.50 ± 0.20 | 0.13 ± 0.06 | 111.53 |
| 5d | 0 | -Br | -H | 9.03 ± 0.15 | 0.08 ± 0.01 a | 112.87 |
| 5e | 0 | -Br | -CH3 | 7.00 ± 0.20 | 0.07 ± 0.01 a | 100.00 |
| 5f | 0 | -Br | -Cl | 8.00 ± 0.20 | 0.06 ± 0.01 a | 133.34 |
| 7a | -CH2- | -H | -H | 10.00 ± 0.20 | 0.13 ± 0.06 | 76.92 |
| 7b | -CH2- | -Br | -H | 5.93 ± 0.12 | 0.06 ± 0.01 a | 84.71 |
| 10a | -NH-CH2- | -H | -H | 9.50 ± 0.20 | 0.50 ± 0.10 | 19.00 |
| 10b | -NH-CH2- | -H | -CH3 | 4.97 ± 0.06 | 0.33 ± 0.06 | 15.06 |
| 10c | -NH-CH2- | -H | -Cl | 5.57 ± 0.12 | 0.07 ± 0.01 a | 79.57 |
| 10d | -NH-CH2- | -Br | -H | 7.00 ± 0.20 | 0.08 ± 0.01 a | 87.50 |
| 10e | -NH-CH2- | -Br | -CH3 | 4.07 ± 0.12 | 0.06 ± 0.01 a | 67.83 |
| 10f | -NH-CH2- | -Br | -Cl | 4.97 ± 0.06 | 0.09 ± 0.01 a | 55.22 |
| 13a | -(C=O)-NH-CH2- | -H | -H | 8.43 ± 0.12 | 0.23 ± 0.06 | 36.65 |
| 13b | -(C=O)-NH-CH2- | -Br | -H | 9.93 ± 0.12 | 0.13 ± 0.06 | 76.38 |
| Paw Thickness Difference at Hourly Intervals (mm) Percentage of Inhibition (%) | Paw Weight Increase (%) | |||||
|---|---|---|---|---|---|---|
| 1st h | 2nd h | 3rd h | 4th h | 5th h | ||
| Control | 0.04 ± 0.01 | 0.07 ± 0.02 | 0.08 ± 0.03 | 0.02 ± 0.01 | 0.00 ± 0.01 | 0.31 ± 2.33 |
| Carrageenan | 1.97 ± 0.38 a | 3.29 ± 0.31 a | 4.22 ± 0.29 a | 5.05 ± 0.52 a | 5.31 ± 0.52 a | 94.04 ± 3.23 a |
| Celecoxib | 1.4 ± 0.38 ab (29.31%) | 2.36 ± 0.51 ab (28.34%) | 2.83 ± 0.43 ab (33%) | 3.01 ± 0.57 ab (40.39%) | 3.10 ± 0.23 ab (41.65%) | 29.95 ± 2.20 ab |
| Mefenamic acid | 1.22 ± 0.19 ab (38.43%) | 2.27 ± 0.11 ab (31.22%) | 2.86 ± 0.11 ab (32.37%) | 3.22 ± 0.19 ab (36.16%) | 3.51 ± 0.07 ab (33.89%) | 34.08 ± 2.27 ab |
| 5d | 1.37 ± 0.13 ab (30.57%) | 2.76 ± 0.24 a (16.19%) | 3.56 ± 0.33 abcd (15.67%) | 3.7 ± 0.32 abc (26.75%) | 3.90 ± 0.41 abc (26.51%) | 76.92 ± 3.89 abcd |
| 5e | 1.57 ± 0.4 a (20.35%) | 2.53 ± 0.48 ab (23.28%) | 3.43 ± 0.10 abcd (18.71%) | 3.55 ± 0.11 ab (29.59%) | 3.68 ± 0.15 abc (30.72%) | 47.55 ± 2.41 abcd |
| 5f | 0.83 ± 0.15 ab (58.11%) | 1.65 ± 0.29 abcd (49.85%) | 2.32 ± 0.17 ab (45.05%) | 2.68 ± 0.12 ab (46.9%) | 2.84 ± 0.13 abd (46.51%) | 29.85 ± 3.88 ab |
| 7b | 0.65 ± 0.16 abc (67.23%) | 1.08 ± 0.21 abcd (67.11%) | 1.64 ± 0.13 abcd (61.23%) | 1.90 ± 0.19 abcd (62.42%) | 1.95 ± 0.19 abcd (63.35%) | 33.07 ± 1.88 ab |
| 10c | 1.65 ± 0.22 a (16.47%) | 2.64 ± 0.33 ab (19.99%) | 3.11 ± 0.29 ab (26.25%) | 3.81 ± 0.19 abcd (24.47%) | 4.22 ± 0.28 abcd (20.54%) | 69.01 ± 4.61 abcd |
| 10d | 1.55 ± 0.41 a (21.37%) | 2.60 ± 0.21 ab (21.15%) | 2.93 ± 0.37 ab (30.56%) | 3.44 ± 0.37 ab (31.87%) | 3.73 ± 0.34 abc (29.71%) | 60.8 ± 4.27 abcd |
| 10e | 1.79 ± 0.39 a (9.38%) | 3.00 ± 0.30 acd (9.01%) | 3.58 ± 0.17 abcd (15.28%) | 3.98 ± 0.26 abcd (21.24%) | 4.17 ± 0.24 abcd (21.42%) | 64.95 ± 6.79 abcd |
| 10f | 1.77 ± 0.27 a (10.39%) | 2.85 ± 0.46 ad (13.51%) | 3.24 ± 0.46 ab (23.17%) | 3.63 ± 0.48 abc (28.04%) | 3.78 ± 0.51 abc (28.80%) | 59.16 ± 2.72 abcd |
| 30 min | 60 min | 90 min | 120 min | |
|---|---|---|---|---|
| Control | 6.45 ± 0.33 | 7.31 ± 0.14 | 8.47 ± 0.31 | 9.46 ± 0.31 |
| Celecoxib | 8.39 ± 0.22 a | 9.95 ± 0.23 a | 11.63 ± 0.60 a | 13.88 ± 0.41 a |
| Mefenamic acid | 9.95 ± 0.35 ab | 11.58 ± 0.25 ab | 12.83 ± 0.36 ab | 13.73 ± 0.42 a |
| 5f | 8.99 ± 0.38 abc | 10.59 ± 0.3 abc | 12.48 ± 0.65 ab | 14.15 ± 0.38 a |
| 7b | 8.88 ± 0.29 ac | 10.35 ± 0.35 ac | 12.09 ± 0.29 ac | 13.71 ± 0.31 a |
| ALT (IU/L) | AST (IU/L) | AST/ALT | Creatinine | Urea | |
|---|---|---|---|---|---|
| Control | 87.61 ± 6.41 | 95.54 ± 5.37 | 1.10 ± 0.12 | 0.69 ± 0.07 | 26.47 ± 1.97 |
| Carrageenan | 90.43 ± 6.04 | 100.14 ± 8.36 | 1.11 ± 0.14 | 0.73 ± 0.05 | 27.85 ± 1.27 |
| Celecoxib | 92.94 ± 5.00 | 101.23 ± 10.04 | 1.09 ± 0.08 | 0.73 ± 0.03 | 26.28 ± 3.11 |
| Mefenamic acid | 88.84 ± 6.09 | 97.51 ± 8.08 | 1.10 ± 0.15 | 0.72 ± 0.05 | 27.58 ± 2.08 |
| 5f | 92.76 ± 3.83 | 93.69 ± 5.26 | 1.01 ± 0.08 | 0.67 ± 0.04 | 26.37 ± 2.48 |
| 7b | 89.13 ± 8.53 | 97.59 ± 6.19 | 1.10 ± 0.12 | 0.68 ± 0.05 | 27.16 ± 1.53 |
| Ulcer Number Score | Ulcer Severity Score | |
|---|---|---|
| Control | 0.50 ± 0.55 | 0.25 ± 0.27 |
| Carrageenan | 0.83 ± 0.75 | 0.50 ± 0.45 |
| Celecoxib | 1.00 ± 0.63 | 0.75 ± 0.52 |
| Mefenamic acid | 1.67 ± 0.82 a | 1.17 ± 0.61 a |
| 5f | 0.50 ± 0.55 d | 0.33 ± 0.41 d |
| 7b | 0.67 ± 0.52 | 0.42 ± 0.38 |
| Compound | Binding Score (kcal/mol) | Interaction | Bond Length (Ao) | Ligand Atom | Residue | Enzyme | PDB ID |
|---|---|---|---|---|---|---|---|
| Celecoxib | −11.0 | H-Bond | 1.98 | O of SO2NH2 | His90 | COX-2 | 1CX2 |
| H-Bond | 2.24 | O of SO2NH2 | Arg513 | ||||
| H-Bond | 2.26 | F of CF3 | Arg120 | ||||
| 5f | −8.7 | H-Bond | 2.89 | CO of COO− | His90 | COX-2 | 1CX2 |
| H-Bond | 3.07 | O of COO− | Arg513 | ||||
| H-Bond | 3.12 | O of COO− | Tyr355 | ||||
| H-Bond | 2.28 | CO of CONH | Tyr385 | ||||
| 7b | −9.0 | H-Bond | 2.30 | O of COO− | His90 | COX-2 | 1CX2 |
| H-Bond | 2.14 | O of COO− | Arg513 | ||||
| Pi-sigma | 3.84 | phenoxy ring | leu352 |
Disclaimer/Publisher’s Note: The statements, opinions and data contained in all publications are solely those of the individual author(s) and contributor(s) and not of MDPI and/or the editor(s). MDPI and/or the editor(s) disclaim responsibility for any injury to people or property resulting from any ideas, methods, instructions or products referred to in the content. |
© 2024 by the authors. Licensee MDPI, Basel, Switzerland. This article is an open access article distributed under the terms and conditions of the Creative Commons Attribution (CC BY) license (https://creativecommons.org/licenses/by/4.0/).
Share and Cite
Alshaye, N.A.; Elgohary, M.K.; Elkotamy, M.S.; Abdel-Aziz, H.A. Design, Synthesis, and Biological Evaluation of Novel Phenoxy Acetic Acid Derivatives as Selective COX-2 Inhibitors Coupled with Comprehensive Bio-Pharmacological Inquiry, Histopathological Profiling, and Toxicological Scrutiny. Molecules 2024, 29, 1309. https://doi.org/10.3390/molecules29061309
Alshaye NA, Elgohary MK, Elkotamy MS, Abdel-Aziz HA. Design, Synthesis, and Biological Evaluation of Novel Phenoxy Acetic Acid Derivatives as Selective COX-2 Inhibitors Coupled with Comprehensive Bio-Pharmacological Inquiry, Histopathological Profiling, and Toxicological Scrutiny. Molecules. 2024; 29(6):1309. https://doi.org/10.3390/molecules29061309
Chicago/Turabian StyleAlshaye, Najla A., Mohamed K. Elgohary, Mahmoud S. Elkotamy, and Hatem A. Abdel-Aziz. 2024. "Design, Synthesis, and Biological Evaluation of Novel Phenoxy Acetic Acid Derivatives as Selective COX-2 Inhibitors Coupled with Comprehensive Bio-Pharmacological Inquiry, Histopathological Profiling, and Toxicological Scrutiny" Molecules 29, no. 6: 1309. https://doi.org/10.3390/molecules29061309