Abstract
In this study, the separation conditions of UHPLC-QTOF-MS and the extraction conditions of QuEChERS were optimized. The analytical process for determining Broflanilide residues in different soil types was successfully established and applied to its adsorption, desorption, and leaching in soil. Broflanilide was extracted from soil with acetonitrile and purified using PSA and MgSO4. The modified UHPLC-QTOF-MS method was used for quantification. The average recovery of Broflanilide was between 87.7% and 94.38%, with the RSD lower than 7.6%. In the analysis of adsorption, desorption, and leaching quantities in four soil types, the RSD was less than 9.2%, showing good stability of the method, which can be applied to determine the residue of Broflanilide in different soils.
1. Introduction
The global population is expected to increase to nine billion by 2050 [1]. In the foreseeable future, agricultural production must be greatly increased to accommodate the population growth with increased animal farming for food and feed. Hence, food security will become an urgent key issue. Using chemicals can protect plants against insects, animals, and weeds in farming [2,3]. However, pesticides are environmentally exogenous and enter the environment by spraying, seed sowing, fumigation, or direct dressing. The accumulation of residual persistent pesticides can adversely affect human health and ecosystems [4]. Soil can act as a ‘reservoir’ and ‘distribution center’ of chemical pesticides, which may hold about 50% of the residual persistent pesticides [5]. Although they can be gradually dissipated through crop absorption, evaporation, and degradation, the decreasing rates are normally slower than the agricultural cycle [6]. In addition, pesticides in soil can also form bound residues, which can be absorbed by crop roots or gradually leached into groundwater. Either way, pesticide contamination threatens the soil’s ecological balance and human long-term health [7,8].
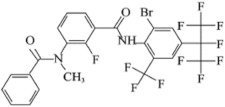
Broflanilide [3-benzamido-N-(4-(perfluoropropan-2-yl) phenyl) benzamide], known as Broflanilide (Table 1), is a new class of organic halide pesticide containing diamide. It was jointly invented by Mitsui Chemical Agricultural Co., Ltd. (Tokyo, Japan) and BASF (Ludwigshafen, Germany).

Table 1.
Some important physicochemical properties of Broflanilide.
Broflanilide shows potent insecticidal properties against various pests, including beetles, termites, caterpillars, and other common insects found on cereals, leafy vegetables, and perennial plants [9]. Research indicates that it produces desmethyl-broflanilide through metabolism. Broflanilide acts as a noncompetitive antagonist against the resistant-to-dieldrin γ-aminobutyric acid receptor. Interestingly, desmethyl-broflanilide has a binding mechanism different from that of traditional noncompetitive antagonists, such as Fipronil [10]. Broflanilide formulations have received approval for use in several countries, including Japan (2018), Canada (2020), Australia (2020), China (2020), and the United States (2021) [11]. Consequently, broflanilide is poised to play a significant role in pest management, particularly against pests resistant to conventional noncompetitive antagonists [10].
Pesticide multi-residue analysis methods include sample preparation, pesticide extraction, and separation, followed by quantitative analysis. The QuEChERS method was first proposed at the European Pesticide Residues Symposium (EPRW) in Rome in 2002. Anastassiades et al. published this method in 2003 [12], which has since become widely adopted as a standard sample preparation technique in the analysis of pesticide residues. The QuEChERS method is suitable for a variety of pesticides. It reduces the use of organic solvents and soil samples since it has a higher recovery rate [13]. UHPLC-QTOF-MS is also recognized as an emerging technology for analyzing pesticide residues in food, mainly due to its accuracy. It offers a balanced combination of high-resolution precision with sensitive full-scan capabilities. Thus, QTOF complements other mass spectrometers like quadrupole and ion trap instruments for identification and quantification [14,15,16]. In this study, it was utilized ultra-high performance liquid chromatography-time of flight-mass spectrometry (UHPLC-QTOF-MS) in conjunction with the modified QuEChERS method to enhance the response and recovery. It optimized the conditions and parameters of UHPLC-QTOF-MS by comparing various solvents and adsorbents. Consequently, the main objective of this research was to establish an efficient and reliable method for detecting broflanilide residues in soil samples.
2. Results and Discussion
2.1. Optimization of Separation Conditions of UHPLC-QTOF-MS
2.1.1. Chromatographic Column Optimization
The choice of the chromatographic column is critical in inferencing analyte retention behavior and peak shape [17]. Specifically, selecting an appropriate chromatographic column can enhance the stability and efficiency of the analysis. The most commonly used chromatographic column in determining pesticide compounds is octadecyl-bonded C18 [18]. To reduce the running time and achieve optimal peak shapes, we employed two distinct C18 columns for optimizing the UHPLC conditions: the Zorbax Eclipse XDB-C18 column (4.6 mm × 150 mm × 5 μm) and the Zorbax SB-C18 column (2.1 mm × 100 mm × 1.8 μm). With identical mobile phases, the retention time of broflanilide on the XDB-C18 column is longer, suggesting a superior separation between broflanilide and impurity peaks. Consequently, the XDB-C18 column was selected for further study.
2.1.2. Mobile Phase Optimization
To enhance the performance of UHPLC, the impact of flow rate and mobile phase on broflanilide separation was investigated. The compared mobile phases are methanol-water and acetonitrile-water (with or without 0.1% formic acid). The acetonitrile-water phases produced faster separation with narrower peaks. This is likely because acetonitrile exhibits stronger solvation tendencies towards solutes than methanol [19,20,21], and acetonitrile–water mixtures demonstrate higher solvent permeability [22], effectively removing impurities in the column.
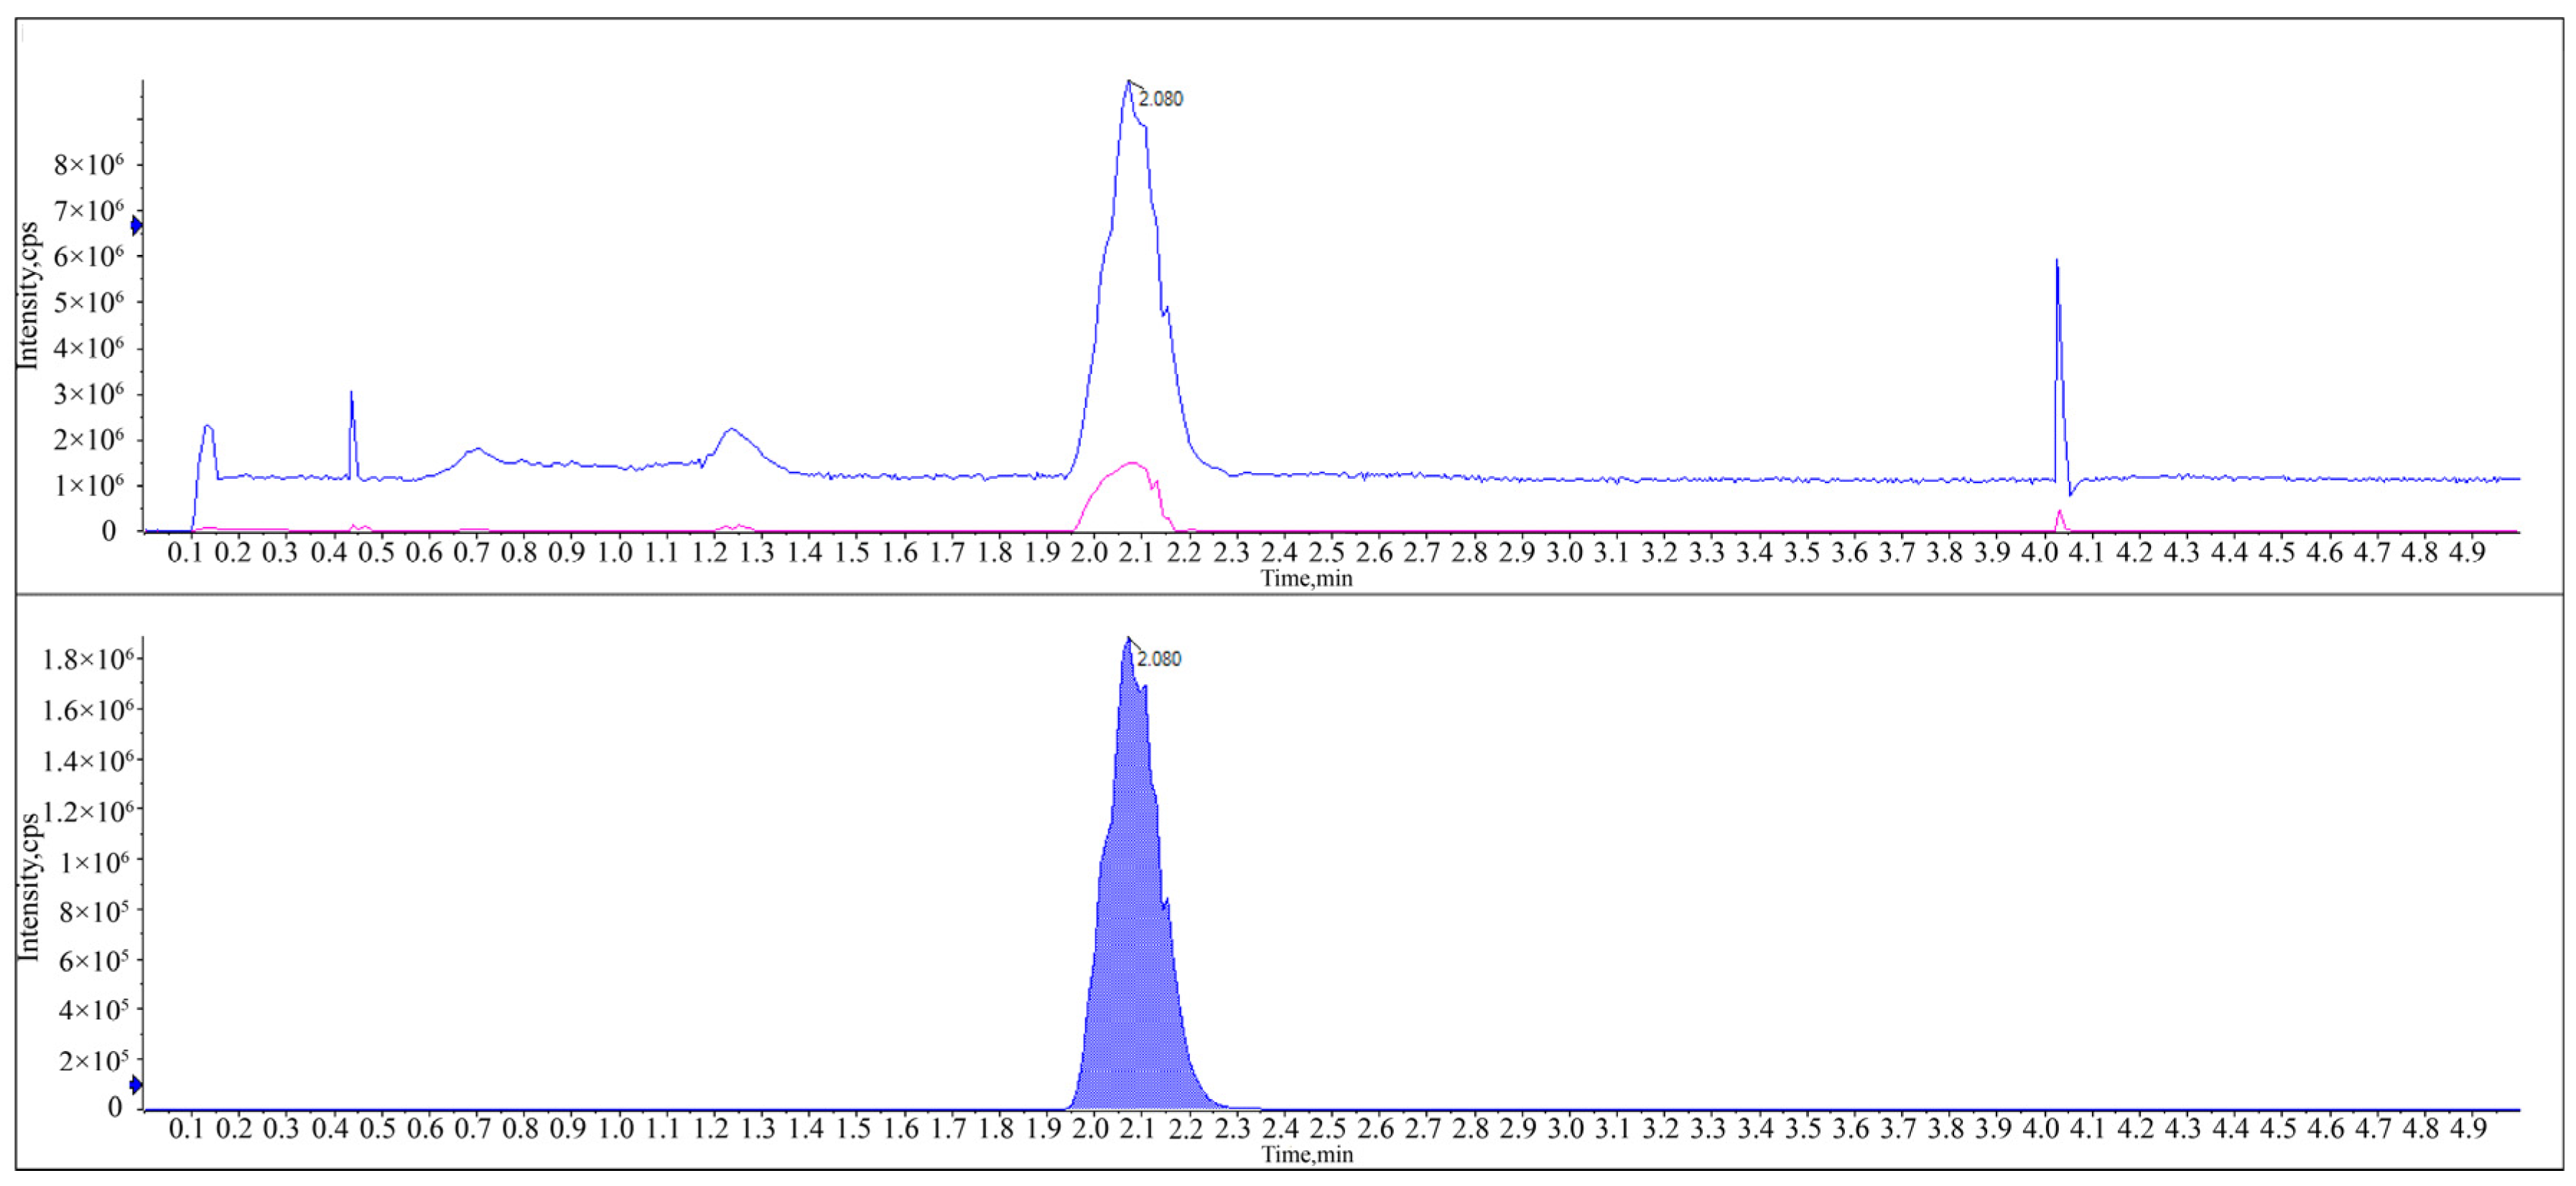
Adding formic acid (0.1%) optimized peak shapes, enhancing sensitivity [23]. However, adding formic acid (0.1%) in acetonitrile–water led to prolonged retention times due to the low acetonitrile ratio, delaying the detection of subsequent samples. Conversely, a high acetonitrile proportion resulted in shorter retention times, introducing impurity peak interference. When using acetonitrile–water with formic acid (0.1%) at a 75:25 volume ratio at a flow rate of 0.5 mL/min, clear separation was achieved between the broflanilide and the impurity peaks. A symmetric peak was obtained with a stable baseline and a shortened retention time of 2.08 min. Hence, this mobile phase offers the optimal composition for the analysis of broflanilide in HPLC. Figure 1 depicts the UHPLC chromatogram of the standard broflanilide sample.
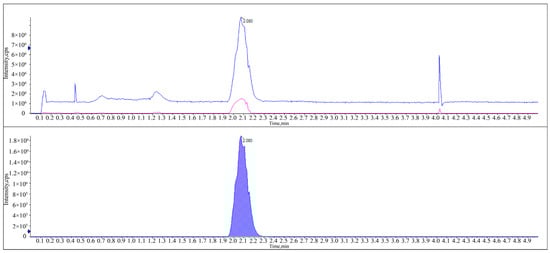
Figure 1.
HPLC chromatograms of broflanilide detected in the standard solution (5 mg·kg−1).
2.2. QuEChERS Method Optimization
2.2.1. Solvent Optimization
The most time-consuming and intricate process in residual pesticide analysis involves the pretreatment of raw samples. The chemical property of the insecticides dictates the choice of solvent for extraction. Commonly employed solvents include acetone [24], acetonitrile [25], methanol [26], ethyl acetate, and dichloromethane [27]. Here, the recovery rates for the paddy soil samples were compared using these solvents. Figure 2 shows that the highest recovery rates were obtained from acetonitrile, reaching 96.73% at a spiked concentration of 0.01 mg/L and 95.34% at a spiked concentration of 0.1 mg/L. Meanwhile, compared with other solvents, acetonitrile offers several additional advantages in pesticide residue analysis, such as minimal interference from lipids and proteins, high compatibility with UHPLC systems, and fewer co-extracted matrix components [28].
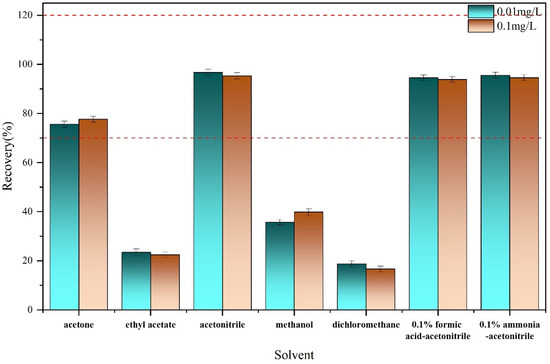
Figure 2.
Effects of a variety of solvents (acetone, ethyl acetate, acetonitrile, methanol, dichloromethane, 0.1%formic acid-acetonitrile, and 0.1% ammonia- acetonitrile) on the recovery of broflanilide in paddy soil samples spiked at levels of 0.01 and 0.1 mg/L (n = 3).
In order to determine whether formic acid and sodium hydroxide have an optimization effect on the recovery, they were added into acetonitrile at 0.1% vol. As shown in Figure 2, there is no improved extraction of Broflanilide in paddy soil, indicating that the acidic or alkaline conditions have no benefit in Broflanilide extraction. The ionization state of Broflanilide in the presence of formic acid and ammonia in acetonitrile and its solubility in the extraction medium may be the reason for this result [29]. Consequently, unmodified acetonitrile was used.
2.2.2. Adsorbent Optimization
Satisfactory extraction of broflanilide diamide was observed for the C18, GCB, and PSA adsorbents using the QuEChERS method. As an anion exchanger, PSA extracts carbohydrates and acids from the mixed sample [30]. C18, on the other hand, is used to extract non-polar and medium-polar compounds due to its non-polar properties. GCB is an effective adsorbent for pigments, such as carotenoids and chlorophyll [31]. Adding MgSO4 and NaCl improves the partition and generates a better phase separation with higher recovery rates [32]. This study used 50 mg of each specific adsorbent (0.1 mg/kg) for broflanilide extraction with added 150 mg MgSO4. As indicated in Table 2, the average recovery rates of various adsorbents in rice soil ranged from 89.85% to 93.81%, satisfying the criteria of the Chinese national agricultural standard between 70% and 120% [33]. Notably, the highest recovery rate of 93.81% was achieved from PSA.
Table 2.
Effects of different sorbents (PSA (primary secondary amine), N-propyl ethylenediamine; C18, octadecylsilane; and GCB, graphitized carbon black) on the recovery of broflanilide in paddy soil spiked at the level of 0.1 mg/L (or mg/kg; n = 3).
The appropriate broflanilide extraction and purification conditions via the QuEChERS procedure are identified with 50 mg of PSA combined with 150 mg of MgSO4.
2.3. Verification of the Method
2.3.1. Linearity, Specificity, LOD, LOQ, and Matrix Effects
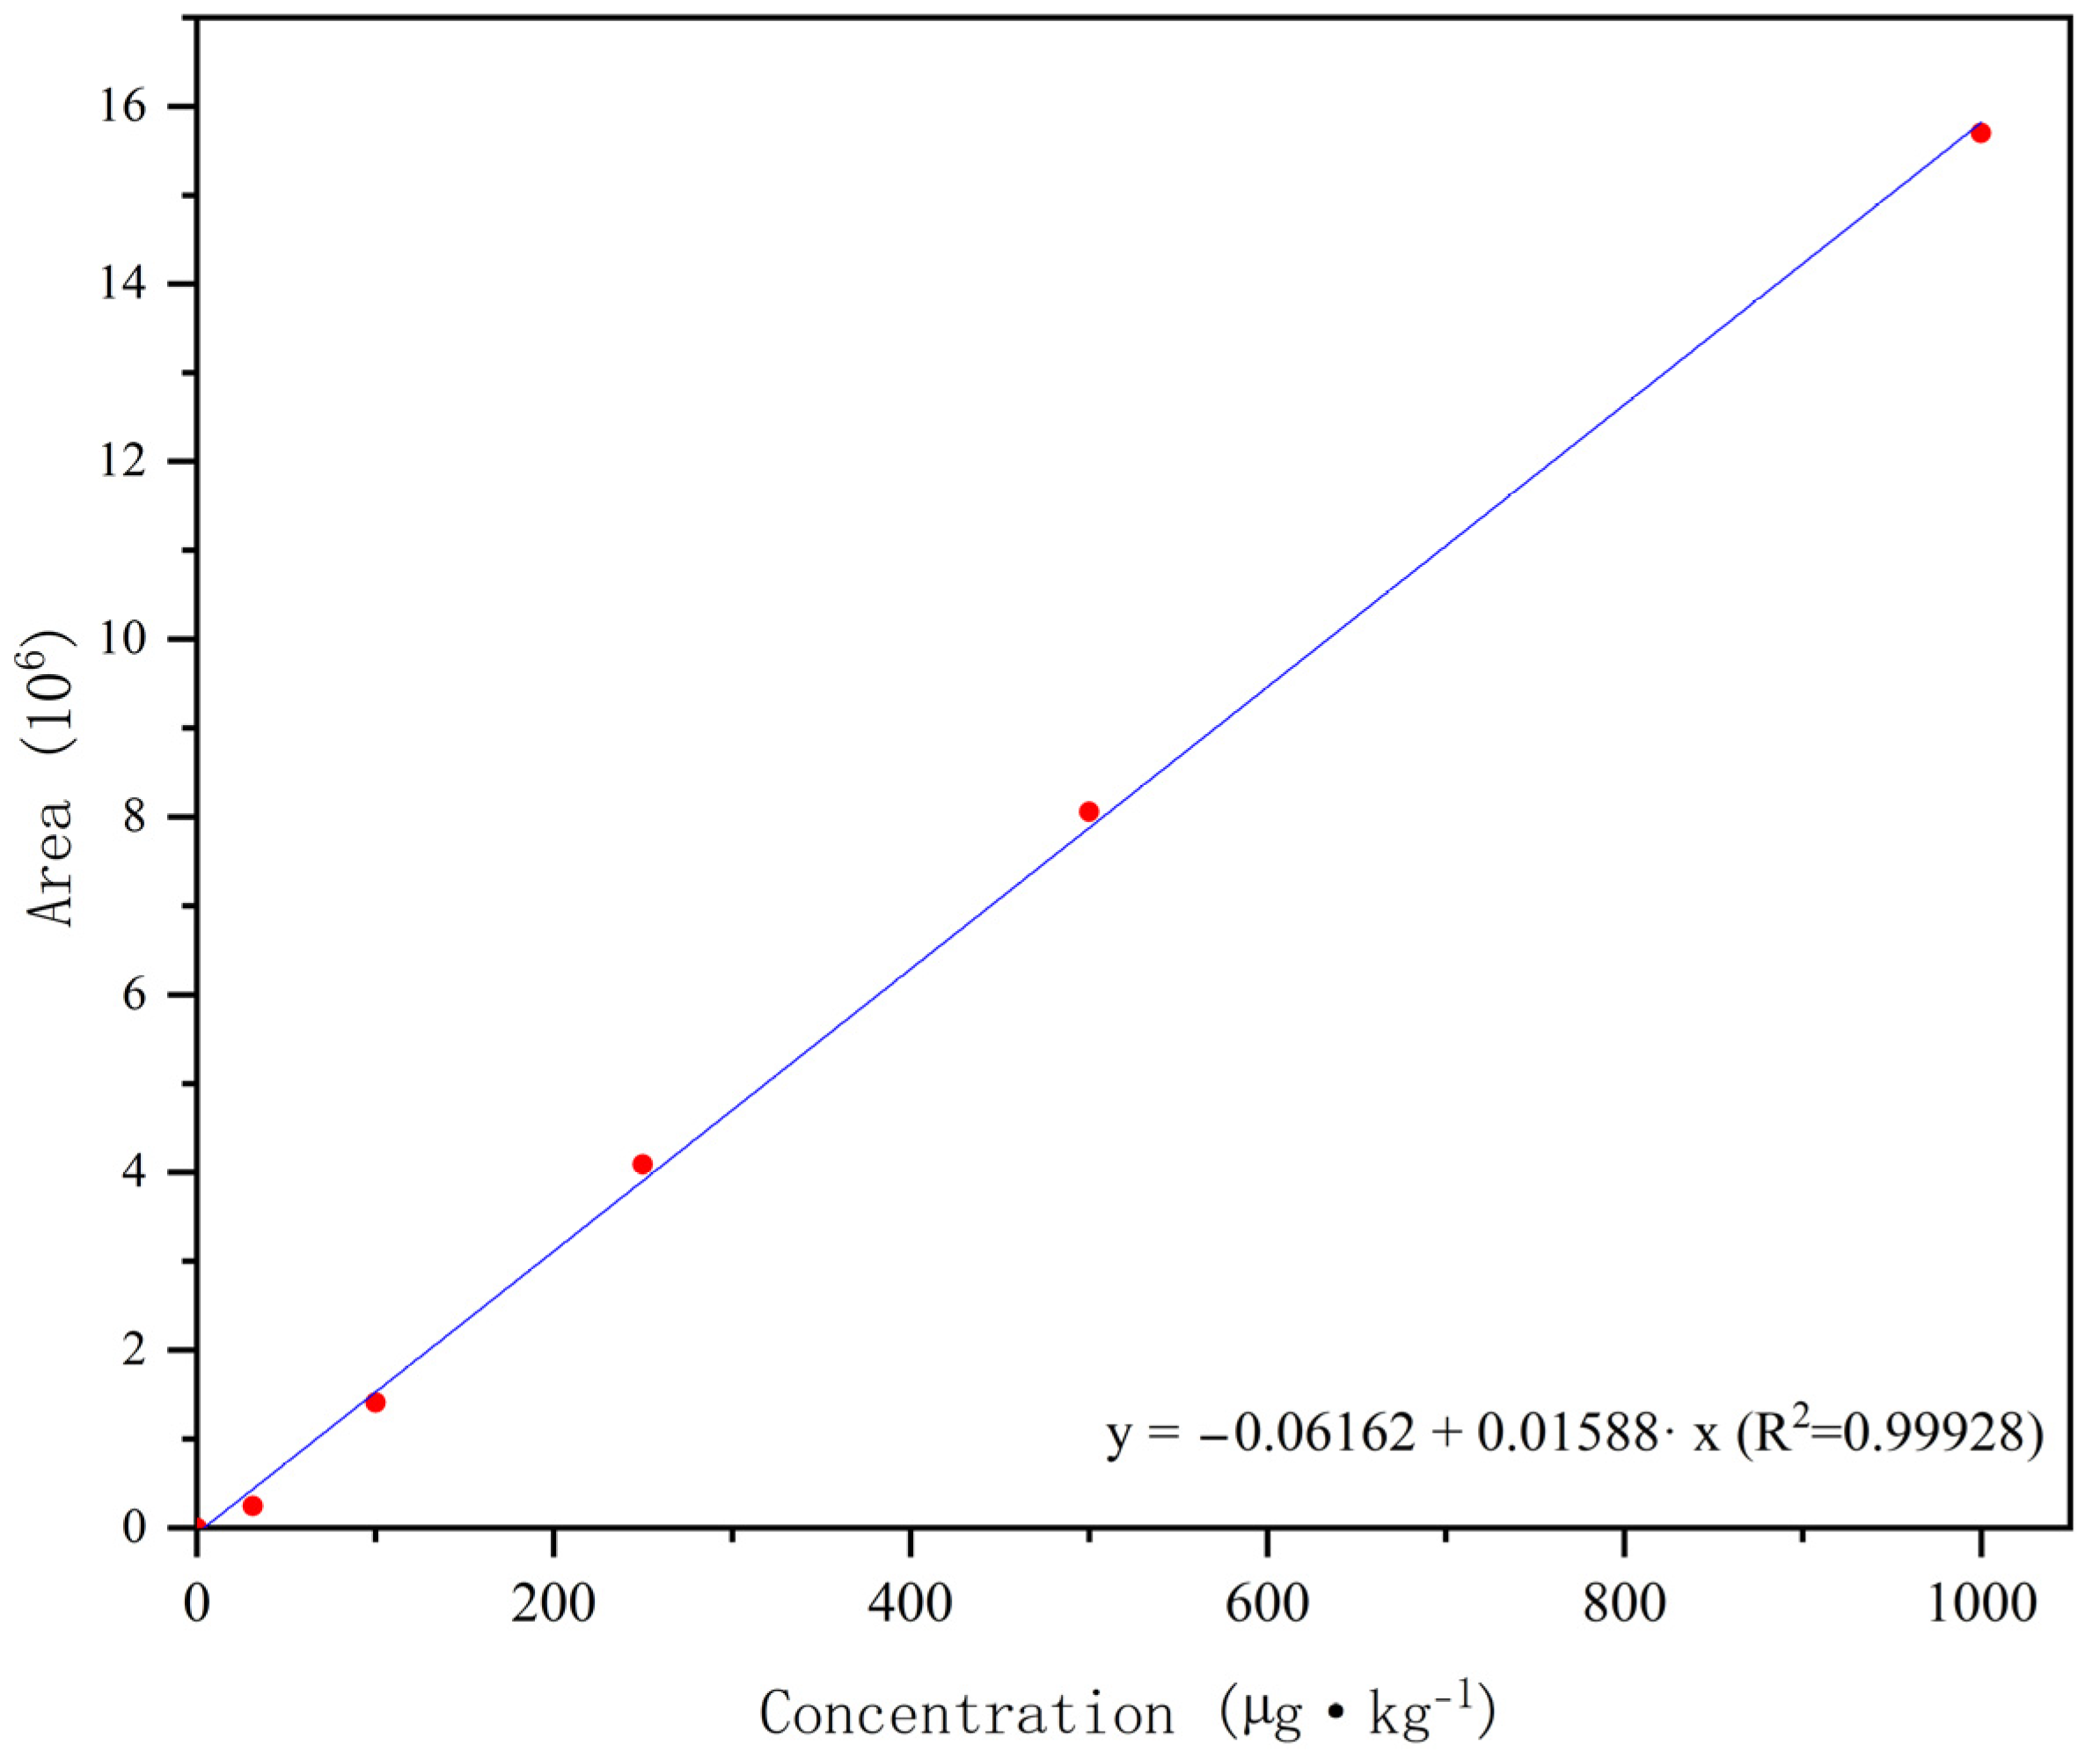
No interference was observed in the blank with various matrices throughout the retention time, indicating that the proposed method had high specificity for Broflanilide. The 5-point calibration plots (31.25, 100, 250, 500, and 1000 μg/kg) were obtained by least squares linear regression, as shown in Figure 3. A good linear relationship was obtained in the matrix test (correlation coefficient >0.999). The Quantification limit (LOQ) and detection limit (LOD) of Broflanilide in soil samples were 5.94 and 1.25 μg/kg, respectively. The matrix effect value in the blank soil sample was −58%. The results showed that broflanilide had a signal inhibition effect in soil samples [34].

Figure 3.
Linear calibration curve of broflanilide and its metabolites in paddy soil.
2.3.2. Accuracy and Precision
Broflanilide was added into blank soil samples at the concentrations of 0.1, 0.5, and 1.0 mg/kg, and the measured recovery rate and the relative standard deviation (RSD) are presented in Table 3. The average broflanilide recovery ranged from 87.7% to 92.91%, with RSD values between 5.49% and 7.51%. These results demonstrate the accuracy and precision of the established method.
Table 3.
Recoveries and relative standard deviations of broflanilide spiked at three concentration levels each (n = 5).
2.4. Application in Practical Research
2.4.1. Applicability Test
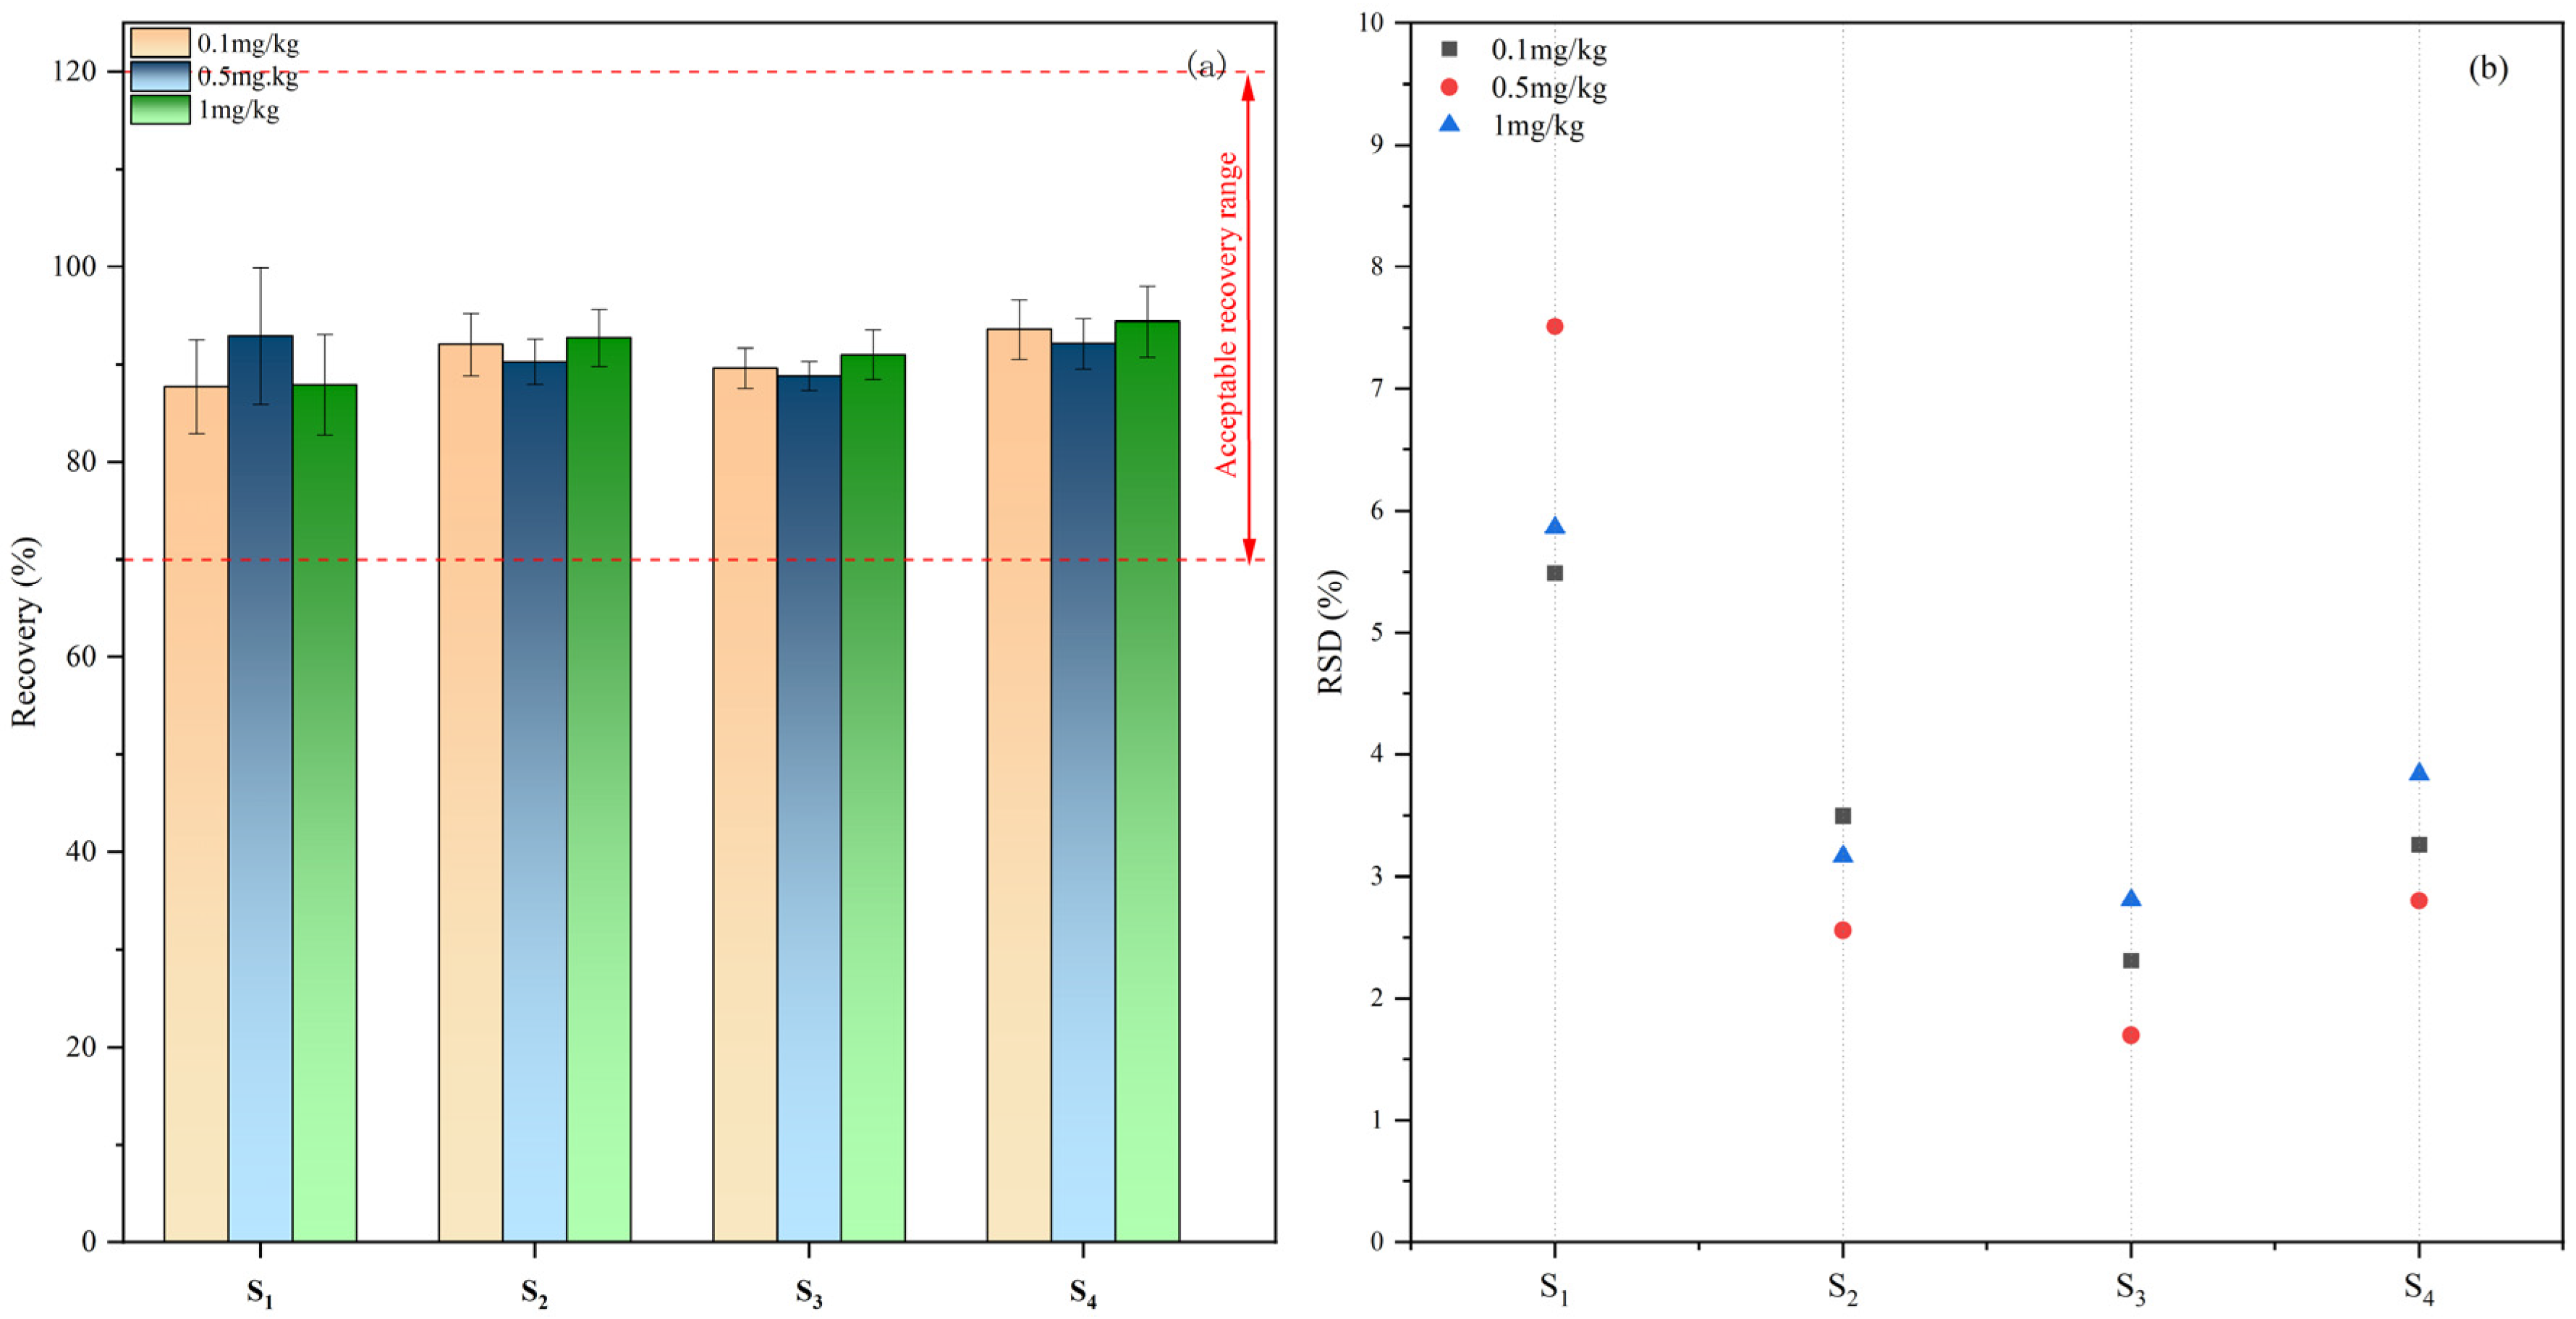
Broflanilide was added to different soil samples at the contents of 0.0, 0.1, 0.5, and 1.0 mg/kg before the adsorption–desorption and leaching experiments and used the improved method for testing. The results in Figure 4 demonstrate the average broflanilide recovery rate was 87.70–94.38% at different spiked concentrations. The RSD distribution map (Figure 4b) showed that the RSD value was 1.70–7.53%. This shows that our method offers high-quality accuracy and precision in different types of soils and can be used to analyze the concentration of broflanilide in different types of soils.
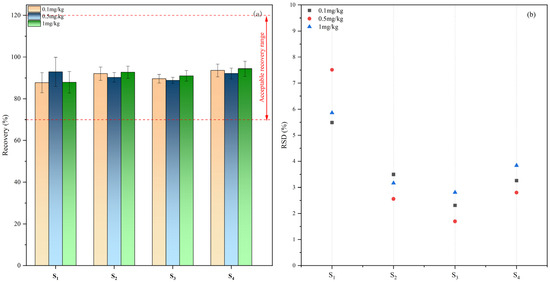
Figure 4.
The recovery (a) and RSD distribution (b) of broflanilide in four agricultural soils.
2.4.2. Application of Soil Adsorption-Desorption
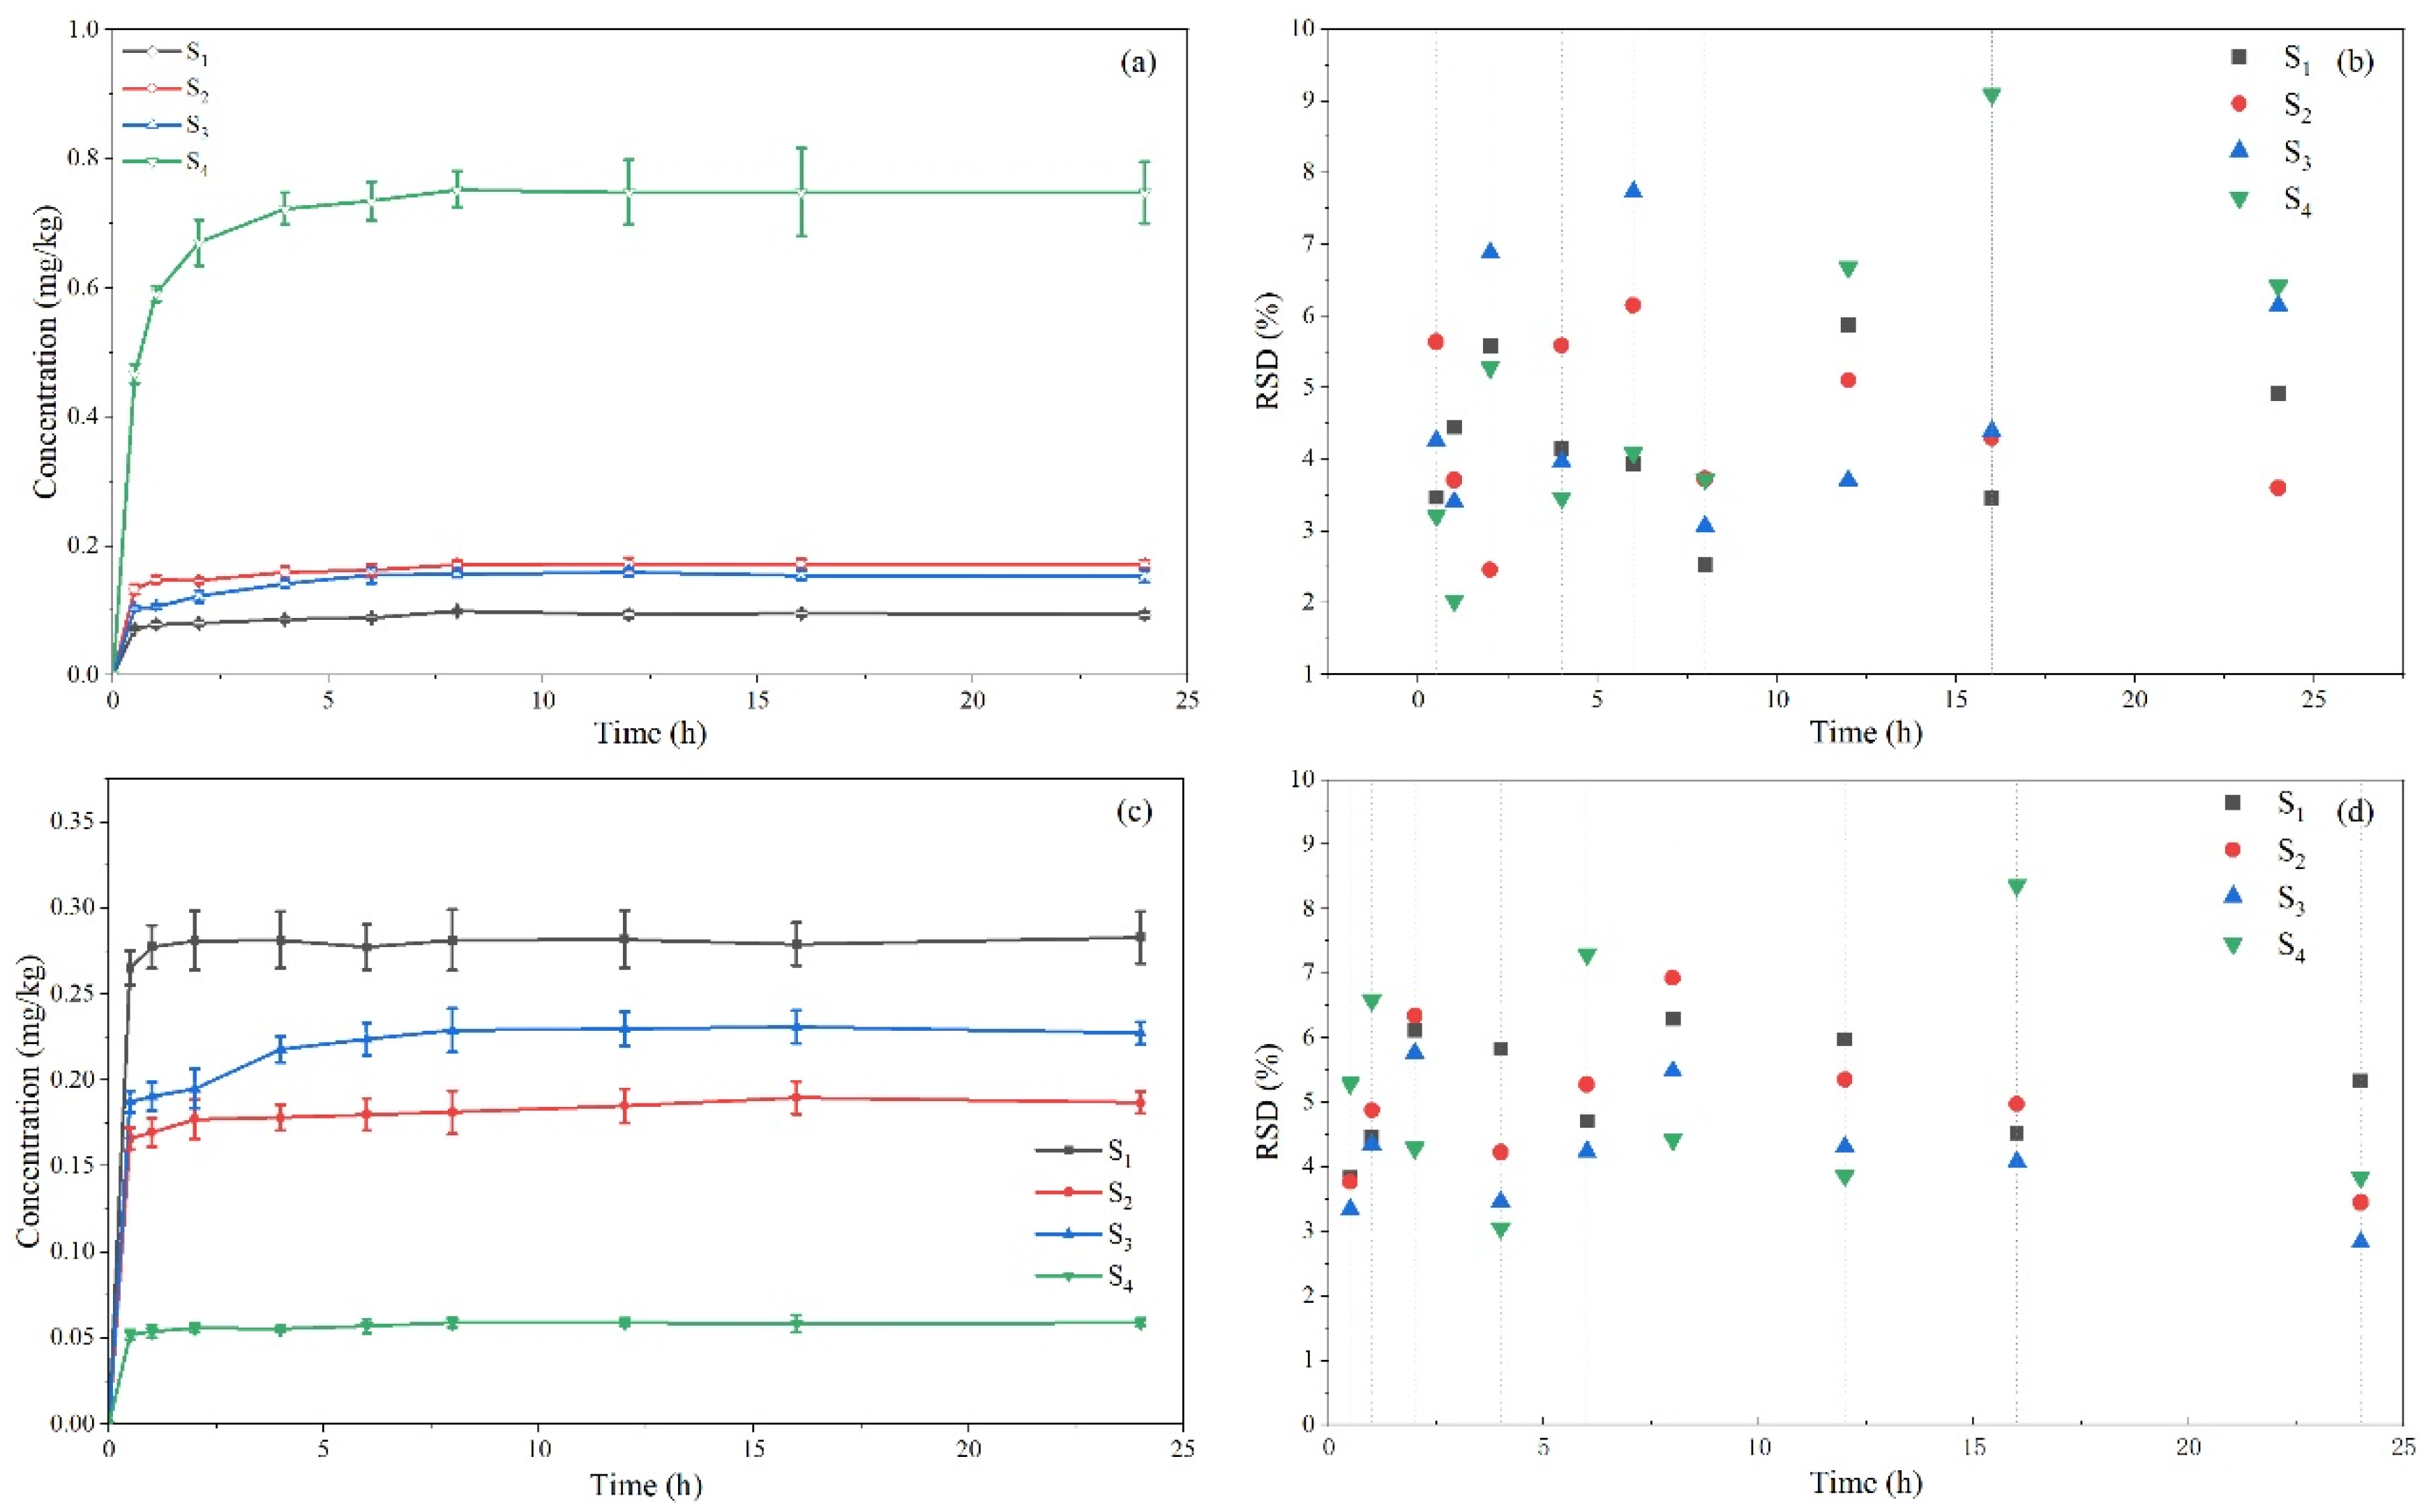
The results of measuring the soil in the adsorption–desorption process are displayed in Figure 5. Phaeozems can better adsorb broflanilide, and it is less likely to be desorbed, determined by its large organic content. From the literature, the adsorption of pesticides in soil is affected by the concentrations of organic composition in soil [35,36,37]. According to the RSD distribution map of the test results, it can be seen that the RSD is lower than 9.2%, so the method discussed in this paper has good stability and can be well applied to soil adsorption–desorption research and detection of broflanilide.
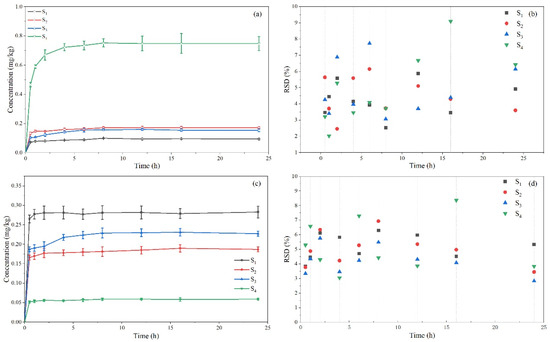
Figure 5.
The content change curves of broflanilide in four different agricultural soils during adsorption (a) and desorption (c) and the RSD distribution graph during adsorption (b) and desorption (d).
2.4.3. Application in Soil Leaching Experiment
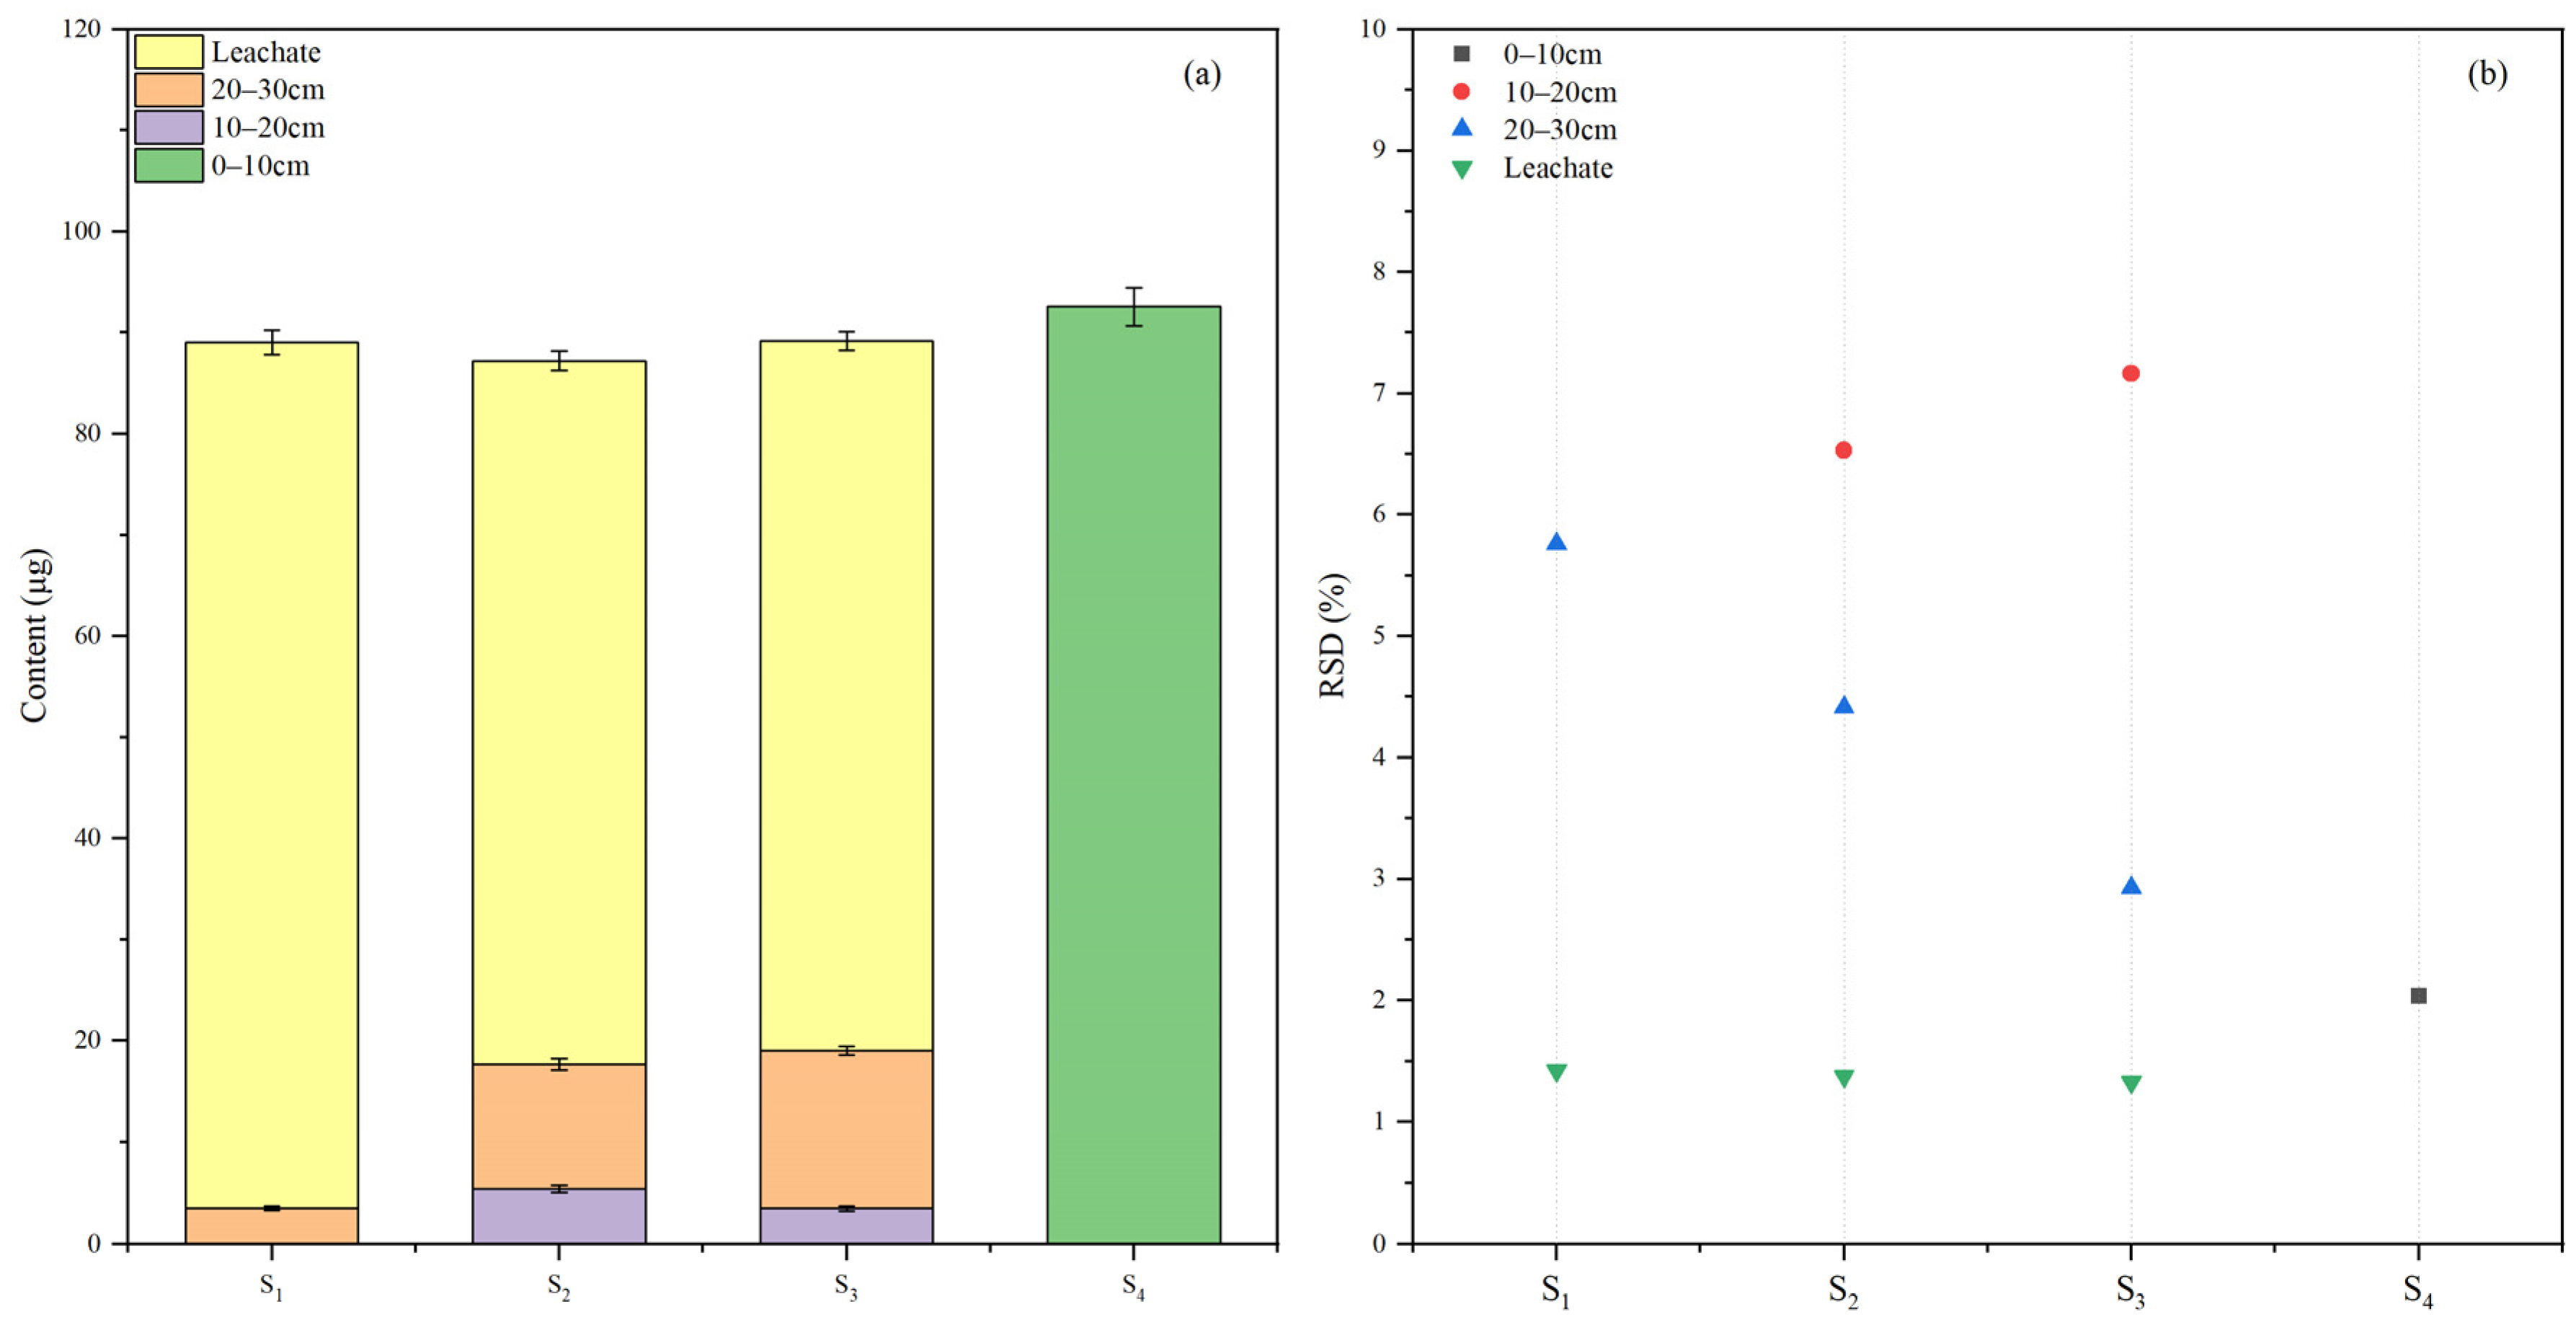
Leaching refers to the vertical downward movement of pesticides when aquatic solutions penetrate the soil. This process involves the comprehensive behavior of pesticide distribution, desorption, and adsorption in conjunction with soil and water interactions [38]. Utilizing the soil column leaching method, we simulated the migration process of broflanilide in natural soil and obtained leaching data, as depicted in Figure 6. The concentration of broflanilide in different soil layers after leaching is related to its adsorption performance, which also determines the mobility of pesticides in soil [39]. Corresponding to the results of adsorption–desorption experiments, Phaeozems had better stability and could stabilize the broflanilide in the surface layer, while other soils did not have such ability. Most of the broflanilide in soil entered the leachate during the leaching process. The RSD of the leaching test results was 1.32–7.16%, indicating that our method offers good applicability and stability for detecting the leaching of broflanilide in soils.

Figure 6.
(a) distribution of broflanilide in soil column and leachate of four different agricultural soils; (b) The RSD value distribution graph of the test results was obtained.
3. Materials and Methods
3.1. Chemicals
Broflanilide (≥99.6%) and its solution (5%) were supplied by Mitsui Chemicals Agro Inc. (Tokyo, Japan). Graphitized carbon black (GCB) (60 μm) was purchased from Nanjing XFNANO Materials Tech Co., Ltd. (Nanjing, China). HCOOH (≥88%, chromatographic grade) was supplied by Tianjin Komio Chemical Reagent Co., Ltd. (Tianjin, China). CH3OH, CH3CN, ethyl acetate, (CH3)2CO, and CH2Cl2 with chromatographic grade were provided by Shantou Xilong Tech. Co., Ltd. (Shantou, China), who also supplied NaOH, NaN3, CaCl2, NaCl and anhydrous MgSO4. C18 (40 μm) and N-propyl ethylenediamine (PSA) (40 μm) were purchased from Tianjin Bonna-Agela Technologies (Tianjin, China). Deionized water was produced using a Milli-Q water purification system.
Broflanilide (101.4 mg) was ultrasonically dissolved in 85 mL acetonitrile in a volumetric flask (100 mL) for 20 min before standing for 40 min at room temperature (RT). The solution (1 mg/mL) was well shaken before being stored at 3 °C. To prepare the working solution, the broflanilide solution was diluted in acetonitrile to 31.25, 100, 250, 500, and 1000 μg/kg concentrations. The matrix-matching standard solution was prepared by adding the blank soil extract to the working solutions. The prepared solutions were refrigerated at −20 °C without light.
3.2. Instrument and Conditions
The broflanilide concentration was determined using ultra-high pressure liquid chromatography (UHPLC) coupled with a quadrupole time-of-flight mass spectrometer AB SCIEX X500R. An isocratic elution process used 40% solvent for 6 min at 0.3 mL/min. A 10 μL sample was injected and kept at 277.15 K.
The spray voltage of the electrospray ion source was 5500 V at 473.15 K. The ion transport tube was maintained at 823.15 K. The pressure of the ion source was 10 bar, while the pressures of the ion source 2 and curtain gas were set at 2 bar. The instrument operated in high-resolution multiple reaction monitoring (HR MRM) scanning mode, measuring the cations and covering a mass range of 100 to 1400 Da. The resolutions of the first and second mass were greater than 26,000 and 25,000 full widths at half maximum, respectively. The collision energy was maintained at 35 ± 15 eV.
3.3. Sample Collection and Pretreatment
The blank sample was obtained from a paddy field plot measuring 10 m × 6 m in Zengjia Village (E 115.1, N 28.3), Jiangxi, China. Samples were collected during the rice harvesting period. 1 kg of paddy soil was collected from each of the five random points at 0–20 cm depth and thoroughly mixed before being air-dried at RT. The soil samples were sieved using a sieve (20-mesh), and a 500 g sub-sample was prepared through four-fold extraction [40].
Following the ISO 10400-206 standard, fresh soils were collected from the farmland surface layer (0–15 cm) without pesticides, fertilizers, and biological additives in April 2023 from 4 different sampling locations detailed in Table 4. Soil samples were collected and transported in sealed vessels to maintain their initial properties. In the lab, all samples were air-dried at RT, lightly crushed, and passed through a 2 mm mesh sieve to remove large stones and debris. The left-over soils were stored at low temperatures (<276.15 K). The used samples were collected and processed by Huagen Environmental Group Co., Ltd. (Nanchang, China) to prevent pollution.
Table 4.
Sampling locations and physicochemical properties of four different agricultural soils.
The physical and chemical characteristics of the soils were determined according to the World Soil Resource Reference (WRB) [41] and the standard protocol [42], as outlined in Table 4. Based on the soil classification system developed by the United Nations Food and Agriculture Organization [43], the four soils (S1 to S4) were classified as Luvisols, Anthrosols, Gleysols, and Phaeozems.
3.4. Validation of Method and Data Analysis
The QuEChERS method proposed here was validated following the guidelines specified by the International Pesticide Analysis Cooperation Committee. Various qualities, including linearity, specificity, accuracy, LOD, LOQ, precision, and matrix effect were comprehensively evaluated across various matrices [44,45].
The blank samples were analyzed to assess specificity. The lack of interference confirmed its specificity to broflanilide. The least squares regression was used to determine the R2, gradient, and intercept based on the measurement from various broflanilide concentrations of 31.25, 100, 250, 500, and 1000 μg/kg. Acceptance criteria for R2 were set at ≥0.99, and the goodness of fit was set at ≤20% [46]. The LOQ and LOD values were also calculated based on SN ratios of 10:1 and 3:1 for the spiked samples, respectively [47].
The matrix effect was assessed using pure CH3CN as the blank. Broflanilide standard solutions were prepared with various concentrations to produce a standard calibration curve in different matrices. The matrix effect constant (ME) was determined below [48]:
where s and m are the slopes of the calibration curve in the solvent and the matrix, respectively. ME > 10% represents the matrix-enhancing effect, while ME < −10% suggests the matrix-inhibiting effect. If the ME values are ±10%, the matrix effect is negligible.
Accuracy and precision were assessed through recovery experiments. To determine accuracy, broflanilide solutions (0.1, 0.5, and 1.0 mg/kg (n = 5)) were added to blank soil samples on three occasions. The broflanilide recovery rate (%) was determined against the calibration curve. Acceptable recovery rates fell from 70% to 120% [49]. Precision was determined by the RSD of the broflanilide recovery rate. A value of less than 20% indicated high precision, otherwise it cannot be accepted. [50].
3.5. Method Application
3.5.1. Applicability Experiment
According to the above recovery test method, the recovery experiments with spiked concentrations of 0.1, 0.5, and 1 mg/kg were carried out on four different soils on three dates, and the recovery rate and RSD of broflanilide were calculated and obtained.
3.5.2. Adsorption-Desorption Experiment
The broflanilide adsorption–desorption in soil was investigated using the equilibrium oscillating method suggested by several reputable organizations, including the U.S. Environmental Protection Agency [51] and the Organization for Economic Co-operation and Development (OECD) [52], as well as a treatment method reported by Jiangxi Agricultural University [40,53]. To prepare the standard solution, 100 mg of NaN3 was dissolved in a 0.01 mol/L CaCl2 solution. To enhance phase separation and inhibit microbial degradation of broflanilide in soils, CaCl2 solution, and NaN3 solution, which mimic the ionic strength of natural soil solution, were used, respectively. The initial concentration of broflanilide was set to 1 mg/L. A 1:5 soil–water (w/v ratio) was maintained. In a centrifuge tube (50 mL), 2.0 g soil was added to 10 mL of the NaN3 and CaCl2 solution. The tubes were then oscillated at 180 rpm using a thermostatic oscillator at RT for varying durations of 0.5, 1, 2, 4, 6, 8, 12, 16, and 24 h to achieve equilibrium. The supernatant was separated, and the soil portion was collected. The soil was then extracted using the method described above and analyzed using UHPLC-QTOF-MS, and the ench sample was repeated 3 times.
After the adsorption experiment, the supernatant was discarded. In addition, CaCl2 injected the same amount of solution into the tube without pesticides. Afterward, the oscillator was used to oscillate the test tube at an ambient temperature of (298.15 ± 1 K). The subsequent operation and analysis were the same as the above adsorption experiment operation.
3.5.3. Leaching Experiment
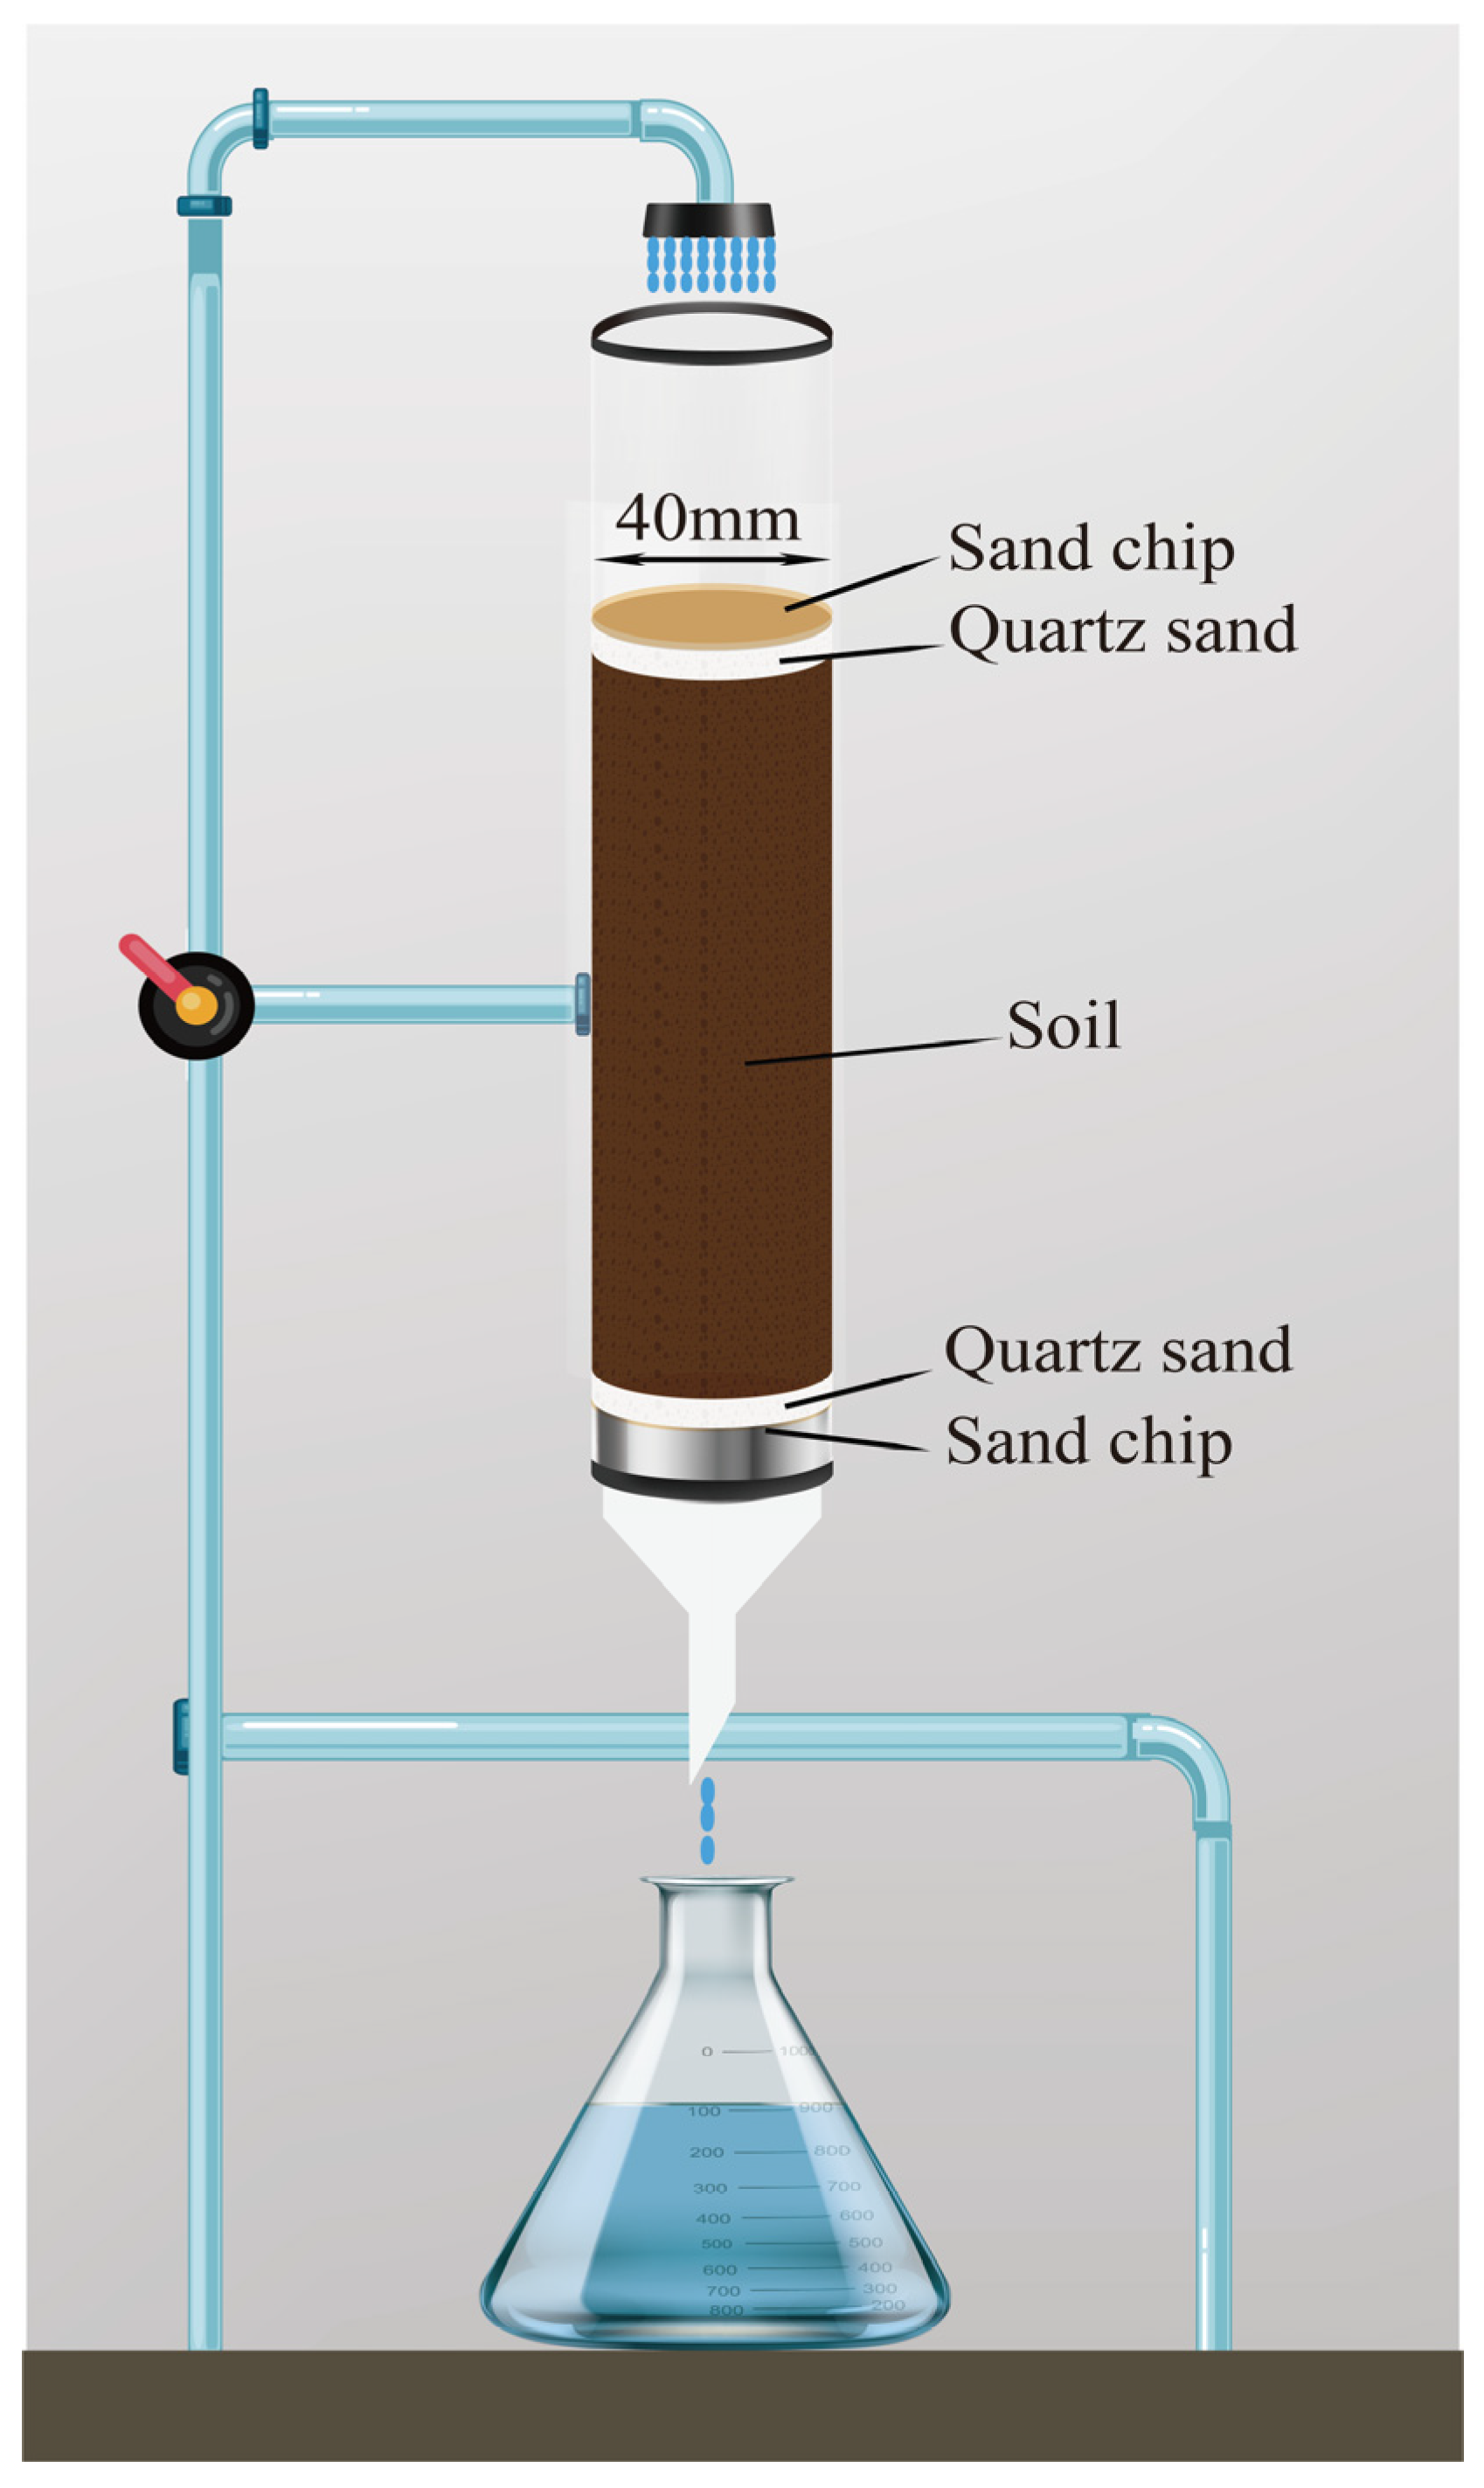
Under saturated flow conditions, the leaching behavior of broflanilide was studied in a filled soil column made of polyethylene plastic pipe (inner diameter 4 cm, height 30 cm), as shown in Figure 7. Two samples fortified with 250 and 500 μg were chosen following the OECD guidelines [52]. Before starting the leaching test, quartz sand (1 cm) and a layer of sand (G1 hole) were added to the bottom and top of the soil column to avoid soil disturbance. To eliminate any trapped air, the soil column was tightly packed with 500 to 700 g of soil. Subsequently, the reverse osmosis method utilizing a 0.01 mol/L CaCl2 solution was employed [54]. The remaining water was eliminated using a blow dryer. Then, 700 μL of a 100 mg/L broflanilide solution was infiltrated onto the soil surface. The oil sample was soaked for 24 h to reach adsorption equilibrium. For simulating rainfall leaching, 2000 mL of 0.01 mol/L CaCl2 solution was fed through the soil samples with a peristaltic pump operating for 96 h. The leachate was collected every 8 h in conical flasks. After completion of the leaching experiment, the soil column was removed and cut into three sections that were 10 cm long. The broflanilide was then extracted using the QuEChERS method, and the residue was quantified using UHPLC-QTOF-MS to determine the broflanilide content in both the leachate and soil components.
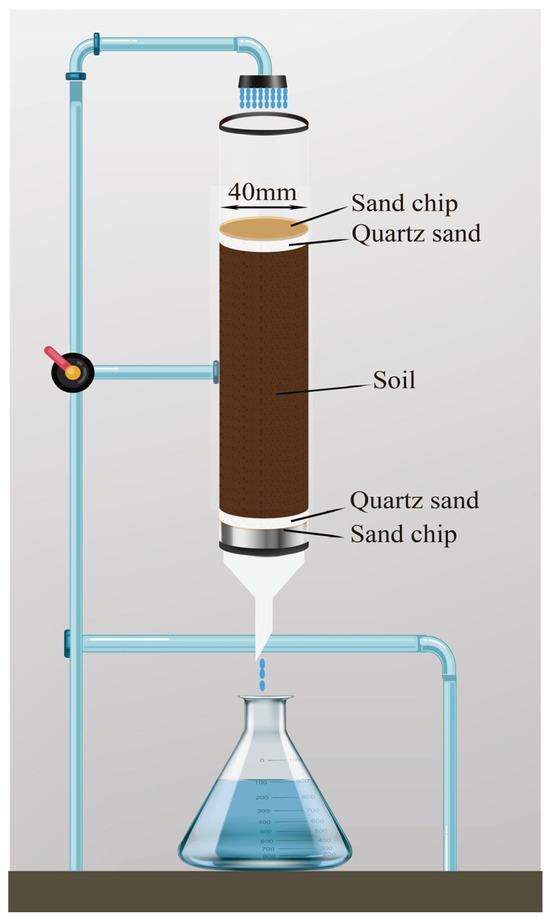
Figure 7.
Sketch of soil column used in leaching experiment.
4. Conclusions
In this study, the separation conditions in the UHPLC-ESI-QTOF-MS method and the solvents and adsorbents in the QuEChERS method were optimized, and the specificity, linearity, accuracy, and precision of the method were successfully verified. Based on these works, an efficient, rapid, and sensitive method for the detection and analysis of the content of broflanilide in soil was established, and it obtained a good recovery rate when applied to the determination of the content of broflanilide in four types of soil at different spiked concentrations. This method showed excellent stability in the adsorption–desorption and leaching experiments applied to the soil. And the precise measurement results make it easy to analyze the behavior of broflanilide in soil. This study provides an effective method for the determination of the content of broflanilide in different types of soil and the experimental study of adsorption–desorption and leaching.
Author Contributions
G.X. is responsible for writing Section 1, Section 2 and Section 4, and performed most experiments. X.N. is responsible for writing Section 3. Z.H. guided and carried out the leaching experiments and adsorption-desorption experiments. B.Z. analyzed the data in Section 2 and Section 3. H.L. provided the ideas of the experiments, and designed the structure of this paper. Y.H. analyzed the data in Section 4. X.L. advised on the choice of methodology. L.D. repeated the experiment in this paper. S.H. handled the test samples. A.Y. directed and participated the experiments on extraction and detection of soil samples. All authors have read and agreed to the published version of the manuscript.
Funding
This research was funded by Comprehensive survey of ecological restoration in key areas of Wuyi Mountain (No. DD20230479); Investigation of surface matrix in typical red soil area of Nanping City (No. DD20220865); Jiangxi Forestry Bureau Forestry Science and Technology Innovation Project (No. 2022-12); Doctoral Initiation Project, Jiangxi Academy of Forestry (No. 2022522501); Youth Talent Training Project, Jiangxi Academy of Forestry(No. 2022512501); Special Project of Basic Research and Talent Research, Jiangxi Academy of Forestry (No. 2024512502); Camphor tree research project of Jiangxi Forestry Bureau (No. 2020-07); The Geological Survey commissioned by Changsha Natural Resources Comprehensive Survey Center, China Geological Survey (No. 2023-179); the Training Program for Academic and Technical Leaders of Major Discipline in Jiangxi Province-Young Talent Project (No. 20212BCJ23013); The Key R&D Program of Jiangxi Science and Technology Department (No. 20212BBF63046).
Institutional Review Board Statement
Not applicable.
Informed Consent Statement
The research did not involve human participants and/or animals.
Data Availability Statement
Data are contained within the article.
Acknowledgments
The authors would like to express their gratitude to EditSprings (https://www.editsprings.com/), accessed on 24 February 2024, for the expert linguistic services provided.
Conflicts of Interest
The authors declare that they have no conflicts of interest.
References
- Godfray, H.C.J.; Beddington, J.R.; Crute, I.R.; Haddad, L.; Lawrence, D.; Muir, J.F.; Pretty, J.; Robinson, S.; Thomas, S.M.; Toulmin, C. Food Security: The Challenge of Feeding 9 Billion People. Science 2010, 327, 812–818. [Google Scholar] [CrossRef]
- Sparks, T.C.; Hahn, D.R.; Garizi, N.V. Natural products, their derivatives, mimics and synthetic equivalents: Role in agrochemical discovery. Pest Manag. Sci. 2017, 73, 700–715. [Google Scholar] [CrossRef]
- Oerke, E.C.; Dehne, H.W. Safeguarding production—Losses in major crops and the role of crop protection. Crop Protect. 2004, 23, 275–285. [Google Scholar] [CrossRef]
- van der Werf, H.M. Assessing the impact of pesticides on the environment. Agric. Ecosyst. Environ. 1996, 60, 81–96. [Google Scholar] [CrossRef]
- Pimentel, D.; Burgess, M. Small Amounts of Pesticides Reaching Target Insects; Springer: Berlin/Heidelberg, Germany, 2012; Volume 14, pp. 1–2. [Google Scholar]
- Navarro, S.; Vela, N.; Navarro, G. An overview on the environmental behaviour of pesticide residues in soils. Span. J. Agric. Res. 2007, 5, 357–375. [Google Scholar] [CrossRef]
- Calderbank, A. The occurrence and significance of bound pesticide residues in soil. In Reviews of Environmental Contamination and Toxicology; Springer: New York, NY, USA, 1989; pp. 71–103. [Google Scholar]
- Chiou, C.T.; Sheng, G.; Manes, M. A partition-limited model for the plant uptake of organic contaminants from soil and water. Environ. Sci. Technol. 2001, 35, 1437–1444. [Google Scholar] [CrossRef] [PubMed]
- Qi, H.; Cui, L.; Wang, Q.; Liu, F.; Rui, C. Toxicity of broflanilide to Plutella xylostella and its influence on the activities of related enzymes in P. xylostella. Plant Prot. 2017, 43, 112–116. [Google Scholar]
- Nakao, T.; Banba, S. Broflanilide: A meta-diamide insecticide with a novel mode of action. Biorg. Med. Chem. 2016, 24, 372–377. [Google Scholar] [CrossRef] [PubMed]
- Cui, Y.; Wang, S.; Mao, X.; Gao, X.; Ge, H.; Qu, S.; Qiao, X.; Jiang, X.; Wang, J.; Li, G. Hydrolytic Behavior of Novel Pesticide Broflanilide and Its Dissipative Properties in Different Types of Soils. Bull. Environ. Contam. Toxicol. 2023, 111, 8. [Google Scholar] [CrossRef] [PubMed]
- Anastassiades, M.; Lehotay, S.J.; Štajnbaher, D.; Schenck, F.J. Fast and easy multiresidue method employing acetonitrile extraction/partitioning and “dispersive solid-phase extraction” for the determination of pesticide residues in produce. J. AOAC Int. 2003, 86, 412–431. [Google Scholar] [CrossRef] [PubMed]
- Perestrelo, R.; Silva, P.; Porto-Figueira, P.; Pereira, J.A.M.; Silva, C.; Medina, S.; Câmara, J.S. QuEChERS—Fundamentals, relevant improvements, applications and future trends. Anal. Chim. Acta 2019, 1070, 1–28. [Google Scholar] [CrossRef] [PubMed]
- Wang, J.; Chow, W.; Leung, D. Applications of LC/ESI-MS/MS and UHPLC QqTOF MS for the determination of 148 pesticides in fruits and vegetables. Anal. Bioanal. Chem. 2010, 396, 1513–1538. [Google Scholar] [CrossRef] [PubMed]
- Ribeiro Begnini Konatu, F.; Sales Fontes Jardim, I.C. Development and validation of an analytical method for multiresidue determination of pesticides in lettuce using QuEChERS–UHPLC–MS/MS. J. Sep. Sci. 2018, 41, 1726–1733. [Google Scholar] [CrossRef] [PubMed]
- Chen, Y.; Guo, M.; Liu, X.; Xu, J.; Dong, F.; Wu, X.; Li, B.; Zheng, Y. Determination and dissipation of afidopyropen and its metabolite in wheat and soil using QuEChERS–UHPLC–MS/MS. J. Sep. Sci. 2018, 41, 1674–1681. [Google Scholar] [CrossRef] [PubMed]
- Xie, G.; Zhou, W.; Jin, M.; Yu, A.; Rao, L.; Jia, H.; Luo, J.; He, Y.; Li, B. Residues Analysis and Dissipation Dynamics of Broflanilide in Rice and Its Related Environmental Samples. Int. J. Anal. Chem. 2020, 2020, 8845387. [Google Scholar] [CrossRef] [PubMed]
- Žuvela, P.; Skoczylas, M.; Jay Liu, J.; Ba̧czek, T.; Kaliszan, R.; Wong, M.W.; Buszewski, B. Column Characterization and Selection Systems in Reversed-Phase High-Performance Liquid Chromatography. Chem. Rev. 2019, 119, 3674–3729. [Google Scholar] [CrossRef] [PubMed]
- Carr, P.W.; Doherty, R.M.; Kamlet, M.J.; Taft, R.W.; Melander, W.; Horvath, C. Study of temperature and mobile-phase effects in reversed-phase high-performance liquid chromatography by the use of the solvatochromic comparison method. Anal. Chem. 1986, 58, 2674–2680. [Google Scholar] [CrossRef] [PubMed]
- Stalcup, A.M.; Martire, D.E.; Wise, S.A. Thermodynamic comparison of monomeric and polymeric C18 bonded phases using aqueous methanol and acetonitrile mobile phases. J. Chromatogr. A 1988, 442, 1–14. [Google Scholar] [CrossRef]
- Alvarez-Zepeda, A.; Barman, B.N.; Martire, D.E. Thermodynamic study of the marked differences between acetonitrile/water and methanol/water mobile-phase systems in reversed-phase liquid chromatography. Anal. Chem. 1992, 64, 1978–1984. [Google Scholar] [CrossRef]
- Rafferty, J.L.; Siepmann, J.I.; Schure, M.R. Mobile phase effects in reversed-phase liquid chromatography: A comparison of acetonitrile/water and methanol/water solvents as studied by molecular simulation. J. Chromatogr. A 2011, 1218, 2203–2213. [Google Scholar] [CrossRef]
- Sun, H.; Dong, X.; Lu, X.; Wang, H.; Han, J. Separation and determination of fluoroquinolones with a molecularly imprinted polymer. Chin. J. Chromatogr. 2003, 21, 233–238. [Google Scholar]
- Payá, P.; Anastassiades, M.; Mack, D.; Sigalova, I.; Tasdelen, B.; Oliva, J.; Barba, A. Analysis of pesticide residues using the Quick Easy Cheap Effective Rugged and Safe (QuEChERS) pesticide multiresidue method in combination with gas and liquid chromatography and tandem mass spectrometric detection. Anal. Bioanal. Chem. 2007, 389, 1697–1714. [Google Scholar] [CrossRef]
- Hajjo, R.; Afifi, F.; Battah, A. Multiresidue pesticide analysis of the medicinal plant Origanum syriacum. Food Addit. Contam. 2007, 24, 274–279. [Google Scholar] [CrossRef]
- Riaz, M.; Bilal Butt, S. Gamma radiolytic degradation of the endrin insecticide in methanol and monitoring of radiolytic degradation products by HPLC. J. Radioanal. Nucl. Chem. 2010, 285, 697–701. [Google Scholar] [CrossRef]
- Nordmeyer, K.; Thier, H.-P. Solid-phase extraction for replacing dichloromethane partitioning in pesticide multiresidue analysis. Z. Für Leb. Und-Forsch. A 1999, 208, 259–263. [Google Scholar] [CrossRef]
- Chen, G.; Cao, P.; Liu, R. A multi-residue method for fast determination of pesticides in tea by ultra performance liquid chromatography–electrospray tandem mass spectrometry combined with modified QuEChERS sample preparation procedure. Food Chem. 2011, 125, 1406–1411. [Google Scholar] [CrossRef]
- Zhang, Q.; Xiao, C.; Wang, W.; Qian, M.; Xu, J.; Yang, H. Chromatography column comparison and rapid pretreatment for the simultaneous analysis of amantadine, rimantadine, acyclovir, ribavirin, and moroxydine in chicken muscle by ultra high performance liquid chromatography and tandem mass spectrometry. J. Sep. Sci. 2016, 39, 3998–4010. [Google Scholar] [CrossRef] [PubMed]
- Li, S.; Liu, X.; Dong, F.; Xu, J.; Xu, H.; Hu, M.; Zheng, Y. Chemometric-assisted QuEChERS extraction method for the residual analysis of thiacloprid, spirotetramat and spirotetramat’s four metabolites in pepper: Application of their dissipation patterns. Food Chem. 2016, 192, 893–899. [Google Scholar] [CrossRef] [PubMed]
- Lehotay, S.J. Quick, easy, cheap, effective, rugged, and safe approach for determining pesticide residues. Pestic. Protoc. 2006, 239–261. [Google Scholar]
- Brondi, S.H.; De Macedo, A.N.; de Souza, G.B.; Nogueira, A.R. Application of QuEChERS method and gas chromatography-mass spectrometry for the analysis of cypermethrin residue in milk. J. Environ. Sci. Health Part B 2011, 46, 671–677. [Google Scholar]
- Ministy of Agriculture and Rural Affairs of the People’s Republic of China. Guideline for the Testing of Pesticide Resudues in Crops; Ministy of Agriculture and Rural Affairs of the People’s Republic of China: Beijing, China, 2018.
- Wang, Y.-Q.; Ye, D.-Q.; Zhu, B.-Q.; Wu, G.-F.; Duan, C.-Q. Rapid HPLC analysis of amino acids and biogenic amines in wines during fermentation and evaluation of matrix effect. Food Chem. 2014, 163, 6–15. [Google Scholar] [CrossRef] [PubMed]
- Zhang, Y.; Li, W.; Zhou, W.; Jia, H.; Li, B. Adsorption-desorption characteristics of pyraclonil in eight agricultural soils. J. Soils Sed. 2020, 20, 1404–1412. [Google Scholar] [CrossRef]
- Plakas, K.V.; Karabelas, A.J. Membrane retention of herbicides from single and multi-solute media: The effect of ionic environment. J. Membr. Sci. 2008, 320, 325–334. [Google Scholar] [CrossRef]
- Zhang, J.; Zhaojun, L.; Gaofei, G.; Wanchun, S.; Liang, Y.; Laosheng, W. Impacts of soil organic matter, pH and exogenous copper on sorption behavior of norfloxacin in three soils. J. Environ. Sci. 2009, 21, 632–640. [Google Scholar] [CrossRef] [PubMed]
- Xu, X.; Song, W.; Wang, M. Adsorption-desorption and leaching characteristics of fluazinam in soils. China Environ. Sci. 2013, 33, 669–673. [Google Scholar]
- Xie, G.; Li, B.; Tang, L.; Rao, L.; Dong, Z. Adsorption-desorption and leaching behaviors of broflanilide in four texturally different agricultural soils from China. J. Soils Sed. 2021, 21, 724–735. [Google Scholar] [CrossRef]
- Li, W.; Zhang, Y.; Jia, H.; Zhou, W.; Li, B.; Huang, H. Residue analysis of tetraniliprole in rice and related environmental samples by HPLC/MS. Microchem. J. 2019, 150, 104168. [Google Scholar] [CrossRef]
- L’Huillier, L.; Dupont, S.; Dubus, I.; Becquer, T.; Bourdon, E.; Laubreaux, P.; Bonzon, B. Carence et fixation du phosphore dans les sols ferrallitiques ferritiques de Nouvelle-Calédonie. XVIe Congrès Mondial de Science du Sol 1998, 8, 20–26. [Google Scholar]
- Piper, C.S. Soil and Plant Analysis; Scientific Publishers: Jodhpur, India, 2019. [Google Scholar]
- Deckers, J.; Driessen, P.; Nachtergaele, F.; Spaargaren, O. World reference base for soil resources. In Encyclopedia of Soil Science; Marcel Dekker: New York, NY, USA, 2002; pp. 1446–1451. [Google Scholar]
- Fanigliulo, A.; De Filippis, P.; Curcuruto, O.; Repeto, P.; Roveda, D.; Hartenstein, M.; Adams, E.; Cabooter, D. Development and validation of a stability indicating method for s-carboxymethyl-l-cysteine and related degradation products in oral syrup formulation. J. Pharm. Biomed. Anal. 2015, 115, 39–47. [Google Scholar] [CrossRef] [PubMed]
- Seccia, S.; Albrizio, S.; Fidente, P.; Montesano, D. Development and validation of a solid-phase extraction method coupled to high-performance liquid chromatography with ultraviolet-diode array detection for the determination of sulfonylurea herbicide residues in bovine milk samples. J. Chromatogr. A 2011, 1218, 1253–1259. [Google Scholar] [CrossRef] [PubMed]
- Kuang, Y.; Qiu, F.; Kong, W.; Luo, J.; Cheng, H.; Yang, M. Simultaneous quantification of mycotoxins and pesticide residues in ginseng with one-step extraction using ultra-high performance liquid chromatography–electrospray ionization tandem mass spectrometry. J. Chromatogr. B 2013, 939, 98–107. [Google Scholar] [CrossRef] [PubMed]
- Guideline, I.H.T. Validation of analytical procedures: Text and methodology. Q2 (R1) 2005, 1, 05. [Google Scholar]
- Zhu, Y.; Liu, X.; Xu, J.; Dong, F.; Liang, X.; Li, M.; Duan, L.; Zheng, Y. Simultaneous determination of spirotetramat and its four metabolites in fruits and vegetables using a modified quick, easy, cheap, effective, rugged, and safe method and liquid chromatography/tandem mass spectrometry. J. Chromatogr. A 2013, 1299, 71–77. [Google Scholar] [CrossRef] [PubMed]
- Garrido Frenich, A.; González-Rodríguez, M.J.; Arrebola, F.J.; Martínez Vidal, J.L. Potentiality of gas chromatography−triple quadrupole mass spectrometry in vanguard and rearguard methods of pesticide residues in vegetables. Anal. Chem. 2005, 77, 4640–4648. [Google Scholar] [CrossRef] [PubMed]
- Zapata, M.; Rodríguez, F.; Garrido, J.L. Separation of chlorophylls and carotenoids from marine phytoplankton: A new HPLC method using a reversed phase C8 column and pyridine-containing mobile phases. Mar. Ecol. Prog. Ser. 2000, 195, 29–45. [Google Scholar] [CrossRef]
- Prevention, P. United States Environmental Protection Agency. Hospital 2020, 3862, 104. [Google Scholar]
- Guideline, P.-B.T. OECD guideline for the testing of chemicals. Hershberger 2001, 601, 858. [Google Scholar]
- Rao, L.; Luo, J.; Zhou, W.; Zou, Z.; Tang, L.; Li, B. Adsorption–desorption behavior of benzobicyclon hydrolysate in different agricultural soils in China. Ecotoxicol. Environ. Saf. 2020, 202, 110915. [Google Scholar] [CrossRef]
- Gupta, V.K.; Ali, I. Water treatment by reverse osmosis method. Environ. Water 2013, 117–134. [Google Scholar]

Disclaimer/Publisher’s Note: The statements, opinions and data contained in all publications are solely those of the individual author(s) and contributor(s) and not of MDPI and/or the editor(s). MDPI and/or the editor(s) disclaim responsibility for any injury to people or property resulting from any ideas, methods, instructions or products referred to in the content. |
© 2024 by the authors. Licensee MDPI, Basel, Switzerland. This article is an open access article distributed under the terms and conditions of the Creative Commons Attribution (CC BY) license (https://creativecommons.org/licenses/by/4.0/).