
Design, Synthesis, and Anti-Leukemic Evaluation of a Series of Dianilinopyrimidines by Regulating the Ras/Raf/MEK/ERK and STAT3/c-Myc Pathways
Abstract
:1. Introduction
2. Results
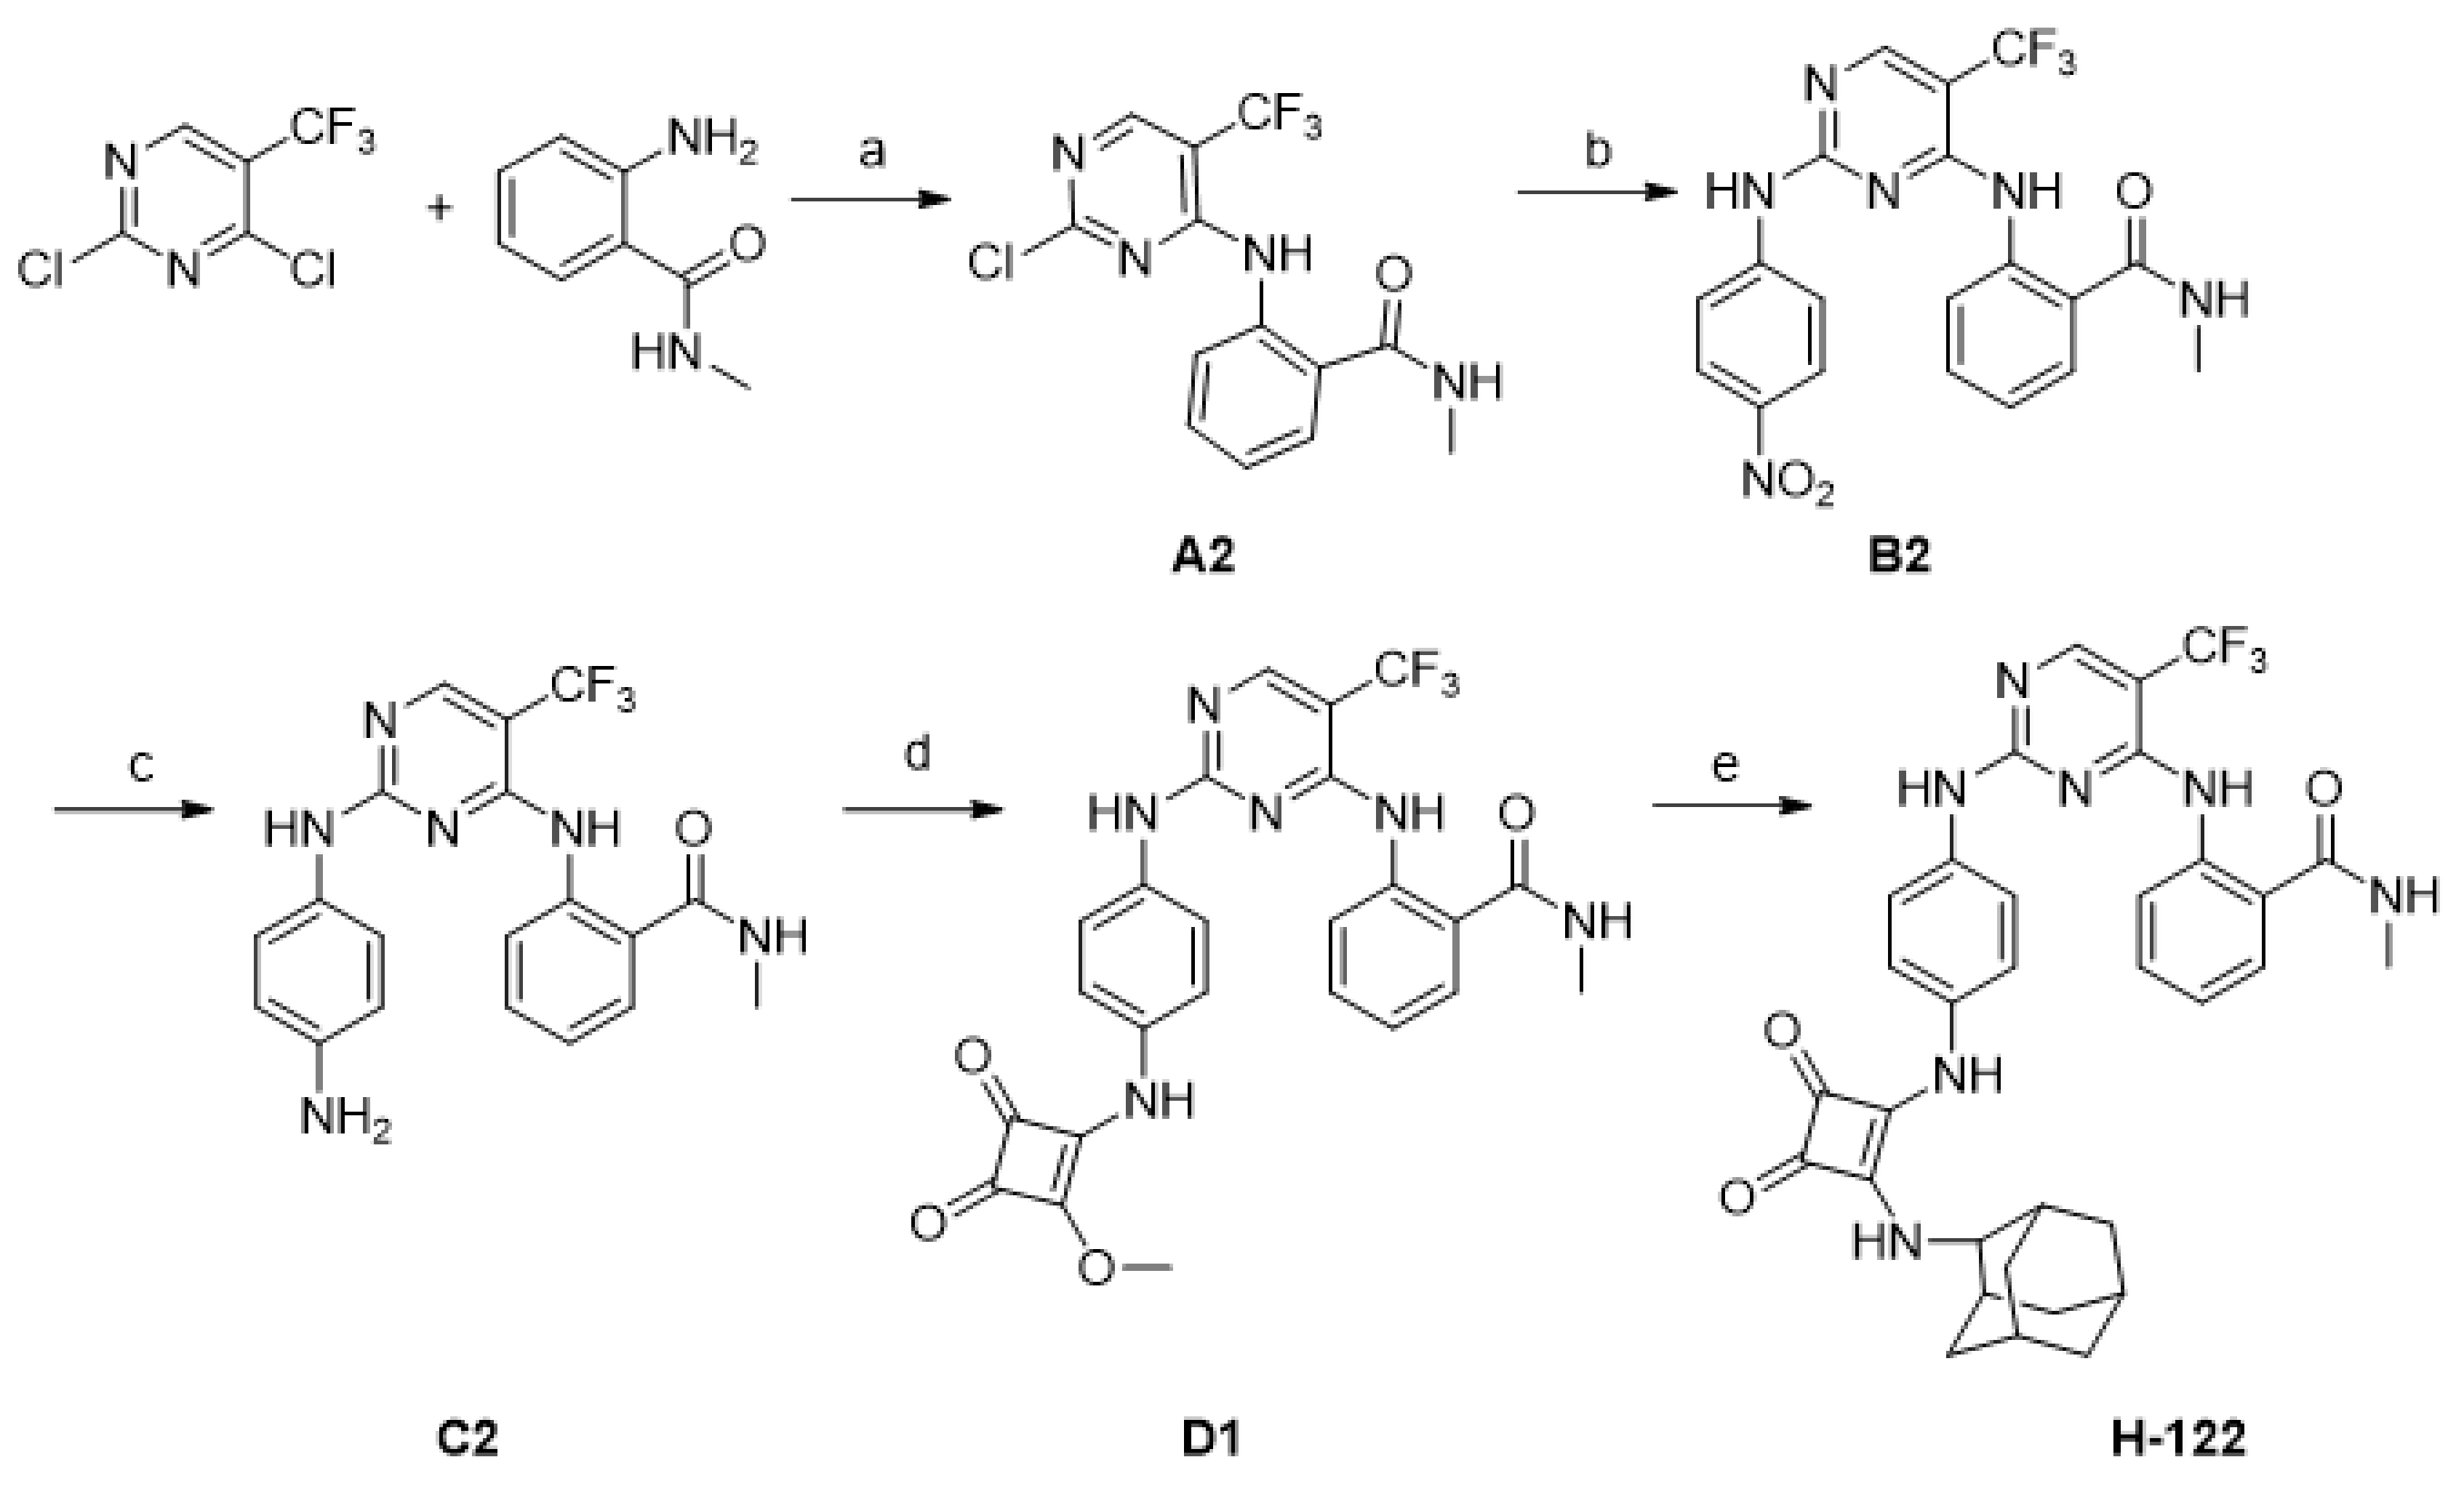
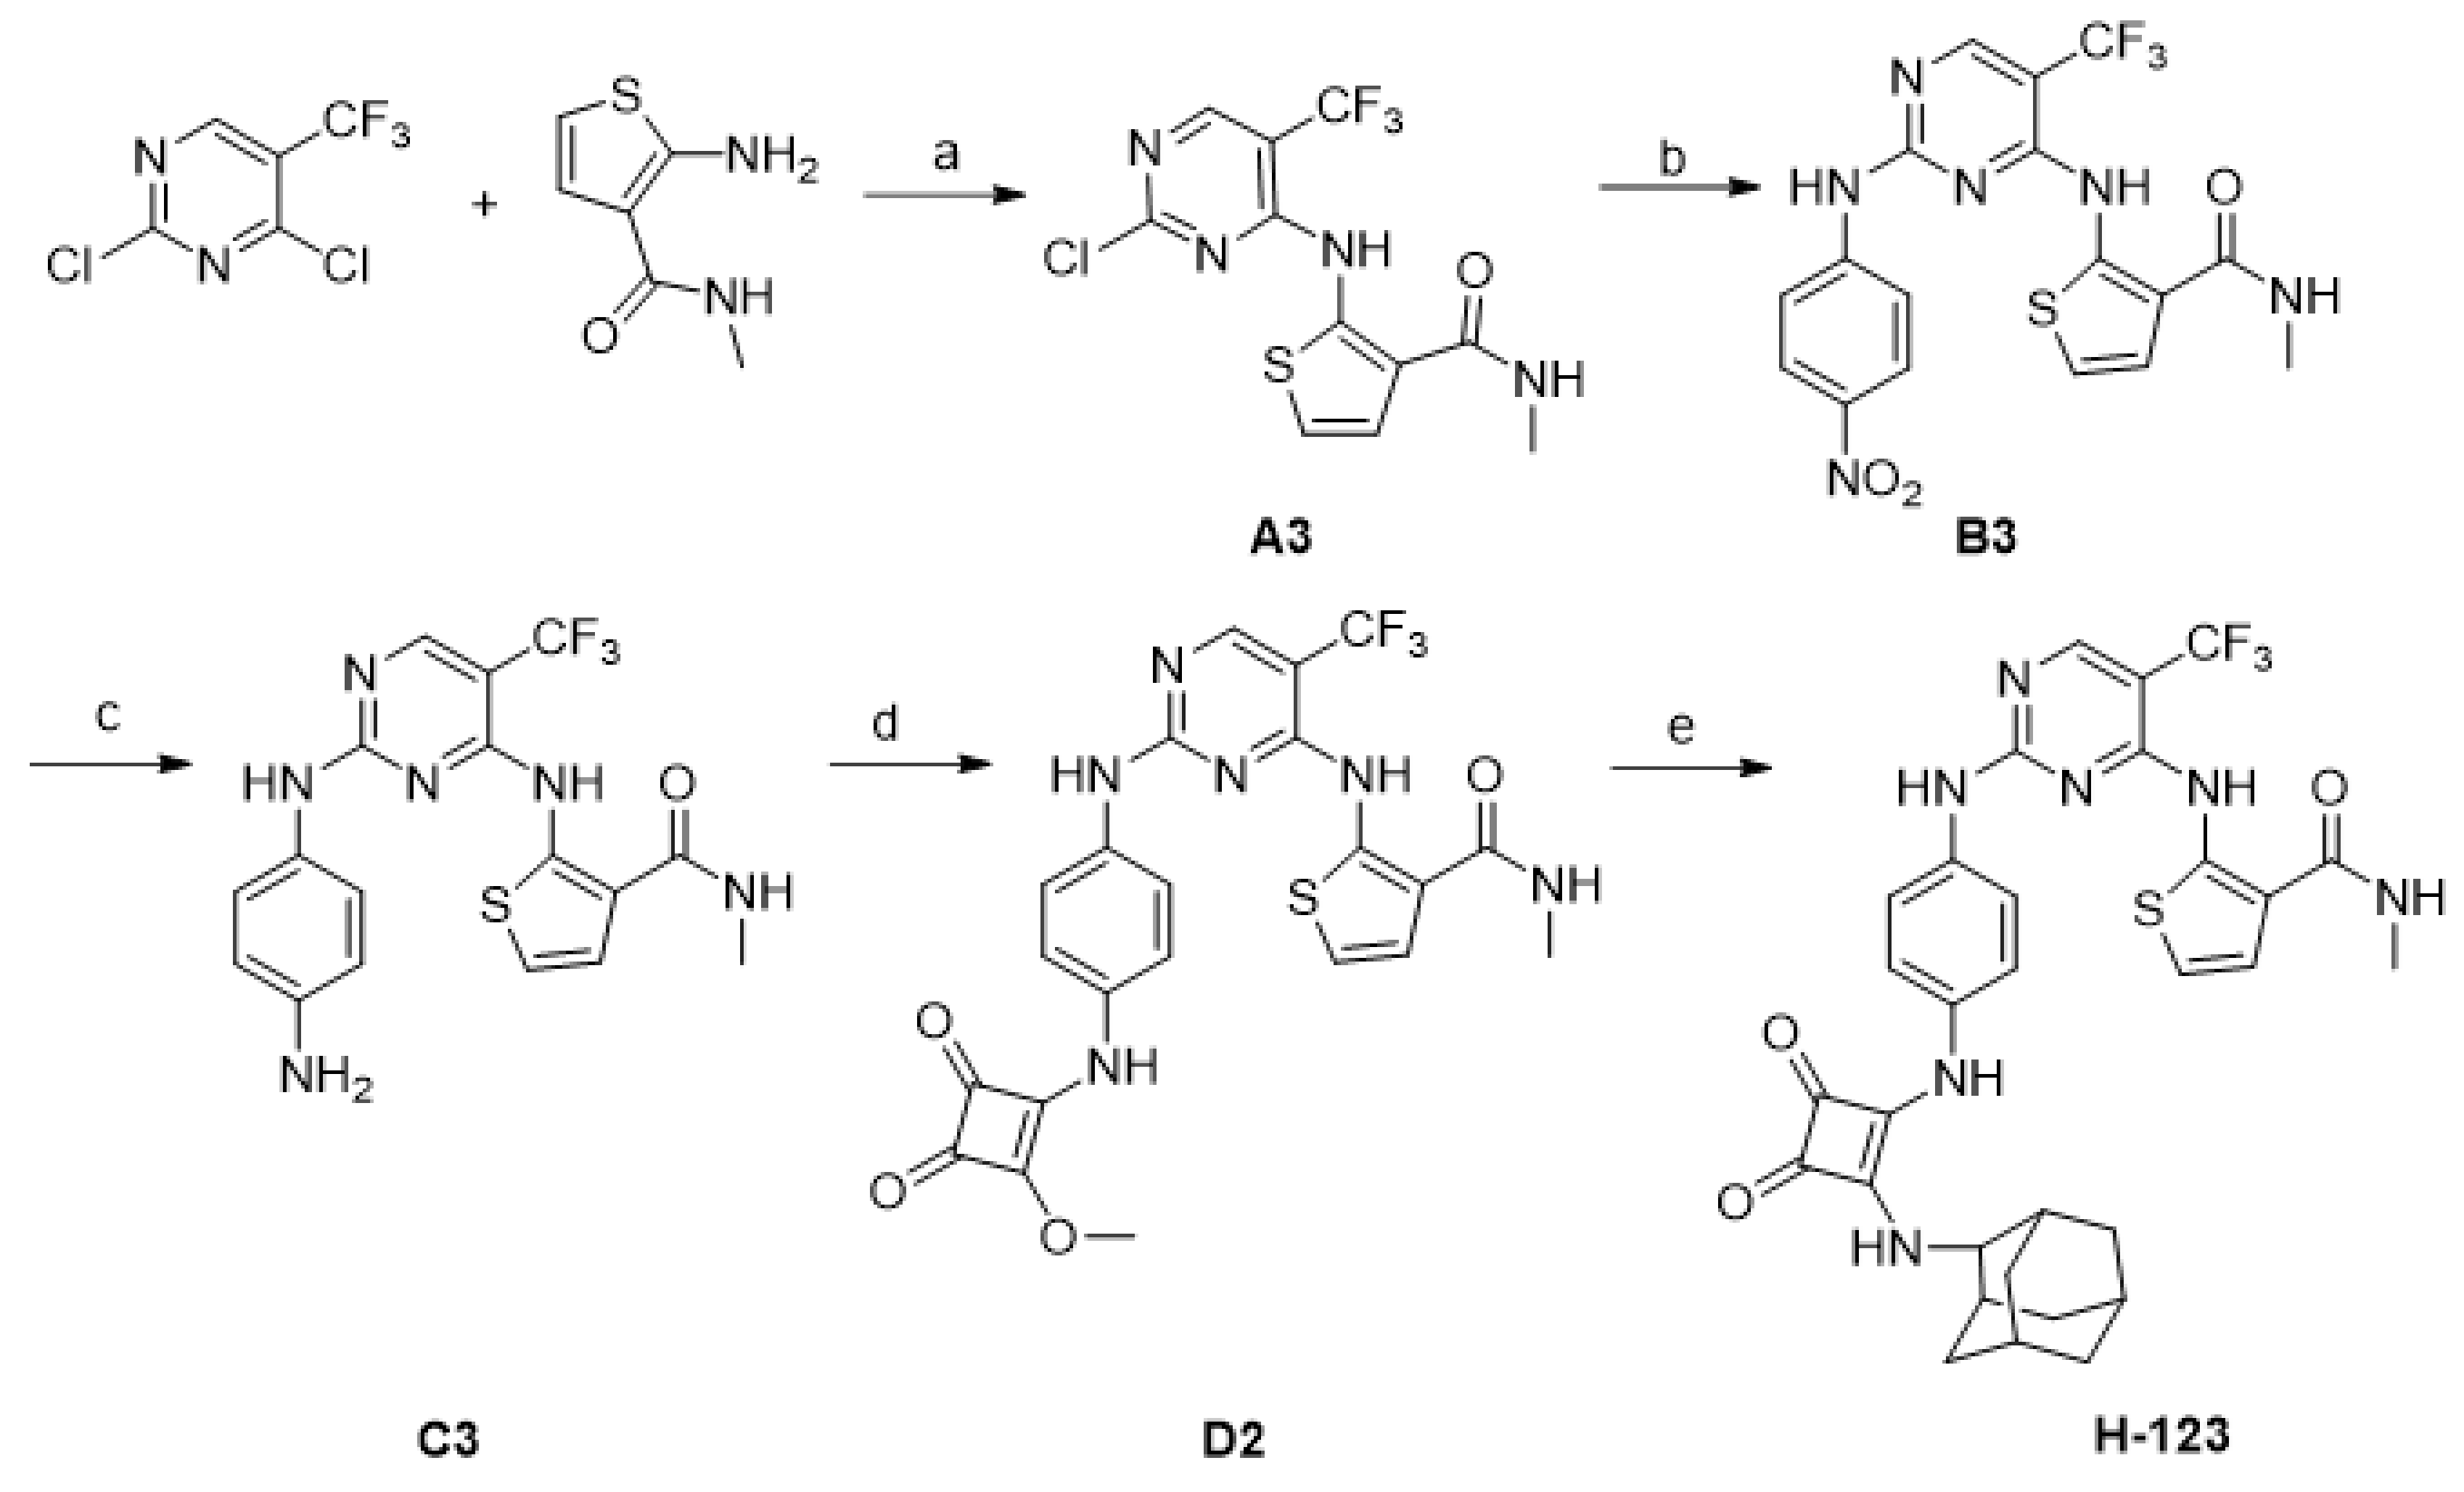
2.1. Chemistry
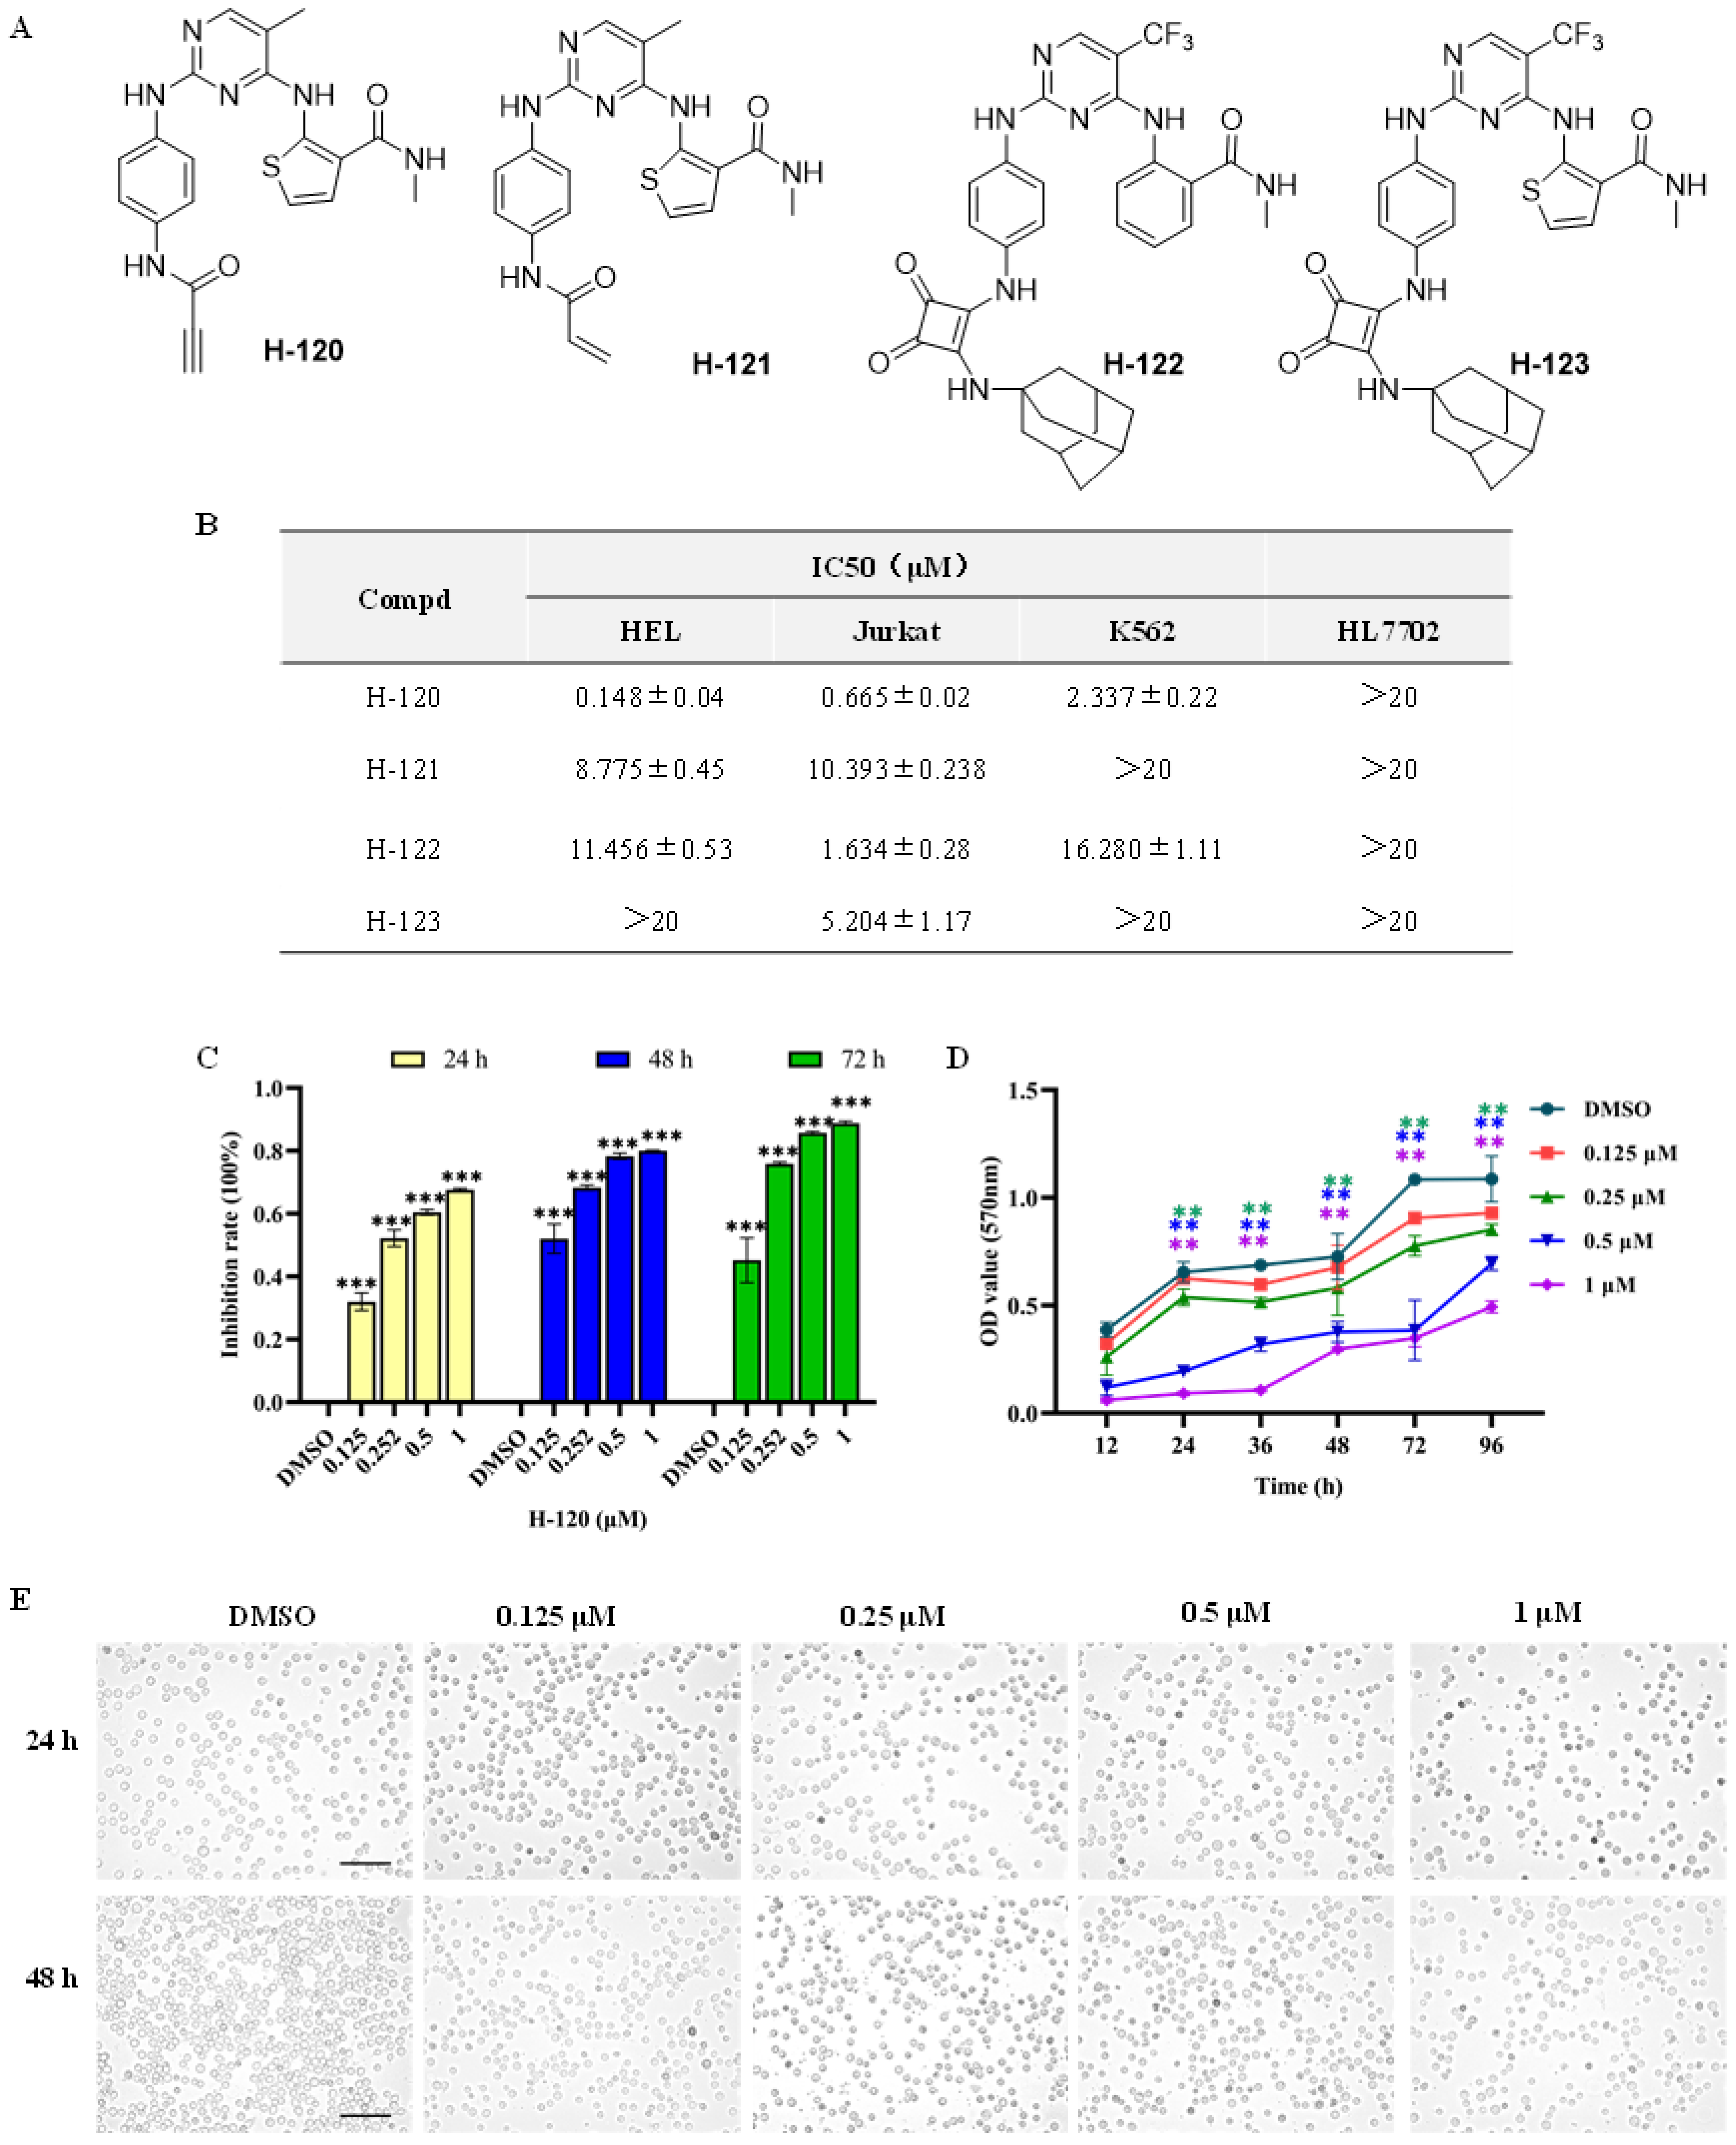
2.2. Anti-Leukemia Activities of N-Phenyl-2-Pyrimidinamine Derivatives
2.3. H-120 Suppressed HEL Cell Proliferation
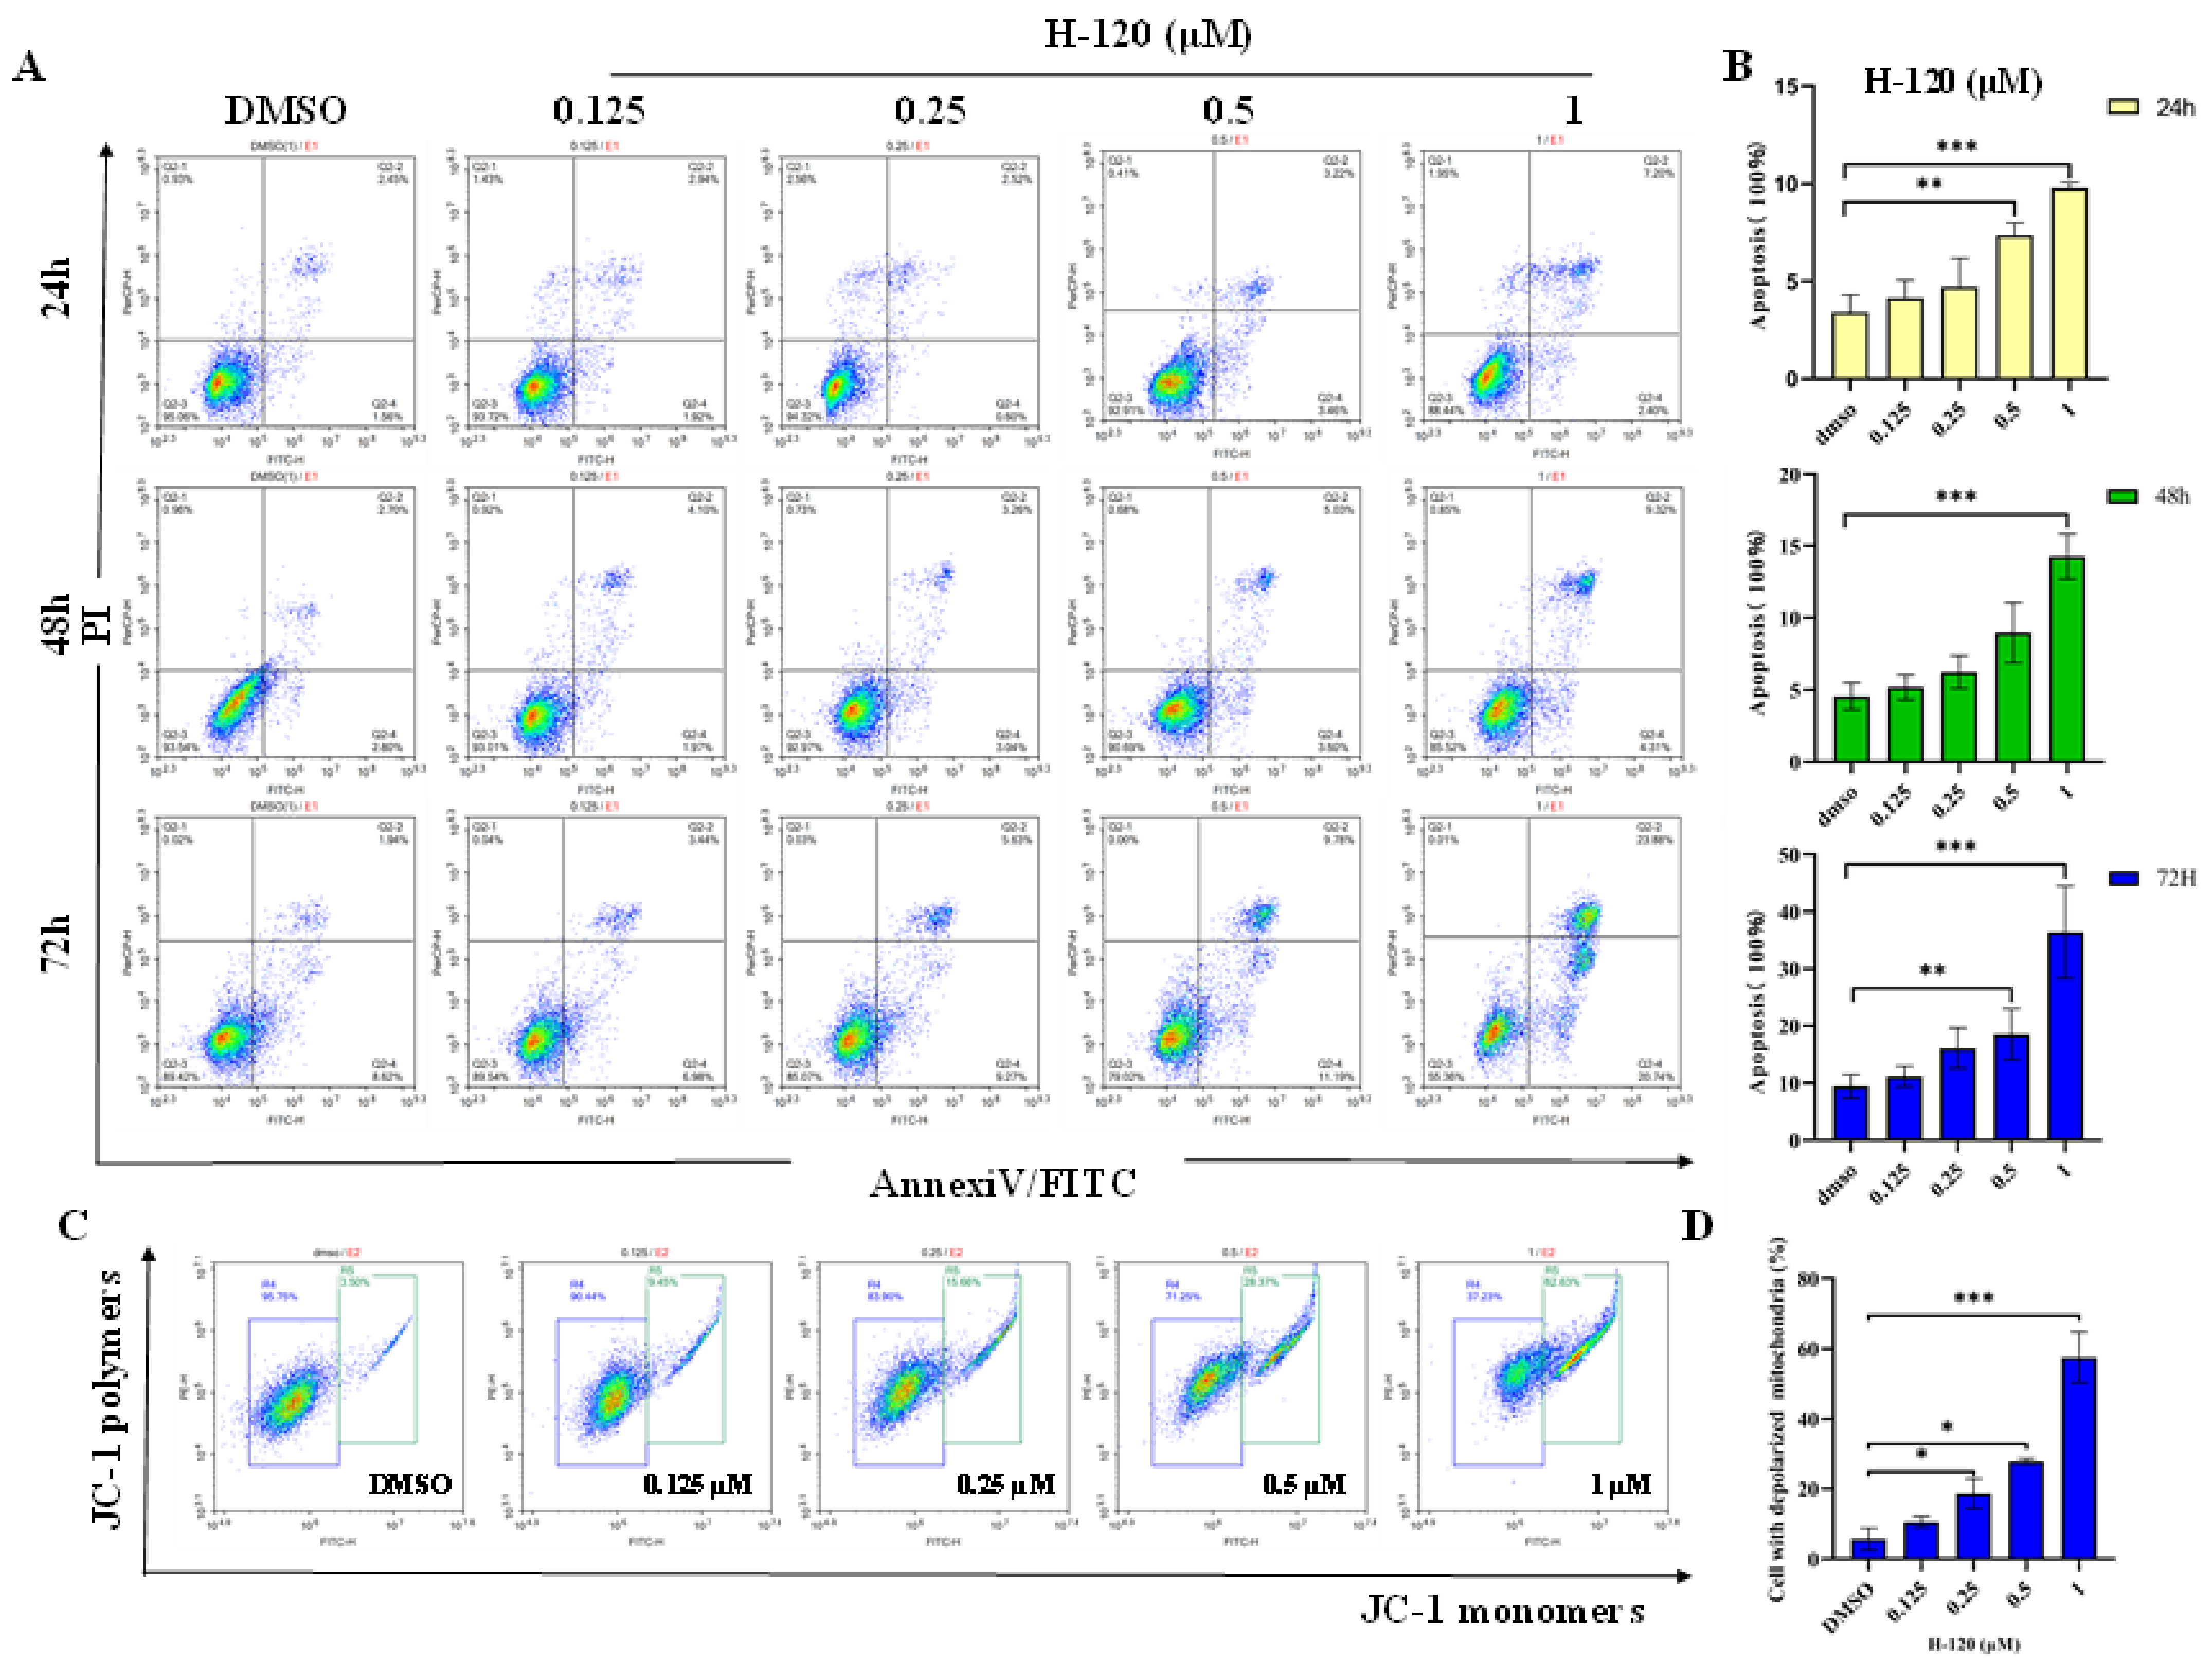
2.4. H-120 Induces Mitochondrial Damage and Apoptosis in HEL Cells
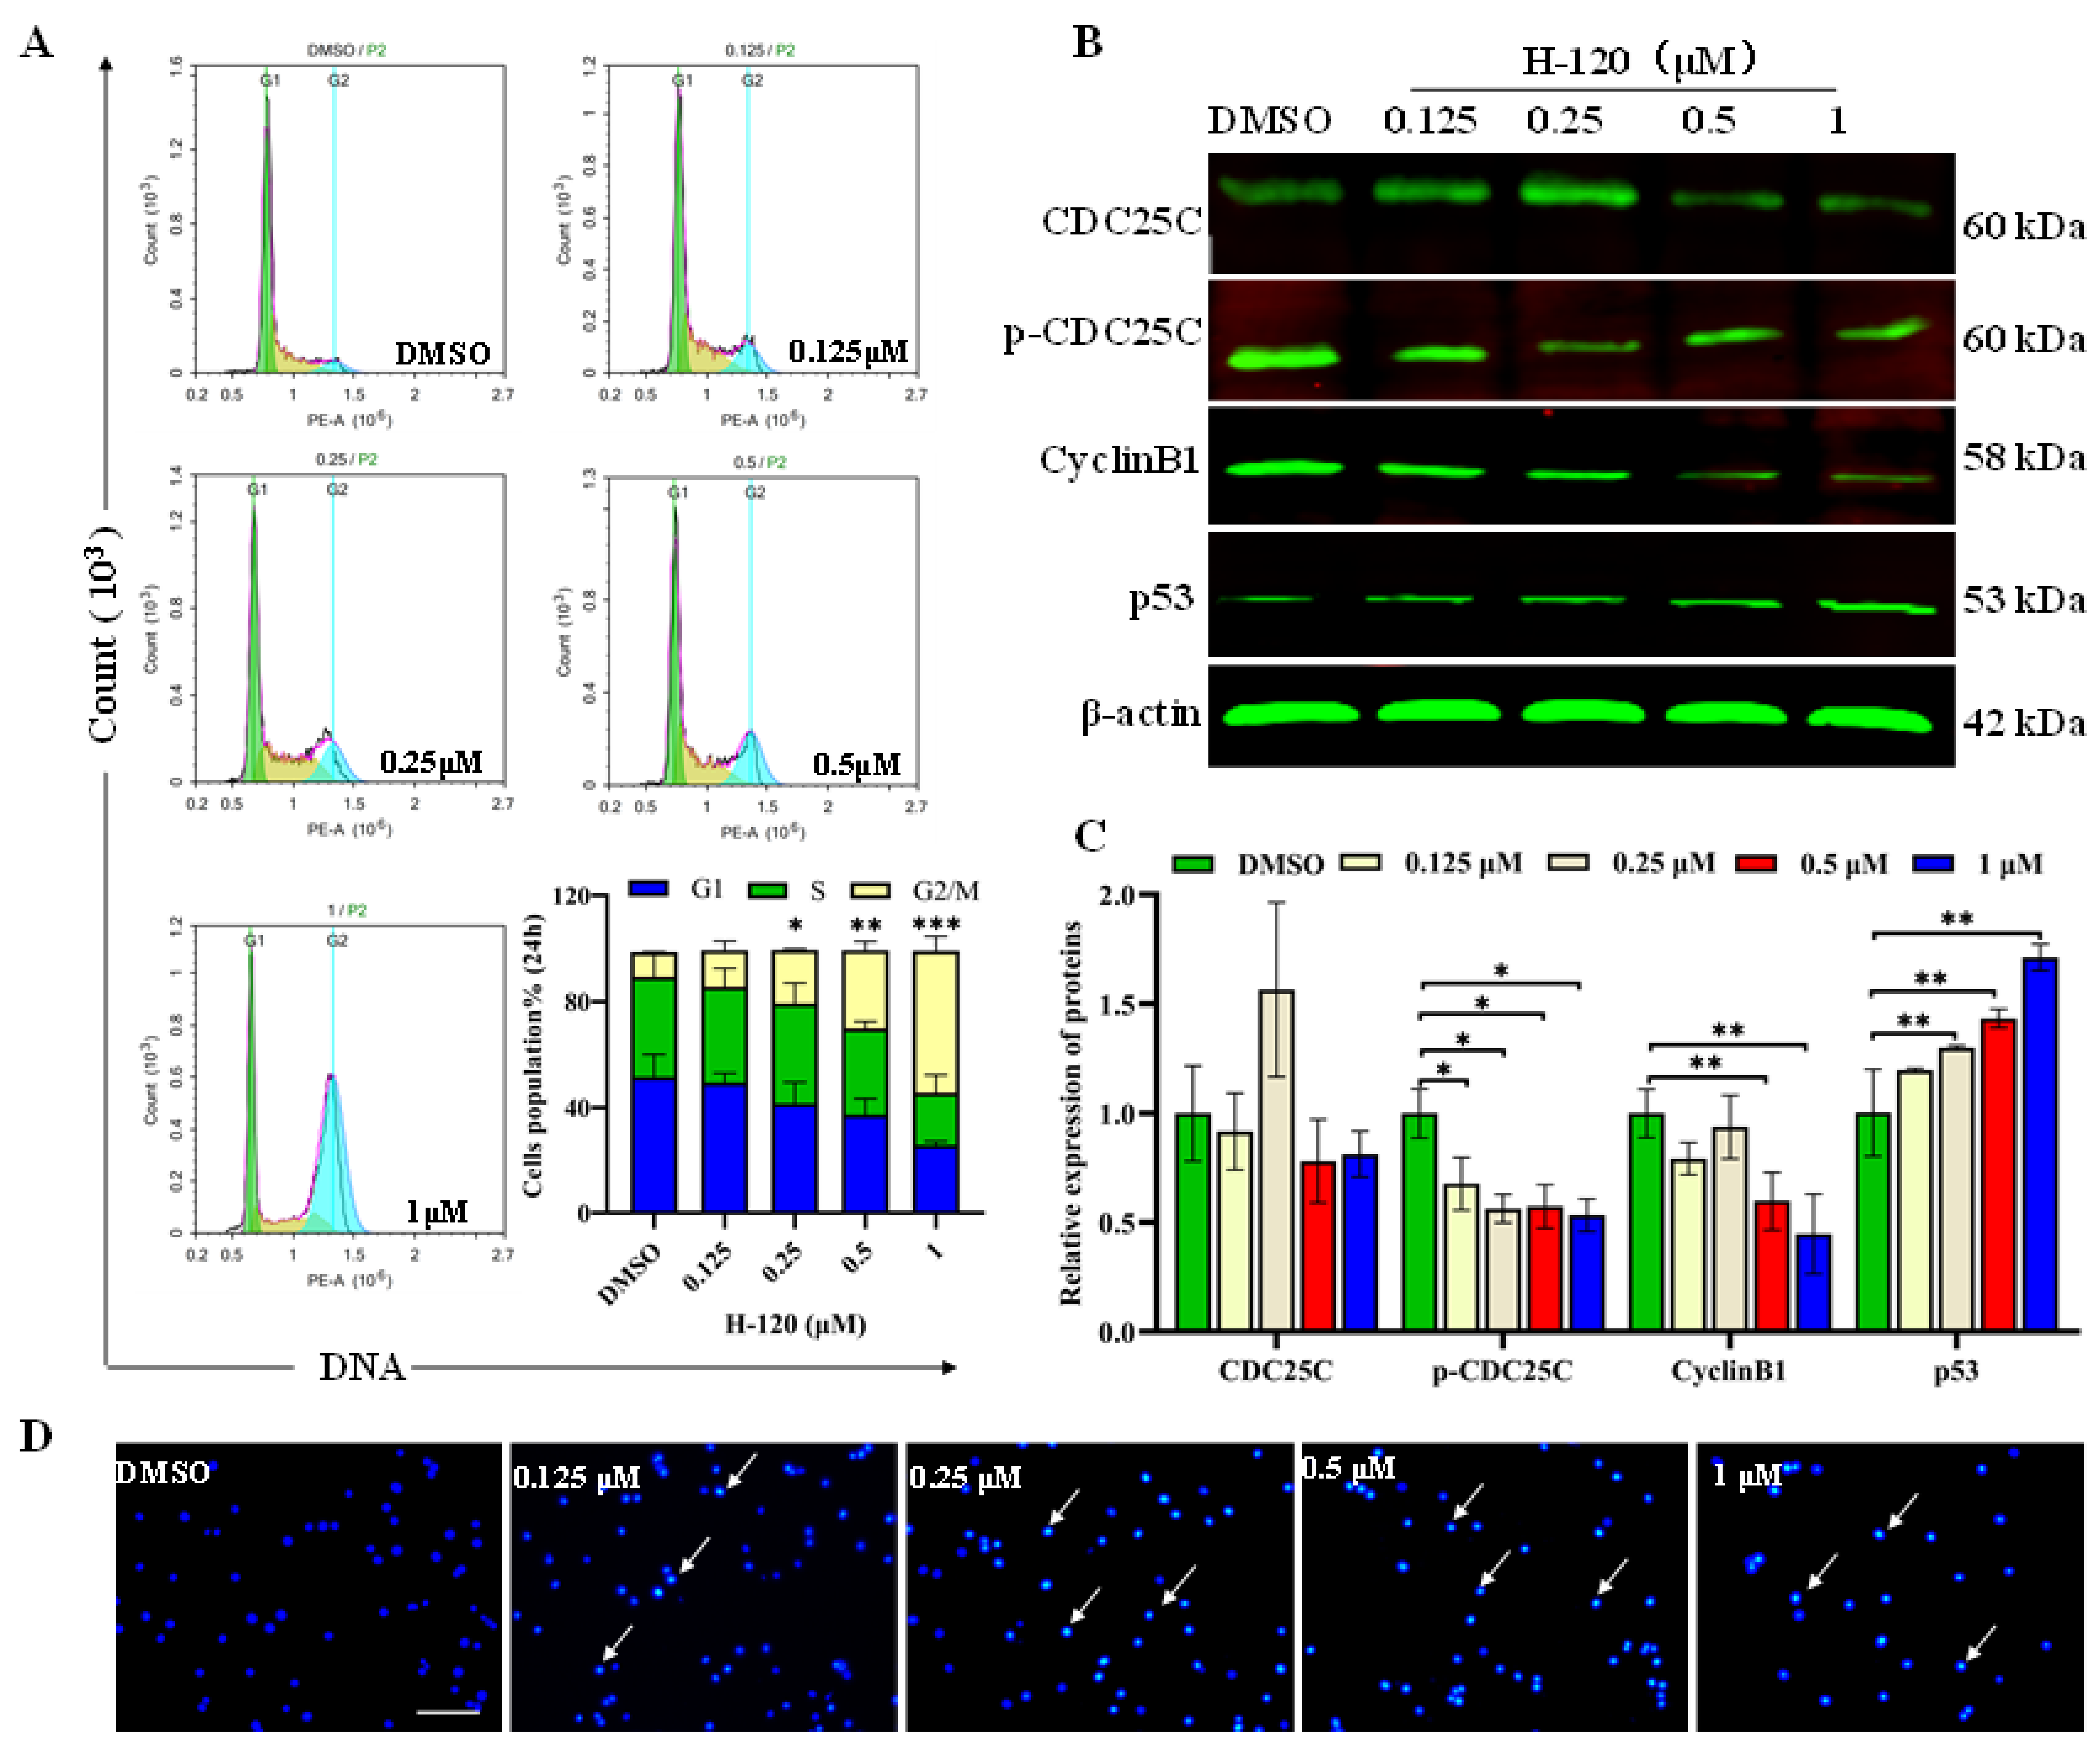
2.5. H-120 Leads to Cell Cycle Arrest and DNA Damage in HEL Cells
2.6. The Effect of H-120 on Apoptosis Proteins in Mitochondrial
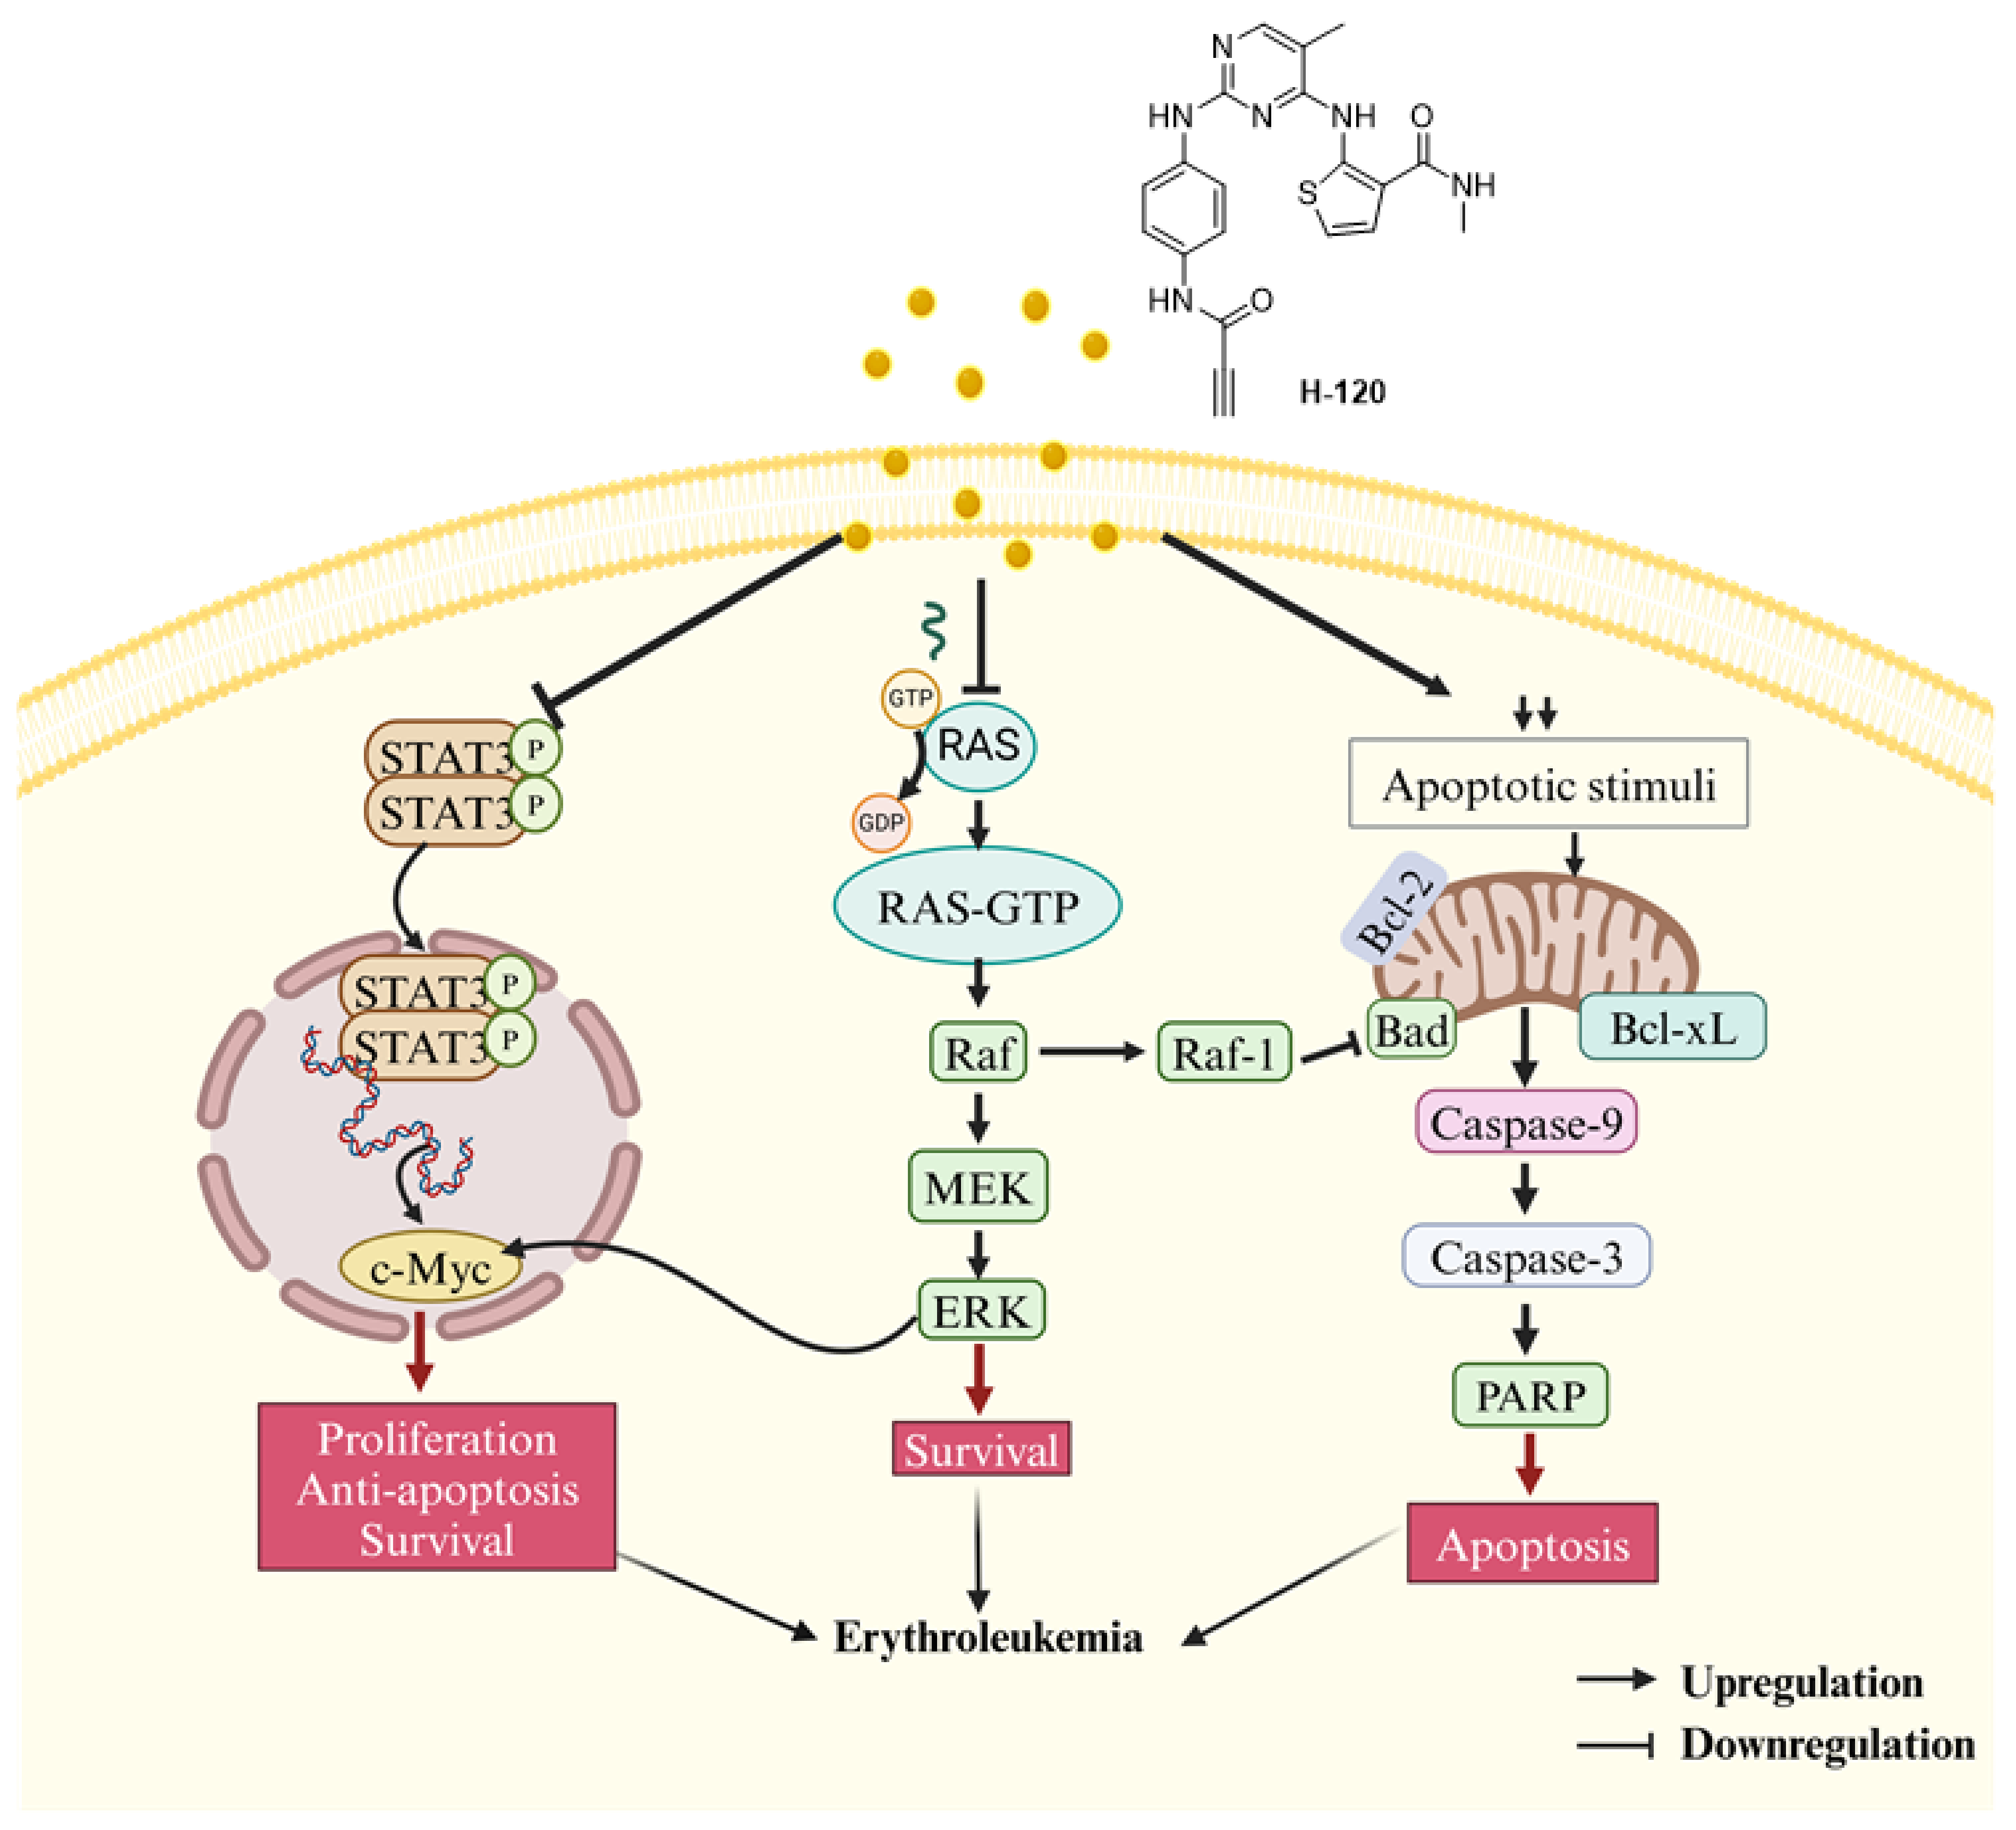
2.7. H-120 Regulates the ERK/Ras/Raf/MEK Signal Pathway in HEL Cells
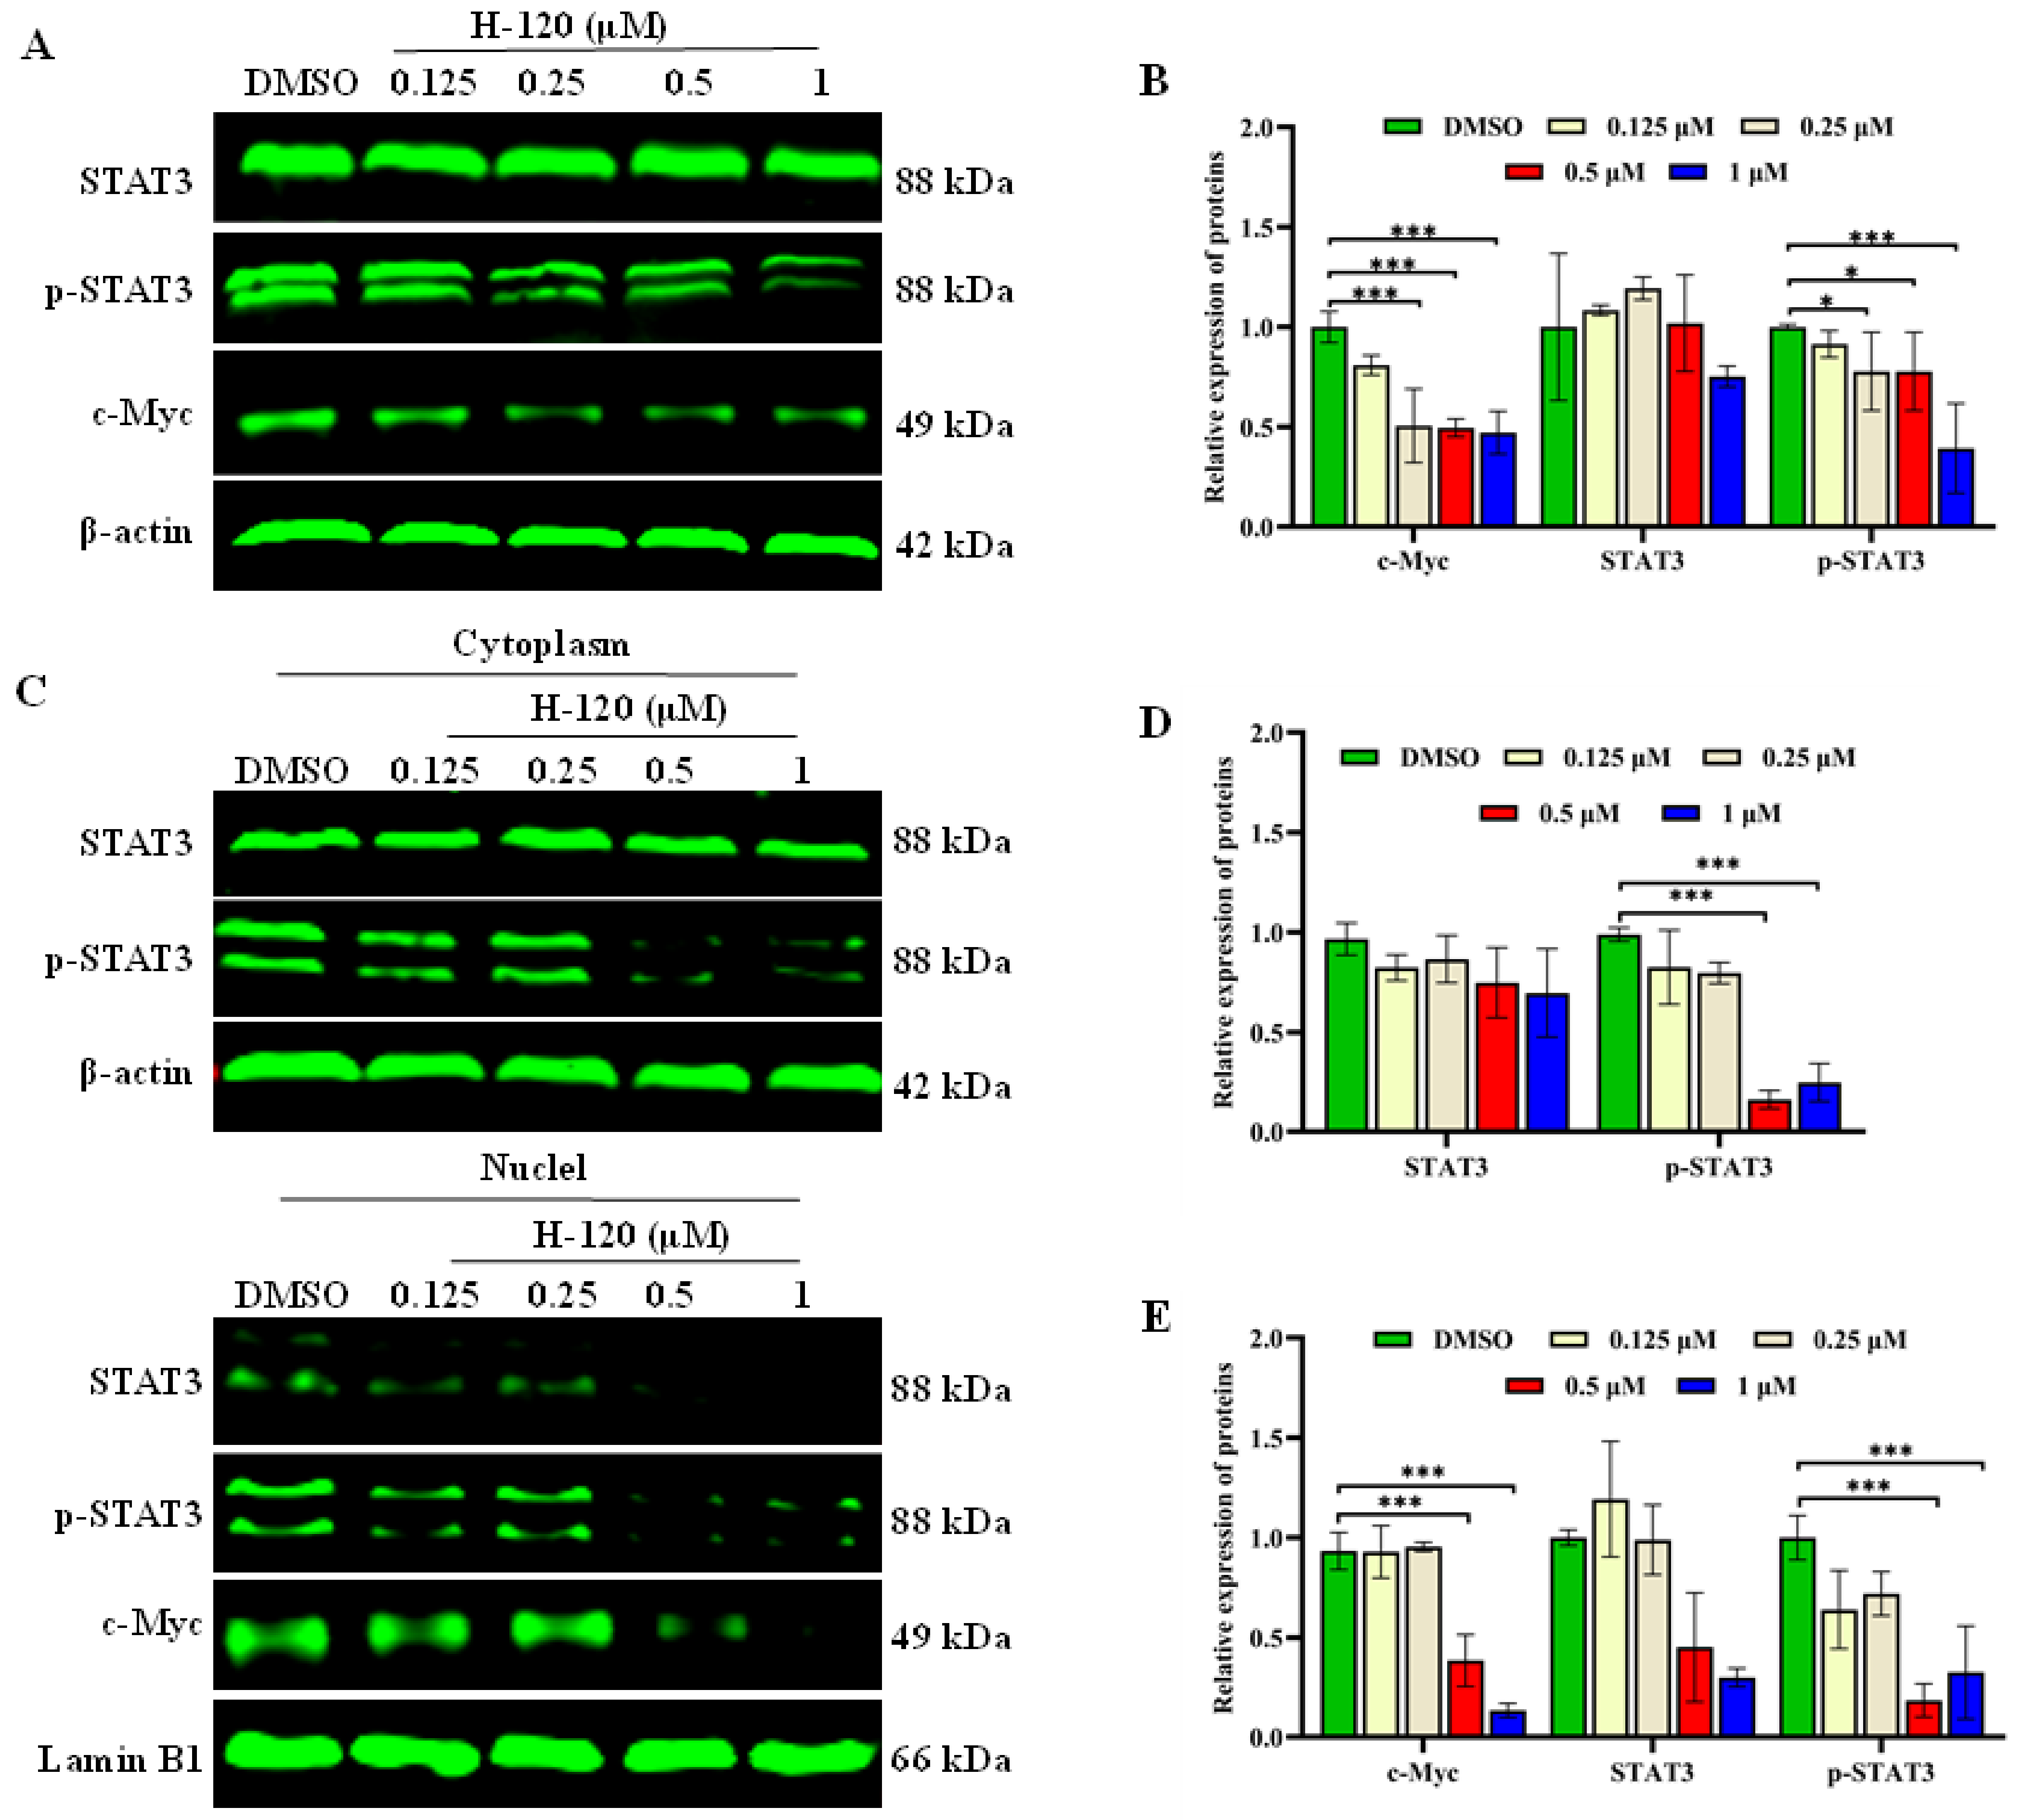
2.8. H-120 Inhibits STAT3/c-Myc Signal Pathway
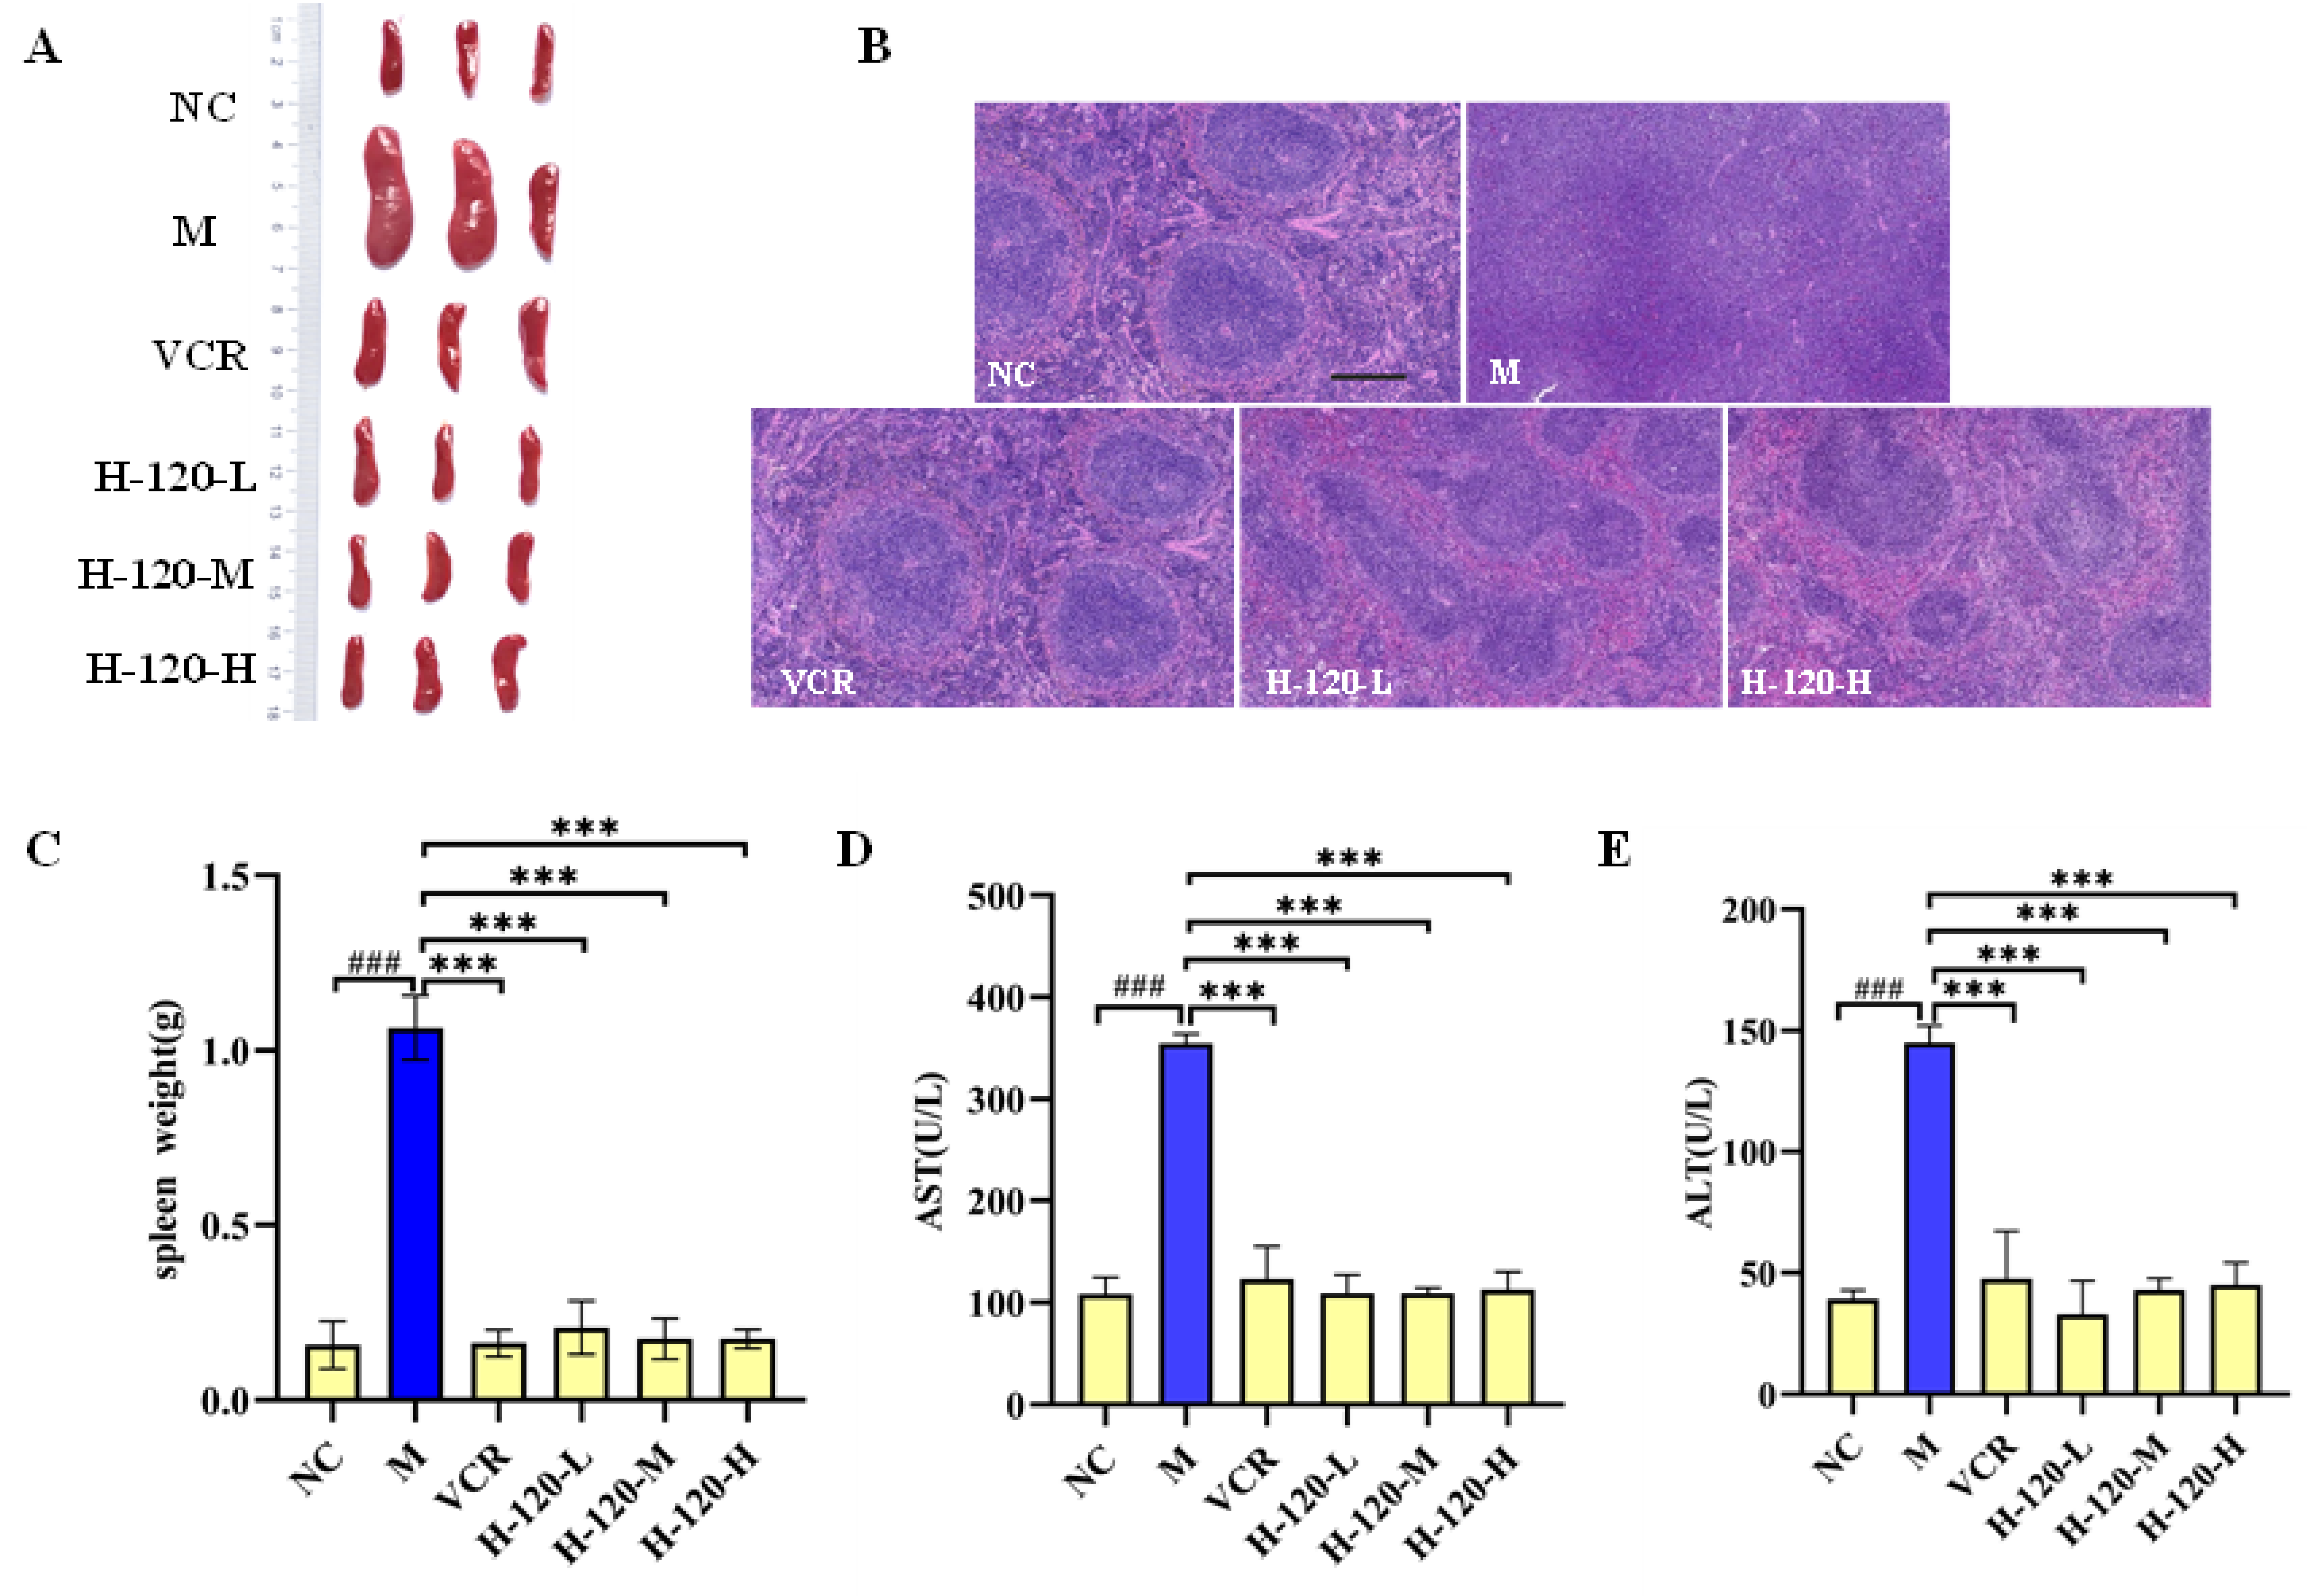
2.9. Anti-Erythroleukemia Activity of H-120 In Vivo
3. Discussion
4. Materials and Methods
4.1. Reagents
4.2. Synthesis of Compounds
- 2-(2-Chloro-5-methyl-pyrimidin-4-ylamino)-thiophene-3-carboxylic acid methylamide (A1)
- 2-[5-Methyl-2-(4-nitro-phenylamino)-pyrimidin-4-ylamino]-thiophene-3-carboxylic acid methylamide (B1)
- 2-[2-(4-Amino-phenylamino)-5-methyl-pyrimidin-4-ylamino]-thiophene-3-carboxylic acid methylamide (C1)
- 2-[5-Methyl-2-(4-propynoylamino-phenylamino)-pyrimidin-4-ylamino]-thiophene-3-carboxylic acid methylamide (H-120)
- 2-((2-((4-Acrylamidophenyl)amino)-5-methylpyrimidin-4-yl)amino)-N-methylthiophene-3-carboxamide (H-121)
- 2-((2-Chloro-5-(trifluoromethyl)pyrimidin-4-yl)amino)-N-methylbenzamide (A2)
- N-Methyl-2-((2-((4-nitrophenyl)amino)-5-(trifluoromethyl)pyrimidin-4-yl)amino)benzamide (B2)
- 2-((2-((4-Aminophenyl)amino)-5-(trifluoromethyl)pyrimidin-4-yl)amino)-N-methylbenzamide (C2)
- 2-((2-((4-((2-Methoxy-3,4-dioxocyclobut-1-en-1-yl)amino)phenyl)amino)-5-(trifluoromethyl)pyrimidin-4-yl)amino)-N-methylbenzamide (D1)
- 2-((2-((4-((2-(((1R,3R,5S)-Adamantan-1-yl)amino)-3,4-dioxocyclobut-1-en-1-yl)amino)phenyl)amino)-5-(trifluoromethyl)pyrimidin-4-yl)amino)-N-methylbenzamide (H-122)
- 2-(2-Chloro-5-trifluoromethyl-pyrimidin-4-ylamino)-thiophene-3-carboxylic acid methylamide (A3)
- 2-[2-(4-Nitro-phenylamino)-5-trifluoromethyl-pyrimidin-4-ylamino]-thiophene-3-carboxylic acid methylamide (B3)
- 2-[2-(4-Amino-phenylamino)-5-trifluoromethyl-pyrimidin-4-ylamino]-thiophene-3-carboxylic acid methylamide (C3)
- 2-{2-[4-(2-Methoxy-3,4-dioxo-cyclobut-1-enylamino)-phenylamino]-5-trifluoromethyl-pyrimidin-4-ylamino}-thiophene-3-carboxylic acid methylamide (D2)
- 2-((2-((4-((2-(((1R,3R,5S)-Adamantan-1-yl)amino)-3,4-dioxocyclobut-1-en-1-yl)amino)phenyl)amino)-5-(trifluoromethyl)pyrimidin-4-yl)amino)-N-methylthiophene-3-carboxamide (H-123)
4.3. Cell Culture
4.4. Cell Viability Assays
4.5. Cell Growth Curve Determination
4.6. Apoptosis and Cell Cycle Analyses
4.7. Hoechst 33258 Staining
4.8. Mitochondrial Membrane Potential Assay
4.9. Extraction of Nuclear Protein and Cytoplasmic Protein
4.10. Western Blotting Analysis
4.11. Animal Experiment
4.12. Ethics Statement
4.13. Statistical Analysis
5. Conclusions
Supplementary Materials
Author Contributions
Funding
Institutional Review Board Statement
Informed Consent Statement
Data Availability Statement
Acknowledgments
Conflicts of Interest
References
- Di Genua, C.; Valletta, S.; Buono, M.; Stoilova, B.; Sweeney, C.; Rodriguez-Meira, A.; Grover, A.; Drissen, R.; Meng, Y.; Beveridge, R.; et al. C/EBPα and GATA-2 Mutations Induce Bilineage Acute Erythroid Leukemia through Transformation of a Neomorphic Neutrophil-Erythroid Progenitor. Cancer Cell 2020, 37, 690–704.e8. [Google Scholar] [CrossRef] [PubMed]
- Liao, Z.; Li, J.; Wu, J.; Liu, J.; Sun, S. Chemotherapeutics for Acute Erythroid Leukemia: Research, Present and Future. CMM 2021, 21, 819–831. [Google Scholar] [CrossRef] [PubMed]
- Santos, F.P.; Bueso-Ramos, C.E.; Ravandi, F. Acute Erythroleukemia: Diagnosis and Management. Expert Rev. Hemotol. 2010, 3, 705–718. [Google Scholar] [CrossRef] [PubMed]
- Tian, Z.; Yang, L.; Huang, M.; Sun, C.; Chen, M.; Zhao, W.; Peng, J.; Guo, G. Antitumor Activity and Mechanism of Action of the Antimicrobial Peptide AMP-17 on Human Leukemia K562 Cells. Molecules 2022, 27, 8109. [Google Scholar] [CrossRef] [PubMed]
- Ma, Z.-Q.; Pan, J.-H.; Jing, D.-X.; Xu, C.-Y. Clinical Characteristics and Prognosis of 167 Cases of Acute Erythroleukemia. Indian J. Hematol. Blood Transfus. 2017, 33, 56–60. Available online: https://www.x-mol.com/paper/1212913860296384529?adv (accessed on 25 October 2023). [CrossRef]
- Xu, Q.; Li, M.; Yang, M.; Yang, J.; Xie, J.; Lu, X.; Wang, F.; Chen, W. α-Pinene Regulates miR-221 and Induces G2/M Phase Cell Cycle Arrest in Human Hepatocellular Carcinoma Cells. Biosci. Rep. 2018, 38, BSR20180980. [Google Scholar] [CrossRef] [PubMed]
- Weinberg, O.K.; Arber, D.A. Erythroleukemia: An Update. Curr. Oncol. Rep. 2021, 23, 69. [Google Scholar] [CrossRef] [PubMed]
- Liu, W.; Wu, Z.; Yu, Y.; Qiao, C.; Zhu, H.; Hong, M.; Zhu, Y.; Qian, S.; Chen, S.; Wu, D.; et al. Functional Evaluation of KEL as an Oncogenic Gene in the Progression of Acute Erythroleukemia. Oxid. Med. Cell. Longev. 2022, 2022, 1–13. [Google Scholar] [CrossRef]
- Alexander, C. A History and Current Understanding of Acute Erythroid Leukemia. Clin. Lymphoma Myeloma Leuk. 2023, 23, 583–588. [Google Scholar] [CrossRef]
- Varmeh-Ziaie, S.; Resnick-Silverman, L.; Liu, W.; Padi, A.; Dastidar, J.; DaCosta, A.; Mattia, M.; Manfredi, J.J. DNA Damage-Induced Downregulation of Cdc25C Is Mediated by P53 via Two Independent Mechanisms: One Involves Direct Binding to the cdc25C Promoter. Mol. Cell 2004, 16, 725–736. [Google Scholar] [CrossRef]
- Steelman, L.S.; Franklin, R.A.; Abrams, S.L.; Chappell, W.; Kempf, C.R.; Bäsecke, J.; Stivala, F.; Donia, M.; Fagone, P.; Nicoletti, F.; et al. Roles of the Ras/Raf/MEK/ERK Pathway in Leukemia Therapy. Leukemia 2011, 25, 1080–1094. [Google Scholar] [CrossRef] [PubMed]
- Gonzalez-Hormazabal, P.; Musleh, M.; Bustamante, M.; Stambuk, J.; Pisano, R.; Valladares, H.; Lanzarini, E.; Chiong, H.; Rojas, J.; Suazo, J.; et al. Polymorphisms in RAS/RAF/MEK/ERK Pathway Are Associated with Gastric Cancer. Genes 2018, 10, 20. [Google Scholar] [CrossRef]
- Guo, Y.; Pan, W.; Liu, S.; Shen, Z.; Xu, Y.; Hu, L. ERK/MAPK Signalling Pathway and Tumorigenesis (Review). Exp. Ther. Med. 2020, 19, 1997–2007. [Google Scholar] [CrossRef] [PubMed]
- Kanna, R.; Choudhary, G.; Ramachandra, N.; Steidl, U.; Verma, A.; Shastri, A. STAT3 Inhibition as a Therapeutic Strategy for Leukemia. Leukemia Lymphoma 2018, 59, 2068–2074. [Google Scholar] [CrossRef] [PubMed]
- Beebe, J.D.; Liu, J.-Y.; Zhang, J.-T. Two Decades of Research in Discovery of Anticancer Drugs Targeting STAT3, How Close Are We? Pharmacol. Ther. 2018, 191, 74–91. [Google Scholar] [CrossRef] [PubMed]
- Zhang, H.; Nguyen-Jackson, H.; Panopoulos, A.D.; Li, H.S.; Murray, P.J.; Watowich, S.S. STAT3 Controls Myeloid Progenitor Growth during Emergency Granulopoiesis. Blood 2010, 116, 2462–2471. [Google Scholar] [CrossRef]
- Chen, C.-C.; Sun, Y.-T.; Chen, J.-J.; Chang, Y.-J. Tumor Necrosis Factor-α-Induced Cyclooxygenase-2 Expression via Sequential Activation of Ceramide-Dependent Mitogen-Activated Protein Kinases, and IκB Kinase 1/2 in Human Alveolar Epithelial Cells. Mol. Pharmacol. 2001, 59, 493–500. [Google Scholar] [CrossRef] [PubMed]
- Mohassab, A.M.; Hassan, H.A.; Abdelhamid, D.; Abdel-Aziz, M. STAT3 Transcription Factor as Target for Anti-Cancer Therapy. Pharmacol. Rep. 2020, 72, 1101–1124. [Google Scholar] [CrossRef]
- Huang, M.-J.; Cheng, Y.; Liu, C.-R.; Lin, S.; Liu, H.E. A Small-Molecule c-Myc Inhibitor, 10058-F4, Induces Cell-Cycle Arrest, Apoptosis, and Myeloid Differentiation of Human Acute Myeloid Leukemia. Exp. Hematol. 2006, 34, 1480–1489. [Google Scholar] [CrossRef] [PubMed]
- Luo, H.; Li, Q.; O’Neal, J.; Kreisel, F.; Le Beau, M.M.; Tomasson, M.H. C-Myc Rapidly Induces Acute Myeloid Leukemia in Mice without Evidence of Lymphoma-Associated Antiapoptotic Mutations. Blood 2005, 106, 2452–2461. [Google Scholar] [CrossRef]
- Müller-Tidow, C.; Steffen, B.; Cauvet, T.; Tickenbrock, L.; Ji, P.; Diederichs, S.; Sargin, B.; Köhler, G.; Stelljes, M.; Puccetti, E.; et al. Translocation Products in Acute Myeloid Leukemia Activate the Wnt Signaling Pathway in Hematopoietic Cells. Cell. Mol. Biol. 2004, 24, 2890–2904. [Google Scholar] [CrossRef] [PubMed]
- Newman, D.J.; Cragg, G.M. Natural Products as Sources of New Drugs over the Nearly Four Decades from 01/1981 to 09/2019. J. Nat. Prod. 2020, 83, 770–803. [Google Scholar] [CrossRef] [PubMed]
- Liu, L.; Michowski, W.; Kolodziejczyk, A.; Sicinski, P. The Cell Cycle in Stem Cell Proliferation, Pluripotency and Differentiation. Nat. Cell Biol. 2019, 21, 1060–1067. [Google Scholar] [CrossRef] [PubMed]
- Zuo, Y.; Li, R.; Zhang, Y.; Bao, G.; Le, Y.; Yan, L. Design, Synthesis and Antitumor Activity of 5-Trifluoromethylpyrimidine Derivatives as EGFR Inhibitors. J. Enzyme Inhib. Med. Chem. 2022, 37, 2742–2754. [Google Scholar] [CrossRef] [PubMed]
- Yan, L.; Wang, Q.; Liu, L.; Le, Y. Design, Synthesis and Biological Evaluation of a Series of Dianilinopyrimidines as EGFR Inhibitors. J. Enzyme Inhib. Med. Chem. 2022, 37, 832–843. [Google Scholar] [CrossRef] [PubMed]
- Ong, S.-B.; Kalkhoran, S.B.; Cabrera-Fuentes, H.A.; Hausenloy, D.J. Mitochondrial Fusion and Fission Proteins as Novel Therapeutic Targets for Treating Cardiovascular Disease. Eur. J. Pharmacol. 2015, 763, 104–114. [Google Scholar] [CrossRef] [PubMed]
- Stuhldreier, F.; Schmitt, L.; Lenz, T.; Hinxlage, I.; Zimmermann, M.; Wollnitzke, P.; Schliehe-Diecks, J.; Liu, Y.; Jäger, P.; Geyh, S.; et al. The Mycotoxin Viriditoxin Induces Leukemia- and Lymphoma-Specific Apoptosis by Targeting Mitochondrial Metabolism. Cell Death Dis. 2022, 13, 938. [Google Scholar] [CrossRef] [PubMed]
- Yin, X.; Li, Z.; Lyu, C.; Wang, Y.; Ding, S.; Ma, C.; Wang, J.; Cui, S.; Wang, J.; Guo, D.; et al. Induced Effect of Zinc Oxide Nanoparticles on Human Acute Myeloid Leukemia Cell Apoptosis by Regulating Mitochondrial Division. IUBMB Life 2022, 74, 519–531. [Google Scholar] [CrossRef] [PubMed]
- Westermann, B. Mitochondrial Fusion and Fission in Cell Life and Death. Nat. Rev. Mol. Cell Biol. 2010, 11, 872–884. [Google Scholar] [CrossRef] [PubMed]
- Dehkordi, M.H.; Munn, R.G.K.; Fearnhead, H.O. Non-Canonical Roles of Apoptotic Caspases in the Nervous System. Front. Cell Dev. Biol. 2022, 10, 840023. [Google Scholar] [CrossRef] [PubMed]
- Boice, A.; Bouchier-Hayes, L. Targeting Apoptotic Caspases in Cancer. Biochim. Biophys. Acta Mol. Cell Res. 2020, 1867, 118688. [Google Scholar] [CrossRef] [PubMed]
- Lamkanfi, M. Alice in Caspase Land. A Phylogenetic Analysis of Caspases from Worm to Man. Cell Death Differ. 2002, 9, 358–361. [Google Scholar] [CrossRef] [PubMed]
- Van Opdenbosch, N.; Lamkanfi, M. Caspases in Cell Death, Inflammation, and Disease. Immunity 2019, 50, 1352–1364. [Google Scholar] [CrossRef]
- Thornberry, N.A.; Lazebnik, Y. Caspases: Enemies Within. Science 1998, 281, 1312–1316. [Google Scholar] [CrossRef] [PubMed]
- Peyssonnaux, C.; Provot, S.; Felder-Schmittbuhl, M.P.; Calothy, G.; Eychène, A. Induction of Postmitotic Neuroretina Cell Proliferation by Distinct Ras Downstream Signaling Pathways. Mol. Cell. Biol. 2000, 20, 7068–7079. [Google Scholar] [CrossRef] [PubMed]
- Chang, F.; Steelman, L.S.; Lee, J.T.; Shelton, J.G.; Navolanic, P.M.; Blalock, W.L.; Franklin, R.A.; McCubrey, J.A. Signal Transduction Mediated by the Ras/Raf/MEK/ERK Pathway from Cytokine Receptors to Transcription Factors: Potential Targeting for Therapeutic Intervention. Leukemia 2003, 17, 1263–1293. [Google Scholar] [CrossRef] [PubMed]
- Yan, J.; Roy, S.; Apolloni, A.; Lane, A.; Hancock, J.F. Ras Isoforms Vary in Their Ability to Activate Raf-1 and Phosphoinositide 3-Kinase. J. Biol. Chem. 1998, 273, 24052–24056. [Google Scholar] [CrossRef]
- Chang, F.; Steelman, L.S.; Shelton, J.G.; Lee, J.T.; Navolanic, P.M.; Blalock, W.L.; Franklin, R.; McCUBREY, J.A. Regulation of Cell Cycle Progression and Apoptosis by the Ras/Raf/MEK/ERK Pathway (Review). Int. J. Oncol. 2003, 22, 469–480. [Google Scholar] [CrossRef] [PubMed]
- Steelman, L.S.; Pohnert, S.C.; Shelton, J.G.; Franklin, R.A.; Bertrand, F.E.; McCubrey, J.A. JAK/STAT, Raf/MEK/ERK, PI3K/Akt and BCR-ABL in Cell Cycle Progression and Leukemogenesis. Leukemia 2004, 18, 189–218. [Google Scholar] [CrossRef] [PubMed]
- Mizutani, S.; Inouye, K.; Koide, H.; Kaziro, Y. Involvement of B-Raf in Ras-Induced Raf-1 Activation. FEBS Lett. 2001, 507, 295–298. [Google Scholar] [CrossRef] [PubMed]
- Rapp, U.; Goldsborough, M.; Mark, G.; Bonner, T.; Groffen, J.; Reynolds, F. Structure and Biological Activity of V-Raf, a Unique Oncogene Transduced by a Retrovirus. Proc. Natl. Acad. Sci. USA 1983, 80, 4218–4222. [Google Scholar] [CrossRef] [PubMed]
- Zuo, Z.; Liu, J.; Sun, Z.; Cheng, Y.-W.; Ewing, M.; Bugge, T.H.; Finkel, T.; Leppla, S.H.; Liu, S. ERK and C-Myc Signaling in Host-Derived Tumor Endothelial Cells Is Essential for Solid Tumor Growth. Proc. Natl. Acad. Sci. USA 2023, 120, e2211927120. [Google Scholar] [CrossRef]
- Yada, M.; Hatakeyama, S.; Kamura, T.; Nishiyama, M.; Tsunematsu, R.; Imaki, H.; Ishida, N.; Okumura, F.; Nakayama, K.; Nakayama, K.I. Phosphorylation-Dependent Degradation of c-Myc Is Mediated by the F-Box Protein Fbw7. EMBO J. 2004, 23, 2116–2125. [Google Scholar] [CrossRef] [PubMed]
- Welcker, M.; Orian, A.; Jin, J.; Grim, J.A.; Harper, J.W.; Eisenman, R.N.; Clurman, B.E. The Fbw7 Tumor Suppressor Regulates Glycogen Synthase Kinase 3 Phosphorylation-Dependent c-Myc Protein Degradation. Proc. Natl. Acad. Sci. USA 2004, 101, 9085–9090. [Google Scholar] [CrossRef] [PubMed]
- Johnson, D.E.; O’Keefe, R.A.; Grandis, J.R. Targeting the IL-6/JAK/STAT3 Signalling Axis in Cancer. Nat. Rev. Clin. Oncol. 2018, 15, 234–248. [Google Scholar] [CrossRef] [PubMed]
- Ning, R.; Chen, G.; Fang, R.; Zhang, Y.; Zhao, W.; Qian, F. Diosmetin Inhibits Cell Proliferation and Promotes Apoptosis through STAT3/c-Myc Signaling Pathway in Human Osteosarcoma Cells. Biol. Res. 2021, 54, 40. [Google Scholar] [CrossRef] [PubMed]
- Sun, J.; Du, Y.; Song, Q.; Nan, J.; Guan, P.; Guo, J.; Wang, X.; Yang, J.; Zhao, C. E2F Is Required for STAT3-Mediated Upregulation of Cyclin B1 and Cdc2 Expressions and Contributes to G2–M Phase Transition. Acta Biochim. Biophys. Sin. 2019, 51, 313–322. [Google Scholar] [CrossRef] [PubMed]
- Ma, L.; Zhang, J.; Wang, X.; Yang, J.; Guo, L.; Wang, X.; Song, B.; Dong, W.; Wang, W. Design and Synthesis of Diosgenin Derivatives as Apoptosis Inducers through Mitochondria-Related Pathways. Eur. J. Med. Chem. 2021, 217, 113361. [Google Scholar] [CrossRef] [PubMed]


Disclaimer/Publisher’s Note: The statements, opinions and data contained in all publications are solely those of the individual author(s) and contributor(s) and not of MDPI and/or the editor(s). MDPI and/or the editor(s) disclaim responsibility for any injury to people or property resulting from any ideas, methods, instructions or products referred to in the content. |
© 2024 by the authors. Licensee MDPI, Basel, Switzerland. This article is an open access article distributed under the terms and conditions of the Creative Commons Attribution (CC BY) license (https://creativecommons.org/licenses/by/4.0/).
Share and Cite
Wang, C.; Wang, B.; Mou, Y.; Liu, X.; Chen, Q.; Pu, W.; Rao, Q.; Wang, C.; Song, J.; Huang, Y.; et al. Design, Synthesis, and Anti-Leukemic Evaluation of a Series of Dianilinopyrimidines by Regulating the Ras/Raf/MEK/ERK and STAT3/c-Myc Pathways. Molecules 2024, 29, 1597. https://doi.org/10.3390/molecules29071597
Wang C, Wang B, Mou Y, Liu X, Chen Q, Pu W, Rao Q, Wang C, Song J, Huang Y, et al. Design, Synthesis, and Anti-Leukemic Evaluation of a Series of Dianilinopyrimidines by Regulating the Ras/Raf/MEK/ERK and STAT3/c-Myc Pathways. Molecules. 2024; 29(7):1597. https://doi.org/10.3390/molecules29071597
Chicago/Turabian StyleWang, Chaoyan, Bo Wang, Yu Mou, Xiang Liu, Qiqing Chen, Weidong Pu, Qing Rao, Chunlin Wang, Jingrui Song, Yubing Huang, and et al. 2024. "Design, Synthesis, and Anti-Leukemic Evaluation of a Series of Dianilinopyrimidines by Regulating the Ras/Raf/MEK/ERK and STAT3/c-Myc Pathways" Molecules 29, no. 7: 1597. https://doi.org/10.3390/molecules29071597