

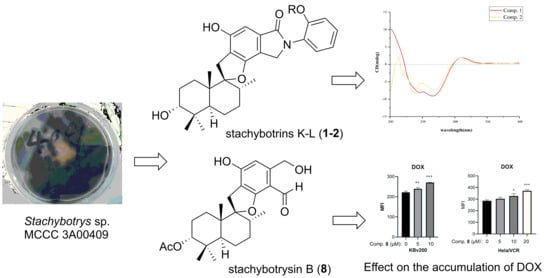
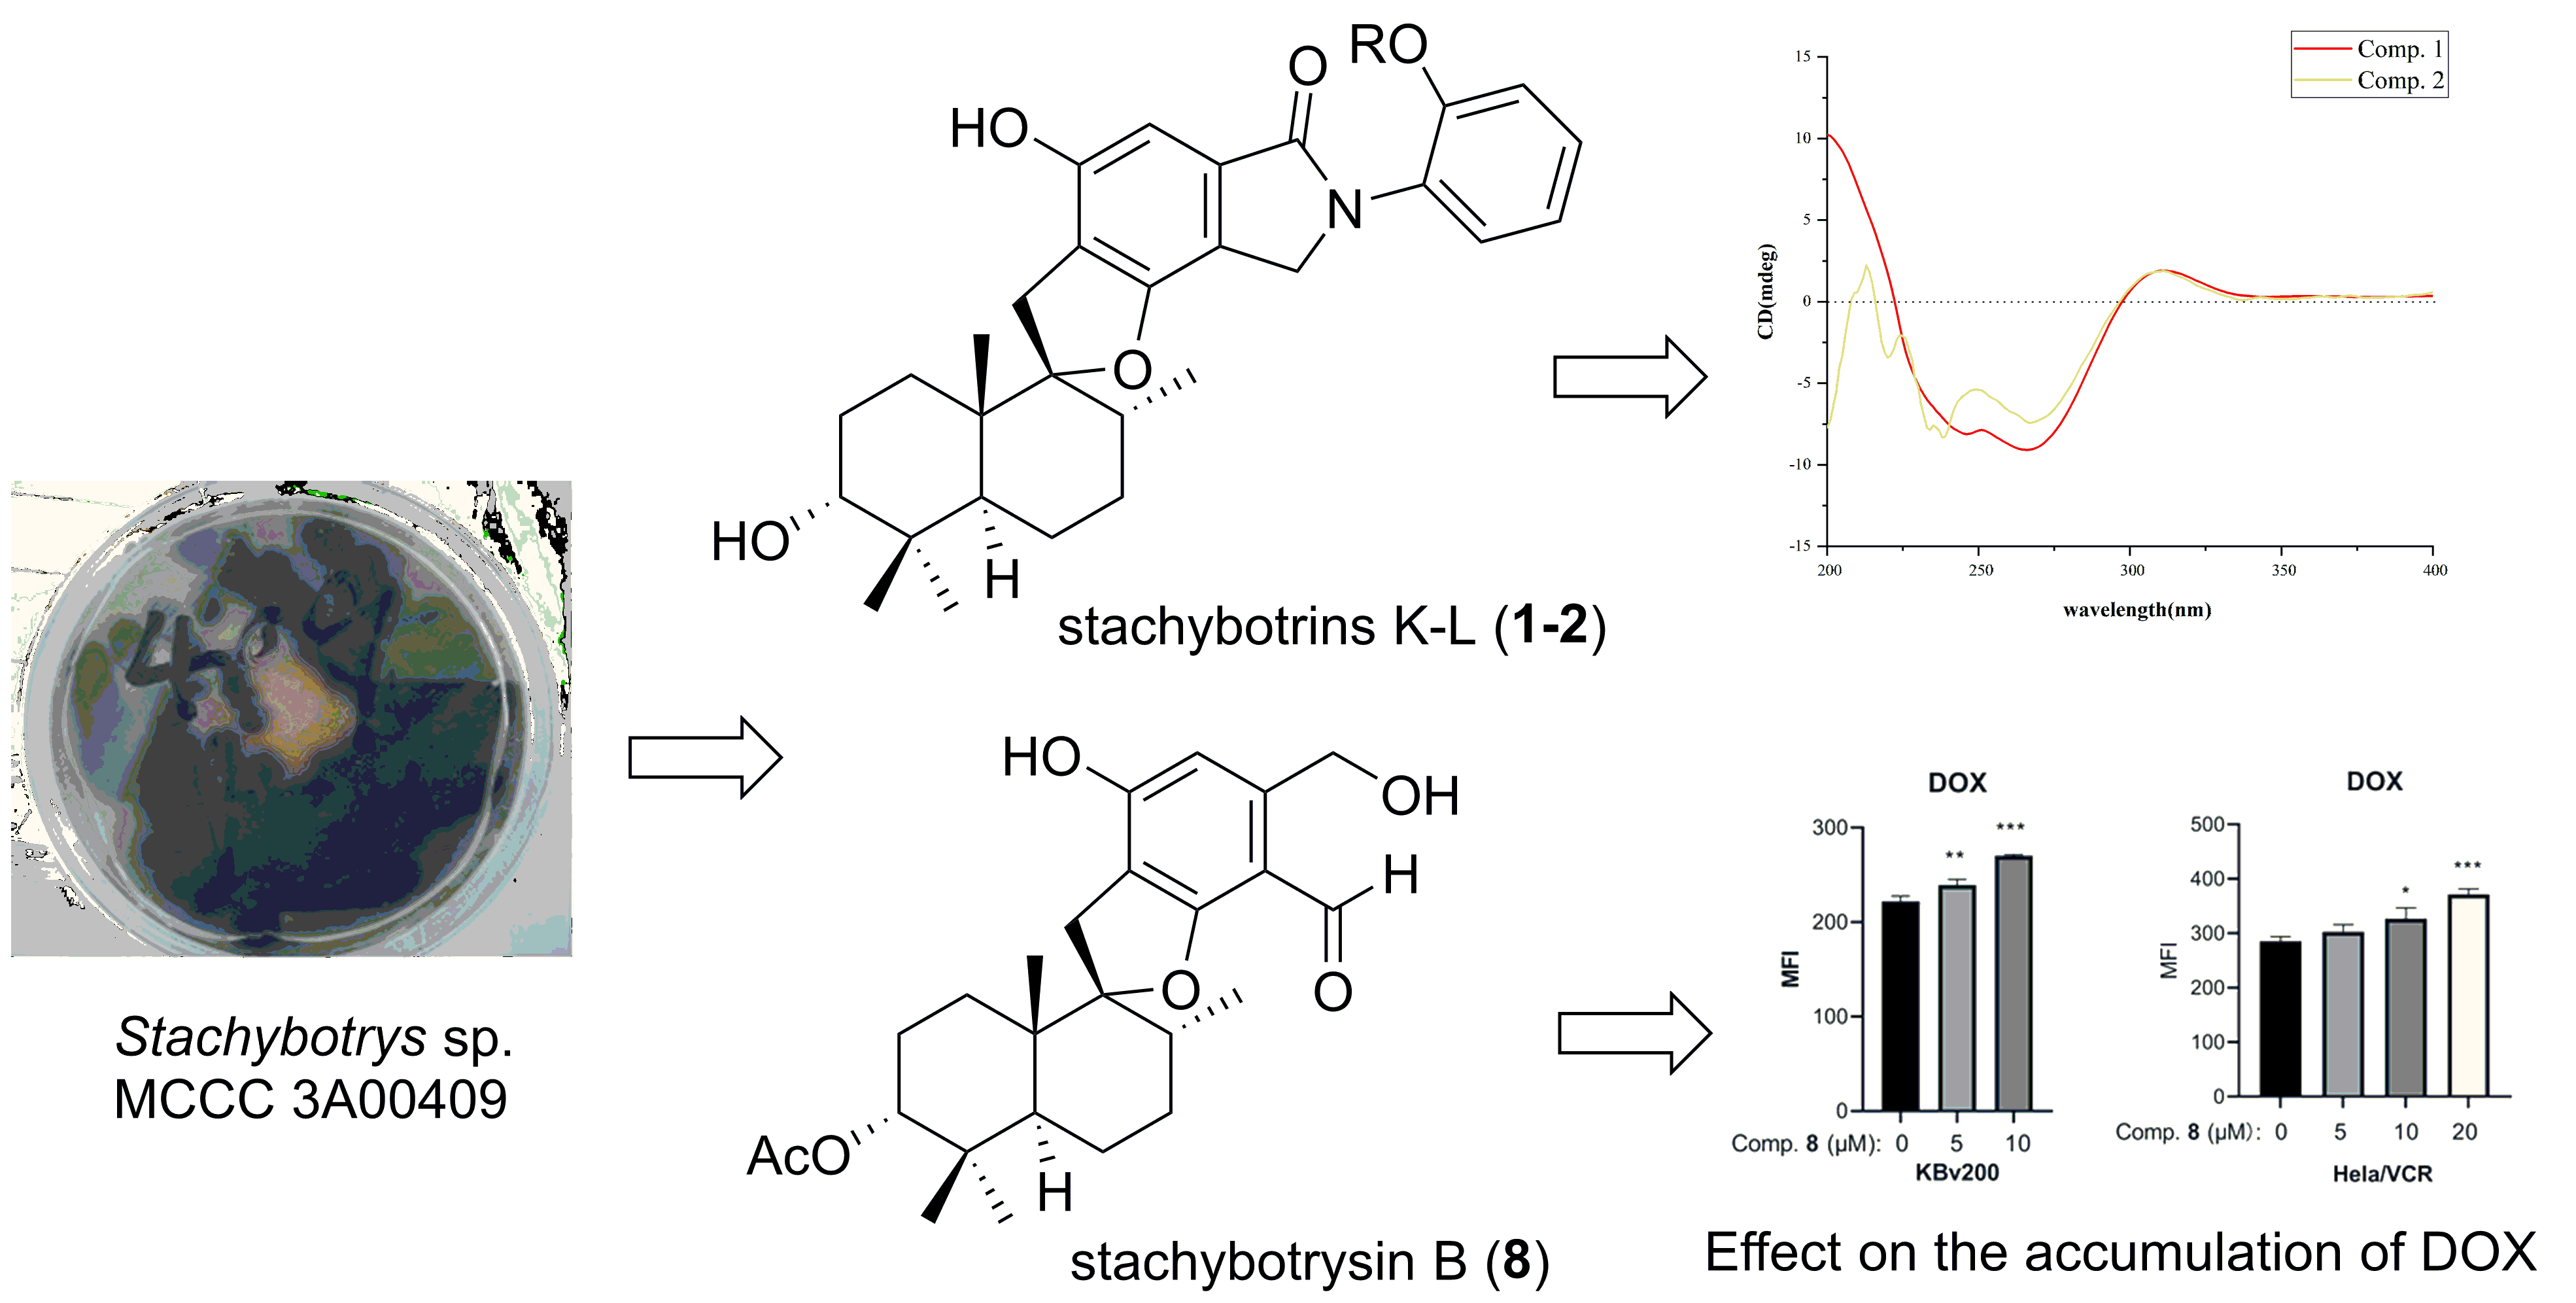
Phenylspirodrimane with Moderate Reversal Effect of Multidrug Resistance Isolated from the Deep-Sea Fungus Stachybotrys sp. 3A00409

 ,
,
Abstract
:
1. Introduction
2. Results and Discussion
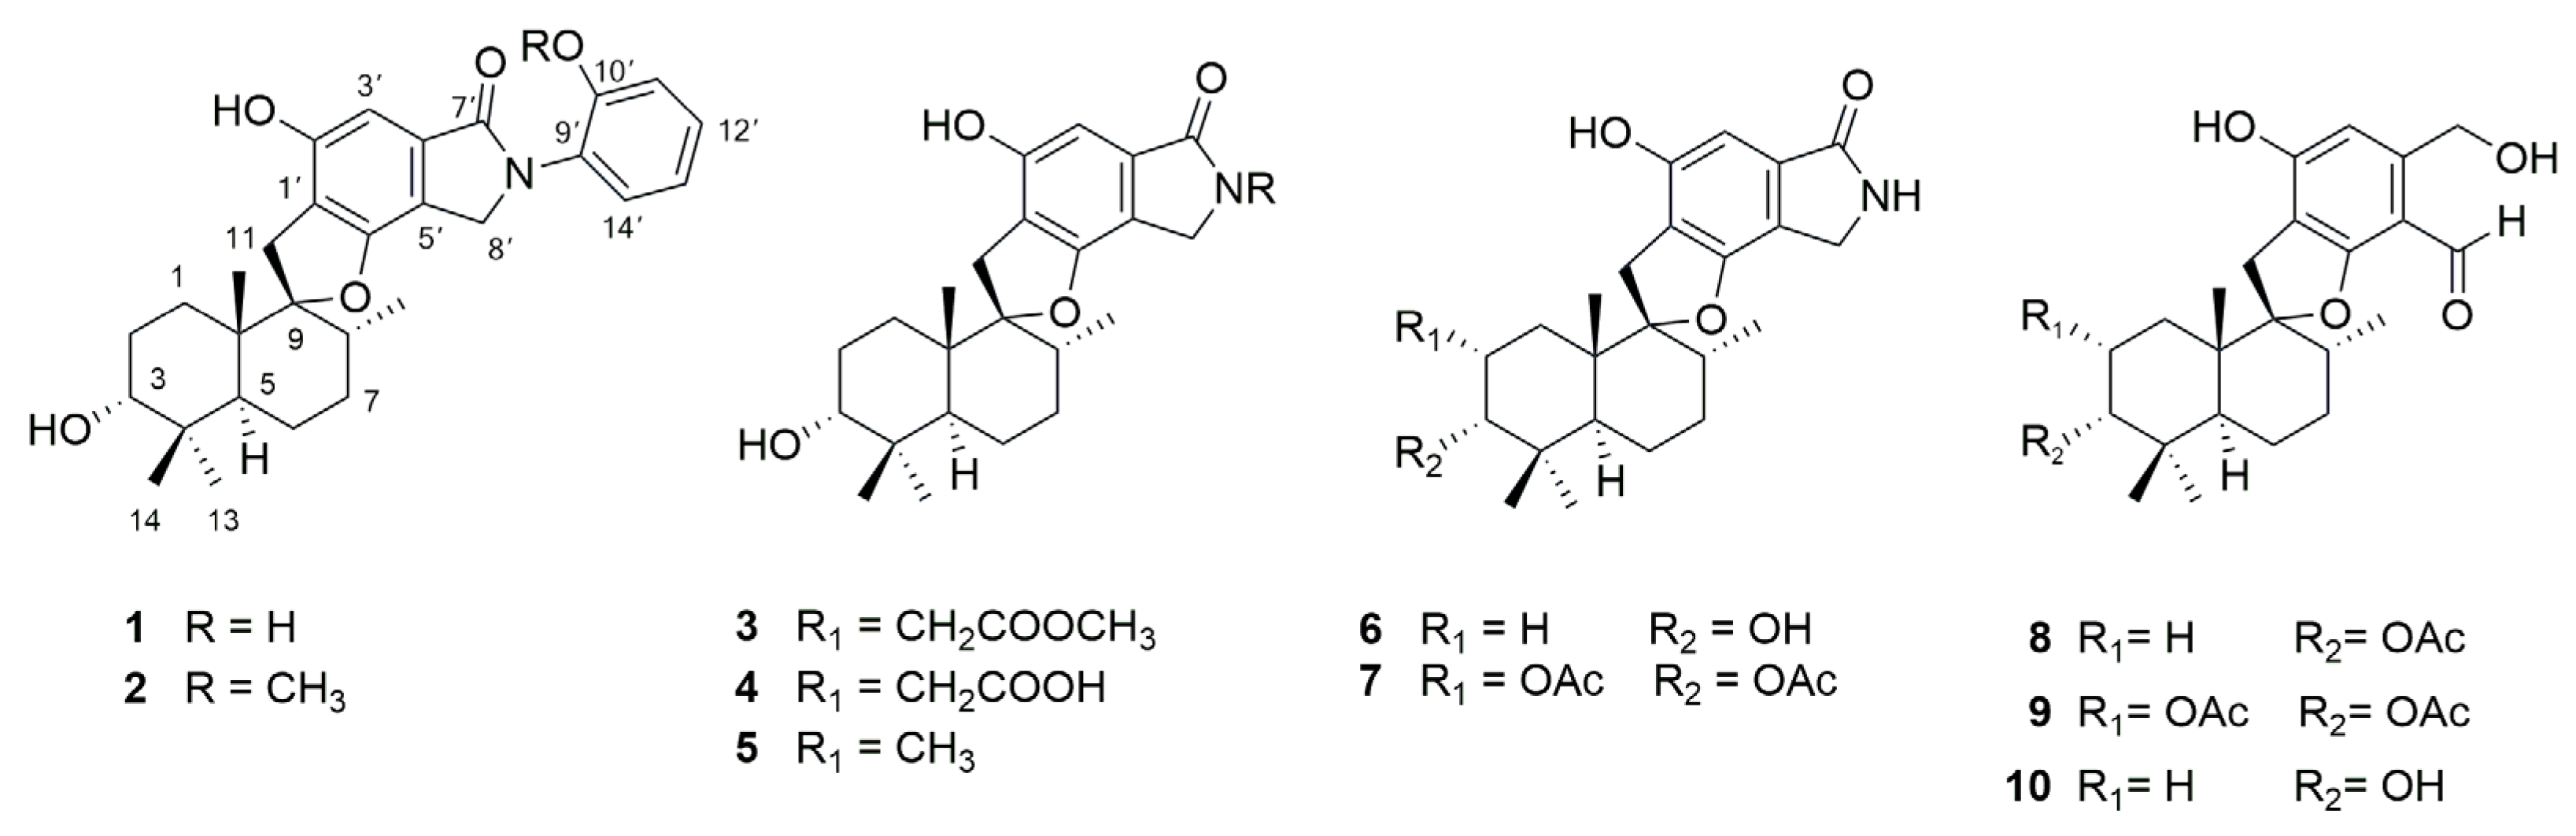
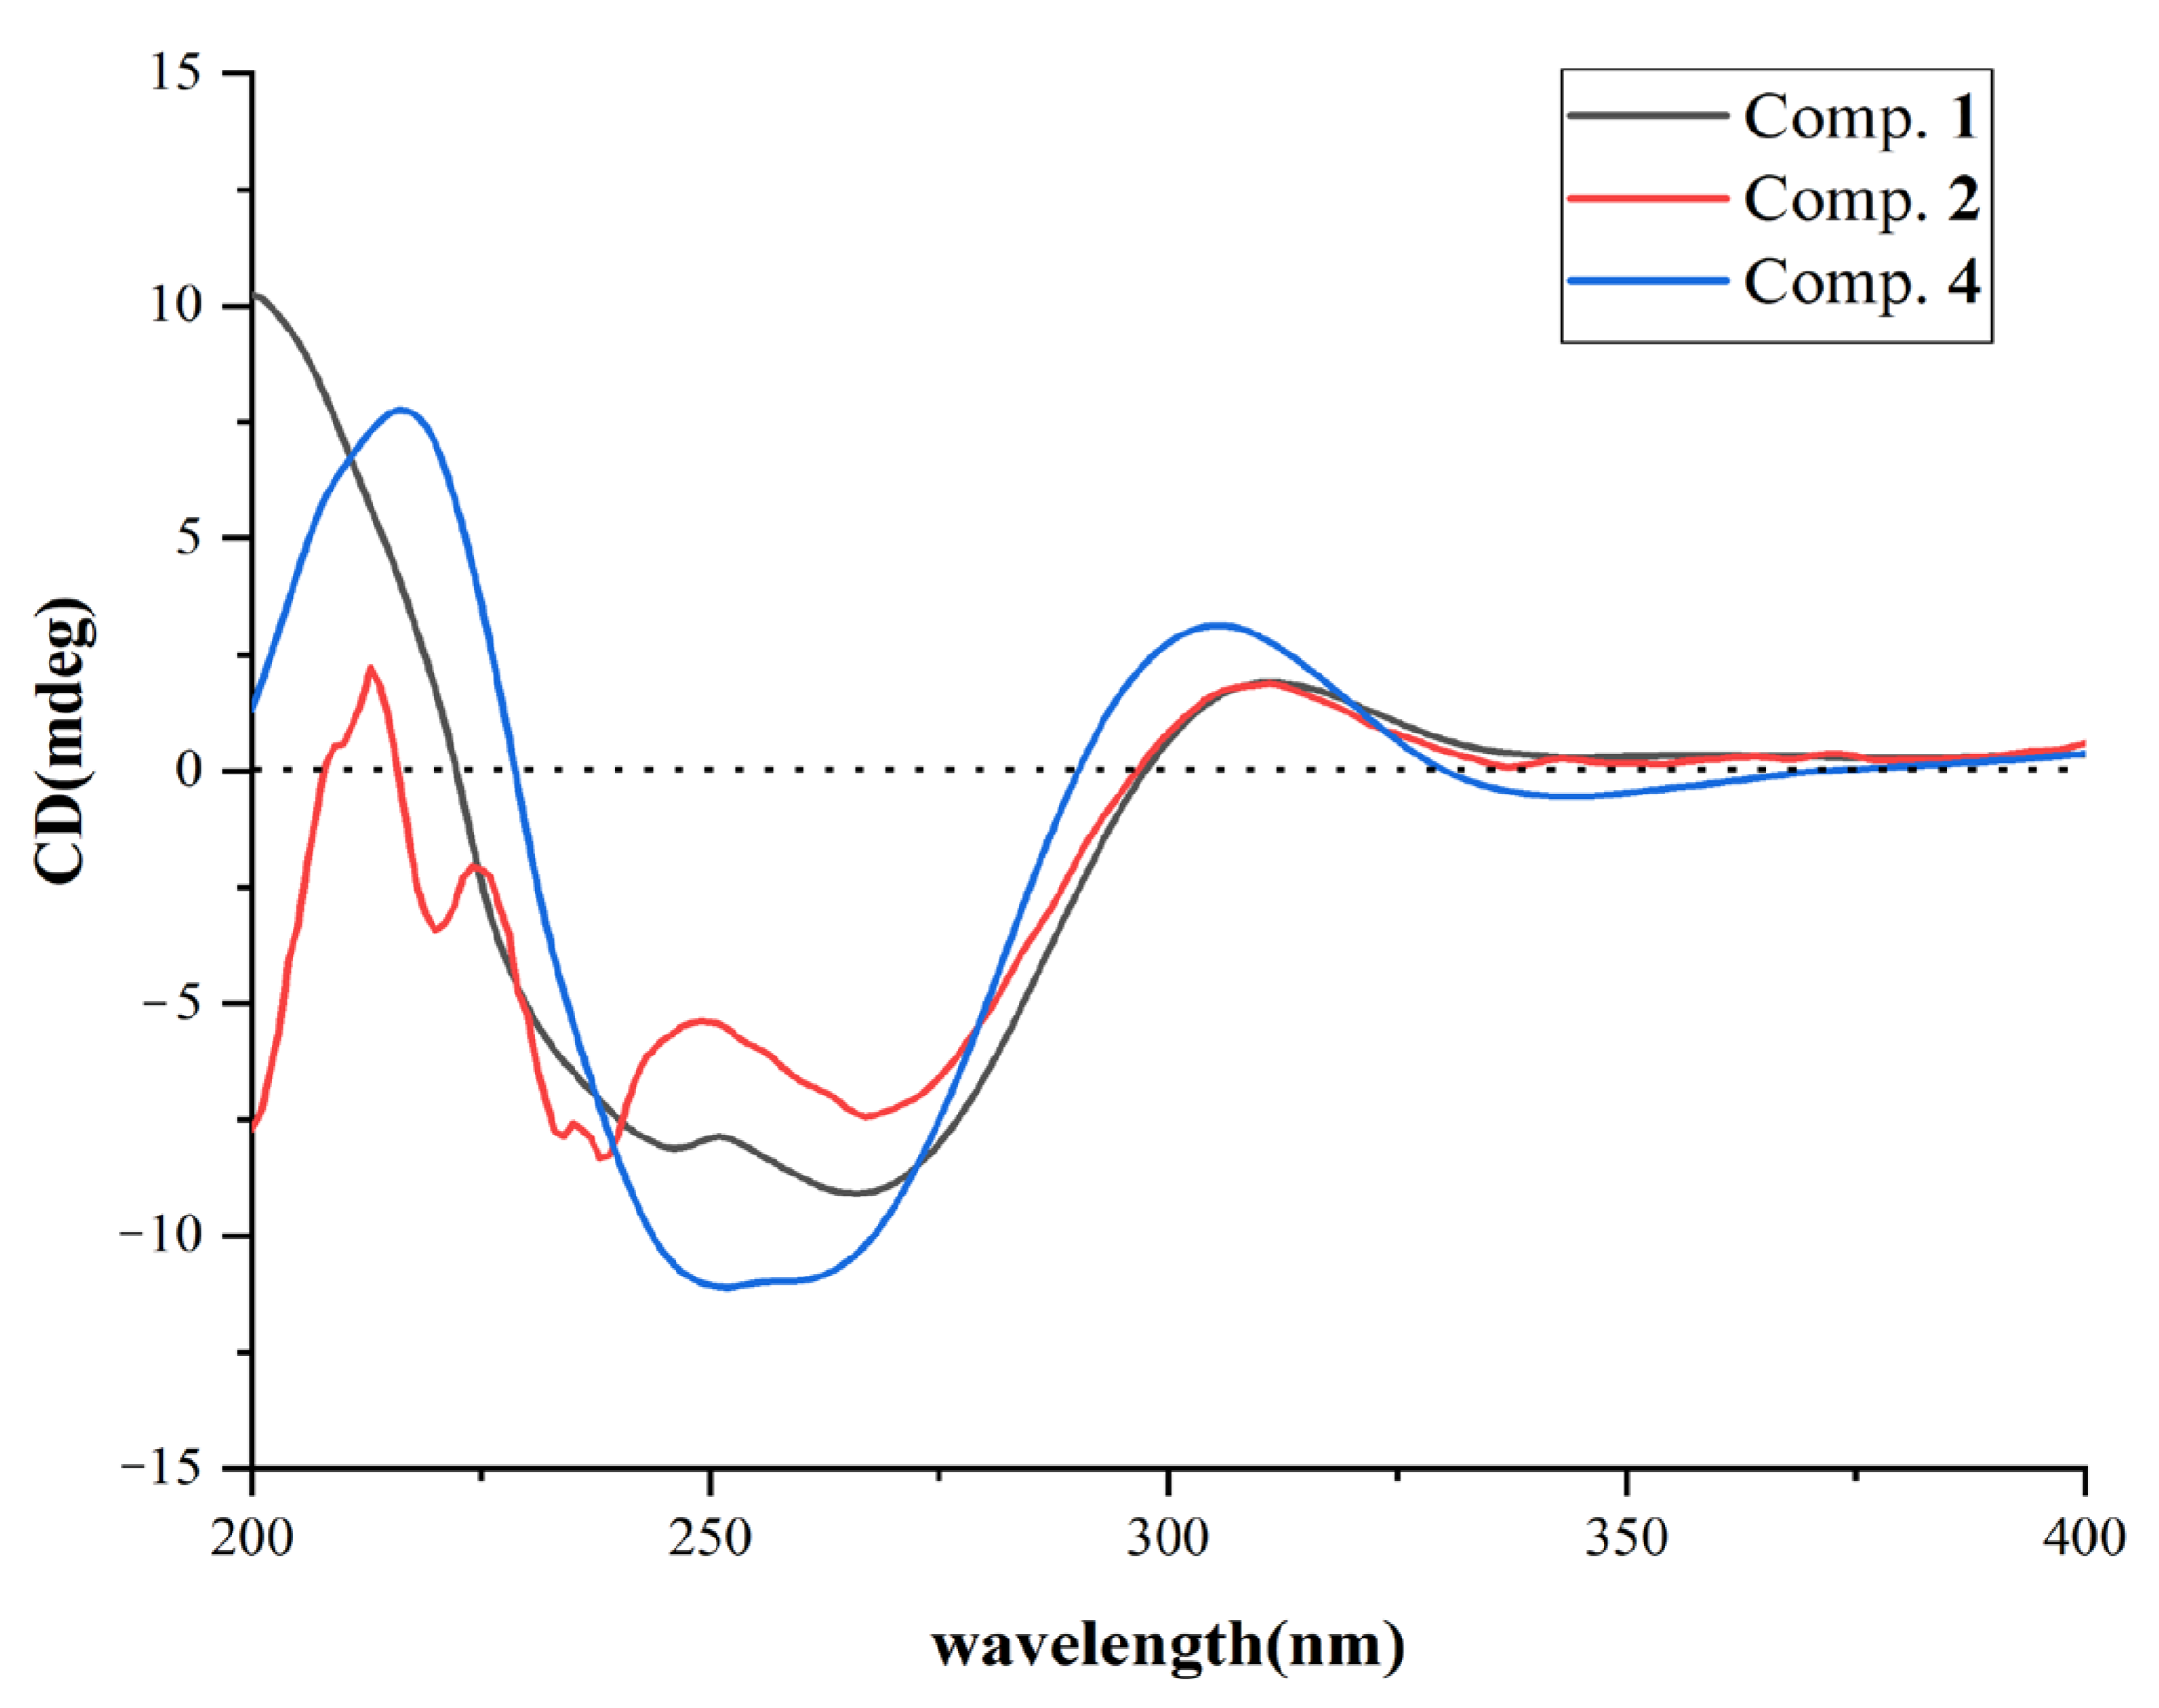
2.1. Structural Determination
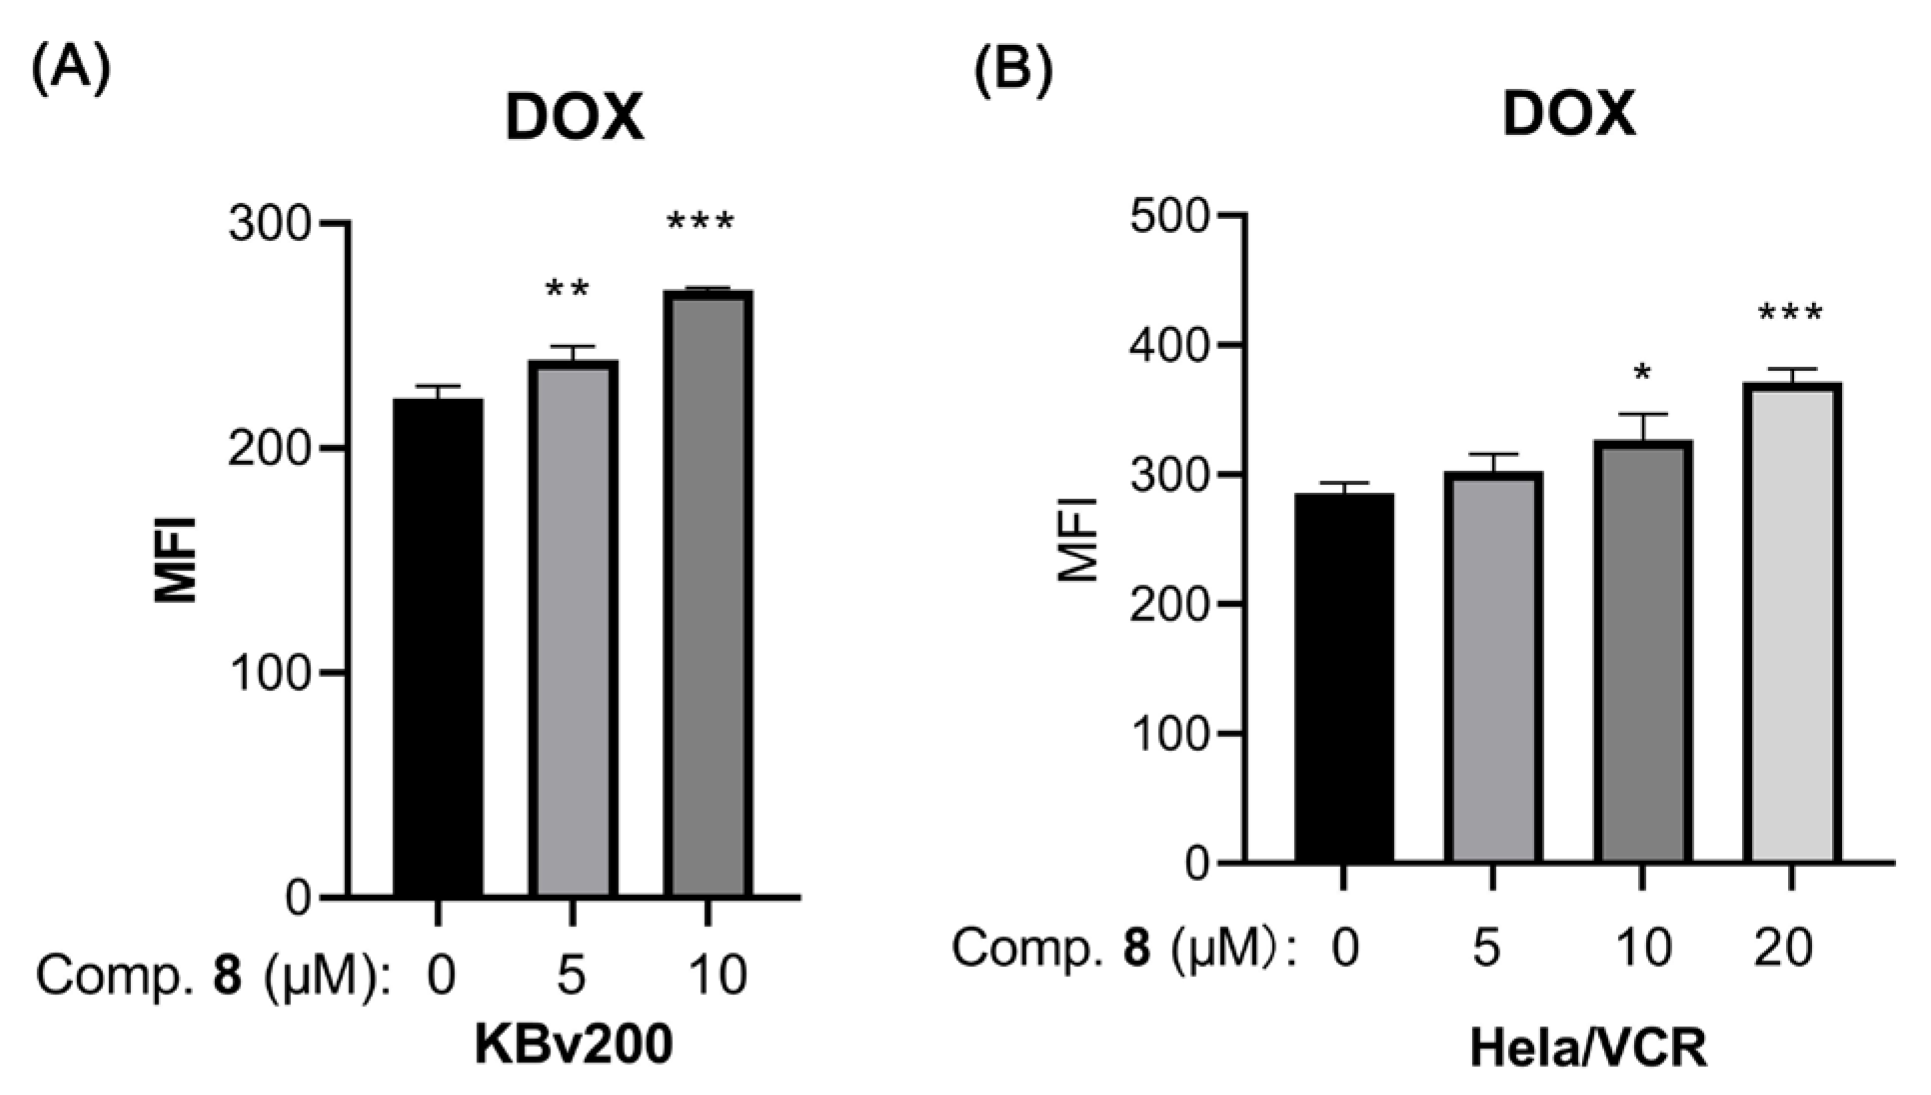
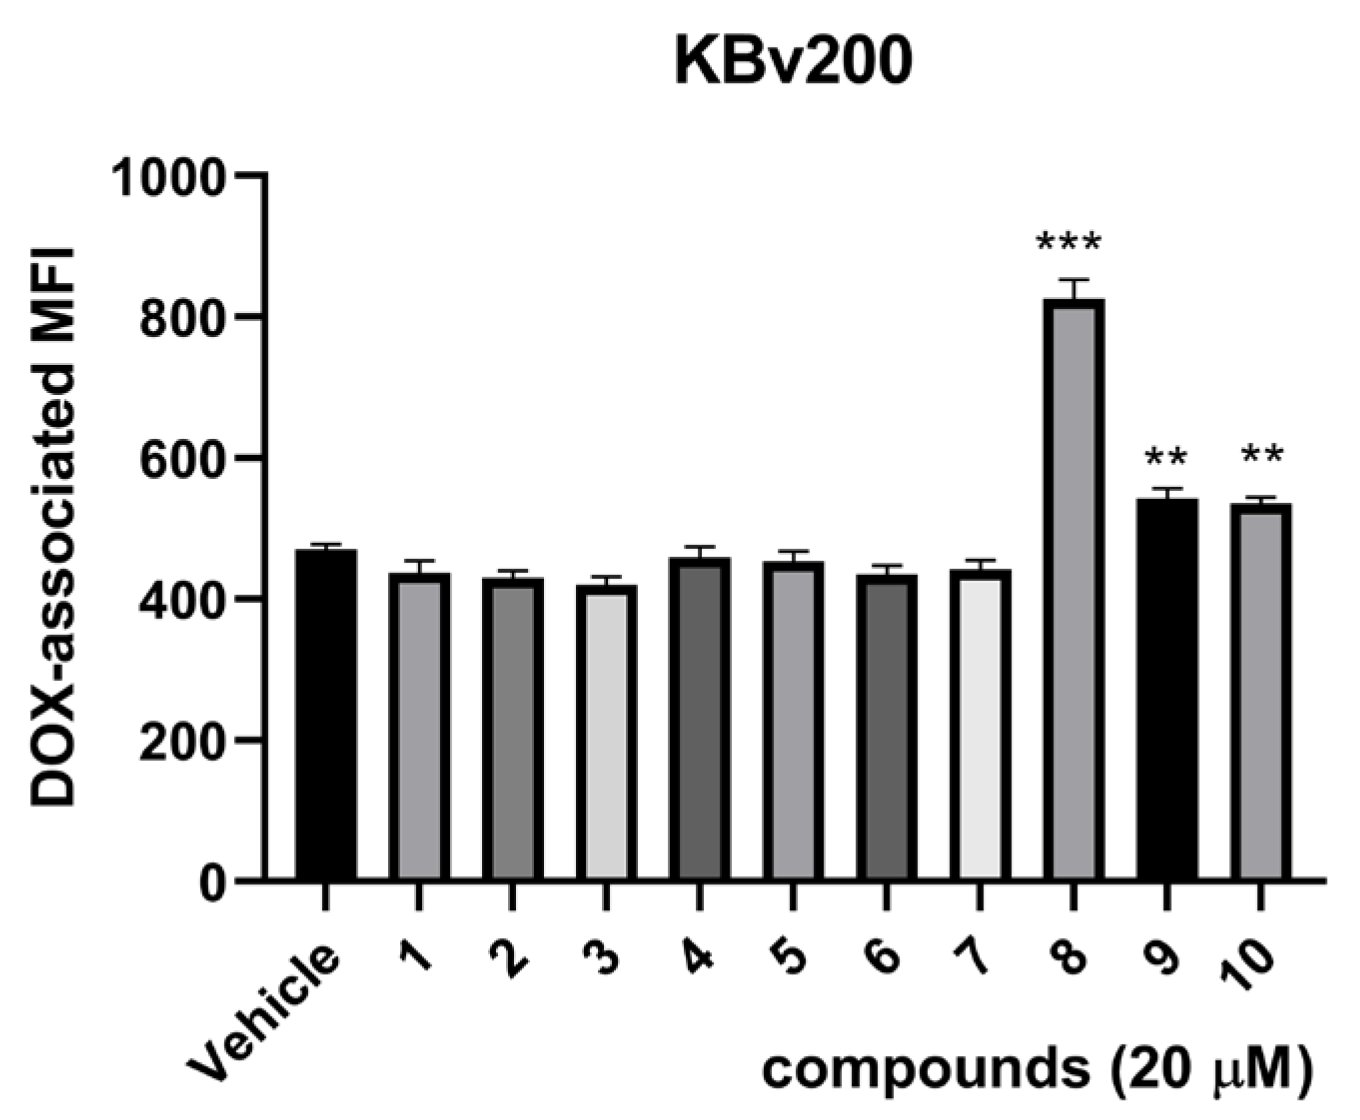
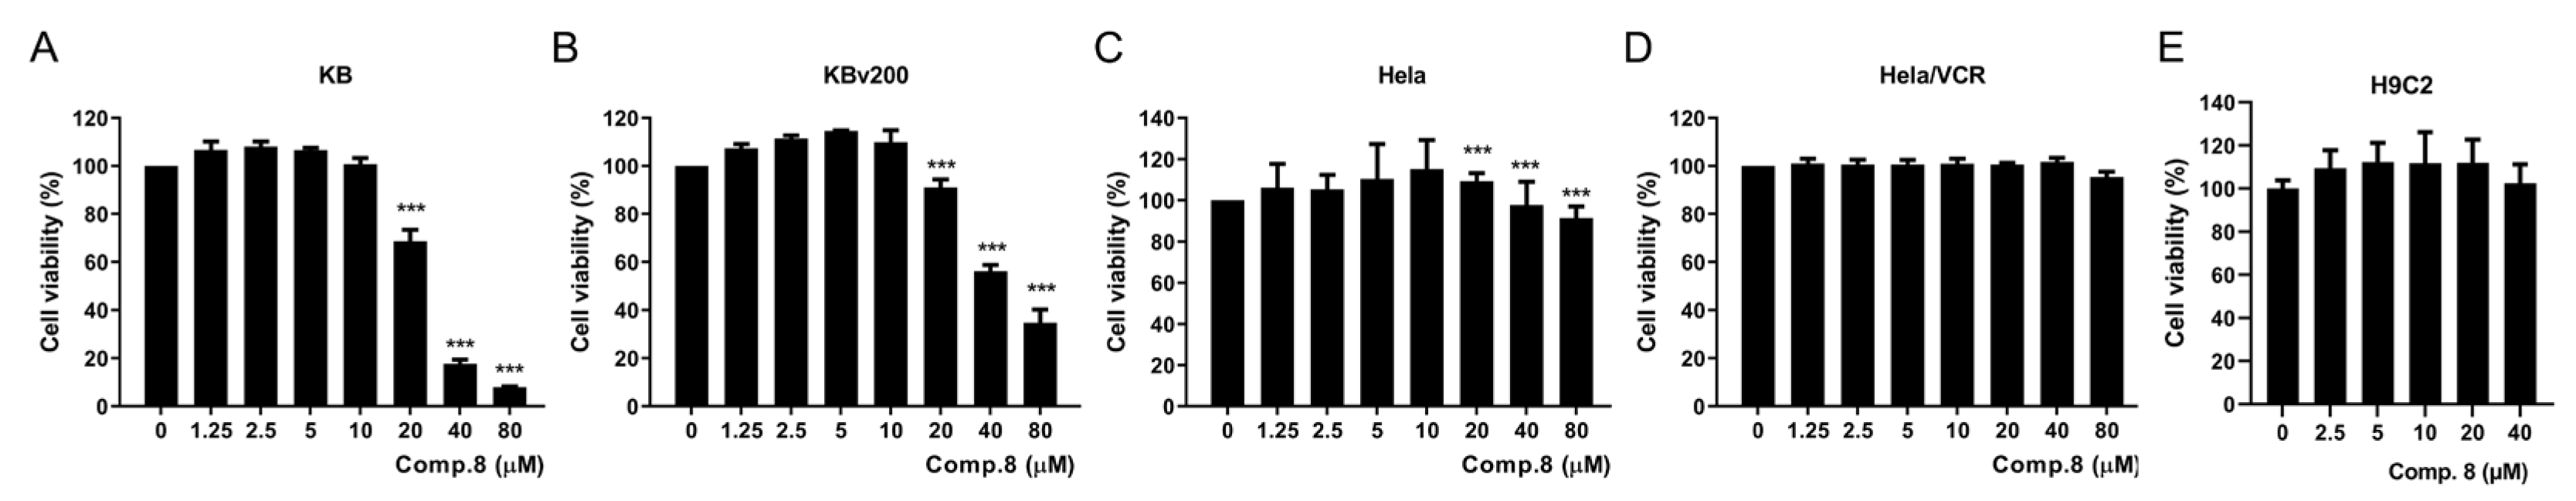
2.2. Biological Assays
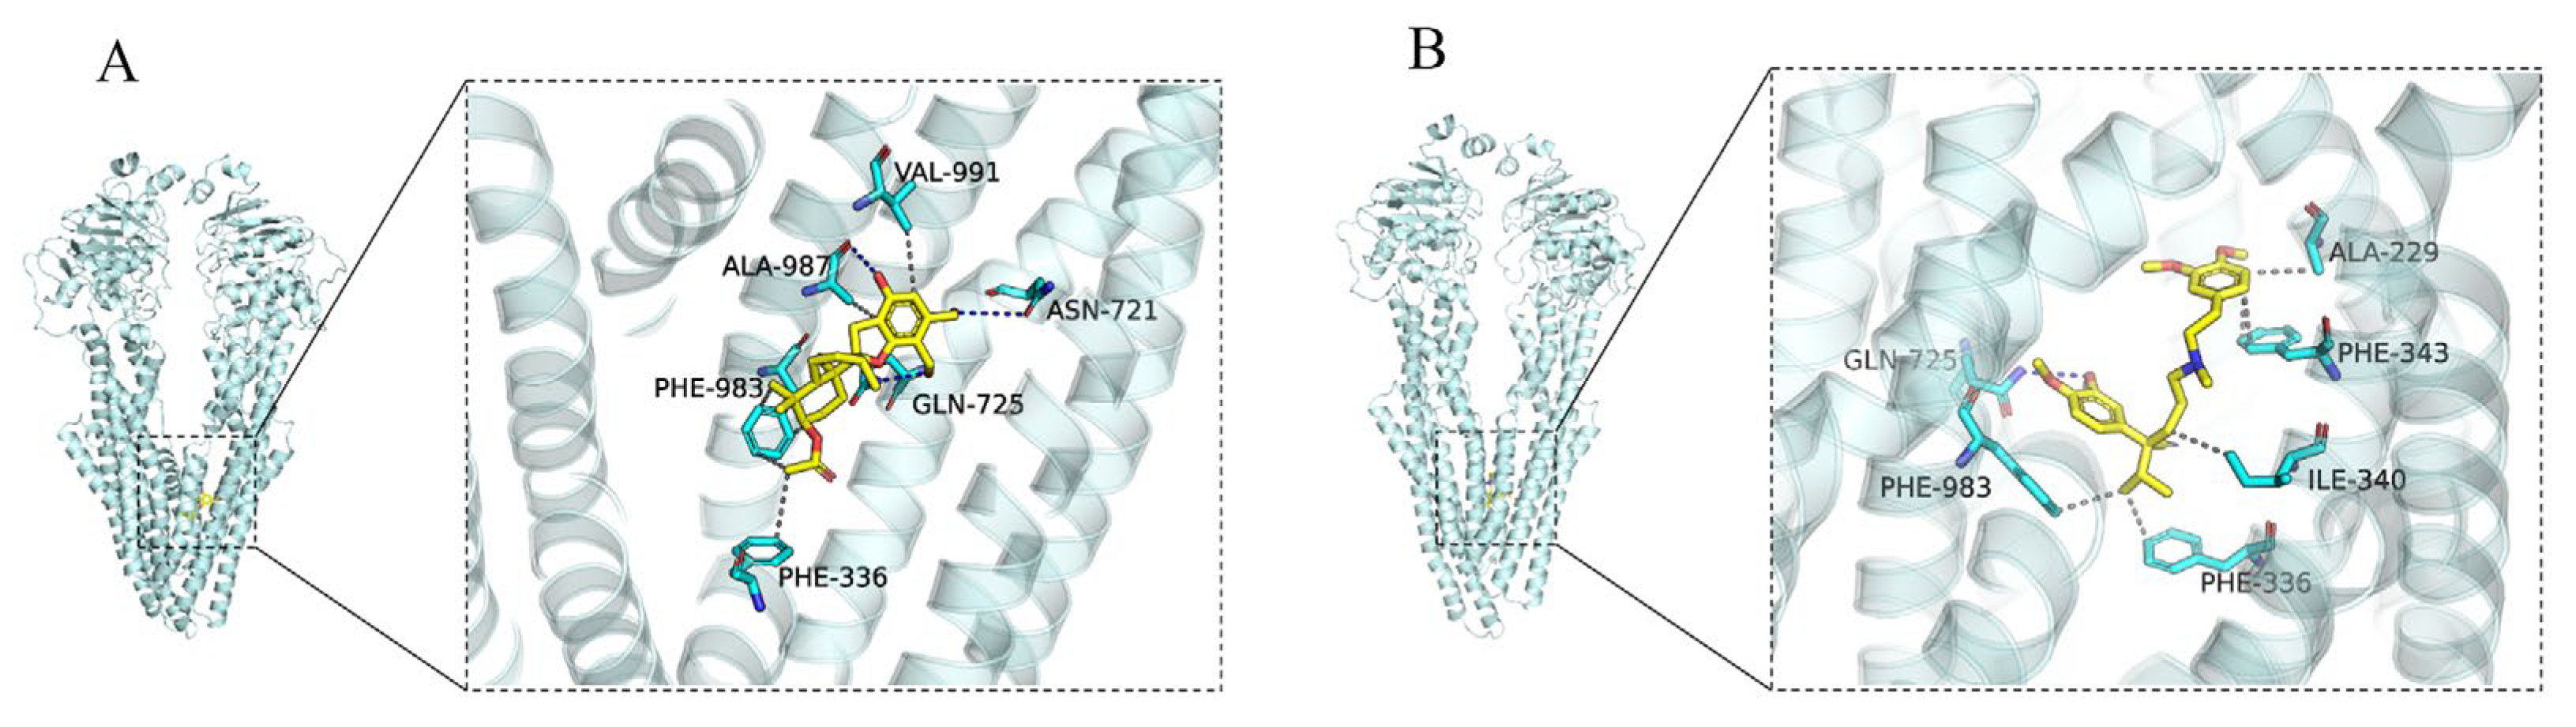
2.3. Docking Analysis of Compound 8 and Verapamil with ABCB1
3. Materials and Methods
3.1. General Experimental Procedure
3.2. Fungal Material
3.3. Extraction and Isolation
3.4. Cells and Materials
3.5. Cell Cytotoxicity Assay
3.6. DOX Accumulation Assay
3.7. Molecular Docking Analysis
3.8. Data Analysis
4. Conclusions
Supplementary Materials
Author Contributions
Funding
Data Availability Statement
Acknowledgments
Conflicts of Interest
References
- Sameiyan, E.; Hayes, A.W.; Karimi, G. The effect of medicinal plants on multiple drug resistance through autophagy: A review of in vitro studies. Eur. J. Pharmacol. 2019, 852, 244–253. [Google Scholar] [CrossRef] [PubMed]
- Luqmani, Y.A. Mechanisms of drug resistance in cancer chemotherapy. Med. Princ. Pract. 2005, 14, 35–48. [Google Scholar] [CrossRef] [PubMed]
- Zhang, Z.; Ma, C.; Li, P.; Wu, M.; Ye, S.; Fu, L.; Xu, J. Reversal effect of FW-04-806, a macrolide dilactone compound, on multidrug resistance mediated by ABCB1 and ABCG2 in vitro and in vivo. Cell Commun. Signal. 2019, 17, 110. [Google Scholar] [CrossRef] [PubMed]
- Szakács, G.; Paterson, J.K.; Ludwig, J.A.; Booth-Genthe, C.; Gottesman, M.M. Targeting multidrug resistance in cancer. Nat. Rev. Drug Discov. 2006, 5, 219–234. [Google Scholar] [CrossRef] [PubMed]
- Kumar, A.; Jaitak, V. Natural products as multidrug resistance modulators in cancer. Eur. J. Med. Chem. 2019, 176, 268–291. [Google Scholar] [CrossRef] [PubMed]
- Kartal-Yandim, M.; Adan-Gokbulut, A.; Baran, Y. Molecular mechanisms of drug resistance and its reversal in cancer. Crit. Rev. Biotechnol. 2016, 36, 716–726. [Google Scholar] [CrossRef]
- Gameiro, M.; Silva, R.; Rocha-Pereira, C.; Carmo, H.; Carvalho, F.; Bastos, M.L.; Remião, F. Cellular models and in vitro assays for the screening of modulators of P-gp, MRP1 and BCRP. Molecules 2017, 22, 600. [Google Scholar] [CrossRef] [PubMed]
- Engle, K.; Kumar, G. Cancer multidrug-resistance reversal by ABCB1 inhibition: A recent update. Eur. J. Med. Chem. 2022, 239, 114542. [Google Scholar] [CrossRef] [PubMed]
- Lai, J.I.; Tseng, Y.J.; Chen, M.H.; Huang, C.F.; Chang, P.M. Clinical perspective of FDA approved drugs with P-glycoprotein inhibition activities for potential cancer therapeutics. Front. Oncol. 2020, 10, 561936. [Google Scholar] [CrossRef]
- Chen, Z.; Chen, Y.; Xu, M.; Chen, L.; Zhang, X.; To, K.K.; Zhao, H.; Wang, F.; Xia, Z.; Chen, X.; et al. Osimertinib (AZD9291) enhanced the efficacy of chemotherapeutic agents in ABCB1- and ABCG2-overexpressing cells in vitro, in vivo, and ex vivo. Mol. Cancer Ther. 2016, 15, 1845–1858. [Google Scholar] [CrossRef] [PubMed]
- Yang, K.; Chen, Y.; To, K.K.; Wang, F.; Li, D.; Chen, L.; Fu, L. Alectinib (CH5424802) antagonizes ABCB1- and ABCG2-mediated multidrug resistance in vitro, in vivo and ex vivo. Exp. Mol. Med. 2017, 49, e303. [Google Scholar] [CrossRef]
- Karthikeyan, S.; Hoti, S.L. Development of fourth generation ABC inhibitors from natural products: A novel approach to overcome cancer multidrug resistance. Anticancer Agents Med. Chem. 2015, 15, 605–615. [Google Scholar] [CrossRef] [PubMed]
- Yang, Z.; Yang, X.; Li, Y.; Cai, Y.; Yu, Y.; Zhuang, W.; Sun, X.; Li, Q.; Bao, X.; Ye, X.; et al. Design, synthesis and biological evaluation of novel phenylfuran-bisamide derivatives as P-glycoprotein inhibitors against multidrug resistance in MCF-7/ADR cell. Eur. J. Med. Chem. 2023, 248, 115092. [Google Scholar] [CrossRef] [PubMed]
- Ross, D.D. Modulation of drug resistance transporters as a strategy for treating myelodysplastic syndrome. Best Pract. Res. Clin. Haematol. 2004, 17, 641–651. [Google Scholar] [CrossRef]
- Gandhi, L.; Harding, M.W.; Neubauer, M.; Langer, C.J.; Moore, M.; Ross, H.J.; Johnson, B.E.; Lynch, T.J. A phase II study of the safety and efficacy of the multidrug resistance inhibitor VX-710 combined with doxorubicin and vincristine in patients with recurrent small cell lung cancer. Cancer 2007, 109, 924–932. [Google Scholar] [CrossRef] [PubMed]
- Chi, K.N.; Chia, S.K.; Dixon, R.; Newman, M.J.; Wacher, V.J.; Sikic, B.; Gelmon, K.A. A phase I pharmacokinetic study of the P-glycoprotein inhibitor, ONT-093, in combination with paclitaxel in patients with advanced cancer. Investig. New Drugs. 2005, 23, 311–315. [Google Scholar] [CrossRef] [PubMed]
- Ma, Y.; Yin, D.; Ye, J.; Wei, X.; Pei, Y.; Li, X.; Si, G.; Chen, X.Y.; Chen, Z.S.; Dong, Y.; et al. Discovery of potent inhibitors against P-glycoprotein-mediated multidrug resistance aided by late-Stage functionalization of a 2-(4-(pyridin-2-yl)phenoxy)pyridine analogue. J. Med. Chem. 2020, 63, 5458–5476. [Google Scholar] [CrossRef]
- Waghray, D.; Zhang, Q. Inhibit or evade multidrug resistance P-glycoprotein in cancer treatment. J. Med. Chem. 2018, 61, 5108–5121. [Google Scholar] [CrossRef] [PubMed]
- Ibrahim, S.R.M.; Choudhry, H.; Asseri, A.H.; Elfaky, M.A.; Mohamed, S.G.A.; Mohamed, G.A. Stachybotrys chartarum-A hidden treasure: Secondary metabolites, bioactivities, and biotechnological relevance. J. Fungi 2022, 8, 504. [Google Scholar] [CrossRef]
- Wang, A.; Xu, Y.; Gao, Y.; Huang, Q.; Luo, X.; An, H.; Dong, J. Chemical and bioactive diversities of the genera Stachybotrys. Phytochem. Rev. 2015, 14, 623–655. [Google Scholar] [CrossRef]
- Wang, S.; Li, S.; Chen, Y.; Wang, Y.; Liu, Z.; Zhang, W.; Deng, H. A new phenylspirodrimane derivative from the deep-sea-derived fungus Stachybotrys chartarum FS705. Nat. Prod. Res. 2024, 22, 1–7. [Google Scholar] [CrossRef] [PubMed]
- Dayras, M.; Sfecci, E.; Bovio, E.; Rastoin, O.; Dufies, M.; Fontaine-Vive, F.; Taffin-de-Givenchy, E.; Lacour, T.; Pages, G.; Varese, G.C.; et al. New phenylspirodrimanes from the sponge-associated fungus Stachybotrys chartarum MUT 3308. Mar. Drugs 2023, 21, 135. [Google Scholar] [CrossRef] [PubMed]
- Bao, Y.R.; Feng, H.L.; Yao, X.S. Stachybotranes A-D, phenylspirodrimanes from the wetland fungus Stachybotrys chartarum with cytotoxic activities. Nat. Prod. Res. 2022, 36, 3894–3900. [Google Scholar] [CrossRef] [PubMed]
- Jagels, A.; Hövelmann, Y.; Zielinski, A.; Esselen, M.; Köhler, J.; Hübner, F.; Humpf, H. Stachybotrychromenes A-C: Novel cytotoxic meroterpenoids from Stachybotrys sp. Mycotoxin Res. 2018, 534, 179–185. [Google Scholar] [CrossRef] [PubMed]
- Ma, X.; Li, L.; Zhu, T.; Ba, M.; Li, G.; Gu, Q.; Guo, Y.; Li, D. Phenylspirodrimanes with anti-HIV activity from the sponge-derived fungus Stachybotrys chartarum MXH-X73. J. Nat. Prod. 2013, 76, 2298–2306. [Google Scholar] [CrossRef] [PubMed]
- Ma, X.H.; Zheng, W.M.; Sun, K.H.; Gu, X.F.; Zeng, X.M.; Zhang, H.T.; Zhong, T.H.; Shao, Z.Z.; Zhang, Y.H. Two new phenylspirodrimanes from the deep-sea derived fungus Stachybotrys sp. MCCC 3A00409. Nat. Prod. Res. 2019, 33, 386–392. [Google Scholar] [CrossRef]
- Zhang, P.P.; Li, Y.F.; Jia, C.X.; Lang, J.J.; Niaz, S.I.; Li, J. Antiviral and anti-inflammatory meroterpenoids: Stachybonoids A-F from the crinoid-derived fungus Stachybotrys chartarum 952. RSC Adv. 2017, 7, 49910–49916. [Google Scholar] [CrossRef]
- Feng, J.M.; Li, M.; Zhao, J.L.; Jia, X.N.; Liu, J.M.; Zhang, M.; Chen, R.D.; Xie, K.B.; Chen, D.W.; Yu, H.B.; et al. Three new phenylspirodrimane derivatives with inhibitory effect towards potassium channel Kv1.3 from the fungus Stachybotrys chartarum. J. Asian Nat. Prod. Res. 2019, 21, 887–894. [Google Scholar] [CrossRef] [PubMed]
- Jarvis, B.B.; Salemme, J.; Morais, A. Stachybotrys toxins. 1. Nat. Toxins 1995, 3, 10–16. [Google Scholar] [CrossRef] [PubMed]
- Zhao, J.; Feng, J.; Tan, Z.; Liu, J.; Zhao, J.; Chen, R.; Xie, K.; Zhang, D.; Li, Y.; Yu, L.; et al. Stachybotrysins A-G, phenylspirodrimane derivatives from the fungus Stachybotrys chartarum. J. Nat. Prod. 2017, 80, 1819–1826. [Google Scholar] [CrossRef]
- Kaneto, R.; Dobashi, K.; Kojima, I.; Sakai, K.; Shibamoto, N.; Yoshika, T.; Nishida, H.; Okamoto, R.; Akagawa, H.; Mizuno, S.; et al. Mer-NF5003B, E and F, novel sesquiterpenoids as avian myeloblastosis virus protease inhibitors produced by Stachybotrys sp. J. Antibiot. 1994, 47, 727–730. [Google Scholar] [CrossRef] [PubMed]
- Liang, B.J.; Lusvarghi, S.; Ambudkar, S.V.; Huang, H.C. Mechanistic insights into photodynamic regulation of adenosine 5′-triphosphate-binding cassette drug transporters. ACS Pharmacol. Transl. Sci. 2021, 4, 1578–1587. [Google Scholar] [CrossRef] [PubMed]
- Wu, C.P.; Hsiao, S.H.; Huang, Y.H.; Hung, L.C.; Yu, Y.J.; Chang, Y.T.; Hung, T.H.; Wu, Y.S. Sitravatinib sensitizes ABCB1- and ABCG2-overexpressing multidrug-resistant cancer cells to chemotherapeutic drugs. Cancers 2020, 12, 195. [Google Scholar] [CrossRef] [PubMed]
- Narayanan, S.; Gujarati, N.A.; Wang, J.Q.; Wu, Z.X.; Koya, J.; Cui, Q.; Korlipara, V.L.; Ashby, C.R., Jr.; Chen, Z.S. The novel benzamide derivative, VKNG-2, restores the efficacy of chemotherapeutic drugs in colon cancer cell lines by inhibiting the ABCG2 transporter. Int. J. Mol. Sci. 2021, 22, 2463. [Google Scholar] [CrossRef] [PubMed]
- Wang, X.; Zhang, T.; Chen, X.; Xu, Y.; Li, Z.; Yang, Y.; Du, X.; Jiang, Z.; Ni, H. Simultaneous inhibitory effects of all-trans astaxanthin on acetylcholinesterase and oxidative stress. Mar. Drugs 2022, 20, 247. [Google Scholar] [CrossRef]
- Wu, M.; Shen, C.E.; Lin, Q.F.; Zhong, J.Y.; Zhou, Y.F.; Liu, B.C.; Xu, J.H.; Zhang, Z.Q.; Li, P. Sterols and triterpenoids from Ganoderma lucidum and their reversal activities of tumor multidrug resistance. Nat. Prod. Res. 2022, 36, 1396–1399. [Google Scholar] [CrossRef] [PubMed]
- Shi, Z.; Liang, Y.J.; Chen, Z.S.; Wang, X.W.; Wang, X.H.; Ding, Y.; Chen, L.M.; Yang, X.P.; Fu, L.W. Reversal of MDR1/P-glycoprotein-mediated multidrug resistance by vector-based RNA interference in vitro and in vivo. Cancer Biol. Ther. 2006, 5, 39–47. [Google Scholar] [CrossRef]
- Alam, A.; Kowal, J.; Broude, E.; Roninson, I.; Locher, K.P. Structural insight into substrate and inhibitor discrimination by human P-glycoprotein. Science 2019, 363, 753–756. [Google Scholar] [CrossRef] [PubMed]
- DeLano, W.L. Pymol: An open-source molecular graphics tool. CCP4 Newsl. Protein Crystallogr. 2002, 40, 82–92. [Google Scholar]
- Ravindranath, P.A.; Forli, S.; Goodsell, D.S.; Olson, A.J.; Sanner, M.F. AutoDockFR: Advances in protein-ligand docking with explicitly specified binding site flexibility. PLoS Comput. Biol. 2015, 11, e1004586. [Google Scholar] [CrossRef] [PubMed]
- Trott, O.; Olson, A.J. AutoDock Vina: Improving the speed and accuracy of docking with a new scoring function, efficient optimization, and multithreading. J. Comput. Chem. 2010, 31, 455–461. [Google Scholar] [CrossRef]


| Name | Chemical Structure | Mechanism of Action | Adverse Effects | Phase |
|---|---|---|---|---|
| First generation | ||||
| Verapamil | 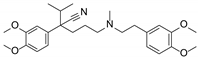 | Calcium channel blocker | Hypotension, cardiotoxicity | Phase II |
| Cyclosporine A |  | P-gp inhibitor | Not significant | Phase II |
| Qunine |  | P-gp inhibitor | Myelosuppression | Phase III |
| Second generation | ||||
| Dexverapamil |  | Calcium channel blocker | Cardiotoxicity | Phase II |
| Valspodar (PSC833) |  | P-gp inhibitor | Not significant | Phase III |
| Biricodar (VX-710) | 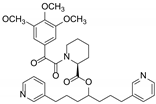 | P-gp inhibitor | Neutropenia | Phase II |
| Third generation | ||||
| Laniquidar (R101933) | 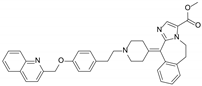 | P-gp inhibitor | Mucositis and neutropenic fever | Phase II |
| Zosuquidar (LY335979) | 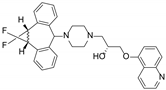 | P-gp inhibitor | Neurotoxicity | Phase III |
| Tariquidar (XR9576) |  | P-gp inhibitor | Not significant | Phase II |
| ONT-093 |  | P-gp inhibitor | Not significant | Phase I |
| No. | 1 | 2 | ||
|---|---|---|---|---|
| δC | δH (J in Hz) | δC | δH (J in Hz) | |
| 1 | 23.9, CH2 | 0.94, m; 1.79, m | 23.9, CH2 | 0.94, m; 1.78, m |
| 2 | 24.9, CH2 | 1.37, m; 1.76, m | 24.9, CH2 | 1.36, m; 1.75, m |
| 3 | 73.5, CH | 3.17, brs | 73.5, CH | 3.16, brs |
| 4 | 36.5, C | 36.5, C | ||
| 5 | 39.9, CH | 2.01, d (8.3) | 39.9, CH | 2.00, m |
| 6 | 20.5, CH2 | 1.42, m; 1.46, m | 20.5, CH2 | 1.41, m; 1.45, m |
| 7 | 30.8, CH2 | 1.39, m; 1.52, m | 30.8, CH2 | 1.39, m; 1.51, m |
| 8 | 37.3, CH | 1.82, m | 37.3, CH | 1.81, m |
| 9 | 98.1, C | 98.1, C | ||
| 10 | 41.8, C | 41.9, C | ||
| 11 | 31.7, CH2 | 3.14, d (17.5) 2.79 (d, 17.0) | 31.7, CH2 | 3.14, d (17.9) 2.79, d (17.1) |
| 12 | 15.6, CH3 | 0.68, d (6.4) | 15.6, CH3 | 0.68, d (6.4) |
| 13 | 28.7, CH3 | 0.86, s | 28.7, CH3 | 0.86, s |
| 14 | 22.4, CH3 | 0.79, s | 22.4, CH3 | 0.79, s |
| 15 | 15.8, CH3 | 0.95, s | 15.8, CH3 | 0.95, s |
| 1′ | 117.1, C | 117.2 s | ||
| 2′ | 153.8, C | 153.9 s | ||
| 3′ | 101.1, CH | 6.64, s | 101.2, CH | 6.64, s |
| 4′ | 133.6, C | 133.5, C | ||
| 5′ | 112.5, C | 112.4, C | ||
| 6′ | 155.9, C | 155.9, C | ||
| 7′ | 167.2, C | 167.1, C | ||
| 8′ | 48.8, CH2 | 4.62, brs | 49.0, CH2 | 4.53, dd (16.2) 4.61, dd (16.2) |
| 9′ | 125.7, C | 126.8, C | ||
| 10′ | 152.8, C | 154.9, C | ||
| 11′ | 116.8, CH | 6.96, d (8.0) | 112.4, CH | 7.15, d (8.2) |
| 12′ | 128.2, CH | 7.17, t (7.6) | 128.7, CH | 7.34, t (7.8) |
| 13′ | 119.2, CH | 6.86, t (7.5) | 120.5, CH | 7.01, t (7.6) |
| 14′ | 128.6, CH | 7.31, d (6.9) | 129.0, CH | 7.36, dd (7.6, 1.6) |
| 15′ | 55.6, CH3 | 3.79 s | ||
| 3-OH | 4.09, d (2.9) | 4.11, d (2.6) | ||
| Compound | IC50 ± SD μM (Fold Reversal) | |||
|---|---|---|---|---|
| KB | KBv200 | |||
| Doxorubicin | 0.007 ± 0.008 | 3.706 ± 1.224 | ||
| +5 μmol L−1 8 | 0.007 ± 0.007 | 1.00 | 2.414 ± 1.814 | 1.54 |
| +10 μmol L−1 8 | 0.007 ± 0.007 | 1.00 | 1.897 ± 1.648 | 1.95 |
| Navelbine | 0.001 ± 0.0001 | 2.514 ± 2.271 | ||
| +5 μmol L−1 8 | 0.001 ± 0.0001 | 1.00 | 0.800 ± 0.240 | 3.14 |
| +10 μmol L−1 8 | 0.001 ± 0.0001 | 1.00 | 0.517 ± 0.007 | 4.86 |
| Cisplatin | 0.385 ± 0.204 | 0.810 ± 0.377 | ||
| +5 μmol L−1 8 | 0.455 ± 0.234 | 0.84 | 0.913 ± 0.426 | 0.89 |
| +10 μmol L−1 8 | 0.493 ± 0.228 | 0.77 | 1.081 ± 0.482 | 0.75 |
| Hela | Hela/VCR | |||
| Doxorubicin | 0.098 ± 0.039 | 0.789 ± 0.575 | ||
| +5 μmol L−1 8 | 0.074 ± 0.029 | 1.32 | 0.553 ± 0.410 | 1.43 |
| +10 μmol L−1 8 | 0.066 ± 0.018 | 1.48 | 0.324 ± 0.364 | 2.44 |
| +20 μmol L−1 8 | 0.083 ± 0.010 | 1.18 | 0.101 ± 0.045 | 7.82 |
| Cisplatin | 1.812 ± 1.075 | 0.873 ± 0.047 | ||
| +5 μmol L−1 8 | 1.472 ± 0.861 | 1.23 | 0.954 ± 0.081 | 0.92 |
| +10 μmol L−1 8 | 1.749 ± 0.956 | 1.04 | 1.032 ± 0.032 | 0.85 |
| +20 μmol L−1 8 | 2.227 ± 1.289 | 0.81 | 1.363 ± 0.348 | 0.64 |
Disclaimer/Publisher’s Note: The statements, opinions and data contained in all publications are solely those of the individual author(s) and contributor(s) and not of MDPI and/or the editor(s). MDPI and/or the editor(s) disclaim responsibility for any injury to people or property resulting from any ideas, methods, instructions or products referred to in the content. |
© 2024 by the authors. Licensee MDPI, Basel, Switzerland. This article is an open access article distributed under the terms and conditions of the Creative Commons Attribution (CC BY) license (https://creativecommons.org/licenses/by/4.0/).
Share and Cite
Ma, X.; Wu, M.; Chen, Z.; Cao, F.; Zhong, T.; Luo, Z.; Shao, Z.; Zhang, Y.; Chen, L.; Zhang, Z. Phenylspirodrimane with Moderate Reversal Effect of Multidrug Resistance Isolated from the Deep-Sea Fungus Stachybotrys sp. 3A00409. Molecules 2024, 29, 1685. https://doi.org/10.3390/molecules29071685
Ma X, Wu M, Chen Z, Cao F, Zhong T, Luo Z, Shao Z, Zhang Y, Chen L, Zhang Z. Phenylspirodrimane with Moderate Reversal Effect of Multidrug Resistance Isolated from the Deep-Sea Fungus Stachybotrys sp. 3A00409. Molecules. 2024; 29(7):1685. https://doi.org/10.3390/molecules29071685
Chicago/Turabian StyleMa, Xinhua, Min Wu, Zhenwei Chen, Fan Cao, Tianhua Zhong, Zhuhua Luo, Zongze Shao, Yonghong Zhang, Limin Chen, and Zhiqiang Zhang. 2024. "Phenylspirodrimane with Moderate Reversal Effect of Multidrug Resistance Isolated from the Deep-Sea Fungus Stachybotrys sp. 3A00409" Molecules 29, no. 7: 1685. https://doi.org/10.3390/molecules29071685