
Detecting Pathogenic Phytophthora Species Using Volatile Organic Compounds


Abstract
:1. Introduction
2. Results
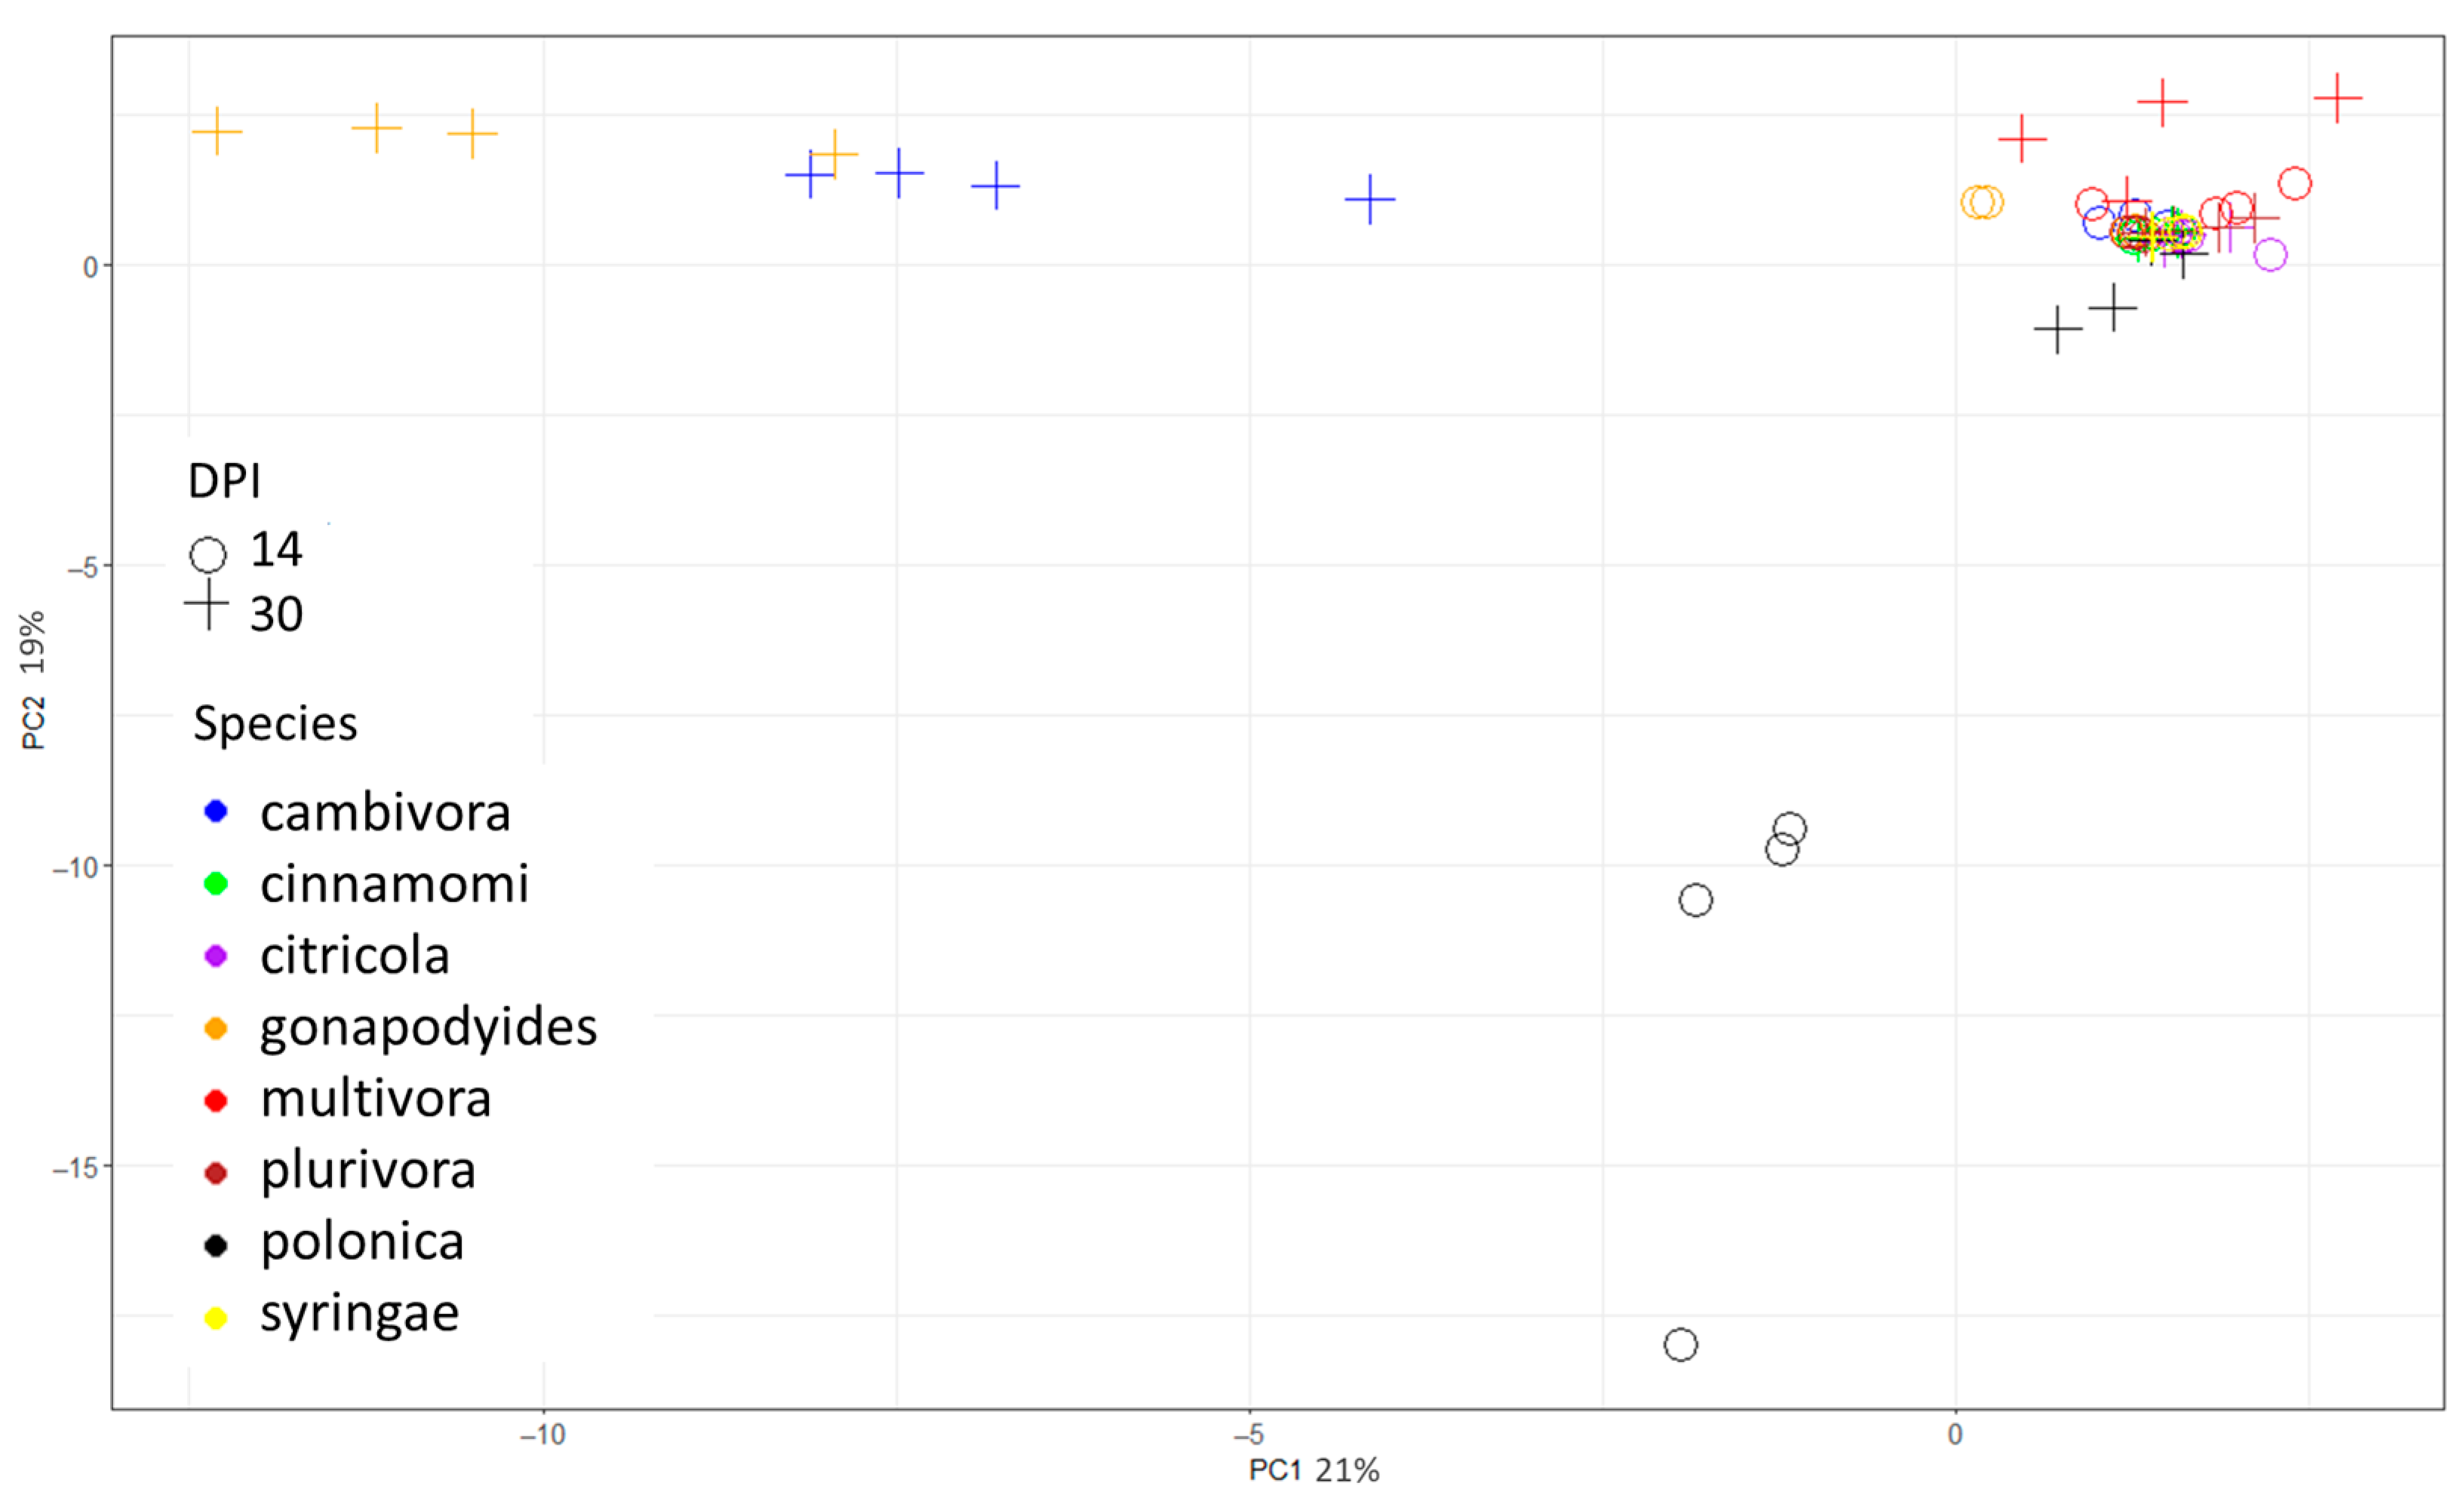
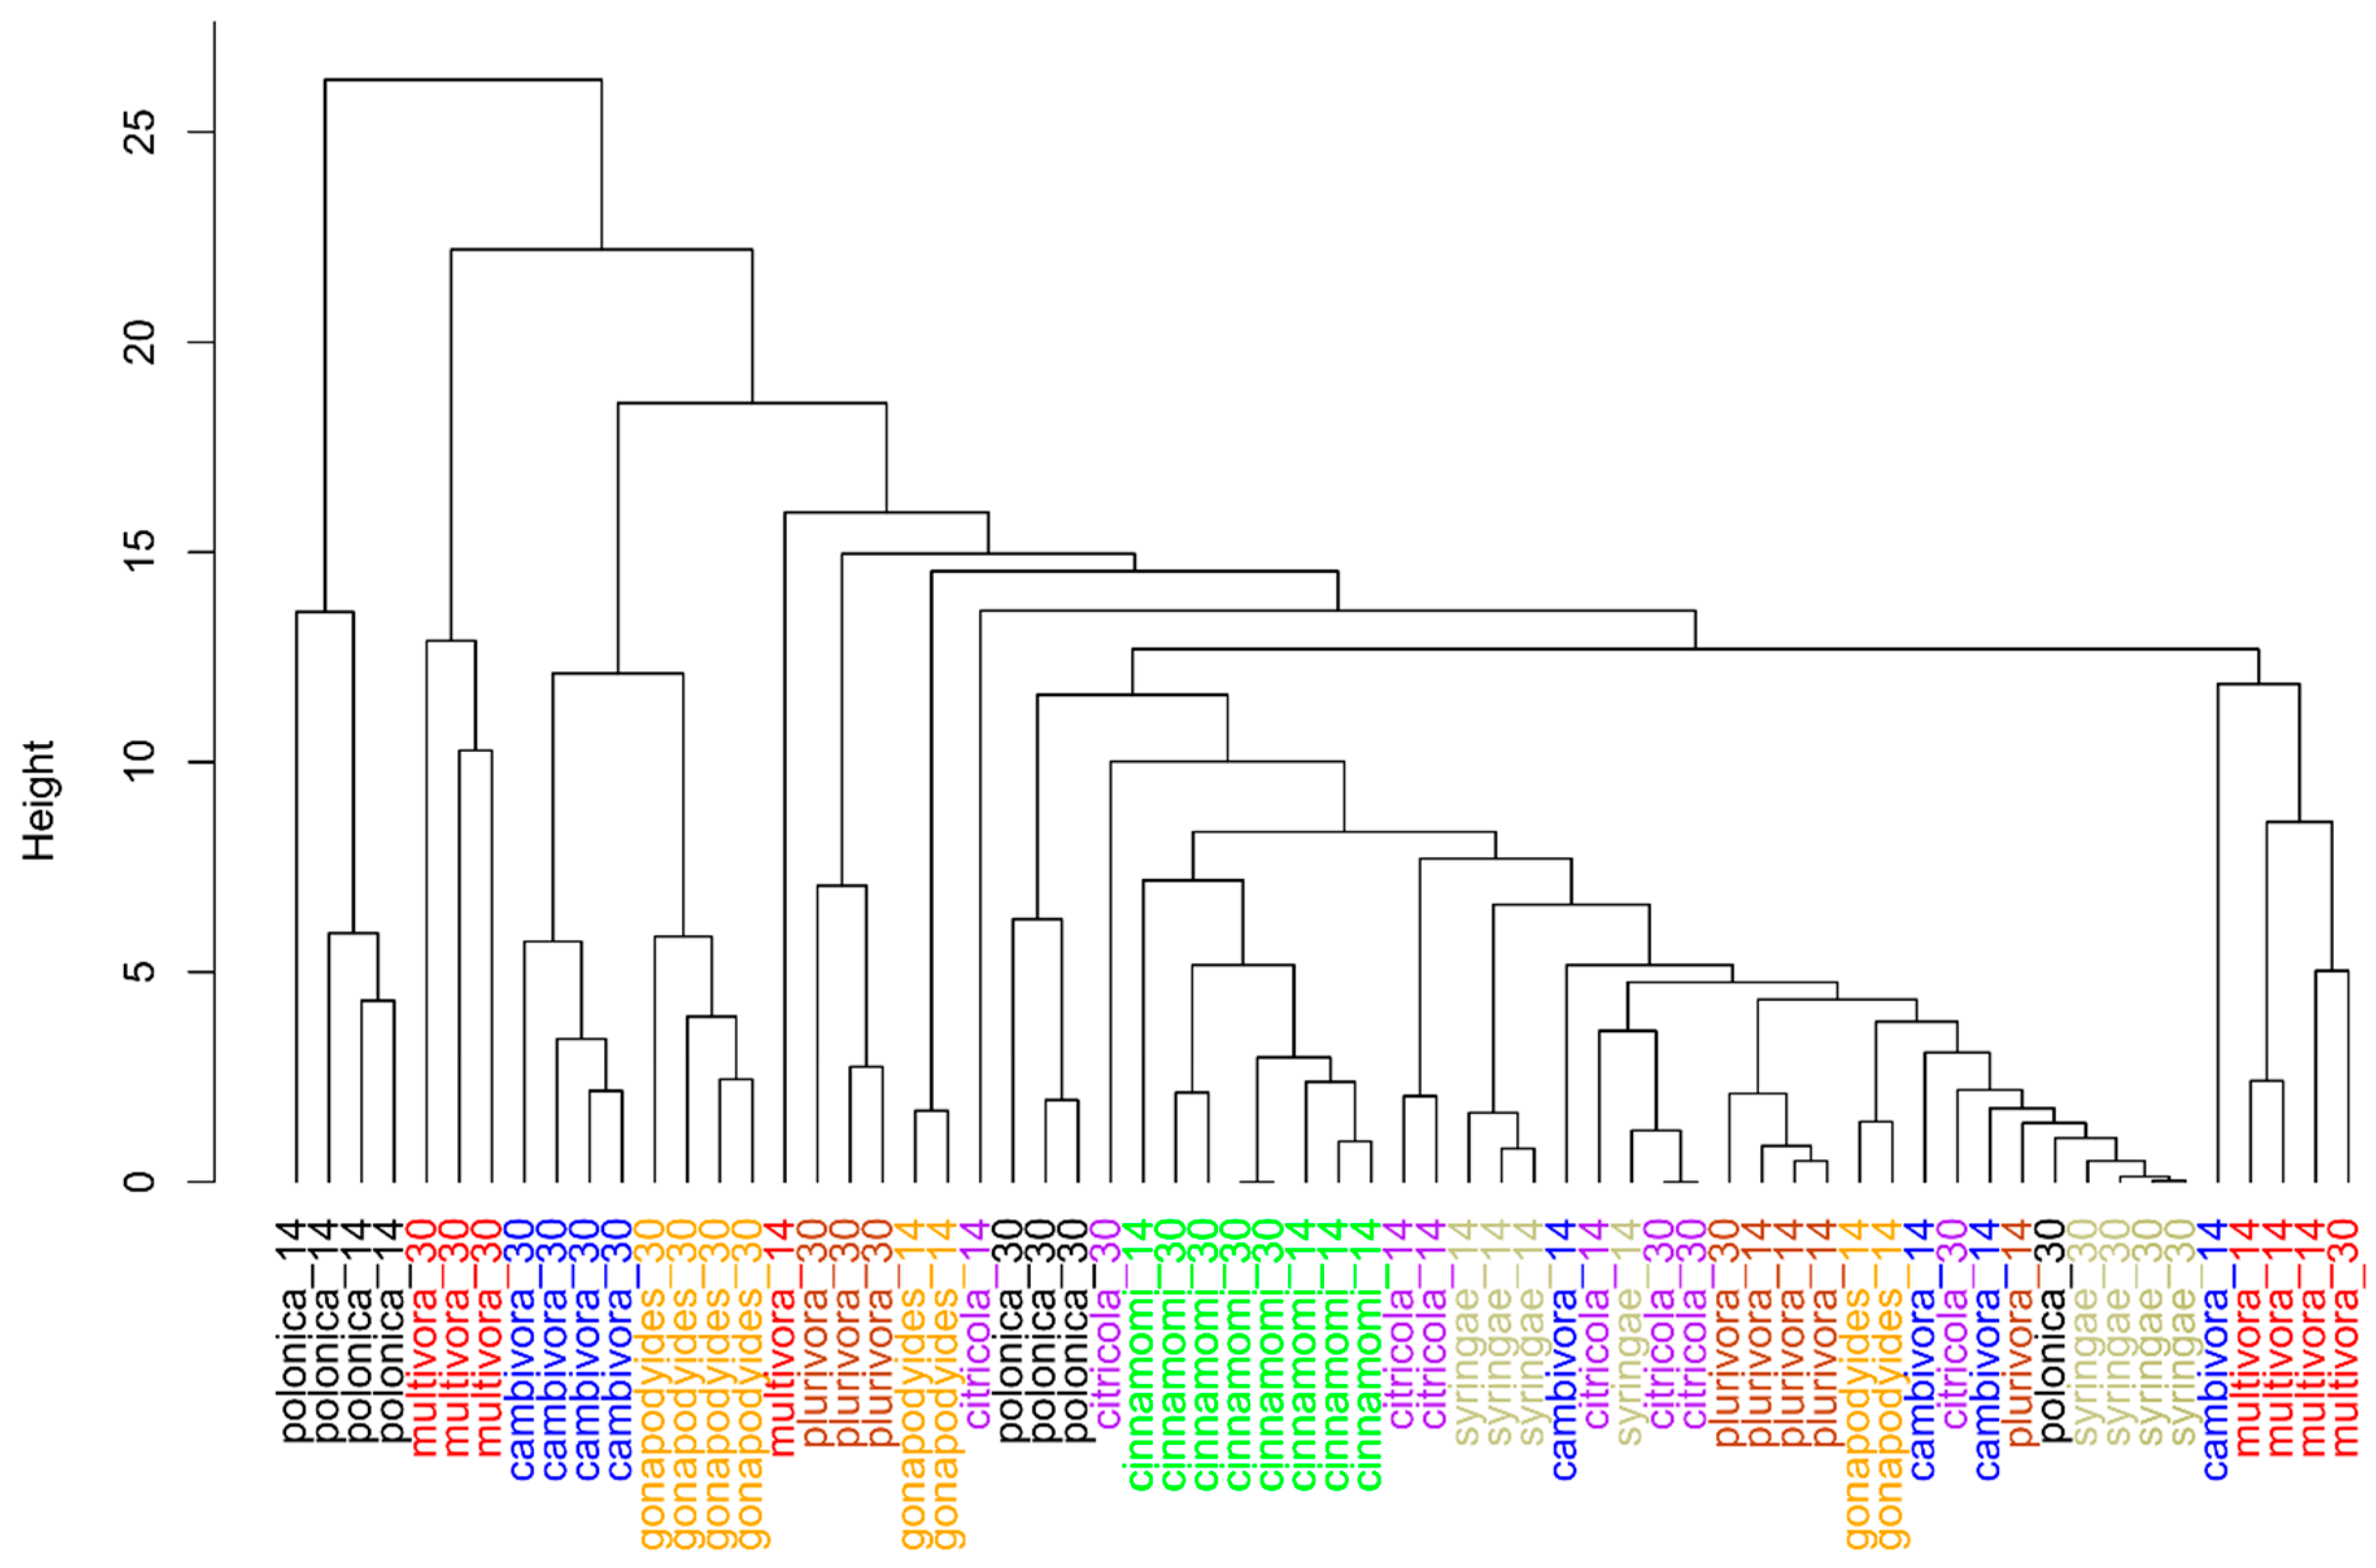
2.1. In Vitro Study
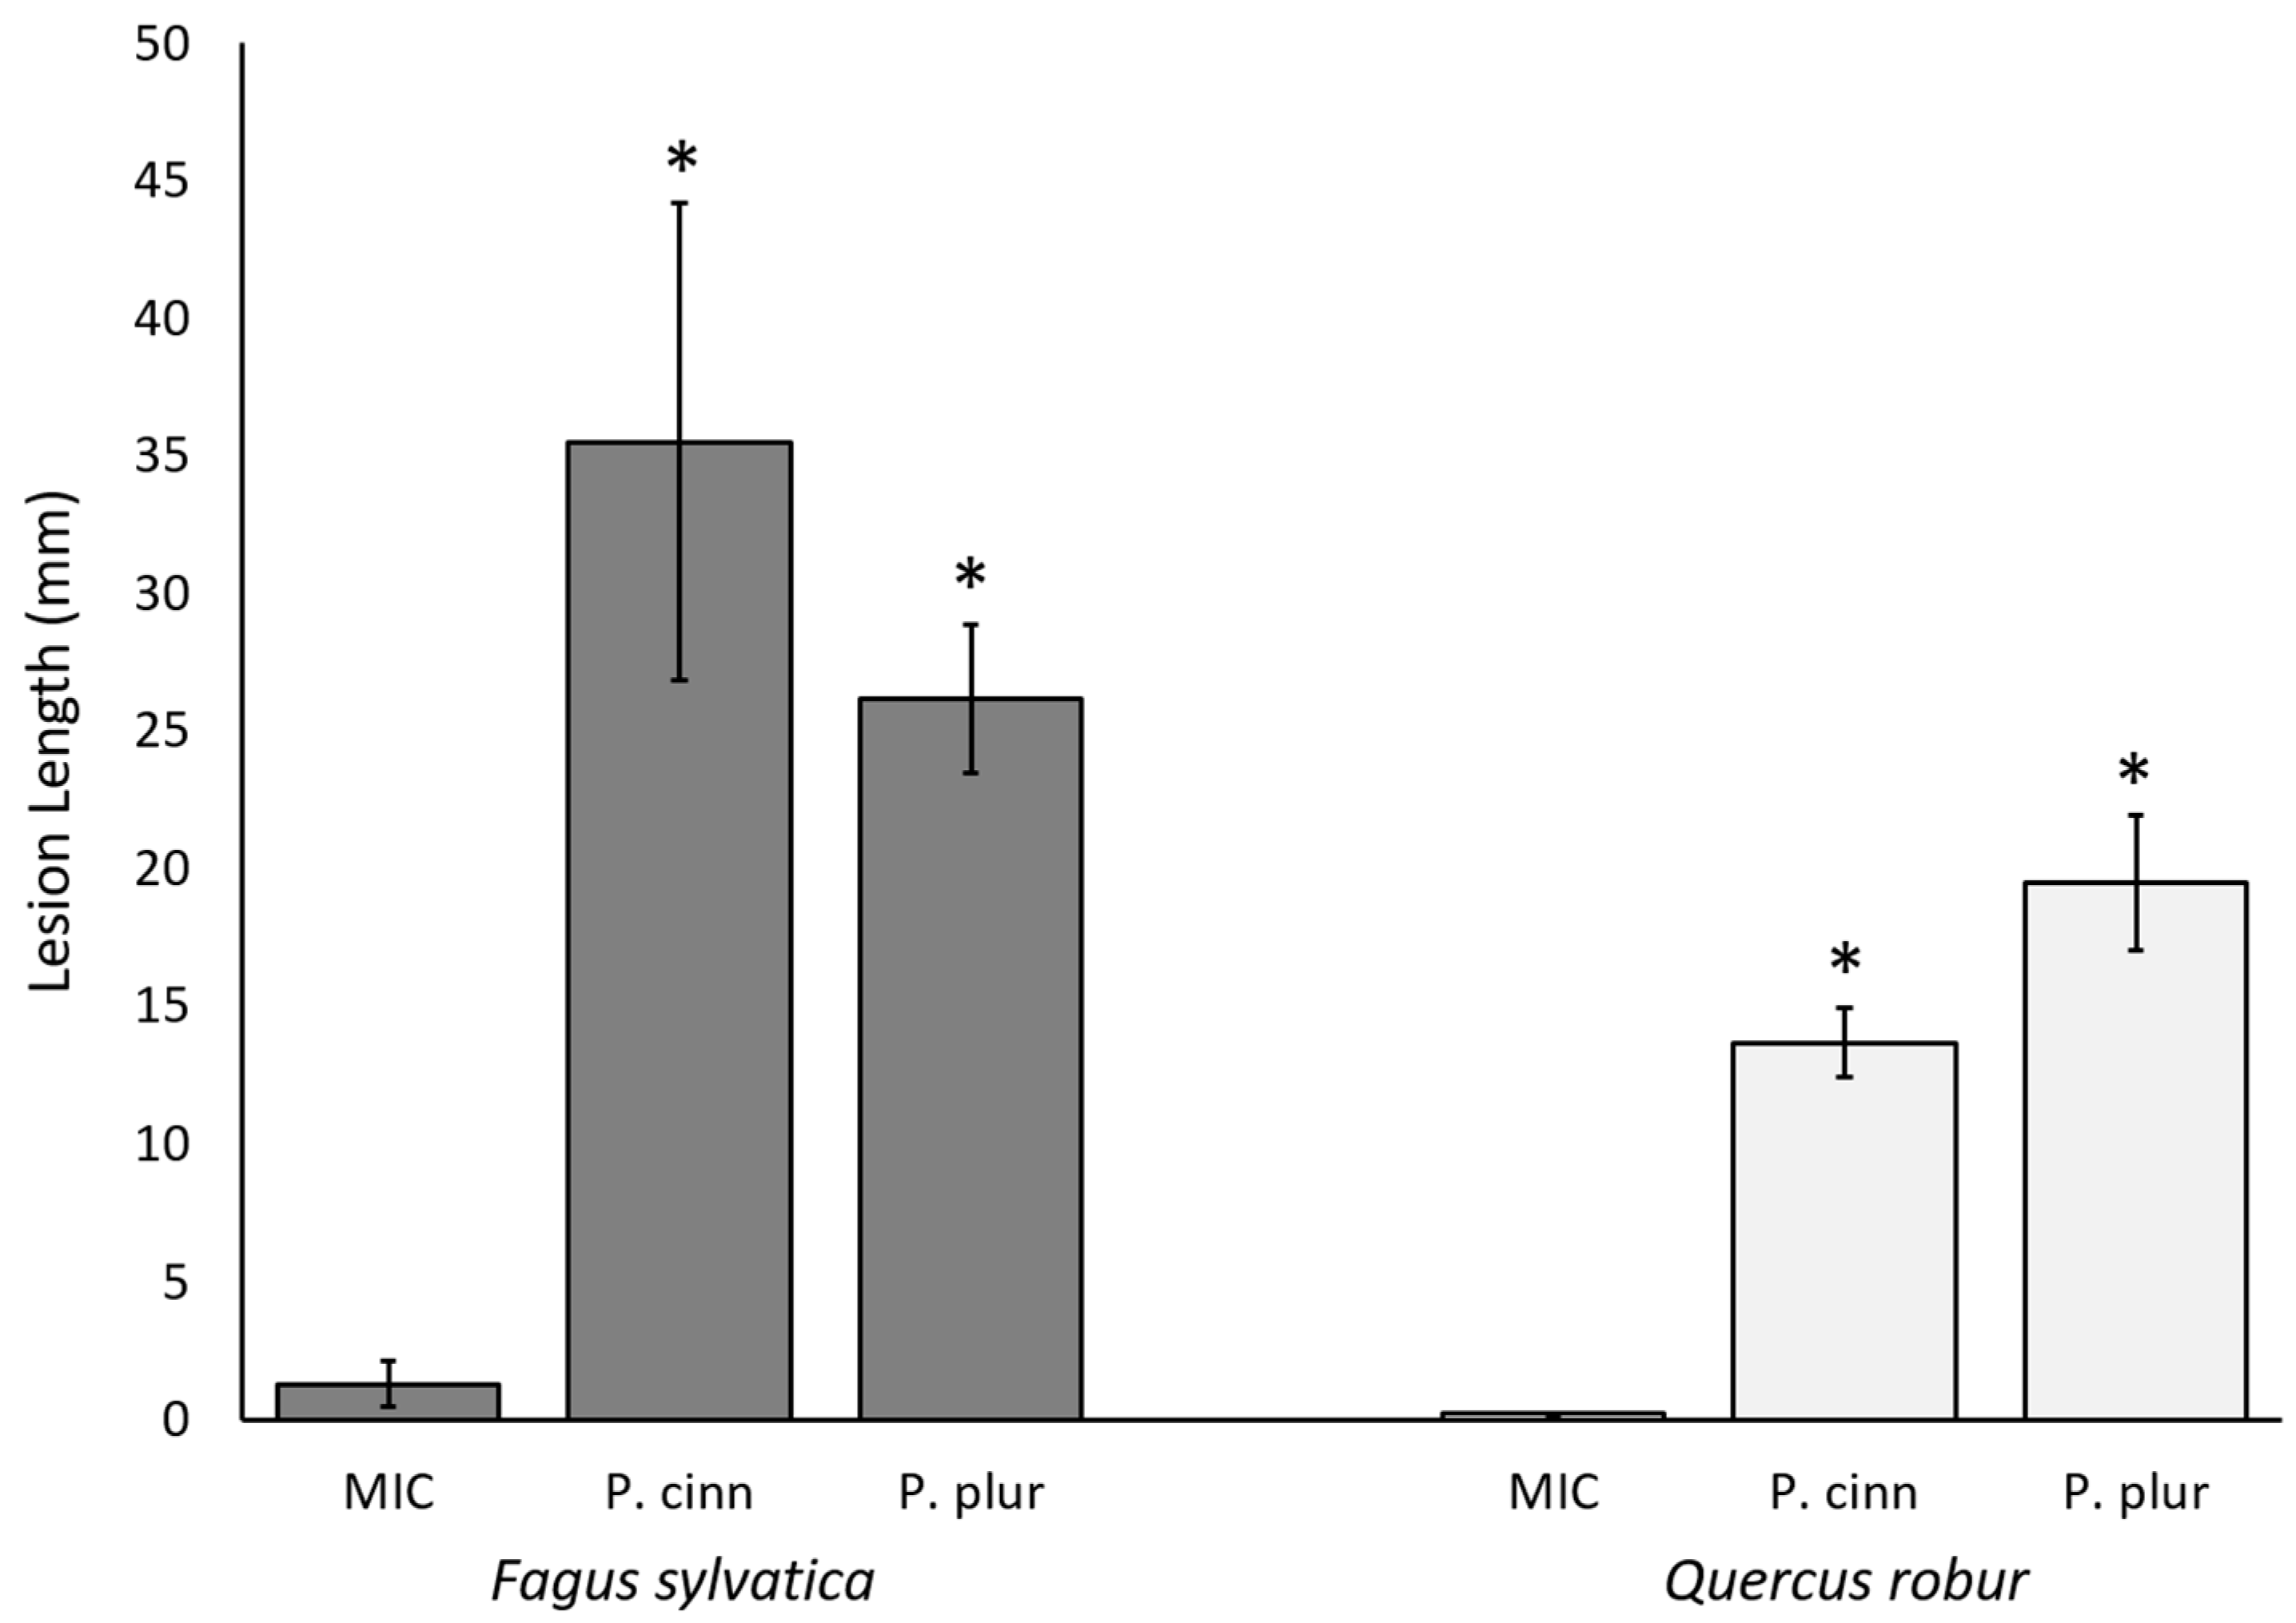
2.2. In Vivo Study
3. Discussion
4. Materials and Methods
4.1. In Vitro Phytophthora VOC Study
4.2. In Vivo VOC Study
4.3. Data Analysis
5. Conclusions
Supplementary Materials
Author Contributions
Funding
Institutional Review Board Statement
Informed Consent Statement
Data Availability Statement
Conflicts of Interest
References
- Hansen, E.M. Phytophthora Species Emerging as Pathogens of Forest Trees. Curr. For. Rep. 2015, 1, 16–24. [Google Scholar] [CrossRef]
- Kroon, L.P.N.M.; Brouwer, H.; de Cock, A.W.A.M.; Govers, F. The Genus Phytophthora Anno 2012. Phytopathology 2012, 102, 348–364. [Google Scholar] [CrossRef]
- Brasier, C.; Scanu, B.; Cooke, D.; Jung, T. Phytophthora: An ancient, historic, biologically and structurally cohesive and evolutionarily successful generic concept in need of preservation. IMA Fungus 2022, 13, 12. [Google Scholar] [CrossRef] [PubMed]
- Hardham, A.R.; Blackman, L.M. Phytophthora cinnamomi. Mol. Plant Pathol. 2018, 19, 260–285. [Google Scholar] [CrossRef] [PubMed]
- Keriö, S.; Daniels, H.A.; Gómez-Gallego, M.; Tabima, J.F.; Lenz, R.R.; Søndreli, K.L.; Grünwald, N.J.; Williams, N.; McDougal, R.; LeBoldus, J.M. From genomes to forest management—Tackling invasive Phytophthora species in the era of genomics. Can. J. Plant Pathol. 2020, 42, 1–29. [Google Scholar] [CrossRef]
- Weiland, J.E.; Nelson, A.H.; Hudler, G.W. Aggressiveness of Phytophthora cactorum, P. citricola I, and P. plurivora from European Beech. Plant Dis. 2010, 94, 1009–1014. [Google Scholar] [CrossRef] [PubMed]
- Burdon, J.J.; Thrall, P.H. Coevolution of Plants and Their Pathogens in Natural Habitats. Science 2009, 324, 755–756. [Google Scholar] [CrossRef] [PubMed]
- Bradshaw, C.J.A.; Leroy, B.; Bellard, C.; Roiz, D.; Albert, C.; Fournier, A.; Barbet-Massin, M.; Salles, J.-M.; Simard, F.; Courchamp, F. Massive yet grossly underestimated global costs of invasive insects. Nat. Commun. 2016, 7, 12986. [Google Scholar] [CrossRef] [PubMed]
- Lapin, K.; Bacher, S.; Cech, T.; Damjanić, R.; Essl, F.; Georges, F.-I.; Hoch, G.; Kavčič, A.; Koltay, A.; Kostić, S.; et al. Comparing environmental impacts of alien plants, insects and pathogens in protected riparian forests. NeoBiota 2021, 69, 1–28. [Google Scholar] [CrossRef]
- Santini, A.; Ghelardini, L.; De Pace, C.; Desprez-Loustau, M.L.; Capretti, P.; Chandelier, A.; Cech, T.; Chira, D.; Diamandis, S.; Gaitniekis, T.; et al. Biogeographical patterns and determinants of invasion by forest pathogens in Europe. New Phytol. 2013, 197, 238–250. [Google Scholar] [CrossRef]
- Seebens, H.; Blackburn, T.M.; Dyer, E.E.; Genovesi, P.; Hulme, P.E.; Jeschke, J.M.; Pagad, S.; Pyšek, P.; Winter, M.; Arianoutsou, M.; et al. No saturation in the accumulation of alien species worldwide. Nat. Commun. 2017, 8, 14435. [Google Scholar] [CrossRef] [PubMed]
- Jung, T.; Orlikowski, L.; Henricot, B.; Abad-Campos, P.; Aday, A.G.; Aguín Casal, O.; Bakonyi, J.; Cacciola, S.O.; Cech, T.; Chavarriaga, D.; et al. Widespread Phytophthora infestations in European nurseries put forest, semi-natural and horticultural ecosystems at high risk of Phytophthora diseases. For. Pathol. 2016, 46, 134–163. [Google Scholar] [CrossRef]
- Puertolas, A.; Bonants, P.J.M.; Boa, E.; Woodward, S. Application of Real-Time PCR for the Detection and Quantification of Oomycetes in Ornamental Nursery Stock. J. Fungi 2021, 7, 87. [Google Scholar] [CrossRef] [PubMed]
- Martinelli, F.; Scalenghe, R.; Davino, S.; Panno, S.; Scuderi, G.; Ruisi, P.; Villa, P.; Stroppiana, D.; Boschetti, M.; Goulart, L.R.; et al. Advanced methods of plant disease detection. A review. Agron. Sustain. Dev. 2015, 35, 1–25. [Google Scholar] [CrossRef]
- Early, R.; Bradley, B.A.; Dukes, J.S.; Lawler, J.J.; Olden, J.D.; Blumenthal, D.M.; Gonzalez, P.; Grosholz, E.D.; Ibañez, I.; Miller, L.P.; et al. Global threats from invasive alien species in the twenty-first century and national response capacities. Nat. Commun. 2016, 7, 12485. [Google Scholar] [CrossRef] [PubMed]
- Tedersoo, L.; Drenkhan, R.; Anslan, S.; Morales-Rodriguez, C.; Cleary, M. High-throughput identification and diagnostics of pathogens and pests: Overview and practical recommendations. Mol. Ecol. Resour. 2019, 19, 47–76. [Google Scholar] [CrossRef] [PubMed]
- Aglietti, C.; Luchi, N.; Pepori, A.L.; Bartolini, P.; Pecori, F.; Raio, A.; Capretti, P.; Santini, A. Real-time loop-mediated isothermal amplification: An early-warning tool for quarantine plant pathogen detection. AMB Express 2019, 9, 50. [Google Scholar] [CrossRef] [PubMed]
- Chalupowicz, L.; Dombrovsky, A.; Gaba, V.; Luria, N.; Reuven, M.; Beerman, A.; Lachman, O.; Dror, O.; Nissan, G.; Manulis-Sasson, S. Diagnosis of plant diseases using the Nanopore sequencing platform. Plant Pathol. 2019, 68, 229–238. [Google Scholar] [CrossRef]
- Tedersoo, L.; Tooming-Klunderud, A.; Anslan, S. PacBio metabarcoding of Fungi and other eukaryotes: Errors, biases and perspectives. New Phytol. 2018, 217, 1370–1385. [Google Scholar] [CrossRef]
- Roques, A.; Richardson, B.; Hood, I.A. Alien forest insects in a warmer world and a globalised economy: Impacts of changes in trade, tourism and climate on forest biosecurity. N. Z. J. For. Sci. 2010, 40, 77–94. [Google Scholar]
- Materić, D.; Bruhn, D.; Turner, C.; Morgan, G.; Mason, N.; Gauci, V. Methods in plant foliar volatile organic compounds research. Appl. Plant Sci. 2015, 3, 1500044. [Google Scholar] [CrossRef] [PubMed]
- Ficke, A.; Asalf, B.; Norli, H.R. Volatile Organic Compound Profiles From Wheat Diseases Are Pathogen-Specific and Can Be Exploited for Disease Classification. Front. Microbiol. 2022, 12, 803352. [Google Scholar] [CrossRef] [PubMed]
- Mazelin, C.; Vose, J.C.; Kepner, R.L.; Fitzgerald, N. Headspace Solid-Phase Microextraction GCMS as a Potential In-Situ Method for the Early Detection of Fusarium Head Blight in Barley. J. Am. Soc. Brew. Chem. 2020, 78, 202–206. [Google Scholar] [CrossRef]
- Nordström, I.; Sherwood, P.; Bohman, B.; Woodward, S.; Peterson, D.L.; Niño-Sánchez, J.; Sánchez-Gómez, T.; Díez, J.J.; Cleary, M. Utilizing volatile organic compounds for early detection of Fusarium circinatum. Sci. Rep. 2022, 12, 21661. [Google Scholar] [CrossRef] [PubMed]
- Vuorinen, T.; Nerg, A.-M.; Syrjälä, L.; Peltonen, P.; Holopainen, J.K. Epirrita autumnata induced VOC emission of silver birch differ from emission induced by leaf fungal pathogen. Arthropod-Plant Interact. 2007, 1, 159. [Google Scholar] [CrossRef]
- Johne, A.B.; Weissbecker, B.; Schütz, S. Approaching risk assessment of complex disease development in horse chestnut trees: A chemical ecologist’s perspective. J. Appl. Entomol. 2008, 132, 349–359. [Google Scholar] [CrossRef]
- Borowik, P.; Adamowicz, L.; Tarakowski, R.; Wacławik, P.; Oszako, T.; Ślusarski, S.; Tkaczyk, M.; Stocki, M. Electronic Nose Differentiation between Quercus robur Acorns Infected by Pathogenic Oomycetes Phytophthora plurivora and Pythium intermedium. Molecules 2021, 26, 5272. [Google Scholar] [CrossRef] [PubMed]
- Carazzone, C.; Rodríguez, J.P.G.; Gonzalez, M.; López, G.-D. Volatilomics of Natural Products: Whispers from Nature. In Metabolomics; Zhan, X.Q., Ed.; IntechOpen: Rijeka, Croatia, 2021; Chapter 4. [Google Scholar]
- Ames, J.M.; Guy, R.C.E.; Kipping, G.J. Effect of pH and Temperature on the Formation of Volatile Compounds in Cysteine/Reducing Sugar/Starch Mixtures during Extrusion Cooking. J. Agric. Food Chem. 2001, 49, 1885–1894. [Google Scholar] [CrossRef] [PubMed]
- Adams, R.P. Identification of Essential Oil Components by Gas Chromotography/Mass Spectrometry, 4.1th ed.; Allured Pub Corp: Carol Stream, IL, USA, 2007. [Google Scholar]
- Beaulieu, J.C.; Lea, J.M. Characterization and Semiquantitative Analysis of Volatiles in Seedless Watermelon Varieties Using Solid-Phase Microextraction. J. Agric. Food Chem. 2006, 54, 7789–7793. [Google Scholar] [CrossRef]
- Lozano, P.R.; Drake, M.; Benitez, D.; Cadwallader, K.R. Instrumental and Sensory Characterization of Heat-Induced Odorants in Aseptically Packaged Soy Milk. J. Agric. Food Chem. 2007, 55, 3018–3026. [Google Scholar] [CrossRef]
- Martí, M.P.; Mestres, M.; Sala, C.; Busto, O.; Guasch, J. Solid-Phase Microextraction and Gas Chromatography Olfactometry Analysis of Successively Diluted Samples. A New Approach of the Aroma Extract Dilution Analysis Applied to the Characterization of Wine Aroma. J. Agric. Food Chem. 2003, 51, 7861–7865. [Google Scholar] [CrossRef] [PubMed]
- Steinhaus, P.; Schieberle, P. Characterization of the Key Aroma Compounds in Soy Sauce Using Approaches of Molecular Sensory Science. J. Agric. Food Chem. 2007, 55, 6262–6269. [Google Scholar] [CrossRef] [PubMed]
- Lazarević, J.; Radulović, N.; Palić, R.; Zlatković, B. Chemical Analysis of Volatile Constituents of Berula erecta (Hudson) Coville subsp. erecta (Apiaceae) From Serbia. J. Essent. Oil Res. 2010, 22, 153–156. [Google Scholar] [CrossRef]
- Rostad, C.E.; Pereira, W.E. Kovats and lee retention indices determined by gas chromatography/mass spectrometry for organic compounds of environmental interest. J. High Resolut. Chromatogr. 1986, 9, 328–334. [Google Scholar] [CrossRef]
- Ohnishi, S.; Shibamoto, T. Volatile compounds from heated beef fat and beef fat with glycine. J. Agric. Food Chem. 1984, 32, 987–992. [Google Scholar] [CrossRef]
- Retta, D.; Gattuso, M.; Gattuso, S.; Di Leo Lira, P.; van Baren, C.; Ferraro, G.; Bandoni, A. Essential oil composition of Achyrocline flaccida (Weinm.) DC. (Asteraceae) from different locations of Argentina. Biochem. Syst. Ecol. 2008, 36, 877–881. [Google Scholar] [CrossRef]
- Skaltsa, H.D.; Mavrommati, A.; Constantinidis, T. A chemotaxonomic investigation of volatile constituents in Stachys subsect. Swainsonianeae (Labiatae). Phytochemistry 2001, 57, 235–244. [Google Scholar] [CrossRef] [PubMed]
- Morath, S.U.; Hung, R.; Bennett, J.W. Fungal volatile organic compounds: A review with emphasis on their biotechnological potential. Fungal Biol. Rev. 2012, 26, 73–83. [Google Scholar] [CrossRef]
- Frisvad, J.C.; Andersen, B.; Thrane, U. The use of secondary metabolite profiling in chemotaxonomy of filamentous fungi. Mycol. Res. 2008, 112, 231–240. [Google Scholar] [CrossRef]
- Yang, X.; Tyler, B.M.; Hong, C. An expanded phylogeny for the genus Phytophthora. IMA Fungus 2017, 8, 355–384. [Google Scholar] [CrossRef]
- Blom, D.; Fabbri, C.; Connor, E.C.; Schiestl, F.P.; Klauser, D.R.; Boller, T.; Eberl, L.; Weisskopf, L. Production of plant growth modulating volatiles is widespread among rhizosphere bacteria and strongly depends on culture conditions. Environ. Microbiol. 2011, 13, 3047–3058. [Google Scholar] [CrossRef] [PubMed]
- Qiu, R.; Qu, D.; Hardy, G.E.S.J.; Trengove, R.; Agarwal, M.; Ren, Y. Optimization of Headspace Solid-Phase Microextraction Conditions for the Identification of Phytophthora cinnamomi Rands. Plant Dis. 2014, 98, 1088–1098. [Google Scholar] [CrossRef]
- Tollsten, L.; Müller, P.M. Volatile organic compounds emitted from beech leaves. Phytochemistry 1996, 43, 759–762. [Google Scholar] [CrossRef]
- van Meeningen, Y.; Schurgers, G.; Rinnan, R.; Holst, T. BVOC emissions from English oak (Quercus robur) and European beech (Fagus sylvatica) along a latitudinal gradient. Biogeosciences 2016, 13, 6067–6080. [Google Scholar] [CrossRef]
- Joó, É.; Van Langenhove, H.; Šimpraga, M.; Steppe, K.; Amelynck, C.; Schoon, N.; Müller, J.F.; Dewulf, J. Variation in biogenic volatile organic compound emission pattern of Fagus sylvatica L. due to aphid infection. Atmos. Environ. 2010, 44, 227–234. [Google Scholar] [CrossRef]
- Weissteiner, S.; Huetteroth, W.; Kollmann, M.; Weißbecker, B.; Romani, R.; Schachtner, J.; Schütz, S. Cockchafer Larvae Smell Host Root Scents in Soil. PLoS ONE 2012, 7, e45827. [Google Scholar] [CrossRef] [PubMed]
- Azeem, M.; Rajarao, G.K.; Nordenhem, H.; Nordlander, G.; Borg-Karlson, A.K. Penicillium expansum Volatiles Reduce Pine Weevil Attraction to Host Plants. J. Chem. Ecol. 2013, 39, 120–128. [Google Scholar] [CrossRef]
- Jay, E.M.; West, C.A. Diterpene Biosynthesis in Maize Seedlings in Response to Fungal Infection. Plant Physiol. 1979, 64, 406–410. [Google Scholar]
- Holopainen, J.K.; Gershenzon, J. Multiple stress factors and the emission of plant VOCs. Trends Plant Sci. 2010, 15, 176–184. [Google Scholar] [CrossRef]
- Niinemets, Ü.; Kännaste, A.; Copolovici, L. Quantitative patterns between plant volatile emissions induced by biotic stresses and the degree of damage. Front. Plant Sci. 2013, 4, 262. [Google Scholar] [CrossRef]
- Brilli, F.; Luchi, N.; Michelozzi, M.; Calamai, L.; Cencetti, G.; Pecori, F.; Nigrone, E.; Santini, A. Volatile organic compounds (VOC) as biomarkers for detection of Ceratocystis platani. For. Pathol. 2020, 50, e12618. [Google Scholar] [CrossRef]
- Cellini, A.; Biondi, E.; Blasioli, S.; Rocchi, L.; Farneti, B.; Braschi, I.; Savioli, S.; Rodriguez-Estrada, M.T.; Biasioli, F.; Spinelli, F. Early detection of bacterial diseases in apple plants by analysis of volatile organic compounds profiles and use of electronic nose. Ann. Appl. Biol. 2016, 168, 409–420. [Google Scholar] [CrossRef]
- Zainol Hilmi, N.H.; Idris, A.S.; Mohd Azmil, M.N. Headspace solid-phase microextraction gas chromatography–mass spectrometry for the detection of volatile organic compounds released from Ganoderma boninense and oil palm wood. For. Pathol. 2019, 49, e12531. [Google Scholar] [CrossRef]
- Aksenov, A.A.; Pasamontes, A.; Peirano, D.J.; Zhao, W.; Dandekar, A.M.; Fiehn, O.; Ehsani, R.; Davis, C.E. Detection of Huanglongbing Disease Using Differential Mobility Spectrometry. Anal. Chem. 2014, 86, 2481–2488. [Google Scholar] [CrossRef] [PubMed]
- Cevallos-Cevallos, J.M.; García-Torres, R.; Etxeberria, E.; Reyes-De-Corcuera, J.I. GC-MS Analysis of Headspace and Liquid Extracts for Metabolomic Differentiation of Citrus Huanglongbing and Zinc Deficiency in Leaves of ‘Valencia’ Sweet Orange from Commercial Groves. Phytochem. Anal. 2011, 22, 236–246. [Google Scholar] [CrossRef] [PubMed]
- Courtois, E.A.; Baraloto, C.; Timothy Paine, C.E.; Petronelli, P.; Blandinieres, P.-A.; Stien, D.; Höuel, E.; Bessière, J.-M.; Chave, J. Differences in volatile terpene composition between the bark and leaves of tropical tree species. Phytochemistry 2012, 82, 81–88. [Google Scholar] [CrossRef]
- Andonova, T.G.; Dimitrova-Dyulgerova, I.Z.; Slavov, Z.; Dincheva, I.N.; Stoyanova, A.S. Volatile compounds in flowers, samaras, leaves and stem bark of Ailanthus altissima (Mill.) Swingle, growing in Bulgaria. IOP Conf. Ser. Mater. Sci. Eng. 2021, 1031, 012087. [Google Scholar] [CrossRef]
- Jansen, R.M.C.; Wildt, J.; Kappers, I.F.; Bouwmeester, H.J.; Hofstee, J.W.; van Henten, E.J. Detection of Diseased Plants by Analysis of Volatile Organic Compound Emission. Annu. Rev. Phytopathol. 2011, 49, 157–174. [Google Scholar] [CrossRef] [PubMed]
- Spraker, J.E.; Jewell, K.; Roze, L.V.; Scherf, J.; Ndagano, D.; Beaudry, R.; Linz, J.E.; Allen, C.; Keller, N.P. A Volatile Relationship: Profiling an Inter-Kingdom Dialogue between two Plant Pathogens, Ralstonia solanacearum and Aspergillus flavus. J. Chem. Ecol. 2014, 40, 502–513. [Google Scholar] [CrossRef]
- De Lacy Costello, B.P.J.; Evans, P.; Ewen, R.J.; Gunson, H.E.; Jones, P.R.H.; Ratcliffe, N.M.; Spencer-Phillips, P.T.N. Gas chromatography–mass spectrometry analyses of volatile organic compounds from potato tubers inoculated with Phytophthora infestans or Fusarium coeruleum. Plant Pathol. 2001, 50, 489–496. [Google Scholar] [CrossRef]
- Tietel, Z.; Melamed, S.; Lebiush, S.; Voet, H.; Namdar, D.; Eltzov, E.; Tsror, L. Characterization of volatile signatures of Pectobacterium and Dickeya spp. as biomarkers for early detection and identification—A major tool in potato blackleg and tuber soft rot management. LWT 2021, 144, 111236. [Google Scholar] [CrossRef]
- McCartney, M.M.; Roubtsova, T.V.; Yamaguchi, M.S.; Kasuga, T.; Ebeler, S.E.; Davis, C.E.; Bostock, R.M. Effects of Phytophthora ramorum on volatile organic compound emissions of Rhododendron using gas chromatography–mass spectrometry. Anal. Bioanal. Chem. 2018, 410, 1475–1487. [Google Scholar] [CrossRef] [PubMed]
- El Jaddaoui, I.; Rangel, D.E.N.; Bennett, J.W. Fungal volatiles have physiological properties. Fungal Biol. 2023, 127, 1231–1240. [Google Scholar] [CrossRef] [PubMed]
- Loulier, J.; Lefort, F.; Stocki, M.; Asztemborska, M.; Szmigielski, R.; Siwek, K.; Grzywacz, T.; Hsiang, T.; Ślusarski, S.; Oszako, T.; et al. Detection of Fungi and Oomycetes by Volatiles Using E-Nose and SPME-GC/MS Platforms. Molecules 2020, 25, 5749. [Google Scholar] [CrossRef] [PubMed]
- Ďurkovič, J.; Bubeníková, T.; Gužmerová, A.; Fleischer, P.; Kurjak, D.; Čaňová, I.; Lukáčik, I.; Dvořák, M.; Milenković, I. Effects of Phytophthora inoculations on Photosynthetic behaviour and Induced Defence Responses of Plant Volatiles in Field-Grown Hybrid Poplar Tolerant to Bark Canker Disease. J. Fungi 2021, 7, 969. [Google Scholar] [CrossRef] [PubMed]
- Ghirardo, A.; Heller, W.; Fladung, M.; Schnitzler, J.P.; Schroeder, H. Function of defensive volatiles in pedunculate oak (Quercus robur) is tricked by the moth Tortrix viridana. Plant Cell Environ. 2012, 35, 2192–2207. [Google Scholar] [CrossRef] [PubMed]
- Vrkočová, P.N.; Valterová, I.; Vrkoč, J.; Koutek, B.R. Volatiles released from oak, a host tree for the bark beetle Scolytus intricatus. Biochem. Syst. Ecol. 2000, 28, 933–947. [Google Scholar] [CrossRef] [PubMed]
- Gossner, M.M.; Weisser, W.W.; Gershenzon, J.; Unsicker, S.B. Insect attraction to herbivore-induced beech volatiles under different forest management regimes. Oecologia 2014, 176, 569–580. [Google Scholar] [CrossRef] [PubMed]
- Jalali-Heravi, M.; Zekavat, B.; Sereshti, H. Characterization of essential oil components of Iranian geranium oil using gas chromatography–mass spectrometry combined with chemometric resolution techniques. J. Chromatogr. A 2006, 1114, 154–163. [Google Scholar] [CrossRef]
- Asuming, W.A.; Beauchamp, P.S.; Descalzo, J.T.; Dev, B.C.; Dev, V.; Frost, S.; Ma, C.W. Essential oil composition of four Lomatium Raf. species and their chemotaxonomy. Biochem. Syst. Ecol. 2005, 33, 17–26. [Google Scholar] [CrossRef]
- Elliott, C.G.; Hendrie, M.R.; Knights, B.A. The Sterol Requirement of Phytophthora cactorum. J. Gen. Microbiol. 1966, 42, 425–435. [Google Scholar] [CrossRef] [PubMed]
- Lucero, M.; Estell, R.; Tellez, M.; Fredrickson, E. A retention index calculator simplifies identification of plant volatile organic compounds. Phytochem. Anal. 2009, 20, 378–384. [Google Scholar] [CrossRef] [PubMed]


| P. cambivora | P. cinnamomi | P. citricola | P. gonapodyides | P. multivora | P. plurivora | P. polonica | P. syringae | ||||||||||||
|---|---|---|---|---|---|---|---|---|---|---|---|---|---|---|---|---|---|---|---|
| Peak No. | MS Library Match | RT 1 (min) | KI (KI lit.) | D14 | D30 | D14 | D30 | D14 | D30 | D14 | D30 | D14 | D30 | D14 | D30 | D14 | D30 | D14 | D30 |
| 1 | 2,3-Butanediol | 6.19 | 777 (785) 1 | x | x | ||||||||||||||
| 2 | Hexanal | 6.53 | 803 (801) 2 | x | x | x | x | x | x | ||||||||||
| 3 | 2-Furanmethanol | 7.48 | 856 (867) 1 | x | |||||||||||||||
| 4 | Unknown 1 | 9.53 | 957 | x | |||||||||||||||
| 5 | 1-Heptanol | 9.83 | 971 (959) 2 | x | x | ||||||||||||||
| 6 | 1-Octen-3-ol | 10.03 | 980 (980) 3 | x | x | x | |||||||||||||
| 7 | Unknown 2 | 10.45 | 998 | x | |||||||||||||||
| 8 | 2,4-Heptadienal # | 10.73 | 1013 (1013) 2a | x | x | x | x | ||||||||||||
| 9 | Unknown 3 | 11.23 | 1039 | x | |||||||||||||||
| 10 | Unknown 4 | 11.44 | 1050 | x | |||||||||||||||
| 11 | Unknown 5 | 11.52 | 1054 | x | x | x | |||||||||||||
| 12 | Unknown 6 | 11.94 | 1074 | x | x | ||||||||||||||
| 13 | Unknown 7 | 12.16 | 1084 | x | |||||||||||||||
| 14 | 3,5-Octadien-2-one # | 12.4 | 1095 (1098) 4 | x | x | ||||||||||||||
| 15 | 2-Nonanol | 12.5 | 1100 (1097) 2 | x | x | x | |||||||||||||
| 16 | 3-Nonen-1-ol # | 13.57 | 1157 (1157) 2b | x | |||||||||||||||
| 17 | 2,6-Nonadienal # | 13.58 | 1158 (1154) 2c | x | x | ||||||||||||||
| 18 | 4-Ethylphenol | 13.8 | 1169 (1178) 5 | x | x | ||||||||||||||
| 19 | Unknown 8 | 13.81 | 1169 | x | |||||||||||||||
| 20 | 1-Nonanol | 13.86 | 1172 (1165) 2 | x | x | x | x | ||||||||||||
| 21 | Unknown 9 | 14.34 | 1195 | x | x | x | |||||||||||||
| 22 | 2,4-Nonadienal # | 14.74 | 1218 (1212) 2a | x | x | x | |||||||||||||
| 23 | Unknown 10 | 15.06 | 1236 | x | x | ||||||||||||||
| 24 | 4-Decen-1-ol # | 15.48 | 1259 (1259) 2d | x | |||||||||||||||
| 25 | Unknown 11 | 15.66 | 1269 | x | |||||||||||||||
| 26 | 1-Decanol | 15.71 | 1272 (1266) 2 | x | x | x | x | x | x | x | x | ||||||||
| 27 | 6-Undecen-2-one # | 15.86 | 1279 (N/A) | x | x | x | x | x | x | ||||||||||
| 28 | 4-Ethylguaiacol | 15.98 | 1286 (1282) 6 | x | x | x | x | x | x | x | x | x | |||||||
| 29 | 2,4-Decadienal (E,Z)- * | 16.17 | 1296 (1292) 2 | x | x | x | x | x | |||||||||||
| 30 | 2,4-Decadienal (E,E)- * | 16.58 | 1320 (1319) 2 | x | x | x | x | ||||||||||||
| 31 | 3-Undecen-2-one # | 16.97 | 1344 (1344) 7a | x | x | x | x | x | x | x | x | x | x | x | x | ||||
| 32 | Methyl 2,4,6-trimethyl benzoate | 17.15 | 1354 (1349) 8 | x | x | ||||||||||||||
| 33 | Decanoic acid | 17.28 | 1362 (1366) 2 | x | x | x | x | x | x | ||||||||||
| 34 | 2-Undecenal # | 17.36 | 1367 (1366) 7b | x | x | ||||||||||||||
| 35 | 2,4-Undecadien-1-ol # | 17.4 | 1369 (N/A) | x | |||||||||||||||
| 36 | Unknown 12 | 17.75 | 1389 | x | x | x | x | x | |||||||||||
| 37 | Unknown 13 | 18.17 | 1414 | x | x | ||||||||||||||
| 38 | Unknown 14 | 18.37 | 1428 | x | |||||||||||||||
| 39 | 1-Phenyl-2-hexanone | 18.7 | 1449 (N/A) | x | x | ||||||||||||||
| 40 | 2,6-Dodecadienal # | 18.77 | 1454 (1445) 2c | x | |||||||||||||||
| 41 | Unknown 15 | 19.25 | 1483 | x | x | x | |||||||||||||
| 42 | Unknown 16 | 19.29 | 1486 | x | x | x | x | ||||||||||||
| 43 | 2-Tridecanol | 19.56 | 1503 (1510) 9 | x | |||||||||||||||
| 44 | Aristolochene | 19.62 | 1507 (1487) 10 | x | x | ||||||||||||||
| 45 | Unknown 17 | 19.84 | 1522 | x | x | ||||||||||||||
| 46 | Unknown 18 | 20.24 | 1549 | x | |||||||||||||||
| 47 | Dodecanoic acid | 20.43 | 1562 (1565) 2 | x | x | x | |||||||||||||
| 48 | 1-Tridecanol | 20.67 | 1578 (1570) 2 | x | |||||||||||||||
| 49 | Unknown 19 | 20.82 | 1587 | x | |||||||||||||||
| 50 | Unknown 20 | 20.92 | 1594 | x | x | x | |||||||||||||
| 51 | Unknown 21 | 21.33 | 1622 | x | |||||||||||||||
| 52 | 1-Tetradecanol | 22.17 | 1681 (1671) 2 | x | x | x | |||||||||||||
| 53 | 6-Pentadecen-2-one # | 22.21 | 1684 (1667) 2b | x | |||||||||||||||
| 54 | γ-Dodecalactone | 22.31 | 1691 (1676) 2 | x | x | x | x | x | x | ||||||||||
| 55 | δ-Dodecalactone | 22.76 | 1724 (1704) 2 | x | x | x | |||||||||||||
| 56 | 1-Hexadecanol | 24.86 | 1845 (1874) 2 | x | |||||||||||||||
| 57 | Unknown 22 | 25.55 | 1874 | x | |||||||||||||||
| 58 | Unknown 23 | 25.62 | 1876 | x | |||||||||||||||
| Peak No. | Tentative ID | Selection Criteria | Species Detected in |
|---|---|---|---|
| 2 | Hexanal | PC1 | camb, cinn, gona, polo |
| 6 | 1-Octen-3-ol | RF | citr, polo |
| 10 | Unknown 4 | PC2 | polo |
| 13 | Unknown 7 | PC2 | polo |
| 16 | 3-Nonen-1-ol | PC2 | polo |
| 17 | 2,6-Nonadienal | PC1 | camb, gona |
| 18 | 4-Ethylphenol | RF | plur |
| 22 | 2,4-Nonadienal | PC1 | camb, gona, polo |
| 25 | Unknown 11 | PC2 | polo |
| 31 | 3-Undecen-2-one | PC1, RF | camb, cinn, gona, mult, plur, polo |
| 33 | Decanoic acid | RF | camb, gona, plur |
| 34 | 2-Undecenal | PC2 | polo |
| 44 | Aristolochene | RF | cinn |
| 45 | Unknown 17 | PC1 | camb, gona |
| Tree | Pathogen | Compound | MF | RT (min) | KI (KI lit.) | 9 dpi | 21 dpi |
|---|---|---|---|---|---|---|---|
| Quercus robur | P. cinnamomi | Unknown 1 | C14H20O2 | 25.10 | 1445 | x | x |
| Unknown 3 | C15H24 | 30.25 | 1661 | x | |||
| P. plurivora | Unknown 3 | C15H24 | 30.25 | 1661 | x | ||
| Fagus sylvatica | P. cinnamomi | Anisole | C7H8O | 10.00 | 922 (913) 1 | x | |
| P. plurivora | Anisole | C7H8O | 10.00 | 922 (913) 1 | x | ||
| Unknown 2 | C15H24 | 29.48 | 1627 | x | |||
| Isokaurene | C20H32 | 38.21 | 1964 (1988) 2 | x |
Disclaimer/Publisher’s Note: The statements, opinions and data contained in all publications are solely those of the individual author(s) and contributor(s) and not of MDPI and/or the editor(s). MDPI and/or the editor(s) disclaim responsibility for any injury to people or property resulting from any ideas, methods, instructions or products referred to in the content. |
© 2024 by the authors. Licensee MDPI, Basel, Switzerland. This article is an open access article distributed under the terms and conditions of the Creative Commons Attribution (CC BY) license (https://creativecommons.org/licenses/by/4.0/).
Share and Cite
Sherwood, P.; Nordström, I.; Woodward, S.; Bohman, B.; Cleary, M. Detecting Pathogenic Phytophthora Species Using Volatile Organic Compounds. Molecules 2024, 29, 1749. https://doi.org/10.3390/molecules29081749
Sherwood P, Nordström I, Woodward S, Bohman B, Cleary M. Detecting Pathogenic Phytophthora Species Using Volatile Organic Compounds. Molecules. 2024; 29(8):1749. https://doi.org/10.3390/molecules29081749
Chicago/Turabian StyleSherwood, Patrick, Ida Nordström, Steve Woodward, Björn Bohman, and Michelle Cleary. 2024. "Detecting Pathogenic Phytophthora Species Using Volatile Organic Compounds" Molecules 29, no. 8: 1749. https://doi.org/10.3390/molecules29081749