Article

Exploration of Polysaccharides from Phyllanthus emblica: Isolation, Identification, and Evaluation of Antioxidant and Anti-Glycolipid Metabolism Disorder Activities

Department of Organic Chemistry, College of Pharmacy, Harbin Medical University, Harbin 150081, China
*
Author to whom correspondence should be addressed.
These authors contributed equally to this work.
Molecules 2024, 29(8), 1751; https://doi.org/10.3390/molecules29081751
Submission received: 20 March 2024 / Revised: 4 April 2024 / Accepted: 10 April 2024 / Published: 12 April 2024
(This article belongs to the Special Issue Isolation, Synthesis and Biological Activity of Polysaccharides)

Abstract

:
Phyllanthus emblica is a natural medicinal herb with diverse bioactivities. Certain extracts from this herb have been confirmed to possess anti-glycolipid metabolic disorder activity. To further develop its utility value and explore its potential in combating glycolipid metabolic disorders, we designed a series of experiments to investigate the structure, antioxidant activity, and anti-glycolipid metabolic disorder activity of Phyllanthus emblica polysaccharides. In this study, we extracted and purified polysaccharides from Phyllanthus emblica and thoroughly analyzed their structure using various techniques, including NMR, methylation analysis, and surface-enhanced Raman spectroscopy. We investigated the hypolipidemic and anti-glycolipid metabolism disorder activity of Phyllanthus emblica polysaccharides for the first time utilizing oleic acid (OA) and advanced glycation end products (AGEs) as inducers. Additionally, the antioxidant activity of Phyllanthus emblica polysaccharides was assessed in vitro. These findings lay the groundwork for future investigations into the potential application of Phyllanthus emblica polysaccharides as an intervention for preventing and treating diabetes.

1. Introduction

According to epidemiological studies, cardiovascular disease (CVD) will continue to be a medical security burden in China and the world for a long time [1,2]. Although the prevention and treatment of CVD have improved to some extent due to advancements in medical conditions and living standards, its incidence rate and mortality remain high [3]. Previous studies have shown that hyperlipidemia and diabetes play crucial roles in the generation and development of CVD [4]. Hyperlipidemia is primarily characterized by elevated levels of total cholesterol (TC), triglycerides (TG), and low-density lipoprotein cholesterol (LDL-C), along with reduced levels of high-density lipoprotein cholesterol (HDL-C). Meanwhile, diabetes is primarily associated with insulin resistance [5]. Generally, patients with CVD may concurrently experience varying degrees of dyslipidemia and abnormal glucose metabolism, a condition referred to as glycolipid metabolism syndrome [6].
Advanced glycosylation end products are usually produced by non-enzymatic glycosylation caused by hyperglycemia; they are a set of isomeric metabolites characterized by significant toxicity [7,8,9]. AGEs are difficult to remove in the body, are closely related to the occurrence and development of CVD, and are considered to be an important cause of microvascular complications and lipid mass spectrometry changes in diabetes [10].
At present, symptomatic treatment is often used in clinics to treat disorders of glucose and lipid metabolism. On the one hand, statins are used to reduce cholesterol, and fibrates are used to reduce triglycerides and increase high-density lipoprotein [11,12], such as Simvastatin, bezafibrate, etc. On the other hand, enhancing the body’s sensitivity to insulin and coordinating with α-glucosidase inhibitors can help treat glucose metabolism disorders [13,14]. However, the above drugs all have obvious side effects. Hypolipidemic drugs made from statins and fibrates may lead to the dissolution of striated muscle tissue [15], while thiazolidinedione has strong hepatotoxicity [16]. Natural drugs have the advantages of low toxicity and good long-term efficacy, and they have become a popular direction for the development of drugs to treat anti-glycolipid metabolism disorder [17].
Phyllanthus emblica has a long history of use as a traditional Chinese medicine and as food [18,19]. It was first seen in “Southern Vegetation” and used by the traditional medical systems of 17 countries, including India, Iran, and Afghanistan [20,21]. It was proven that it has beneficial effects, such as anti-tumor [22,23,24], anti-inflammatory [25,26], antioxidation [27], etc. The present experiment focuses on the phenolic acids and flavonoids of Phyllanthus emblica; there is little research on its polysaccharides. In this experiment, the water-soluble neutral Phyllanthus emblica polysaccharide was extracted and separated, and its structure was identified. We determined the antioxidant activity of Phyllanthus emblica polysaccharides through in vitro experiments and comprehensively evaluated their anti-glycolipid metabolism disorder activity.

2. Results and Discussion

2.1. Preparation and Physicochemical Property Analysis of PEP-1-1

Figure S1A illustrates the extraction and purification processes of PEP. Water extraction and alcohol precipitation were used to extract crude polysaccharide (cPEP) from Phyllanthus emblica. After eluted it with water on the ion exchange column, the neutral fraction that demonstrated the highest yield (PEP-1) was chosen to be purified via DEAE-52 column chromatography. The yield of purified products is shown in Table S1. The elution curve of PEP-1 is displayed in Figure S1B. The polysaccharide PEP-1-1 was isolated and exhibited a single symmetric peak (Figure S1C).
The average Mw of PEP-1-1 was calculated to be 29.3 kDa based on the standard curve (lgMw-RT: y = −0.287x + 7.4773, R2 = 0.9905). Furthermore, PEP-1-1 contained 91.23% total sugar, 0.35% protein, and 6.22% uronic acid, suggesting that PEP-1-1 was a neutral polysaccharide. The ultraviolet absorption spectrum of PEP-1-1 showed that no discernible absorption peaks were observed at 260 nm and 280 nm in Figure S1D, indicating exceedingly low levels of protein and nucleic acid.
In order to further characterize the structure of the polysaccharides, we detected the particle size and ζ- potential of PEP-1-1 using a Marvin particle size analyzer. The results showed that the particle size of PEP-1-1 in the aqueous solution was 1093 nm, with a ζ-potential of −4.22 mV, further confirming that PEP-1-1 is a neutral polysaccharide. The chemical composition and molecular properties of PEP-1-1 was showed in Table 1.

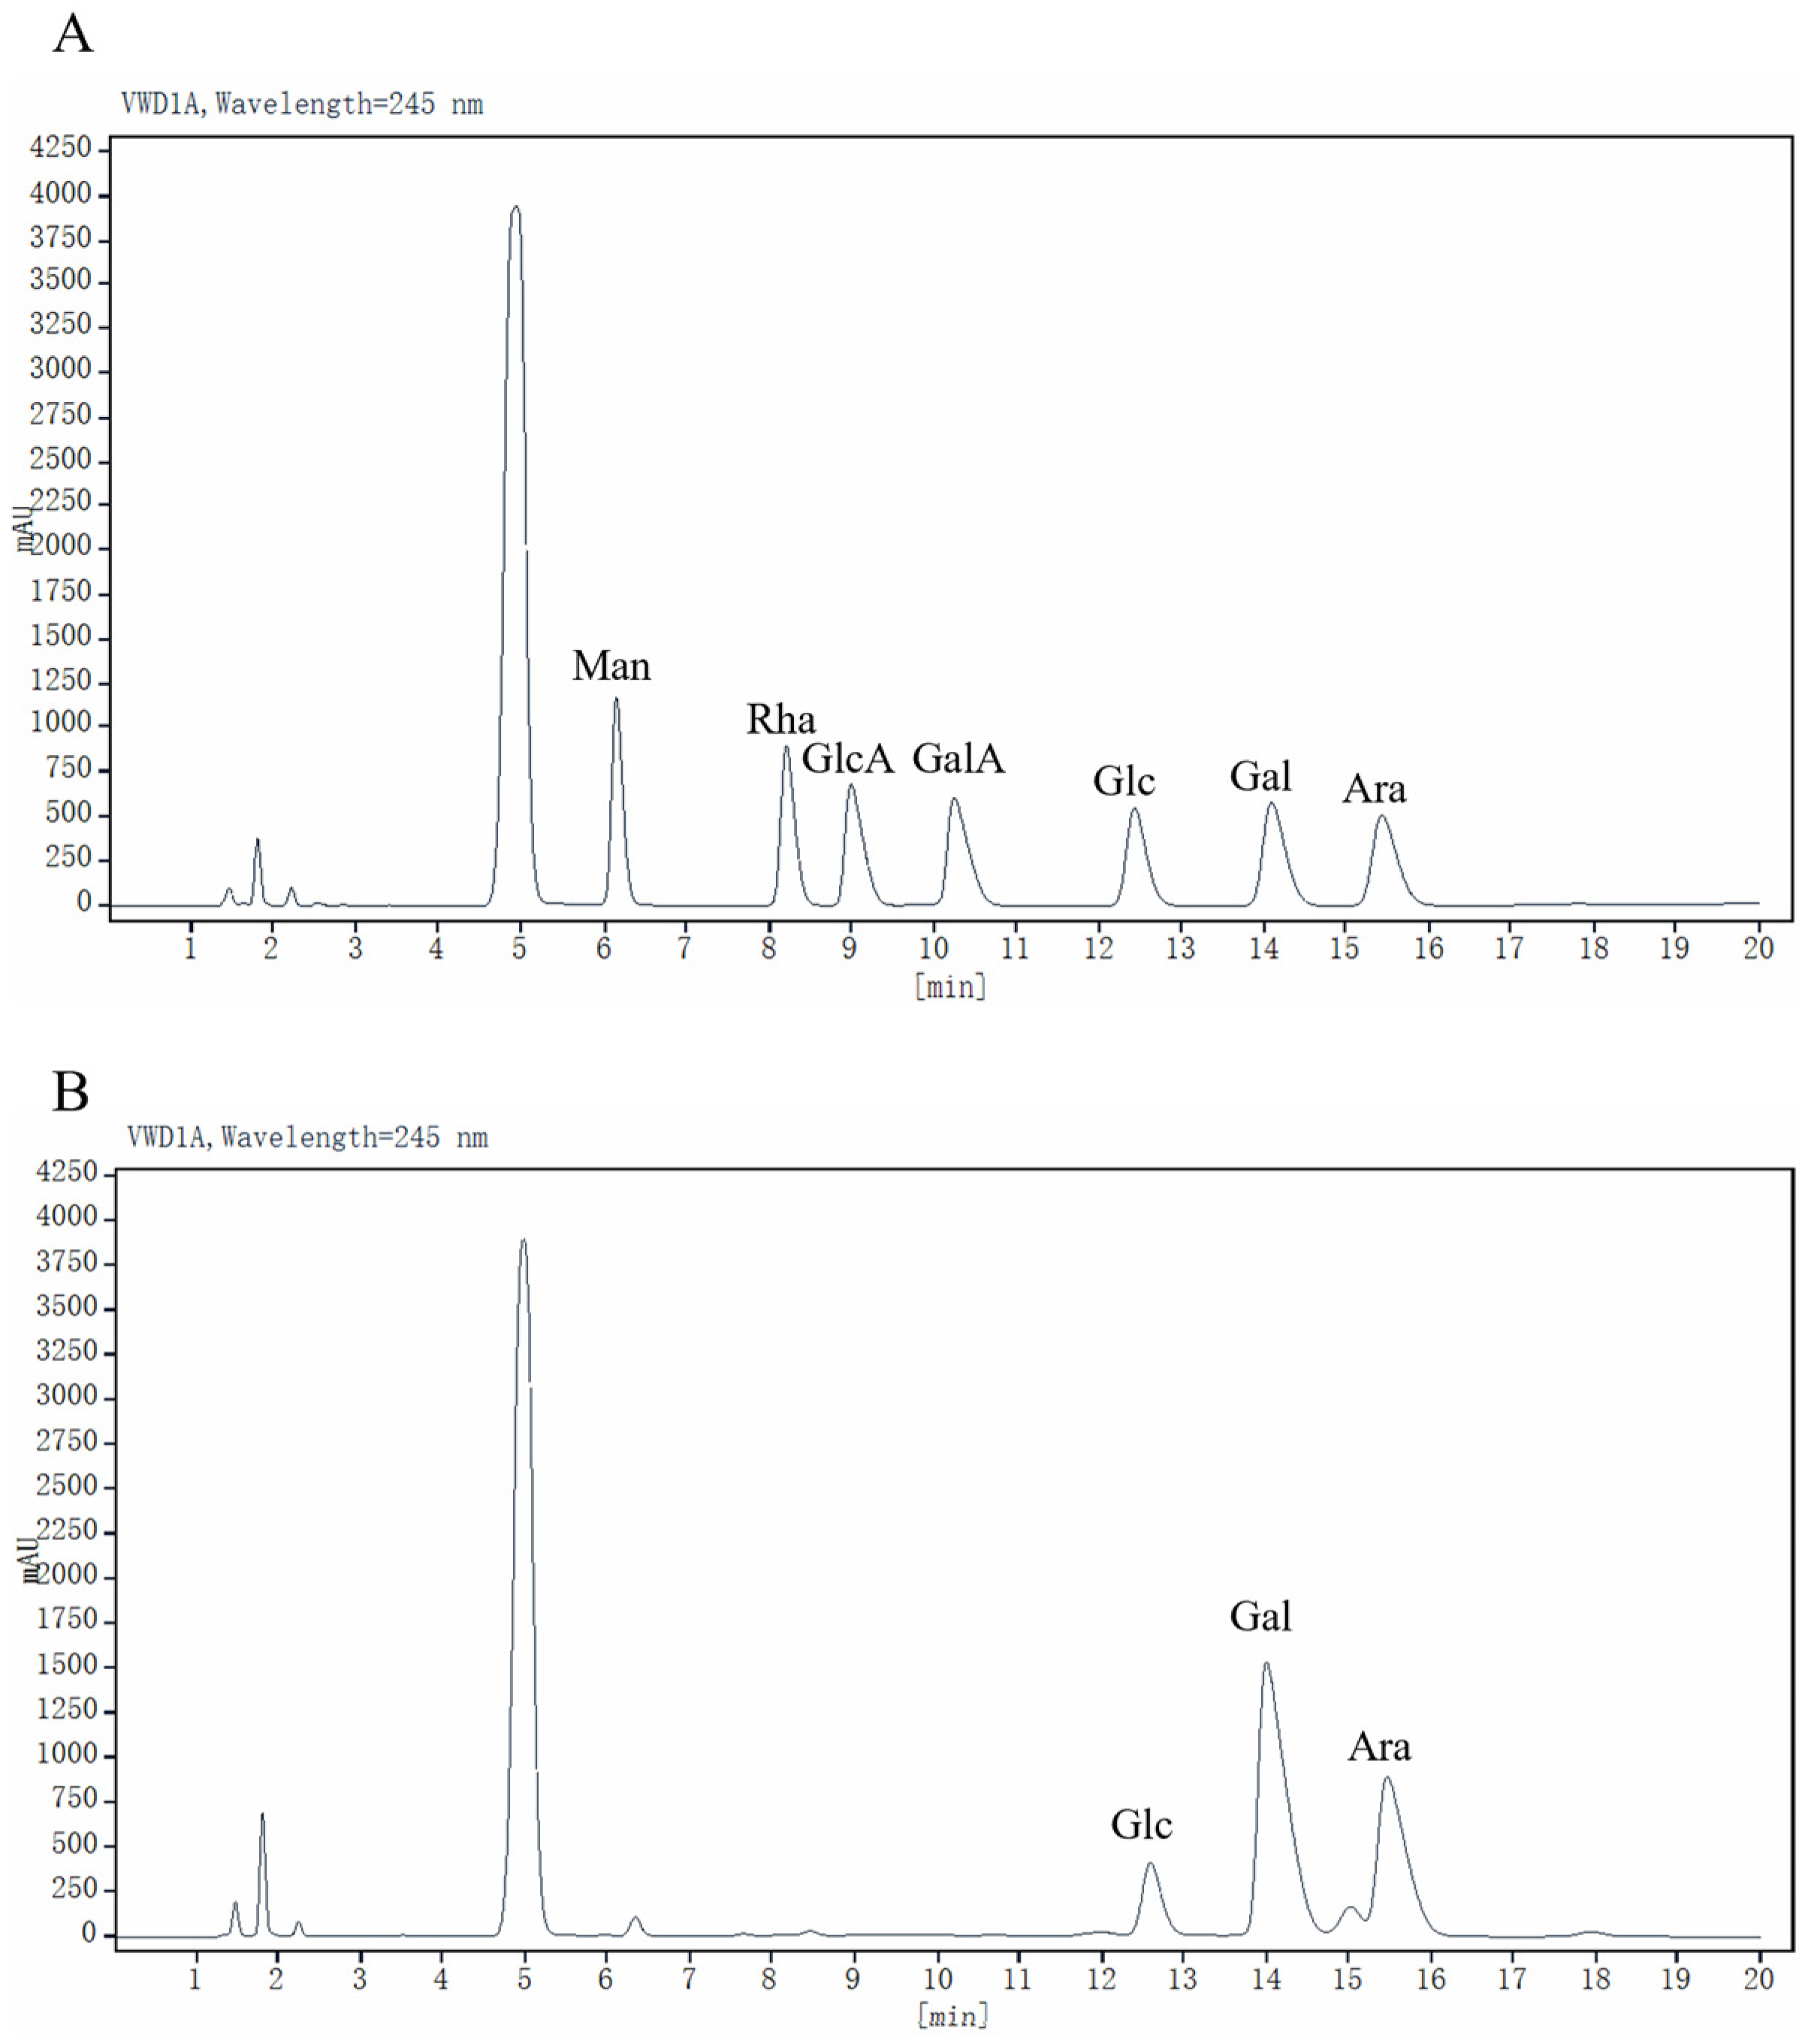
2.2. Monosaccharide Composition

PMP pre-column derivation and HPLC analysis were used to detect the monosaccharide composition of PEP-1-1. The results are shown in Figure 1A,B. PEP-1-1 mainly contained Gal, Ara, Glc, and Man with a molar ratio of 52.61:32.89:12.08:1.50. The findings diverged from the monosaccharide compositions of the polysaccharide extracted from Phyllanthus emblica, as documented in prior studies. This variance could be attributed to differences in the extraction methods, purification procedures, or the employed methods and instruments for identification [28]. Galactose was the predominant monosaccharide group in PEP-1-1, making up the highest proportion among the identified monosaccharides. The proportion of glucuronic acid and galacturonic acid in PEP-1-1 was extremely low, which indicated that PEP-1-1 is a neutral polysaccharide.

2.3. FT-IR Analysis

The infrared spectrum exhibited characteristic absorption peaks corresponding to the O-H stretching vibration at 3402.43 cm−1 and C–H stretching vibrations at 2891.29 cm−1, which are typical signals associated with polysaccharides [29]. The absorption peak of 1375.24 cm−1 belonged to the variable angle vibration of C–H. Additionally, the presence of a pyranose ring with C–O–C and C–OH stretching vibration was confirmed by a strong absorption peak at 1047.34 cm−1 [30]. Small characteristic peaks at 900.75 and 813.96 cm−1 were observed in PEP-1-1, which showed that PEP-1-1 had both α-and β-type glycosidic linkages [31], respectively. Furthermore, the peak at 1604.77 cm−1 was attributed to the bound water [32]. The results are shown in Figure S2.

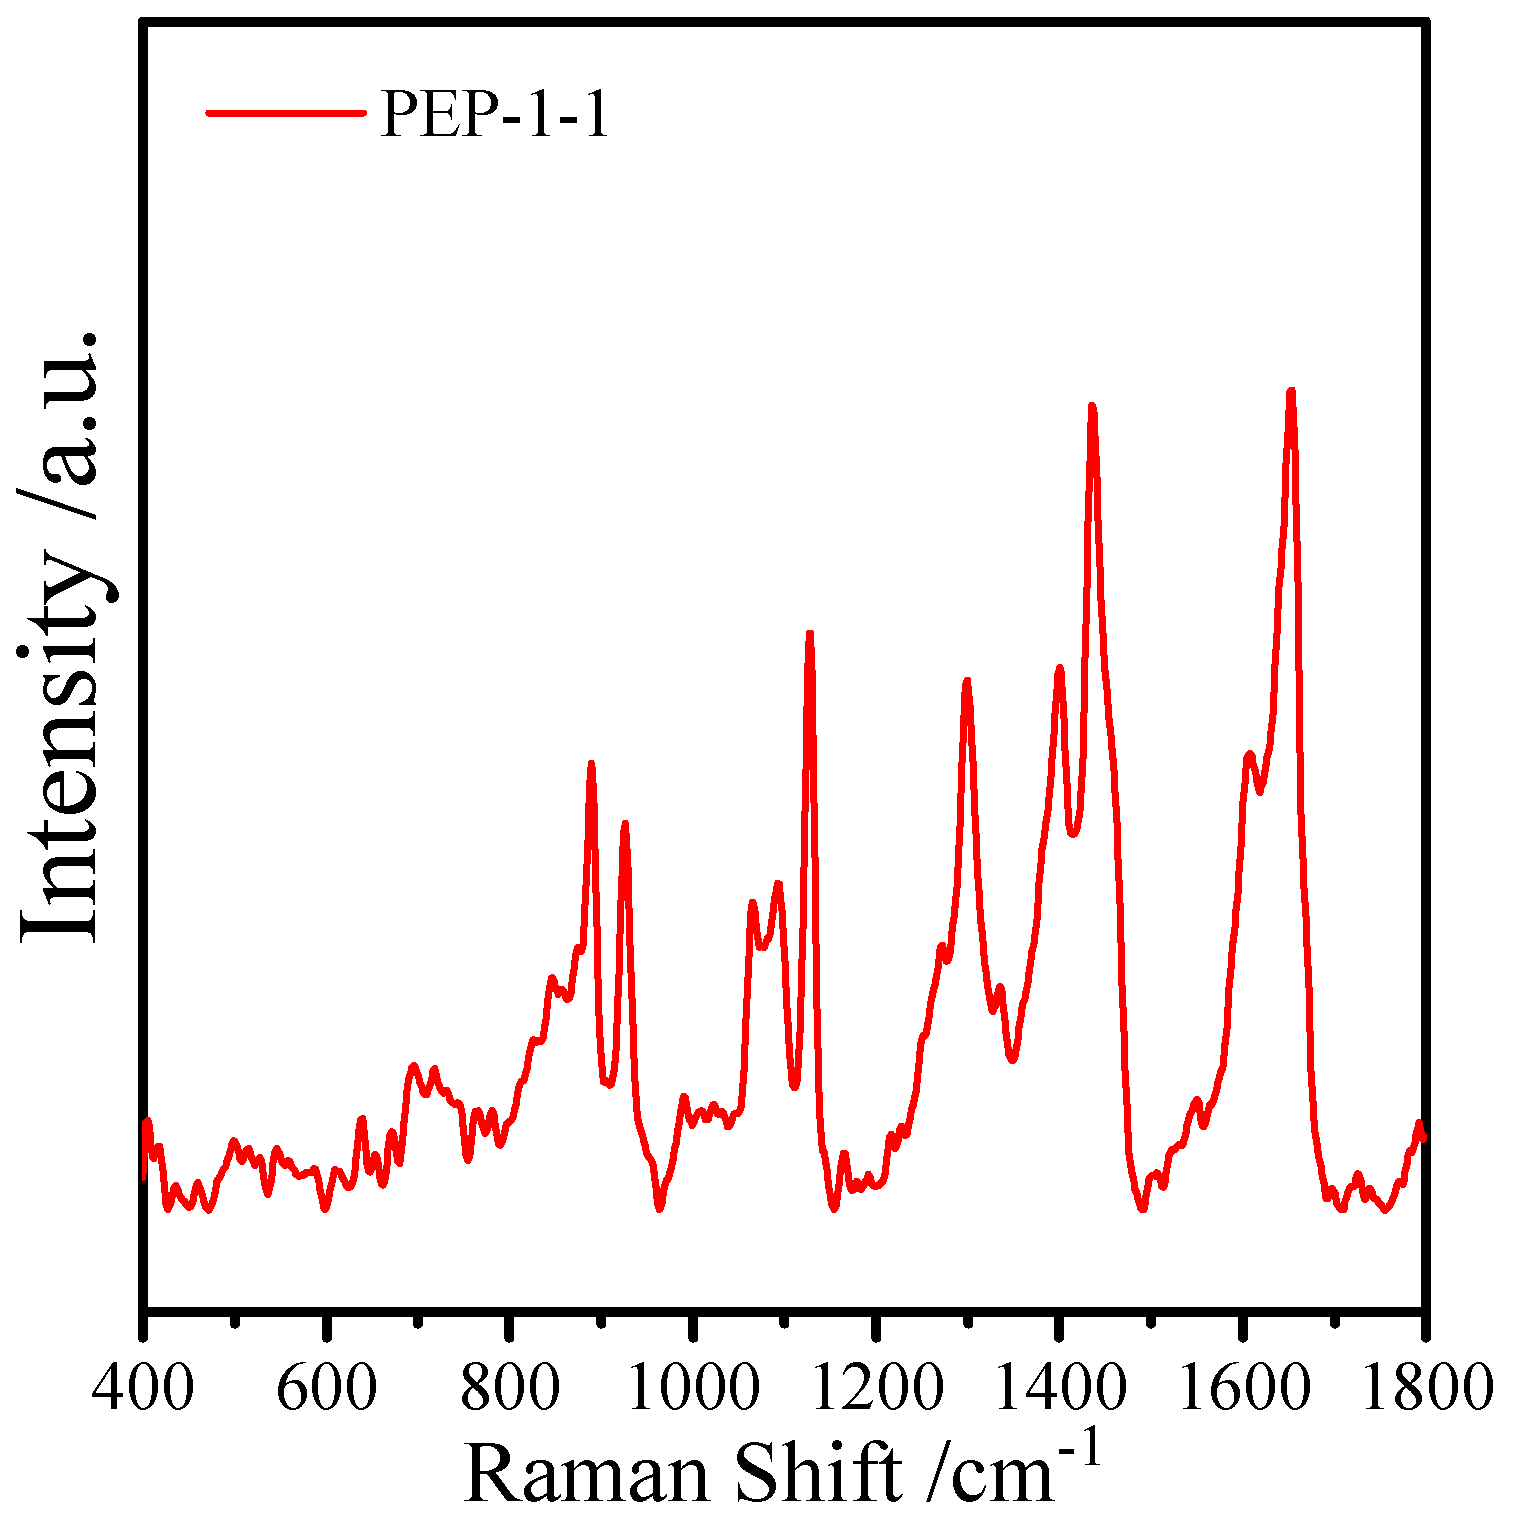
2.4. Surface-Enhanced Raman Spectroscopy Analysis

The surface-enhanced Raman spectroscopy of PEP-1-1 is shown in Figure 2; significant polysaccharide signal peaks were observed within it, including C-C-O-C-O stretching vibration at 853 cm−1 [33], C-H stretching vibration at 925 cm−1 [34], C-O shear vibration at 1120 cm−1 [35], C-O-H bending vibration at 1300 cm−1 [36], C-H bending with some O-H contribution at 1410 cm−1, and CH2 stretching vibration at 1455 cm−1 were [37].

2.5. Methylation Analysis

Methylation serves as a potent and efficient approach for predicting the sugar linkage patterns of polysaccharides. Based on the retention time and mass spectrum information available in the CCRC Spectral Database (https://www.ccrc.uga.edu, accessed on 20 August 2023) and GC-MS analysis, PEP-1-1 was found to possess a minimum of four glycosidic linkages, including T-Araf, 1,5-Araf, 1,3,5-Araf, and 1,3-Galp (Table S2). Previous studies have shown that arabinogalactan had unique biological activities, such as immune activity, anticancer activity [38], and anti-aging activity [39]. The results suggest that antioxidant and anti-glycolipid metabolism disorder activities might also be due to large amounts of galactose and arabinose. A further deduction in the intricate structures of PEP-1-1 necessitated a detailed examination through an NMR analysis.

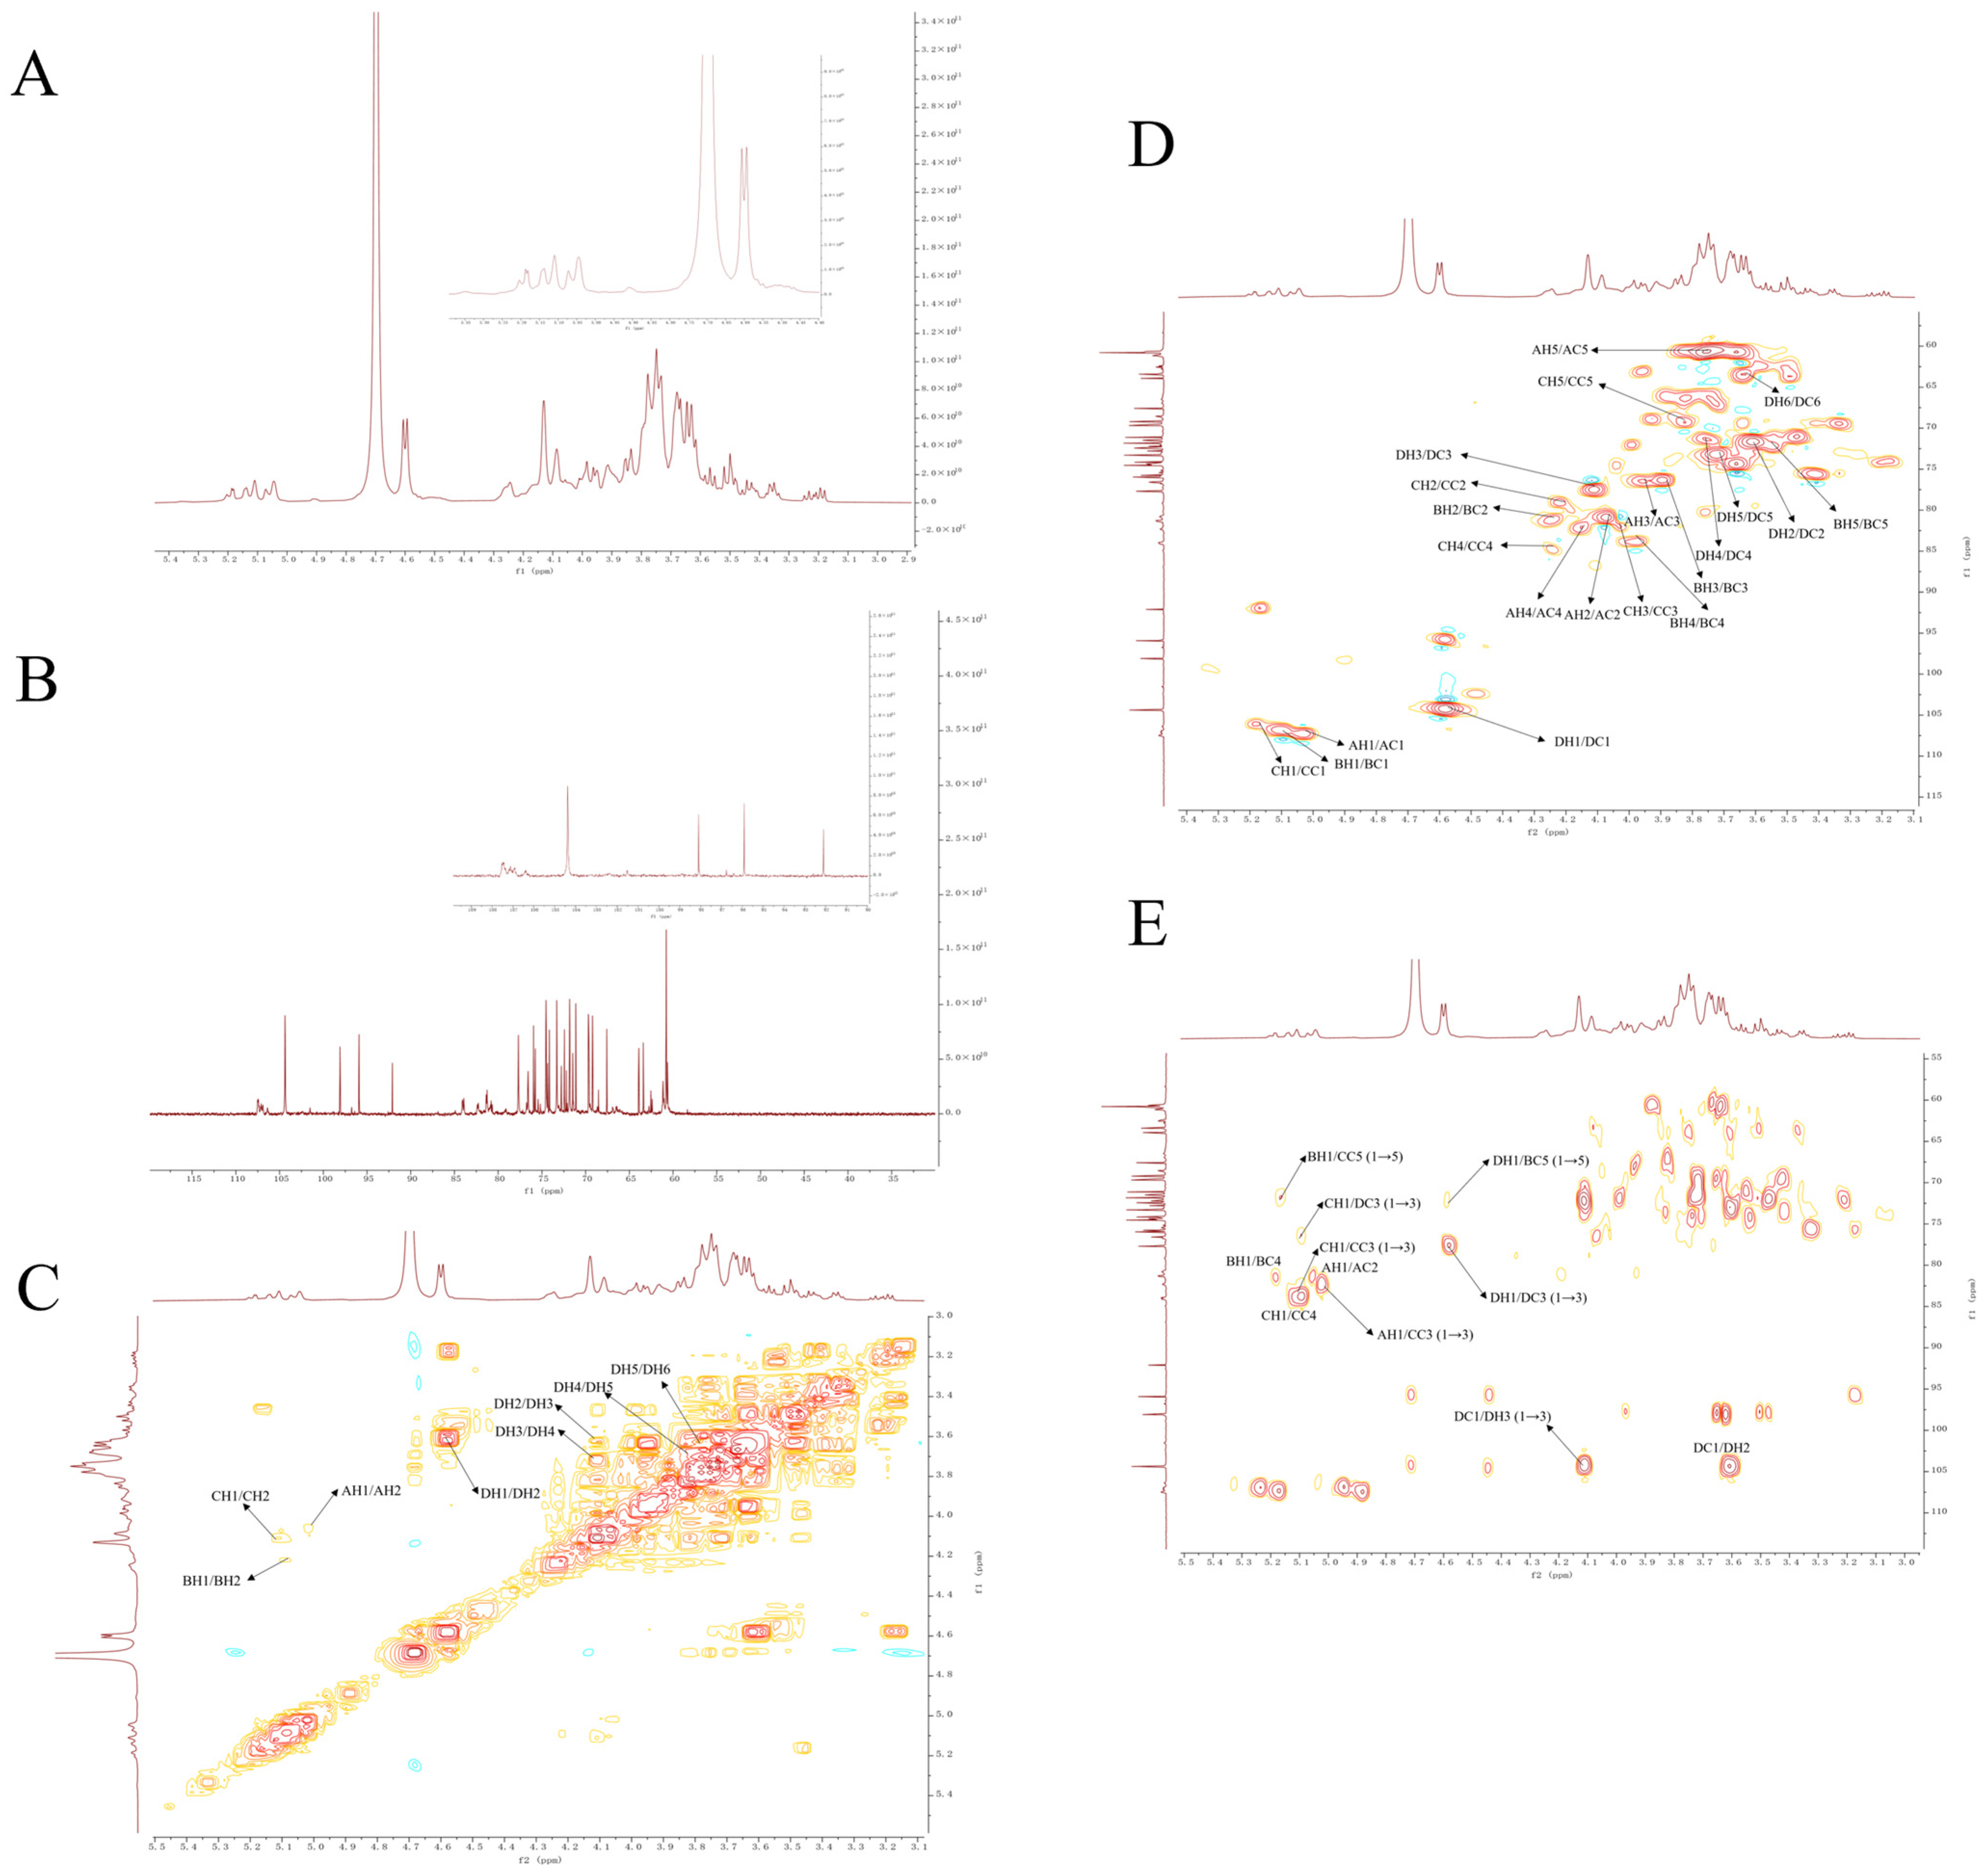
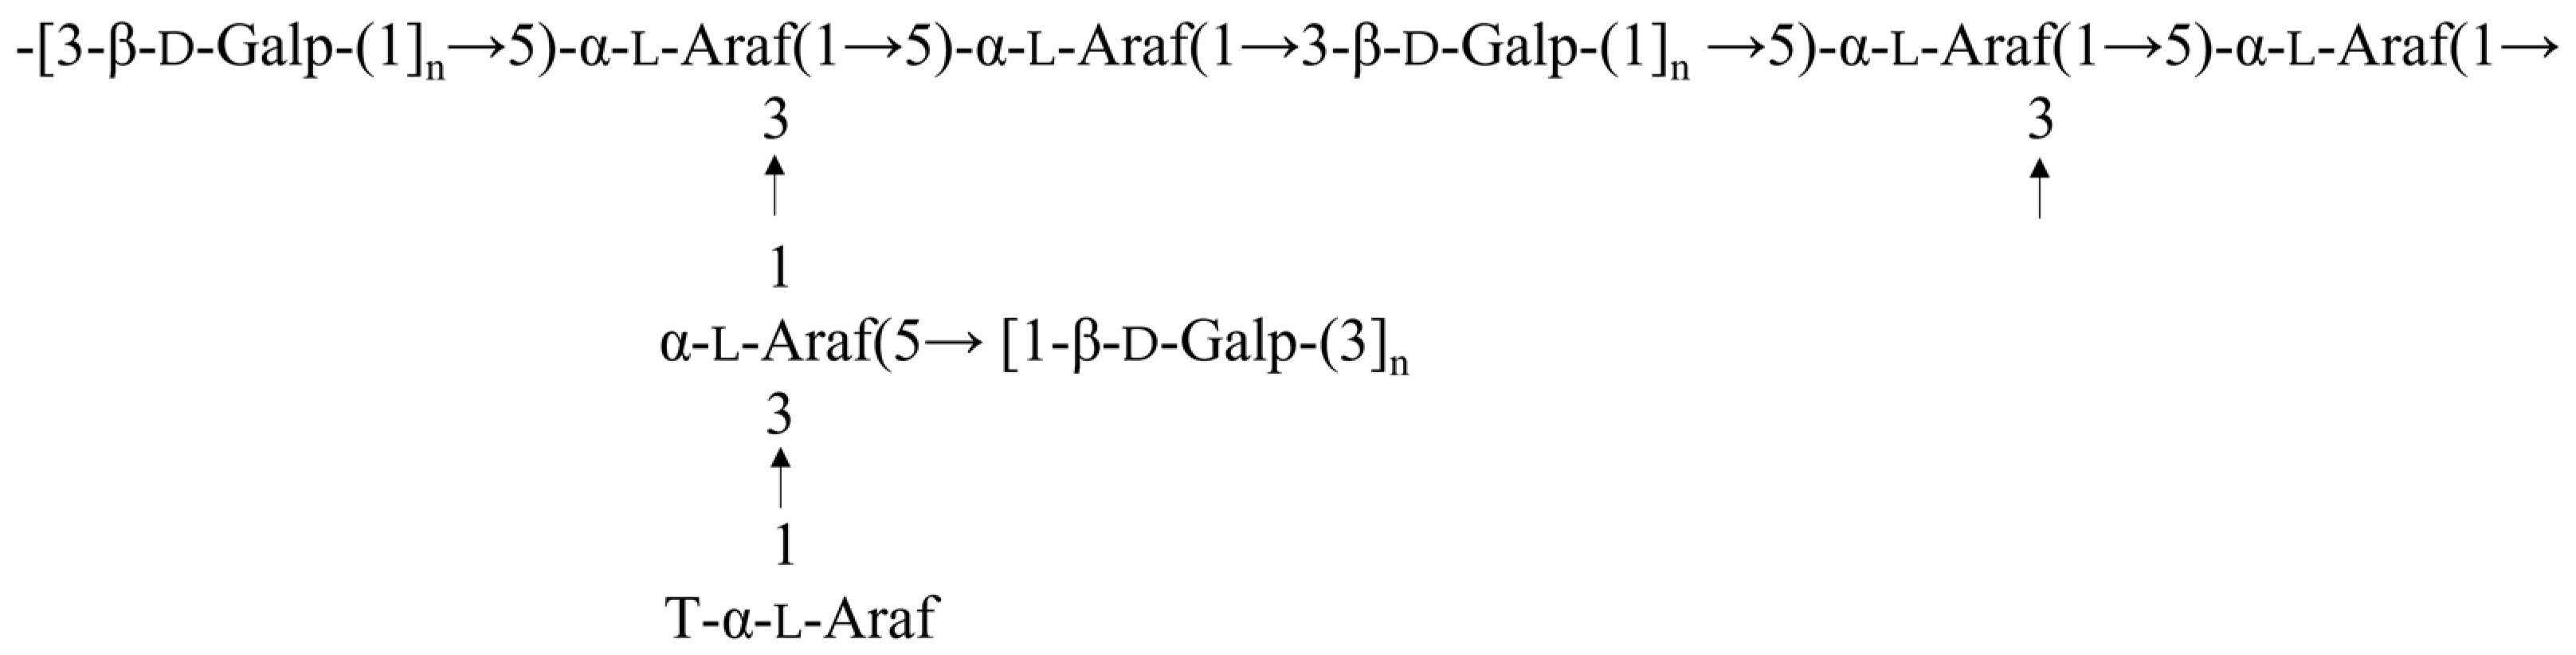
2.6. NMR Spectra Analysis

To delve deeper into the intricate structure of PEP-1-1, we conducted spectrum experiments on 1D NMR as well as 2D NMR. The majority of anomeric signals in PEP-1-1 were detected within the chemical shift range of δ 4.3–5.5 ppm for 1H-NMR and δ 90–120 ppm for 13C-NMR. Hydrogen signals indicative of the β-anomeric configuration were observed within the range of δ 4.5–4.8 ppm, while the corresponding carbon signals were identified in the δ 100–110 ppm range. In contrast, α-anomeric hydrogen signals were detected in the δ 4.8–5.8 ppm range, accompanied by corresponding carbon signals in the δ 90–100 ppm range [40]. Utilizing NMR assignments documented in the literature, the HSQC correlations identified at 5.03/107.31 and 5.17/106.35 were designated as H1/C1 for T-α-lAraf (labeled as residue A) and 1,5-α-l-Araf (B) [41], respectively. Another correlation of 5.10/106.90 was ascribed to H1/C1 for 1,3,5-α-l-Araf (C) [42], and the correlation of 4.60/104.50 was attributed to H1/C1 for 1,3-β-d-Galp (D) [40]. Concerning residue D, the COSY spectrum (Figure 3C) revealed cross signals at 4.60/3.62, 3.62/4.12, 4.12/3.75, 3.75/3.72, and 3.72/3.65 ppm, corresponding to H1/H2-H5/H6 assignments. Additionally, in the HSQC spectrum (Figure 3D), the correlation peaks at 4.60/104.50, 3.62/71.72, 4.12/77.50, 3.75/71.50, 3.72/73.21, and 3.65/60.68 ppm were designated as H1/C1-H6/C6 assignments, respectively [43,44]. Furthermore, the proton and carbon signals for other residues were assigned through the analysis of HSQC combined with 1H–1H COSY spectra. the H2/C2-H5/C5 values of residue A were 5.03/107.31, 4.07/81.03, 3.96/76.34, 4.15/82.07, and 3.75/60.99 ppm [45]. The H2/C2-H5/C5 values of residue B were 5.17/106.35, 4.24/81.34, 3.89/76.68, 3.98/83.83, and 3.98/83.83 [46]. The H2/C2-H6/C6 values of residue C were 5.10/106.90, 4.22/79.10, 4.03/82.06, 4.24/84.27, and 3.82/69.26 ppm [47]. Table 2 includes the NMR assignments for glycosidic residues A–D.
The analysis of the backbone structure and substitution sites was further conducted using the HMBC spectrum (Figure 3E). In summary, the correlation peak at 5.03/82.06 ppm signifies the connection between H1 of residue A and C3 of residue C, indicating the existence of a recurring unit [T-α-l-Araf-(1-3)-α-l-Araf(5)(1-)] within the polysaccharide structure. Furthermore, the correlation peak at 5.17/69.26 ppm suggests the connection of H1 of residue B to C5 of residue C, confirming the presence of a repeating unit [5-α-l-Araf-(1-5)-α-l-Araf(3)(1-)] in the polysaccharide structure. The correlation peak at 4.60/77.50 ppm and 4.12/104.50 ppm indicates the linkages of H1 of residue D to C3 of residue D and H3 of residue D to C1 of residue D. This suggests the presence of extensive repeating units [-3-β-d-Galp-(1-3)-β-d-Galp-(1-)] within the polysaccharide structure. The correlation peak at 5.10/82.06 ppm indicates the linkage of H1 of residue C to C3 of the same residue, suggesting the presence of a repeating unit [5-α-l-Araf-(3)(1-5)-α-l-Araf(3)(1-)] within the polysaccharide structure. In addition, Figure 3E illustrates additional cross peaks and the corresponding connected relationships among residues. There are still some inter-residual cross couplings of units in the picture. The cross peaks at 5.03/81.03, 5.17/83.83, 5.10/84.27, and 104.50/3.62 were ascribed to H1/C2 of A, H1/C4 of B, H1/C4 of C, and H2/C1 of D, respectively. Meanwhile, certain signals in the HMBC spectrum of PEP-1-1 were faint and remained partially unassigned, which was likely attributed to the low sugar residue content and the substantial Mw of PEP-1-1. Considering the established connections between residues, the majority of repeating units have been identified. Leveraging this determination, we can assemble these units in accordance with their connection relationships to deduce the potential structure of PEP-1-1 (Figure 4).

2.7. Congo Red Test Analysis

Congo red is a kind of acid dye that can interact with polysaccharides possessing a triple helical structure to form Congo red complexes. As shown in Figure S3, there was no observable shift towards longer wavelengths in the maximum absorption wavelength (λ max) of the Congo red–PEP-1-1 complex, indicating the absence of a triple helical structure in the polysaccharide. According to earlier studies, β-(1→3)-linked glycans with a molecular weight exceeding 90 kDa are more prone to adopting a triple helical conformation [48]. Overall, the associations between chain conformations and the bioactive properties of the polysaccharide remain unresolved and necessitate further comprehensive research.

2.8. SEM Analysis

Macromolecular microstructure and morphological characteristics can be observed using SEM [49]. In Figure S4, it can be seen that PEP-1-1 is an irregular network structure composed of short rod-shaped fragments, indicating that the regularity of the aggregates is not strong and that PEP-1-1 is an amorphous structure. Under high-power microscopy, it can be observed that the polysaccharide is an irregular granular aggregate, indicating that PEP-1-1 has no crystal structure and is an amorphous solid substance. This may be due to the low contents of glucuronic acid and protein macromolecules, fewer interaction points between particles, and a smaller interaction force, resulting in a low aggregation degree [50,51,52].

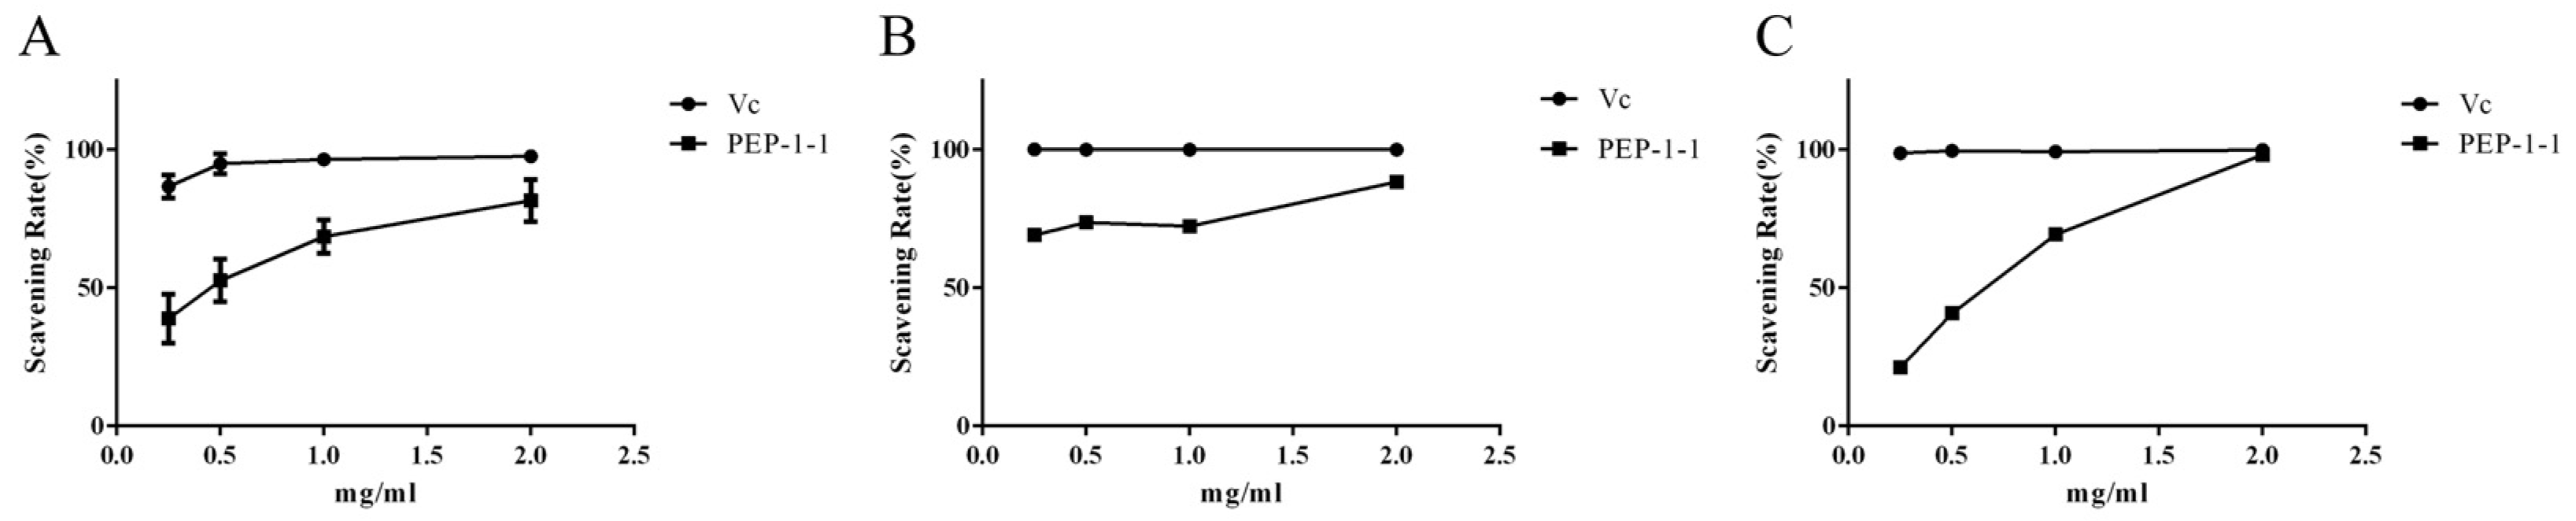
2.9. Antioxidant Activity of PEP-1-1 In Vitro

Oxidative stress is an imbalance between oxidation and antioxidant activities in the body, which can cause some important macromolecular substances in the organism to react with reactive oxygen species, lose their original physiological activity, and lead to cell damage and apoptosis [53].
Hydroxyl radicals are commonly recognized as potent oxidants. Upon entry into cells, they readily engage in reactions with various biological molecules [54]. As depicted in Figure 5A, the scavenging ability of PEP-1-1 against hydroxyl radicals was lower than that of VC at equivalent concentrations. When the concentration of PEP-1-1 increased from 0.25 mg/mL to 2 mg/mL, its clearance rate increased from 38.86 ± 8.87% to 81.64 ± 7.61%, indicating its dose dependence. At a safe cell concentration of 1 mg/mL, the hydroxyl radical scavenging rate of PEP-1-1 was 68.57 ± 6.09%, demonstrating good hydroxyl radical scavenging activity.
Superoxide anion radical is also a strong oxidant in the body, which will react with various organelles. In Figure 5B, when the concentration of PEP-1-1 increased from 0.25 mg/mL to 1 mg/mL, its free radical scavenging activity increased from 69.08 ± 1.18% to 72.37 ± 2.20%, indicating that PEP-1-1 has stable superoxide anion-free radical scavenging activity at low concentrations. However, when the concentration of PEP-1-1 increased from 1 mg/mL to 2 mg/mL, its scavenging activity increased to 88.42 ± 2.12%, showing a dose-dependent relationship.
To determine the total antioxidant capacity of a natural product, the ABTS method is commonly used [55]. In Figure 5C, when the concentration of PEP-1-1 increased from 0.25 mg/mL to 2 mg/mL, the scavenging activity of PEP-1-1 on ABTS free radicals increased from 21.21 ± 0.26% to 98.13 ± 0.26%, which is almost equal to that of the positive control drug Vc, indicating that the total reducing power of PEP-1-1 is dose-dependent. At a safe concentration of 1 mg/mL, the free radical scavenging activity of PEP-1-1 is 69.34 ± 0.40%, which is relatively ideal. Compared with the above experimental results, PEP-1-1 has good antioxidant activity and can achieve ideal comprehensive antioxidant capacity by clearing multiple free radicals.

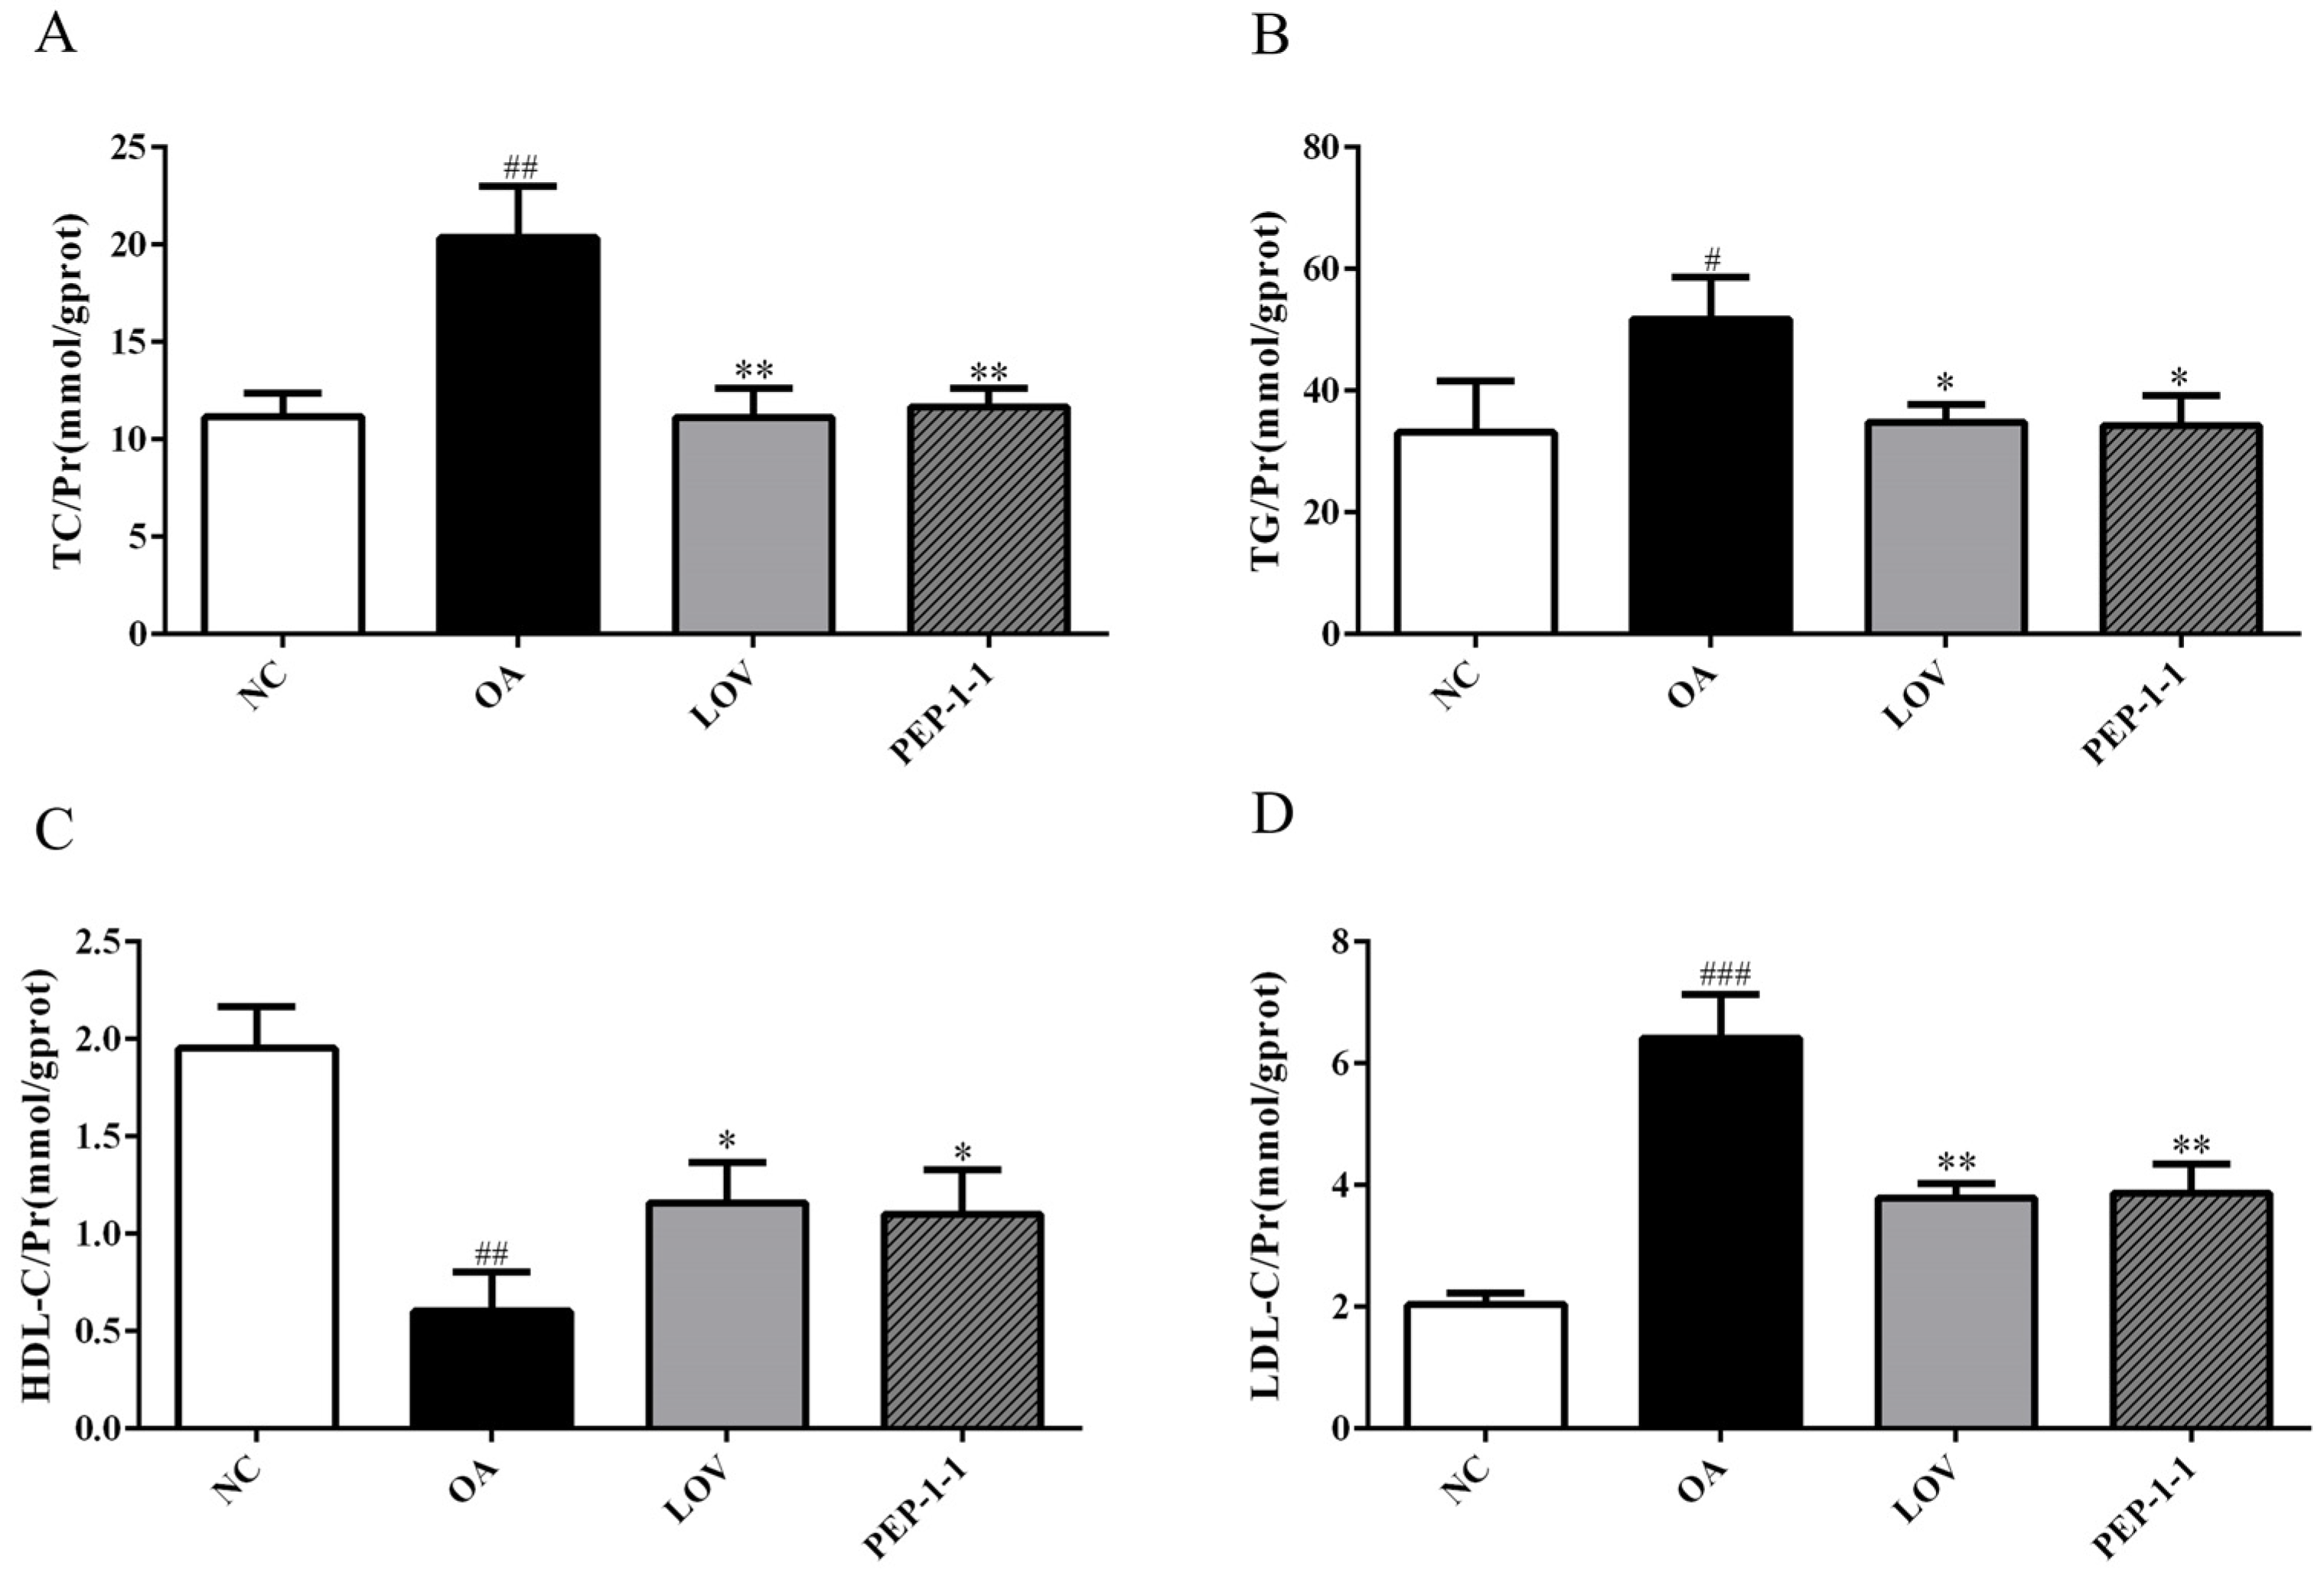
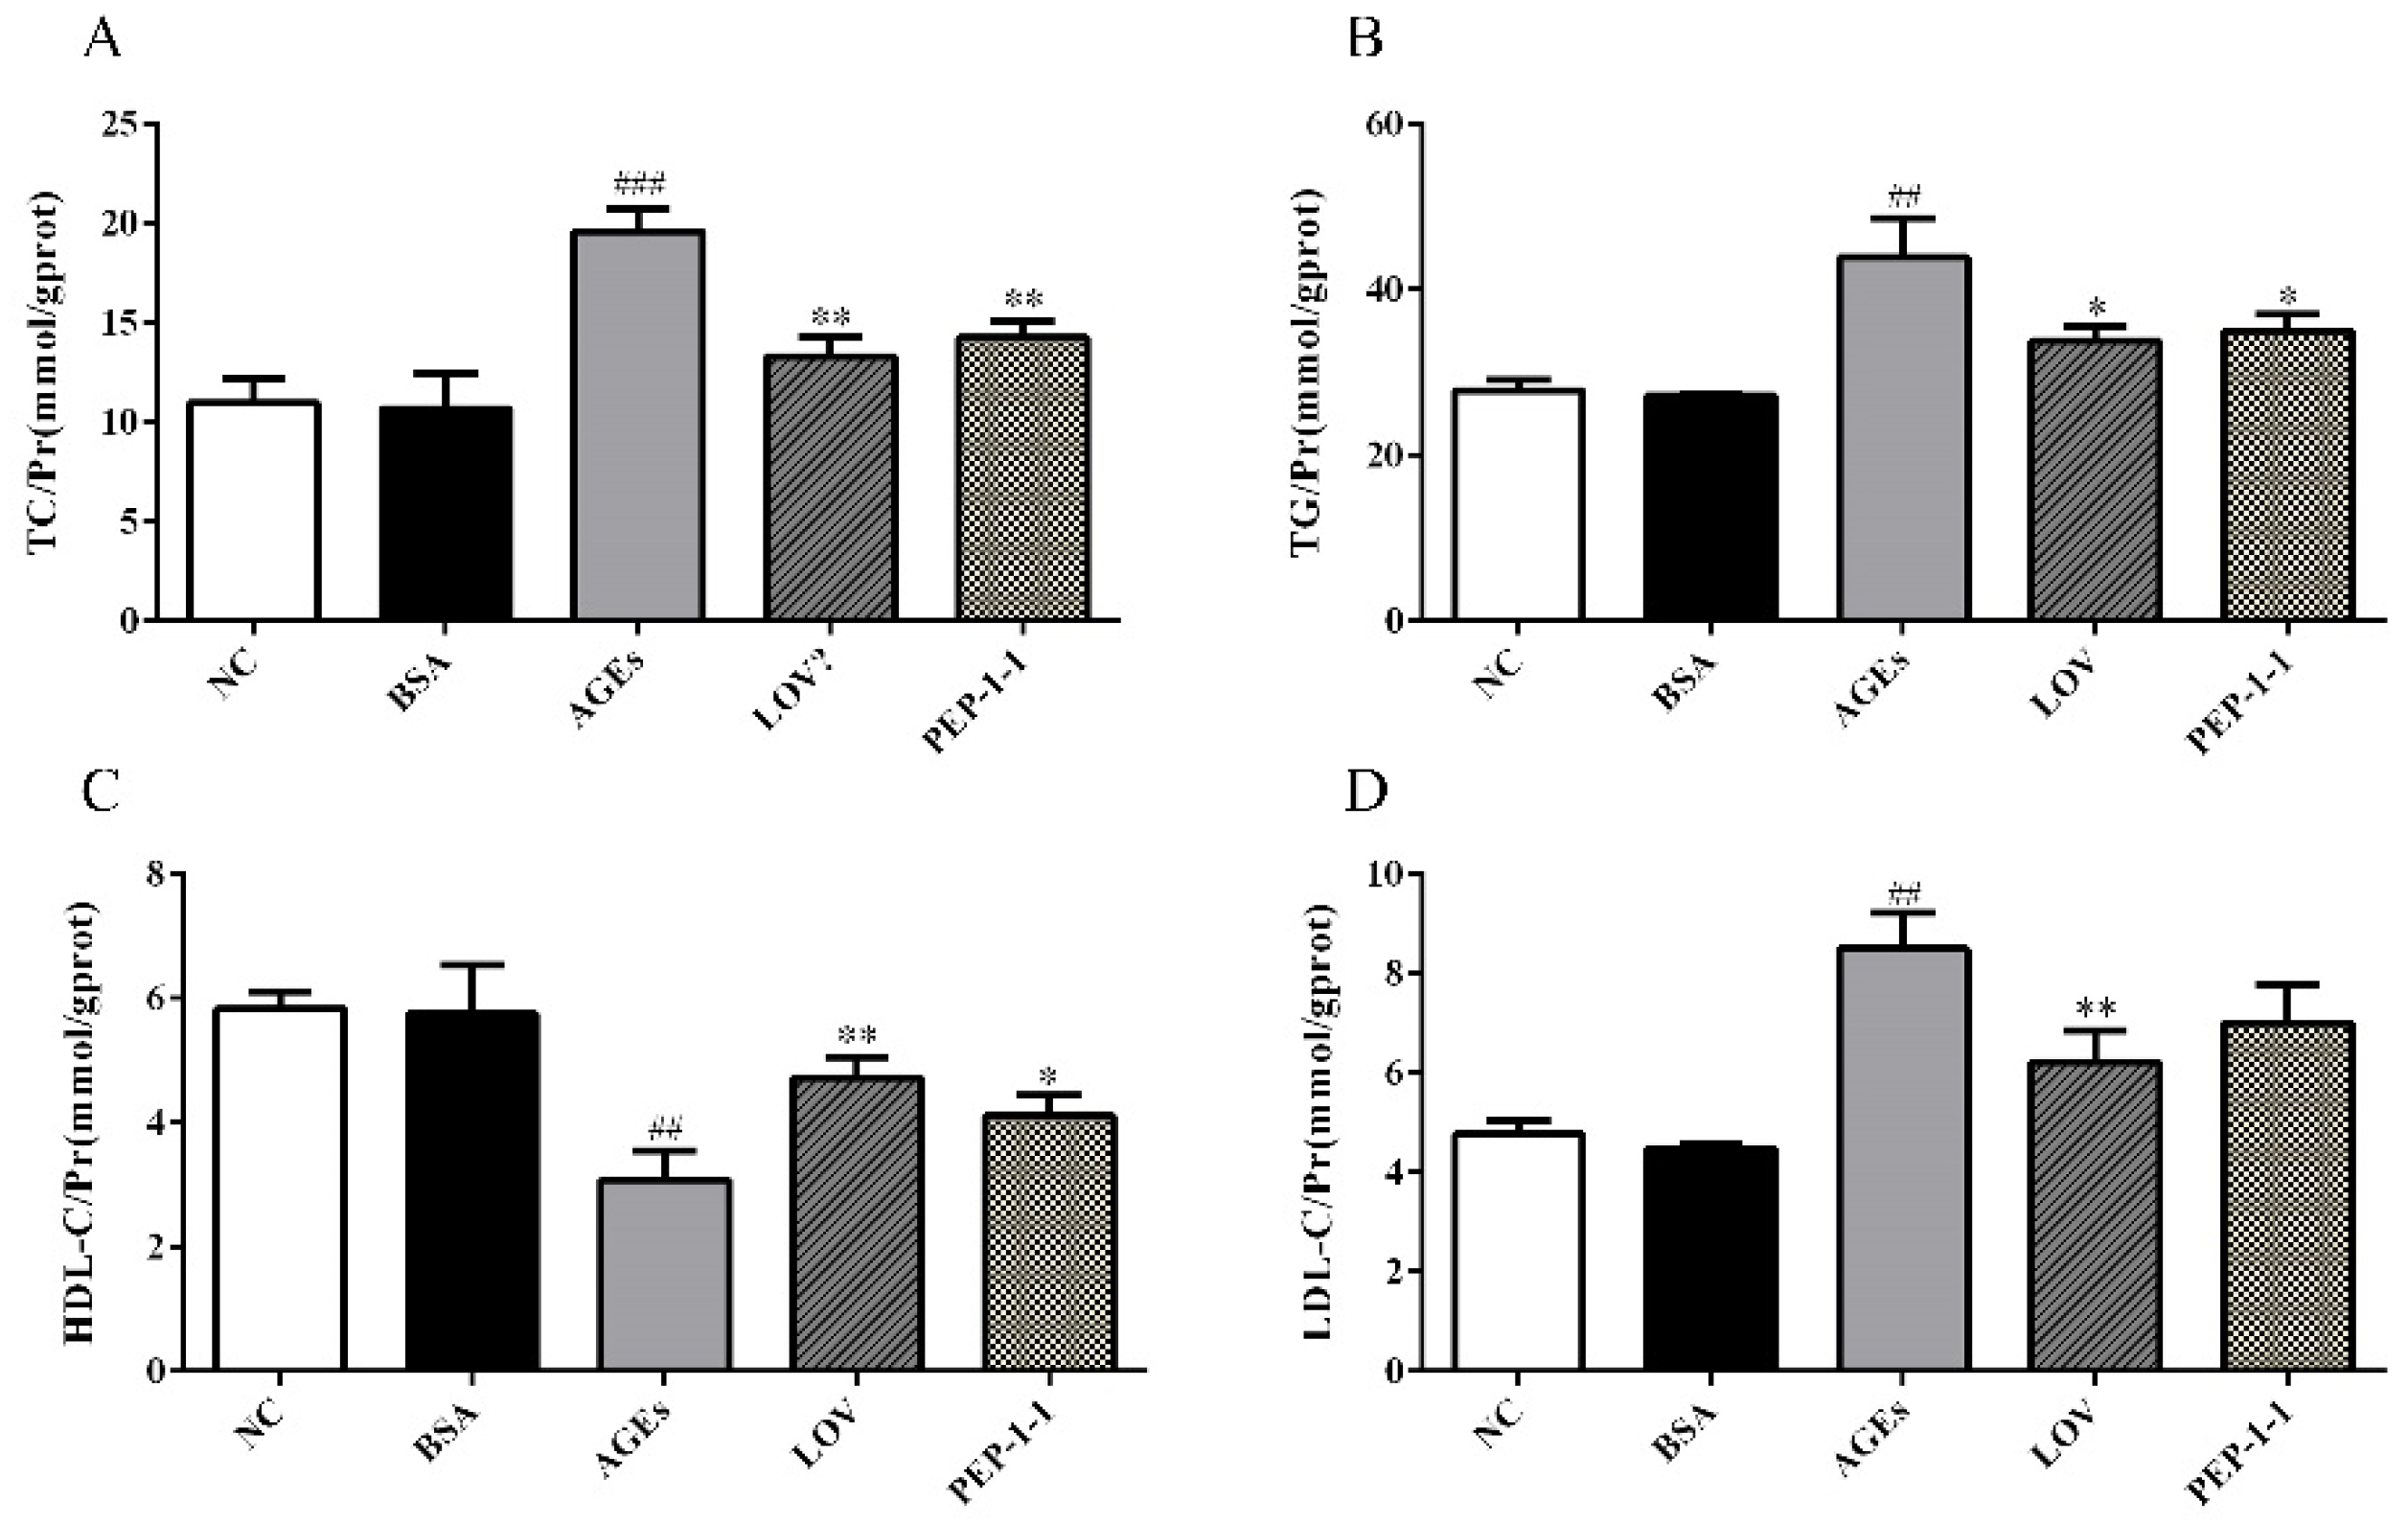
2.10. Hypolipidemic Activity and Anti-Glycolipid Metabolism Disorder Activity of PEP-1-1

2.10.1. Effects of PEP-1-1 on Cell Viability

HepG2 cells are commonly used as cell models to evaluate the lipid content. They are important cell models for studying fat synthesis and metabolism. Our study showed that, compared to the NC group, PEP-1-1 had no significant toxic effects. When PEP-1-1 was administered at a concentration of 1 mg/mL, the cell survival rate of HepG2 cells exceeded 90%, so subsequent experiments used this concentration as the dosing concentration. The results are shown in Figure S5.

2.10.2. Effects of PEP-1-1 on Lipid Content in High-Fat HepG2 Cell Model Induced by OA

The impact of PEP-1-1 on the lipid accumulation induced by OA in HepG2 cells is depicted in Figure 6. A high-fat cell model was successfully constructed by increasing the TC, TG, and LDL-C levels and decreasing the HDL-C levels in the OA group compared with those of the NC group. The positive control drug lovastatin could effectively improve lipid level abnormalities induced by OA; PEP-1-1 exhibited similar activity to lovastatin. Through OA induction, the contents of TG, TC, and LDL-C in HepG2 cells significantly increased from 33.14 ± 4.878 mmol/gprot, 11.16 ± 0.7119 mmol/gprot, and 2.038 ± 0.1101 mmol/gprot to 51.76 ± 3.967 mmol/gprot, 20.36 ± 1.514 mmol/gprot, and 6.414 ± 0.4151 mmol/gprot, respectively. The content of HDL-C decreased synchronously from 1.953 ± 0.1233 mmol/gprot to 0.6037 ± 0.1160 mmol/gprot, indicating the successful establishment of a high-fat model. After intervention with Lov and PEP-1-1, the abnormal lipid profile was improved, and the TG, TC, and LDL-C contents significantly decreased, reaching 34.86 ± 1.632 mmol/gprot and 34.25 ± 2.842 mmol/gprot, 11.13 ± 0.8662 mmol/gprot and 11.65 ± 0.5526 mmol/gprot, and 3.785 ± 0.1391 mmol/gprot and 3.868 ± 0.2786 mmol/gprot, respectively. HDL-C increased to 1.160 ± 0.1200 mmol/gprot and 1.102 ± 0.1309 mmol/gprot. In summary, PEP-1-1 has excellent hypolipidemic activity and can effectively improve lipid abnormalities induced by OA in HepG2 cells.

2.10.3. Effects of PEP-1-1 on Lipid Content in High-Fat HepG2 Cell Model Induced by AGEs

The generation of AGEs affects the normal function of proteins, promotes lipid peroxidation, and induces insulin resistance [56,57]. This experiment utilizes AGEs to induce the formation of a high-fat model in HepG2 cells, which associates glucose metabolism and lipid metabolism at the cellular level, enabling the expression of glucose and lipid metabolism disorders in the same cell model and forming a convenient and effective model for constructing glucose and lipid metabolism disorders. The effect of PEP-1-1 on AGE-induced lipid accumulation in HepG2 cells is shown in Figure 7. The lipid levels in AGE group cells were significantly abnormal, with increased the levels of TG, TC, and LDL-C, while the HDL-C level decreased. Under the intervention of Lov and PEP-1-1, the status of lipid abnormalities significantly improved. Through AGE induction, the contents of TG, TC, and LDL-C in HepG2 cells significantly increased from 27.84 ± 0.7262 mmol/gprot, 10.96 ± 0.6977 mmol/gprot, and 4.765 ± 0.1651 mmol/gprot to 43.90 ± 2.730 mmol/gprot, 19.59 ± 0.6546 mmol/gprot, and 8.492 ± 0.4186 mmol/gprot, respectively. The content of HDL-C decreased synchronously from 5.826 ± 0.1640 mmol/gprot to 3.077 ± 0.2749 mmol/gprot, indicating the successful establishment of a high-fat model. After intervention with Lov and PEP-1-1, the abnormal lipid profile was improved, and the TG, TC, and LDL-C contents significantly decreased, reaching 33.79 ± 1.006 mmol/gprot and 34.96 ± 1.151 mmol/gprot, 13.30 ± 0.5597 mmol/gprot and 14.26 ± 0.4846 mmol/gprot, and 6.216 ± 0.3649 mmol/gprot and 7.000 ± 0.4559 mmol/gprot, respectively. HDL-C increased to 4.725 ± 0.1903 mmol/gprot and 4.113 ± 0.1856 mmol/gprot. In summary, AGEs successfully correlated glucose metabolism with lipid metabolism and constructed a new cell model of glucose and lipid metabolism disorders. PEP-1-1 showed certain hypolipidemic activity in this model, which has potential development and utilization value.

3. Materials and Methods

3.1. Materials

Phyllanthus emblica fruits were sourced from Anqing, Anhui, China. Cellulose DEAE-52 was purchased from Solarbio Biochemical Co., Ltd. (Beijing, China). Amberlite FPA90 and Amberlite FPC3500 were purchased from Macklin (Shanghai, China). Penicillin-Streptomycin Solution was purchased from Beyotime (Shanghai, China). Detection kits for TC, TG, HDL-C, and LDL-C were purchased from Nanjing Jiancheng Biology Engineering Institute (Nanjing, China). All other chemical reagents were of analytical grade or chromatographic grade.

3.2. Extraction, Isolation, and Purification of Polysaccharides from Phyllanthus emblica

The preparation and purification of Phyllanthus emblica polysaccharides (PEPs) were carried out by ultrasound extraction and alcohol precipitation methods with some modifications [58]. First, we took about 100 g of dry powder of Phyllanthus emblica fruits and added it to distilled water at the solid–liquid ratio of 1:30 (w/v). Then, we placed the flask in an ultrasonic bath with a power setting of 100 W and a temperature of 60 °C for 6 h to obtain crude extract of Phyllanthus emblica. After filtration and concentration, Sevag reagent was added for deproteination. We added three times the volume of 95% ethanol to the aqueous extract for precipitation and left it overnight at 4 °C, allowing polysaccharides from Phyllanthus emblica to precipitate at the bottom of the solution. Finally, the redissolution of the precipitates was followed by dialysis using distilled water to yield a crude polysaccharide (cPEP) fraction after lyophilization.
About 10 g of cPEP was dissolved and centrifuged before loading onto an Amberlite FPA90Cl column connected in series with an Amberlite FPC3500H column. The columns were subjected to elution using a gradient of NaCl solutions (0, 0.5, and 1 M) at a flow rate of 10 mL/min, leading to the collection of three fractions (PEP-1, PEP-2, and PEP-3). The primary fraction (PEP-1) underwent further purification by being loaded onto a DEAE-52 column with gradient elution using a NaCl solution (0–0.5 M) at a flow rate of 0.6 mL/min. Each eluate was collected and analyzed using the phenol–sulfuric acid method at 490 nm. The main purified fraction of PEP-1 was collected and lyophilized after the dialysis of the eluate (Mw = 3500 kDa) and named PEP-1-1.

3.3. Homogeneity and Molecular Weight (Mw)

By using a gel chromatograph (GPC), the homogeneity and Mw of PEP-1-1 were assessed [59]. The TSKgel G5000PWXL column (7.8 × 300 mm, 13 μm, Tosoh, Tokyo, Japan) was used on a Shimadzu LC-6A series apparatus equipped with a differential refractive index detector (Shimadzu, Kyoto, Japan) to measure the homogeneity and Mw of PEP-1-1. The mobile phase was ultrapure water flowing at 25 °C at 1 mL/min. An aqueous solution of the sample (PEP-1-1) was prepared and passed through a 0.22 μm membrane filter before being applied to the HPSEC system. Standard curves were prepared using dextran standards with different Mws.

3.4. Chemical Composition Analysis

The content of total sugar, protein, and uronic acid was measured using the phenol–sulfuric acid colorimetric method [60], Bradford method [61], and carbazole colorimetric method [62]. d-glucose, bovine serum albumin, and d-glucuronic acid were used as the standards, respectively.

3.5. Structural Characteristics of PEP-1-1

3.5.1. Determination of Particle Size and ζ-Potential

A Malvern NanoZS90 laser particle size analytical instrument (Malvern, Malvern, UK) was used to investigate the particle size and ζ-potential of PEP-1-1. The particle size and ζ-potential measurements for PEP-1-1 were conducted three times in this segment to ensure accuracy and reliability.

3.5.2. Monosaccharide Composition Assay

The monosaccharide composition analysis of PEP-1-1 involved the use of PMP pre-column derivatization and HPLC analysis [63]. Concisely, 10 mg of PEP-1-1 was hydrolyzed with trifluoroacetic acid (TFA) at 120 °C for 4 h. After removing the residual TFA with methanol under a reduced pressure, 200 μL of PMP and 200 μL of NaOH were added to derivatize at 70 °C for 1 h. Then, HCl was used to termination. The derivatized product was analyzed by HPLC equipped with UV detection(Agilent, Santa Clara, CA, USA) at 245 nm, eluted with KH2PO4-K2HPO4 (0.1 M, pH = 6.86) containing 18.5% acetonitrile at a flow rate of 1.0 mL/min. The monosaccharide standards were processed and analyzed as above.

3.5.3. UV and FT-IR Analysis

The ultraviolet absorption spectrum of PEP-1-1 at the wavelength ranging from 200 nm to 400 nm was investigated using a UV-2550 spectrophotometer (Shimadzu, Kyoto, Japan). Then, a dried PEP-1-1 tablet mixed with an appropriate amount of KBr was analyzed using an FT-IR 650 spectrometer (Shimadzu, Kyoto, Japan) with a scanning range of 4000 to 400 cm−1.

3.5.4. Surface Enhanced Raman Spectroscopy (SERS) Analysis

WITecalpha300R confocal Raman microscope (Witec, Ulm, Germany) was used to analyze PEP-1-1. In short, 1 mg/mL of PEP-1-1 solutions was prepared, and 2 μL of it was dropped onto silver plates with a power of 20 mw and a scanning time of 20 s for analysis.

3.5.5. Methylation and GC-MS Analysis

The methylation analysis of PEP-1-1 was conducted according to the previously described method [64]. Briefly, 10 mg of PEP-1-1 was dissolved in 6 mL of DMSO and then reacted with 120 mg of dried NaOH powder and 0.9 mL of CHI3 under an argon gas atmosphere. Following the reaction, water was employed to halt the methylation process, and the methylated products were subsequently extracted three times using chloroform. The dried methylated reaction products were sequentially subjected to hydrolysis using 2 mol/L of trifluoroacetic acid (TFA). The resulting hydrolysate underwent reduction with NaBH4, followed by neutralization with acetic acid and acetylation with acetic anhydride. Ultimately, the analysis of partially methylated alditol acetates (PMAAs) was conducted using a 7890A-5975C GC-MS (Agilent, Santa Clara, CA, USA).

3.5.6. NMR Analysis

PEP-1-1 powder was dissolved in deuterated water (D2O), followed by obtaining 1H-NMR, 13C-NMR, and 2D NMR spectra, including, HSQC, HMBC, and 1H-1H COSY, using a 600 MHz AV NEO NMR spectrometer equipped with a cryogenic probe (Brucker, Karlsruhe, Germany).

3.5.7. Congo Red Test

The Congo red test was used to investigate whether PEP-1-1 possessed a triple helical structure [65]. After mixing 1 mL of a 1 mg/mL PEP-1-1 solution with 1 mL of a 200 mmol/L Congo red solution, the resulting mixture was added to varying gradients of NaOH solution. The solution mixture was examined across the 200–800 nm spectrum to pinpoint the wavelength at which maximum absorption occurred.

3.5.8. Scanning Electron Microscopy (SEM) Analysis

The polysaccharide powder was coated with conductive gold before being examined using a scanning electron microscope system at magnifications of 500× and 1000× with a working voltage of 5.0 kV.

3.6. Antioxidant Effects of PEP-1-1 In Vitro

3.6.1. Determination of Scavenging Capacity of Hydroxyl Radicals

The hydroxyl radical scavenging capacity of PEP-1-1 was determined using Lin’s method [66]. The test tube was supplied with 1 mL of PEP-1-1 at different concentrations. Then, 1 mL of FeSO4, 1 mL of salicylic acid–ethanol solution, and 1 mL of H2O2 solution were added and mixed. Following an incubation period of 30 min at 37 °C, the absorbance of the mixture was measured at 510 nm. Vc served as the positive control.

3.6.2. Determination of Scavenging Capacity of Superoxide Anion Radicals

The superoxide anion radical scavenging capacity of PEP-1-1 was determined using Chen’s method [30]. At various concentrations, 1 mL of PEP-1-1 was introduced into a test tube along with a mixture of 3.9 mL of ultrapure water and 4.5 mL of 50 mmol/L Tris-HCl buffer (pH = 8.2). The combination was allowed to incubate at 25 °C for 20 min. Subsequently, 0.5 mL of 50 mmol/L pyrogallic acid was introduced to the solution, and after thorough shaking, absorbance readings were recorded at 325 nm for each group.

3.6.3. Determination of Scavenging Capacity of ABTS Radicals

The ABTS radical scavenging capacity of PEP-1-1 was determined using Li’s method [67]. The prepared ABTS+ solution was diluted to the absorbance of 0.70 ± 0.02 at 734 nm. An amount of 1 mL of PEP-1-1 was mixed well in the test tube at different concentrations with 6 mL of ABTS+ solution. The absorbance of the mixture was recorded at 734 nm following a 10 min reaction at 25 °C.
All three radical scavenging rates were determined using the following equation:
Scavenging activity (%) = [1 − (A1 − A2)/A0] × 100%
where
  • A0: Absorption of samples replaced by ultrapure water;
  • A1: Absorption of sample groups;
  • A2: Absorption of sample groups’ background.

3.7. Hypolipidemic Activity and Anti-Glycolipid Metabolism Disorder Activity of PEP-1-1

3.7.1. Preparation of AGEs

The experiments were conducted following the methodology outlined in our earlier study [68]. Briefly, BSA, glucose, and sodium azide were combined in a phosphate buffer, and the resulting mixture underwent a 3-month incubation period at 37 °C. Glycosylation product fluorescence was measured at a 370 nm excitation wavelength and a 440 nm emission wavelength after being diluted to 10 mL with ultrapure water.

3.7.2. Cell Culture

HepG2 cells were provided by the Department of Pharmacology in Harbin Medical University and grown in DMEM high-glucose medium containing 10% FBS (fetal bovine serum). Cell cultures were kept in an incubator at 37 °C with a gas mixture of 5% carbon dioxide and 95% air. Passage of cells at 80–90% confluence was performed using 0.5% trypsin.

3.7.3. Cell Viability Assay

HepG2 cells were plated on a 96-well plate at a density of 1 × 10³ cells per well and allowed to adhere for 24 h before being exposed to PEP-1-1 treatment. After 48 h, each well received an addition of 10 μL of CCK-8, followed by incubation at 37 °C for 4 h, and the absorbance was measured at 450 nm. Cell viability was quantified as the percentage change in absorbance values compared to the negative control (NC) group within the treatment group.

3.7.4. Effect of PEP-1-1 on Lipid Content in High-Fat HepG2 Cell Model Induced by OA

We took HepG2 cells in good condition, added trypsin digestion solution to digest the cells, counted and adjusted the cell density to 1 × 10⁶/mL, inoculated 12 mL in a 24-well plate, and divided them into an NC group, model group, lovastatin-positive control group, and PEP-1-1 treatment group; each group was set to 3 wells. After culturing for 12 h in the dark, we removed the old culture medium, and then the NC control group was added with 500 µL of medium, the model group and the positive control group were treated with 500 µL of 0.5 mM oleic acid modeling solution and 20 µM lovastatin, and 1.0 mg/mL of PEP-1-1 was added to the treatment group. They continued to incubate for 48 h in the incubator. We determined the contents of TC, TG, HDL-C, LDL-C, and protein in each well sample according to the method shown in the kit instructions.

3.7.5. Effect of PEP-1-1 on Lipid Content in High-Fat HepG2 Cell Model Induced by AGEs

As described above, HepG2 cells were digested and seeded in a 24-well plate and then incubated for 12 h until the cell density reached 80–90%, and then we divided them into an NC group, BSA group, AGE group, lovastatin-positive control group, and PEP-1-1 treatment group; each group was set to 3 wells. An amount of 1.0 mg/mL of AGEs was used to induce HepG2 cells to form a high-fat model. The treatment group added 500 µL of 1.0 mg/mL of PEP-1-1 to process the cells. The experiment utilized 20 μM of lovastatin as the positive control, the medium was used instead of AGEs in the NC group, and the BSA group was set up to eliminate potential interference from BSA. After 48 h of incubation, the contents of TC, TG, LDL, HDL, and protein were measured using the method shown in the kits.

3.8. Statistical Analysis

Experimental data were presented as mean ± standard deviation (mean ± SD), and statistical analysis was performed using GraphPad Prism 7 software. The experimental results between the groups were compared using the t test method, and the difference was recorded; p < 0.05 was deemed statistically significant.

4. Conclusions

In this study, a purified polysaccharide of Phyllanthus emblica named PEP-1-1 was obtained. In addition to analyzing its chemical structure, its anti-glycolipid metabolism disorder ability was studied for the first time. PEP-1-1 is a heteropolysaccharide with little uronic acid. The particle size and ζ-potential of PEP-1-1 are 1093 nm and −4.22 mV, respectively. The monosaccharide composed Gal, Ara, Glu, and Man with a molar ratio of 52.61:32.89:12.08:1.50. PEP-1-1 has a molecular mass of 29.26 kDa, and its backbone is mainly composed of -3)-β-d-Galp-(1-,-5)-α-l-Araf(3)(1- and -5)-α-l-Araf(1-residues. The lateral chains are attached to the primary chain via the O-1 and O-3 atoms of arabinose. A Congo red test confirmed that PEP-1-1 does not have a triple helical structure. The results show that PEP-1-1 had a strong effect on decreasing the TC, TG, and LDL-C levels and increasing the HDL-C level in OA-induced high-fat HepG2 cells. In addition, PEP-1-1 also showed a good effect in antioxidant activity in vitro. We designed a high-fat HepG2 cell model induced by AGEs to comprehensively evaluate the anti-glycolipid metabolism disorder activity of PEP-1-1. With the intervention of PEP-1-1, the TC, TG, and LDL-C levels decreased, and the HDL-C level increased in AGE-induced high-fat HepG2 cells, also indicating that PEP-1-1 has excellent potential to be developed as an anti-glycolipid metabolism disorder drug.
In summary, considering the financial costs and based on the aforementioned points, we believe that PEP-1-1 has the potential to serve as a drug candidate for treating glycolipid metabolic disorders and be used as a nutritional regulator and food additive. This provides a theoretical basis for the further development and utilization of Phyllanthus emblica.

Supplementary Materials

The following supporting information can be downloaded at: https://www.mdpi.com/article/10.3390/molecules29081751/s1, Figure S1: Flow chart of Phyllanthus emblica polysaccharide extraction, separation, and purification of PEP (A); elution curve of PEP-1 on DEAE-52 column (B); the HPSEC chromatogram of PEP-1-1 (C); the UV chromatogram of PEP-1-1 (D); Table S1: The yield and productivity of purified products; Figure S2: FT-IR spectrum of PEP-1-1; Figure S3: Congo red test experimental results of PEP-1-1; Figure S4: Scanning electron micrographs of PEP-1-1 at magnification of 500× (A), (B) and 1000× (C); Figure S5: Effects of PEP-1-1 on the cell viability; Table S2: Linkage patterns analysis of PEP-1-1.

Author Contributions

P.G.: Writing—Reviewing and Editing, Formal Analysis, and Methodology; M.C.: Writing—Original Draft Preparation and Investigation; W.W.: Software; Q.L.: Validation; X.C.: Data Curation; J.L.: Project Administration; Y.H.: Project Administration; Y.W.: Conceptualization, Methodology, and Resources. All authors have read and agreed to the published version of the manuscript.

Funding

This study was supported by the National Natural Science Foundation of China (81403072), the Natural Science Foundation of Heilongjiang Province (LH2020H022), the Postdoctoral Research Fund of Heilongjiang Province (LBH-Q19150), and the Harbin Medical University School of Pharmacy Excellent Young Talents Fund (2019-YQ-11).

Institutional Review Board Statement

Not applicable.

Informed Consent Statement

Not applicable.

Data Availability Statement

The raw data involved in the study can be queried from the corresponding author.

Conflicts of Interest

The authors declare no conflicts of interest.

References

  1. Sheng-Shou, H. Report on cardiovascular health and diseases in china 2021: An updated summary. J. Geriatr. Cardiol. 2023, 20, 573–603. [Google Scholar]
  2. Townsend, N.; Kazakiewicz, D.; Lucy Wright, F.; Timmis, A.; Huculeci, R.; Torbica, A.; Gale, C.P.; Achenbach, S.; Weidinger, F.; Vardas, P. Epidemiology of cardiovascular disease in Europe. Nat. Rev. Cardiol. 2022, 19, 133–143. [Google Scholar] [CrossRef] [PubMed]
  3. Kaminsky, L.A.; German, C.; Imboden, M.; Ozemek, C.; Peterman, J.E.; Brubaker, P.H. The importance of healthy lifestyle behaviors in the prevention of cardiovascular disease. Prog. Cardiovasc. Dis. 2022, 70, 8–15. [Google Scholar] [CrossRef]
  4. Hamedi, A.; Sakhteman, A.; Moheimani, S.M. An in silico approach towards investigation of possible effects of essential oils constituents on receptors involved in cardiovascular diseases (CVD) and associated risk factors (Diabetes Mellitus and Hyperlipidemia). Cardiovasc. Hematol. Agents Med. Chem. (Former. Curr. Med. Chem.-Cardiovasc. Hematol. Agents) 2021, 19, 32–42. [Google Scholar] [CrossRef] [PubMed]
  5. O’Neill, B.J. Effect of low-carbohydrate diets on cardiometabolic risk, insulin resistance, and metabolic syndrome. Curr. Opin. Endocrinol. Diabetes Obes. 2020, 27, 301–307. [Google Scholar] [CrossRef]
  6. Zhou, Y.-J.; Xu, N.; Zhang, X.-C.; Zhu, Y.-Y.; Liu, S.-W.; Chang, Y.-N. Chrysin improves glucose and lipid metabolism disorders by regulating the AMPK/PI3K/AKT signaling pathway in insulin-resistant HepG2 cells and HFD/STZ-induced C57BL/6J mice. J. Agric. Food Chem. 2021, 69, 5618–5627. [Google Scholar] [CrossRef] [PubMed]
  7. Guo, X.; Yin, X.; Liu, Z.; Wang, J. Non-alcoholic fatty liver disease (NAFLD) pathogenesis and natural products for prevention and treatment. Int. J. Mol. Sci. 2022, 23, 15489. [Google Scholar] [CrossRef] [PubMed]
  8. Zhang, R.; Jiang, L.; Li, G.; Wu, J.; Tian, P.; Zhang, D.; Qin, Y.; Shi, Z.; Gao, Z.; Zhang, N. Advanced Glycosylation End Products Induced Synaptic Deficits and Cognitive Decline Through ROS-JNK-p53/miR-34c/SYT1 Axis in Diabetic Encephalopathy. J. Alzheimer’s Dis. 2022, 87, 843–861. [Google Scholar] [CrossRef] [PubMed]
  9. Huo, S.; Wang, Q.; Shi, W.; Peng, L.; Jiang, Y.; Zhu, M.; Guo, J.; Peng, D.; Wang, M.; Men, L. ATF3/SPI1/SLC31A1 signaling promotes cuproptosis induced by advanced glycosylation end products in diabetic myocardial injury. Int. J. Mol. Sci. 2023, 24, 1667. [Google Scholar] [CrossRef] [PubMed]
  10. Mengstie, M.A.; Chekol Abebe, E.; Behaile Teklemariam, A.; Tilahun Mulu, A.; Agidew, M.M.; Teshome Azezew, M.; Zewde, E.A.; Agegnehu Teshome, A. Endogenous advanced glycation end products in the pathogenesis of chronic diabetic complications. Front. Mol. Biosci. 2022, 9, 1002710. [Google Scholar] [CrossRef]
  11. Abdul-Rahman, T.; Bukhari, S.M.A.; Herrera, E.C.; Awuah, W.A.; Lawrence, J.; de Andrade, H.; Patel, N.; Shah, R.; Shaikh, R.; Capriles, C.A.A. Lipid lowering therapy: An era beyond statins. Curr. Probl. Cardiol. 2022, 47, 101342. [Google Scholar] [CrossRef]
  12. Sirtori, C.R. The pharmacology of statins. Pharmacol. Res. 2014, 88, 3–11. [Google Scholar] [CrossRef] [PubMed]
  13. Agrawal, N.; Sharma, M.; Singh, S.; Goyal, A. Recent advances of α-glucosidase inhibitors: A comprehensive review. Curr. Top. Med. Chem. 2022, 22, 2069–2086. [Google Scholar] [CrossRef] [PubMed]
  14. Triggle, C.R.; Mohammed, I.; Bshesh, K.; Marei, I.; Ye, K.; Ding, H.; MacDonald, R.; Hollenberg, M.D.; Hill, M.A. Metformin: Is it a drug for all reasons and diseases? Metabolism 2022, 133, 155223. [Google Scholar] [CrossRef] [PubMed]
  15. Ward, N.C.; Watts, G.F.; Eckel, R.H. Statin toxicity: Mechanistic insights and clinical implications. Circ. Res. 2019, 124, 328–350. [Google Scholar] [CrossRef] [PubMed]
  16. Kores, K.; Konc, J.; Bren, U. Mechanistic insights into side effects of troglitazone and rosiglitazone using a novel inverse molecular docking protocol. Pharmaceutics 2021, 13, 315. [Google Scholar] [CrossRef] [PubMed]
  17. Silva, M.L.; Bernardo, M.A.; Singh, J.; de Mesquita, M.F. Cinnamon as a complementary therapeutic approach for dysglycemia and dyslipidemia control in type 2 diabetes mellitus and its molecular mechanism of action: A review. Nutrients 2022, 14, 2773. [Google Scholar] [CrossRef] [PubMed]
  18. Li, G.; Yu, Q.; Zhang, D.-K.; Li, M.; Yu, J.; Yu, X.; Xia, C.; Lin, J.-Z.; Han, L.; Huang, H.-Z. Phyllanthus emblica fruits: A polyphenol-rich fruit with potential benefits for oral management. Food Funct. 2023, 14, 7738–7759. [Google Scholar] [CrossRef] [PubMed]
  19. Wu, M.; Liu, M.; Wang, F.; Cai, J.; Luo, Q.; Li, S.; Zhu, J.; Tang, Z.; Fang, Z.; Wang, C. The inhibition mechanism of polyphenols from Phyllanthus emblica Linn. fruit on acetylcholinesterase: A interaction, kinetic, spectroscopic, and molecular simulation study. Food Res. Int. 2022, 158, 111497. [Google Scholar] [CrossRef]
  20. Jaisamut, P.; Tohlang, C.; Wanna, S.; Thanakun, A.; Srisuwan, T.; Limsuwan, S.; Rattanachai, W.; Suwannachot, J.; Chusri, S. Clinical Evaluation of a Novel Tablet Formulation of Traditional Thai Polyherbal Medicine Named Nawametho in Comparison with Its Decoction in the Treatment of Hyperlipidemia. Evid.-Based Complement. Altern. Med. 2022, 2022, 2530266. [Google Scholar] [CrossRef]
  21. Saini, R.; Sharma, N.; Oladeji, O.S.; Sourirajan, A.; Dev, K.; Zengin, G.; El-Shazly, M.; Kumar, V. Traditional uses, bioactive composition, pharmacology, and toxicology of Phyllanthus emblica fruits: A comprehensive review. J. Ethnopharmacol. 2022, 282, 114570. [Google Scholar] [CrossRef] [PubMed]
  22. Mahata, S.; Pandey, A.; Shukla, S.; Tyagi, A.; Husain, S.A.; Das, B.C.; Bharti, A.C. Anticancer activity of Phyllanthus emblica Linn.(Indian gooseberry): Inhibition of transcription factor AP-1 and HPV gene expression in cervical cancer cells. Nutr. Cancer 2013, 65, 88–97. [Google Scholar] [CrossRef] [PubMed]
  23. Ngamkitidechakul, C.; Jaijoy, K.; Hansakul, P.; Soonthornchareonnon, N.; Sireeratawong, S. Antitumour effects of Phyllanthus emblica L.: Induction of cancer cell apoptosis and inhibition of in vivo tumour promotion and in vitro invasion of human cancer cells. Phytother. Res. 2010, 24, 1405–1413. [Google Scholar] [CrossRef] [PubMed]
  24. Panich, S.; Amatatongchai, M. A non-toxic approach to assess total antioxidant capacity (TAC) of exotic tropical fruits from Thailand. J. Food Sci. Technol. 2019, 56, 3547–3552. [Google Scholar] [CrossRef] [PubMed]
  25. Li, W.; Zhang, X.; Chen, R.; Li, Y.; Miao, J.; Liu, G.; Lan, Y.; Chen, Y.; Cao, Y. HPLC fingerprint analysis of Phyllanthus emblica ethanol extract and their antioxidant and anti-inflammatory properties. J. Ethnopharmacol. 2020, 254, 112740. [Google Scholar] [CrossRef] [PubMed]
  26. Pedro-Botet, J.; Climent, E.; Benaiges, D. Atherosclerosis and inflammation. New therapeutic approaches. Med. Clínica (Engl. Ed.) 2020, 155, 256–262. [Google Scholar] [CrossRef] [PubMed]
  27. Gan, J.; Zhang, X.; Ma, C.; Sun, L.; Feng, Y.; He, Z.; Zhang, H. Purification of polyphenols from Phyllanthus emblica L. pomace using macroporous resins: Antioxidant activity and potential anti-Alzheimer’s effects. J. Food Sci. 2022, 87, 1244–1256. [Google Scholar] [CrossRef] [PubMed]
  28. Li, Y.; Chen, J.; Cao, L.; Li, L.; Wang, F.; Liao, Z.; Chen, J.; Wu, S.; Zhang, L. Characterization of a novel polysaccharide isolated from Phyllanthus emblica L. and analysis of its antioxidant activities. J. Food Sci. Technol. 2018, 55, 2758–2764. [Google Scholar] [CrossRef] [PubMed]
  29. Long, H.; Xia, X.; Liao, S.; Wu, T.; Wang, L.; Chen, Q.; Wei, S.; Gu, X.; Zhu, Z. Physicochemical characterization and antioxidant and hypolipidaemic activities of a polysaccharide from the fruit of Kadsura coccinea (Lem.) AC Smith. Front. Nutr. 2022, 9, 903218. [Google Scholar] [CrossRef]
  30. Chen, F.; Huang, G.; Yang, Z.; Hou, Y. Antioxidant activity of Momordica charantia polysaccharide and its derivatives. Int. J. Biol. Macromol. 2019, 138, 673–680. [Google Scholar] [CrossRef]
  31. Li, F.; Wei, Y.; Liang, L.; Huang, L.; Yu, G.; Li, Q. A novel low-molecular-mass pumpkin polysaccharide: Structural characterization, antioxidant activity, and hypoglycemic potential. Carbohydr. Polym. 2021, 251, 117090. [Google Scholar] [CrossRef] [PubMed]
  32. Li, J.; Wu, H.; Liu, Y.; Nan, J.; Park, H.J.; Chen, Y.; Yang, L. The chemical structure and immunomodulatory activity of an exopolysaccharide produced by Morchella esculenta under submerged fermentation. Food Funct. 2021, 12, 9327–9338. [Google Scholar] [CrossRef] [PubMed]
  33. Özbalci, B.; Boyaci, İ.H.; Topcu, A.; Kadılar, C.; Tamer, U. Rapid analysis of sugars in honey by processing Raman spectrum using chemometric methods and artificial neural networks. Food Chem. 2013, 136, 1444–1452. [Google Scholar] [CrossRef] [PubMed]
  34. Söderholm, S.; Roos, Y.H.; Meinander, N.; Hotokka, M. Raman spectra of fructose and glucose in the amorphous and crystalline states. J. Raman Spectrosc. 1999, 30, 1009–1018. [Google Scholar] [CrossRef]
  35. Tahir, M.; Majeed, M.I.; Nawaz, H.; Ali, S.; Rashid, N.; Kashif, M.; Ashfaq, I.; Ahmad, W.; Ghauri, K.; Sattar, F. Raman spectroscopy for the analysis of different exo-polysaccharides produced by bacteria. Spectrochim. Acta Part A Mol. Biomol. Spectrosc. 2020, 237, 118408. [Google Scholar] [CrossRef] [PubMed]
  36. Synytsya, A.; Čopíková, J.; Matějka, P.; Machovič, V. Fourier transform Raman and infrared spectroscopy of pectins. Carbohydr. Polym. 2003, 54, 97–106. [Google Scholar] [CrossRef]
  37. Vasko, P.; Blackwell, J.; Koenig, J. Infrared and raman spectroscopy of carbohydrates.: Part II: Normal coordinate analysis of α-D-glucose. Carbohydr. Res. 1972, 23, 407–416. [Google Scholar] [CrossRef]
  38. Peng, Q.; Liu, H.; Lei, H.; Wang, X. Relationship between structure and immunological activity of an arabinogalactan from Lycium ruthenicum. Food Chem. 2016, 194, 595–600. [Google Scholar] [CrossRef]
  39. Huang, W.; Zhao, M.; Wang, X.; Tian, Y.; Wang, C.; Sun, J.; Wang, Z.; Gong, G.; Huang, L. Revisiting the structure of arabinogalactan from Lycium barbarum and the impact of its side chain on anti-ageing activity. Carbohydr. Polym. 2022, 286, 119282. [Google Scholar] [CrossRef]
  40. Huang, H.; Yang, X.; Li, W.; Han, Q.; Xu, Z.; Xia, W.; Wu, M.; Zhang, W. Structural characterization and immunomodulatory activity of an arabinogalactan from Jasminum sambac (L.) Aiton tea processing waste. Int. J. Biol. Macromol. 2023, 235, 123816. [Google Scholar] [CrossRef]
  41. Kim, M.; Kim, S.-R.; Park, J.; Mun, S.-H.; Kwak, M.; Ko, H.-J.; Baek, S.-H. Structure and antiviral activity of a pectic polysaccharide from the root of Sanguisorba officinalis against enterovirus 71 in vitro/vivo. Carbohydr. Polym. 2022, 281, 119057. [Google Scholar] [CrossRef] [PubMed]
  42. Golovchenko, V.; Popov, S.; Smirnov, V.; Khlopin, V.; Vityazev, F.; Naranmandakh, S.; Dmitrenok, A.S.; Shashkov, A.S. Polysaccharides of Salsola passerina: Extraction, Structural Characterization and Antioxidant Activity. Int. J. Mol. Sci. 2022, 23, 13175. [Google Scholar] [CrossRef] [PubMed]
  43. Li, Z.; Li, J.; Xu, X.; Luo, Z.; Sun, J.; Wang, H.; Liu, C.; Ni, X.; Sun, J.; Xu, J. Separation and Structural Characterization of a Novel Exopolysaccharide from Rhizopus nigricans. Molecules 2022, 27, 7756. [Google Scholar] [CrossRef] [PubMed]
  44. Liu, M.; Gong, Z.; Liu, H.; Wang, J.; Wang, D.; Yang, Y.; Zhong, S. Structural characterization and anti-tumor activity in vitro of a water-soluble polysaccharide from dark brick tea. Int. J. Biol. Macromol. 2022, 205, 615–625. [Google Scholar] [CrossRef]
  45. Wei, X.; Yao, J.; Wang, F.; Wu, D.; Zhang, R. Extraction, isolation, structural characterization, and antioxidant activity of polysaccharides from elderberry fruit. Front. Nutr. 2022, 9, 947706. [Google Scholar] [CrossRef]
  46. Makarova, E.N.; Shakhmatov, E.G.; Belyy, V.A. Structural studies of water-extractable pectic polysaccharides and arabinogalactan proteins from Picea abies greenery. Carbohydr. Polym. 2018, 195, 207–217. [Google Scholar] [CrossRef] [PubMed]
  47. Zhou, Y.; Wang, S.; Feng, W.; Zhang, Z.; Li, H. Structural characterization and immunomodulatory activities of two polysaccharides from Rehmanniae Radix Praeparata. Int. J. Biol. Macromol. 2021, 186, 385–395. [Google Scholar] [CrossRef] [PubMed]
  48. Guo, X.; Kang, J.; Xu, Z.; Guo, Q.; Zhang, L.; Ning, H.; Cui, S.W. Triple-helix polysaccharides: Formation mechanisms and analytical methods. Carbohydr. Polym. 2021, 262, 117962. [Google Scholar] [CrossRef] [PubMed]
  49. Deng, Y.; Huang, L.; Zhang, C.; Xie, P.; Cheng, J.; Wang, X.; Liu, L. Novel polysaccharide from Chaenomeles speciosa seeds: Structural characterization, α-amylase and α-glucosidase inhibitory activity evaluation. Int. J. Biol. Macromol. 2020, 153, 755–766. [Google Scholar] [CrossRef]
  50. Chen, X.; Zuo, X.; Xu, A.a.; Xu, P.; Wang, Y. Comparative Study on the Physicochemical Characteristics and Antioxidant Activities of Polysaccharides in Different Tea Cultivars. J. Tea Sci. 2022, 42, 806–818. [Google Scholar]
  51. Pu, X.; Ma, X.; Liu, L.; Ren, J.; Li, H.; Li, X.; Yu, S.; Zhang, W.; Fan, W. Structural characterization and antioxidant activity in vitro of polysaccharides from angelica and astragalus. Carbohydr. Polym. 2016, 137, 154–164. [Google Scholar] [CrossRef] [PubMed]
  52. Wang, L.; Liu, H.-M.; Qin, G.-Y. Structure characterization and antioxidant activity of polysaccharides from Chinese quince seed meal. Food Chem. 2017, 234, 314–322. [Google Scholar] [CrossRef] [PubMed]
  53. Luo, M.; Zheng, Y.; Tang, S.; Gu, L.; Zhu, Y.; Ying, R.; Liu, Y.; Ma, J.; Guo, R.; Gao, P. Radical oxygen species: An important breakthrough point for botanical drugs to regulate oxidative stress and treat the disorder of glycolipid metabolism. Front. Pharmacol. 2023, 14, 1166178. [Google Scholar] [CrossRef] [PubMed]
  54. Lipinski, B. Hydroxyl radical and its scavengers in health and disease. Oxidative Med. Cell. Longev. 2011, 2011, 809696. [Google Scholar] [CrossRef] [PubMed]
  55. Olech, M.; Nowacka-Jechalke, N.; Masłyk, M.; Martyna, A.; Pietrzak, W.; Kubiński, K.; Załuski, D.; Nowak, R. Polysaccharide-rich fractions from Rosa rugosa Thunb.—Composition and chemopreventive potential. Molecules 2019, 24, 1354. [Google Scholar] [CrossRef] [PubMed]
  56. Nowotny, K.; Jung, T.; Höhn, A.; Weber, D.; Grune, T. Advanced glycation end products and oxidative stress in type 2 diabetes mellitus. Biomolecules 2015, 5, 194–222. [Google Scholar] [CrossRef]
  57. Kuzan, A. Toxicity of advanced glycation end products. Biomed. Rep. 2021, 14, 46. [Google Scholar] [CrossRef] [PubMed]
  58. Zhang, Z.; Xing, N.; Peng, D.; Wang, Q.; Kuang, H. Study on Isolation, Purification and in vitro Antioxidant Activity of the Polysaccharides from Cucumis satiuus. China Pharm. 2021, 32, 432–438. [Google Scholar]
  59. Tian, W.; Dai, L.; Lu, S.; Luo, Z.; Qiu, Z.; Li, J.; Li, P.; Du, B. Effect of Bacillus sp. DU-106 fermentation on Dendrobium officinale polysaccharide: Structure and immunoregulatory activities. Int. J. Biol. Macromol. 2019, 135, 1034–1042. [Google Scholar] [CrossRef]
  60. DuBois, M.; Gilles, K.A.; Hamilton, J.K.; Rebers, P.t.; Smith, F. Colorimetric method for determination of sugars and related substances. Anal. Chem. 1956, 28, 350–356. [Google Scholar] [CrossRef]
  61. Bradford, M.M. A rapid and sensitive method for the quantitation of microgram quantities of protein utilizing the principle of protein-dye binding. Anal. Biochem. 1976, 72, 248–254. [Google Scholar] [CrossRef] [PubMed]
  62. Filisetti-Cozzi, T.M.; Carpita, N.C. Measurement of uronic acids without interference from neutral sugars. Anal. Biochem. 1991, 197, 157–162. [Google Scholar] [CrossRef] [PubMed]
  63. Pan, Q.; Sun, Y.; Li, X.; Zeng, B.; Chen, D. Extraction, structural characterization, and antioxidant and immunomodulatory activities of a polysaccharide from Notarchus leachii freeri eggs. Bioorg. Chem. 2021, 116, 105275. [Google Scholar] [CrossRef] [PubMed]
  64. Yu, S.; Dong, X.; Ma, R.; Ji, H.; Yu, J.; Liu, A. Characterization of a polysaccharide from Polygala tenuifolia willd. with immune activity via activation MAPKs pathway. Bioorg. Chem. 2023, 130, 106214. [Google Scholar] [CrossRef] [PubMed]
  65. Zheng, Q.; Jia, R.-B.; Ou, Z.-R.; Li, Z.-R.; Zhao, M.; Luo, D.; Lin, L. Comparative study on the structural characterization and α-glucosidase inhibitory activity of polysaccharide fractions extracted from Sargassum fusiforme at different pH conditions. Int. J. Biol. Macromol. 2022, 194, 602–610. [Google Scholar] [CrossRef] [PubMed]
  66. Lin, T.-Y.; Wu, Y.-T.; Chang, H.-J.; Huang, C.-C.; Cheng, K.-C.; Hsu, H.-Y.; Hsieh, C.-W. Anti-Inflammatory and Anti-Oxidative Effects of Polysaccharides Extracted from Unripe Carica papaya L. Fruit. Antioxidants 2023, 12, 1506. [Google Scholar] [CrossRef] [PubMed]
  67. Li, G.; Chen, P.; Zhao, Y.; Zeng, Q.; Ou, S.; Zhang, Y.; Wang, P.; Chen, N.; Ou, J. Isolation, structural characterization and anti-oxidant activity of a novel polysaccharide from garlic bolt. Carbohydr. Polym. 2021, 267, 118194. [Google Scholar] [CrossRef] [PubMed]
  68. Wang, X.; Zhang, L.-S.; Dong, L.-L. Inhibitory effect of polysaccharides from pumpkin on advanced glycation end-products formation and aldose reductase activity. Food Chem. 2012, 130, 821–825. [Google Scholar] [CrossRef]
Figure 1. HPLC analysis of standard monosaccharides (A) and PEP-1-1 (B).
Molecules 29 01751 g001
Figure 2. Surface-enhanced Raman spectroscopy spectrum of PEP-1-1.
Molecules 29 01751 g002
Figure 3. Nuclear magnetic resonance analysis of PEP-1-1. 1H-NMR spectrum (A), 13C-NMR spectrum (B), 1H-1H COSY spectrum (C), HSQC spectrum (D), and HMBC spectrum (E).
Molecules 29 01751 g003
Figure 4. Primary chemical structure of PEP-1-1.
Molecules 29 01751 g004
Figure 5. The antioxidant activities of PEP-1-1. Hydroxyl radical scavenging activity (A), superoxide anion radical scavenging activity (B), and ABTS scavenging activity (C).
Molecules 29 01751 g005
Figure 6. Effects of PEP-1-1 on contents of TC (A), TG (B), HDL-C (C), and LDL-C (D) in high-fat HepG2 cell model induced by OA; values shown as mean ± SD. (n = 3, # indicates p < 0.05 vs. NC group; ## indicates p < 0.01 vs. NC group; ### indicates p < 0.001 vs. NC group; * indicates p < 0.05 vs. model group; ** indicates p < 0.01 vs. model group).
Molecules 29 01751 g006
Figure 7. Effects of PEP-1-1 on contents of TC (A), TG (B), HDL-C (C), and LDL-C (D) in high-fat HepG2 cell model induced by AGEs; values are shown as mean ± SD. (n = 3, ## indicates p < 0.01 vs. NC group; ### indicates p < 0.001 vs. NC group; * indicates p < 0.05 vs. model group; ** indicates p < 0.01 vs. model group).
Molecules 29 01751 g007
Table 1. The chemical composition and molecular properties of PEP-1-1.
PolysaccharideChemical CompositionMolecular Properties
Total SugarProteinUronic AcidParticle Sizeζ-Potential
PEP-1-191.23%0.35%6.22%1093 nm−4.22 mV
Table 2. Chemical shifts of main residues of PEP-1-1.
CodeResiduesChemical Shifts (ppm)
H1/C1H2/C2H3/C3H4/C4H5/C5H6/C6
AT-α-l-Araf-(1-5.03/107.314.07/81.033.96/76.344.15/82.073.75/60.99
B-5-α-l-Araf-(1-5.17/106.354.24/81.343.89/76.683.98/83.833.54/72.04
C-3,5)-α-l-Araf-(1-5.10/106.904.22/79.104.03/82.064.24/84.273.82/69.26
D-3-β-d-Galp-(1-4.60/104.503.62/71.724.12/77.503.75/71.503.72/73.213.65/60.68
Disclaimer/Publisher’s Note: The statements, opinions and data contained in all publications are solely those of the individual author(s) and contributor(s) and not of MDPI and/or the editor(s). MDPI and/or the editor(s) disclaim responsibility for any injury to people or property resulting from any ideas, methods, instructions or products referred to in the content.

