
Onosma bracteatum Wall Aqueous–Ethanolic Extract Suppresses Complete Freund’s Adjuvant-Induced Arthritis in Rats via Regulation of TNF-α, IL-6, and C-Reactive Protein
 ,
,  ,
,  and
and 
Abstract
: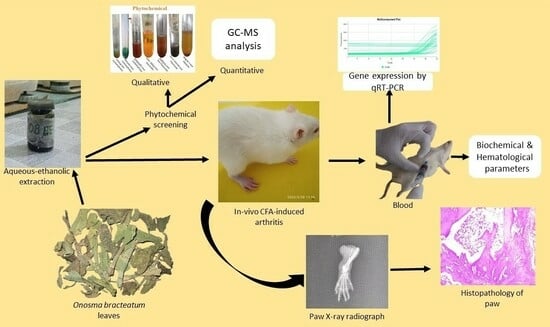
1. Introduction
2. Results
2.1. Percentage Yield
2.2. Phytochemical Analysis
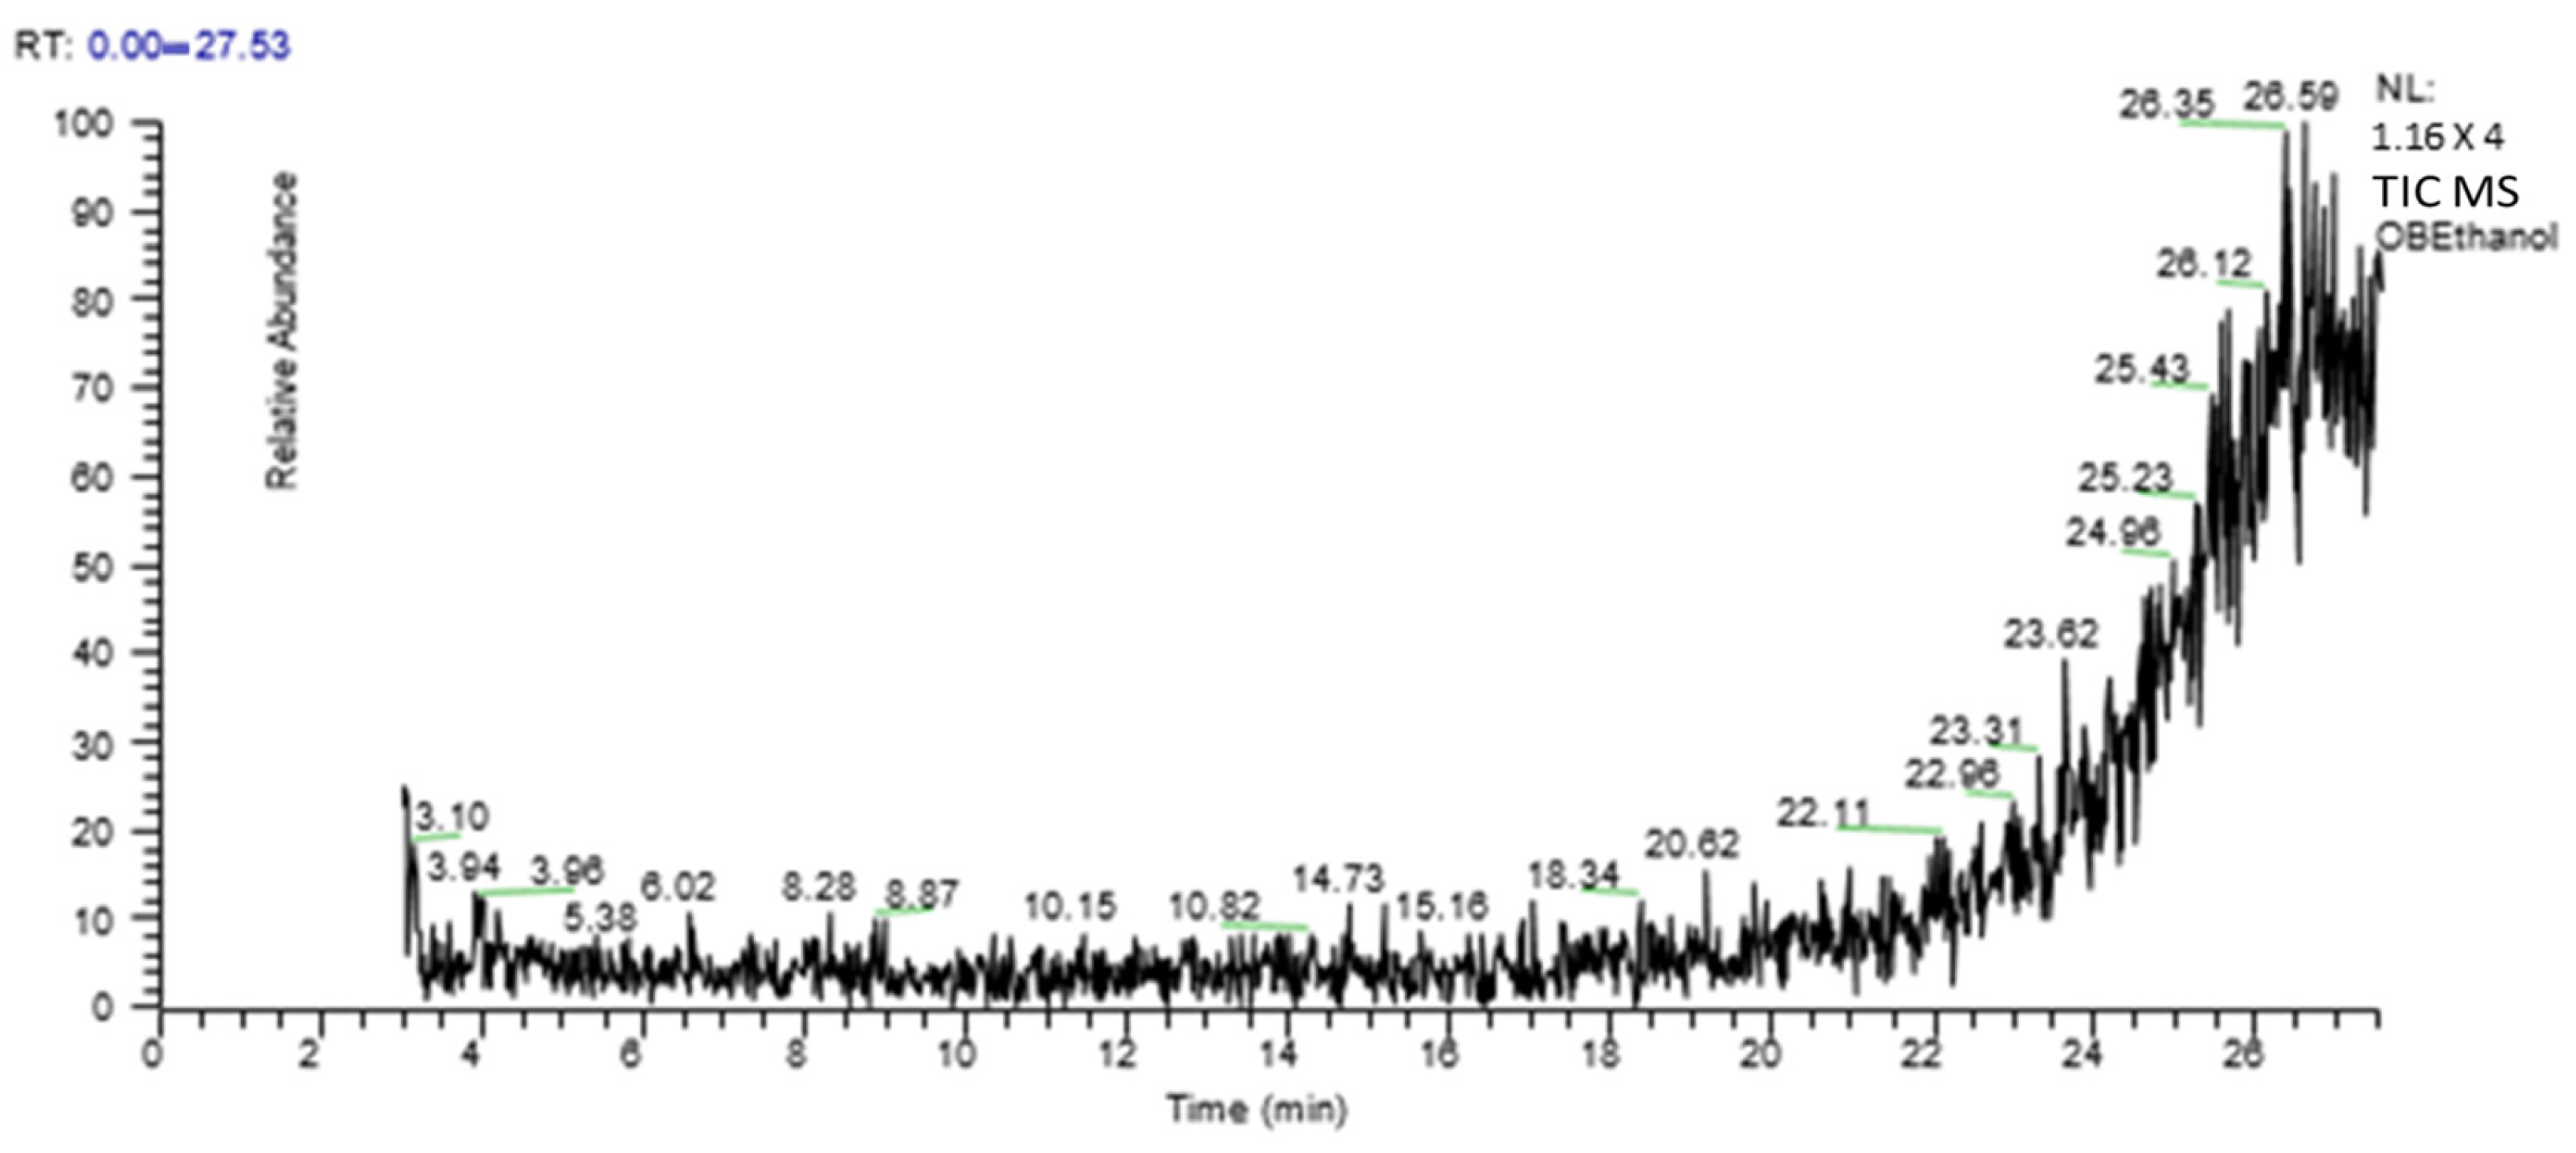
2.3. Gas Chromatography–Mass Spectrometry (GC-MS) Analysis
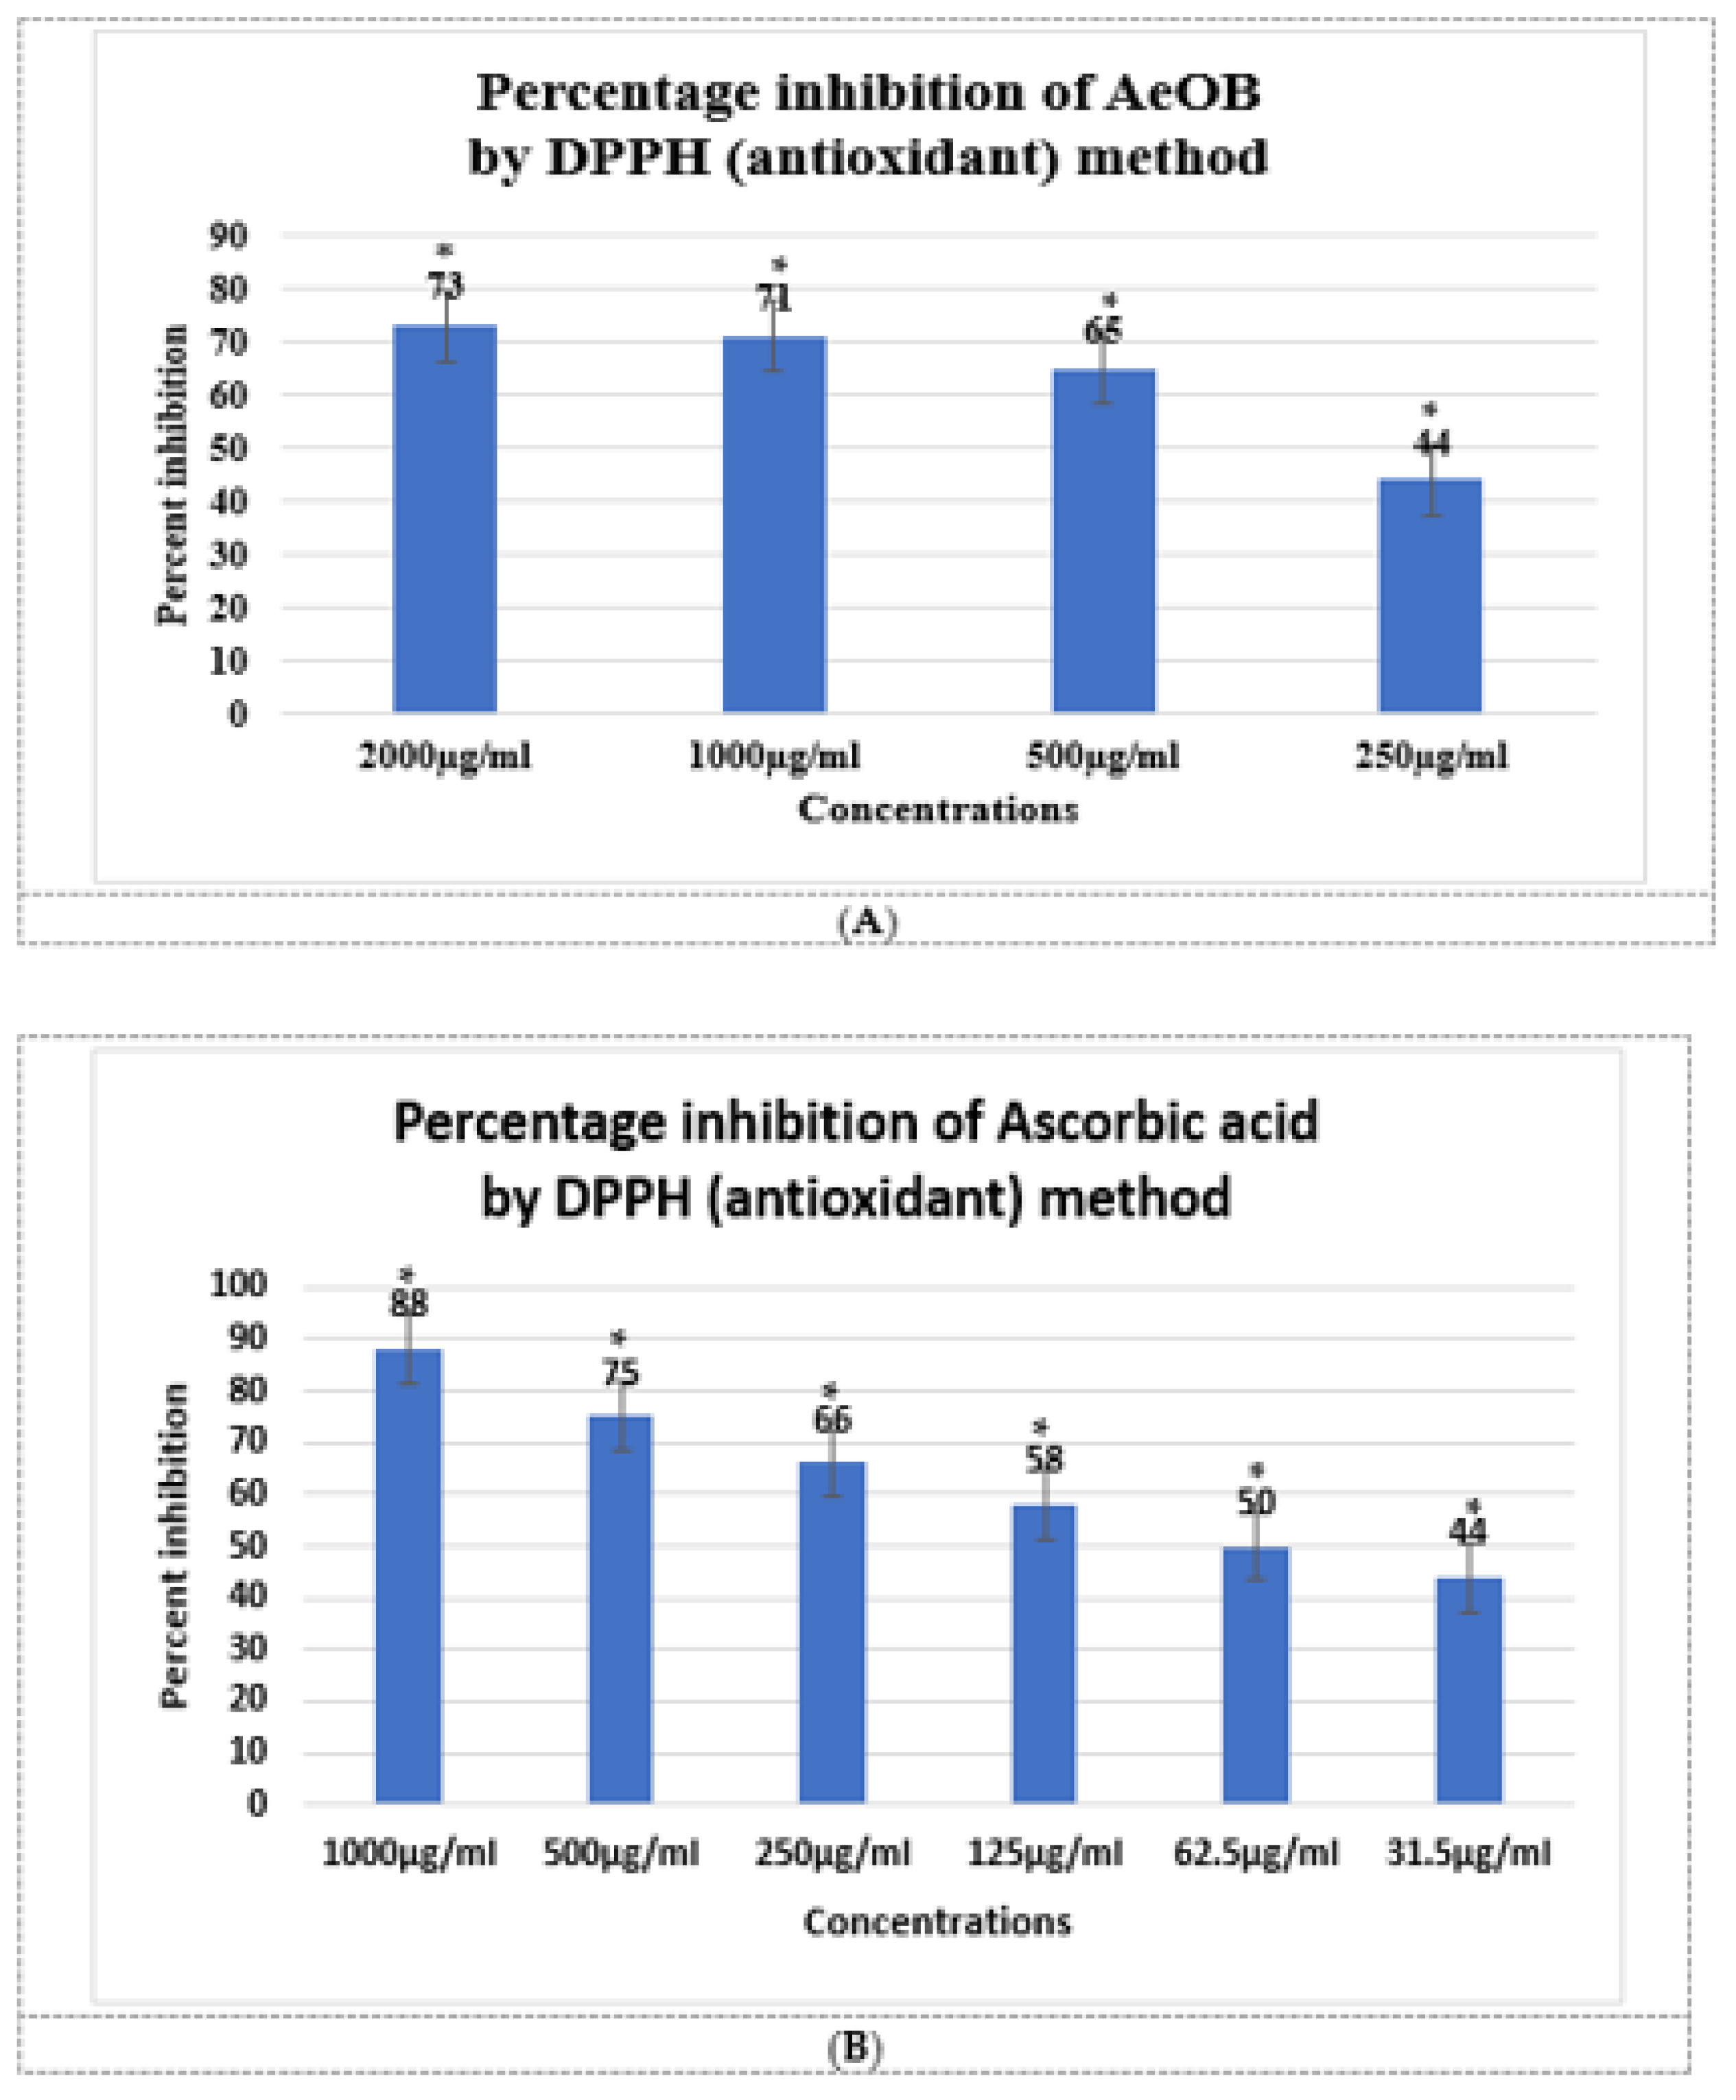
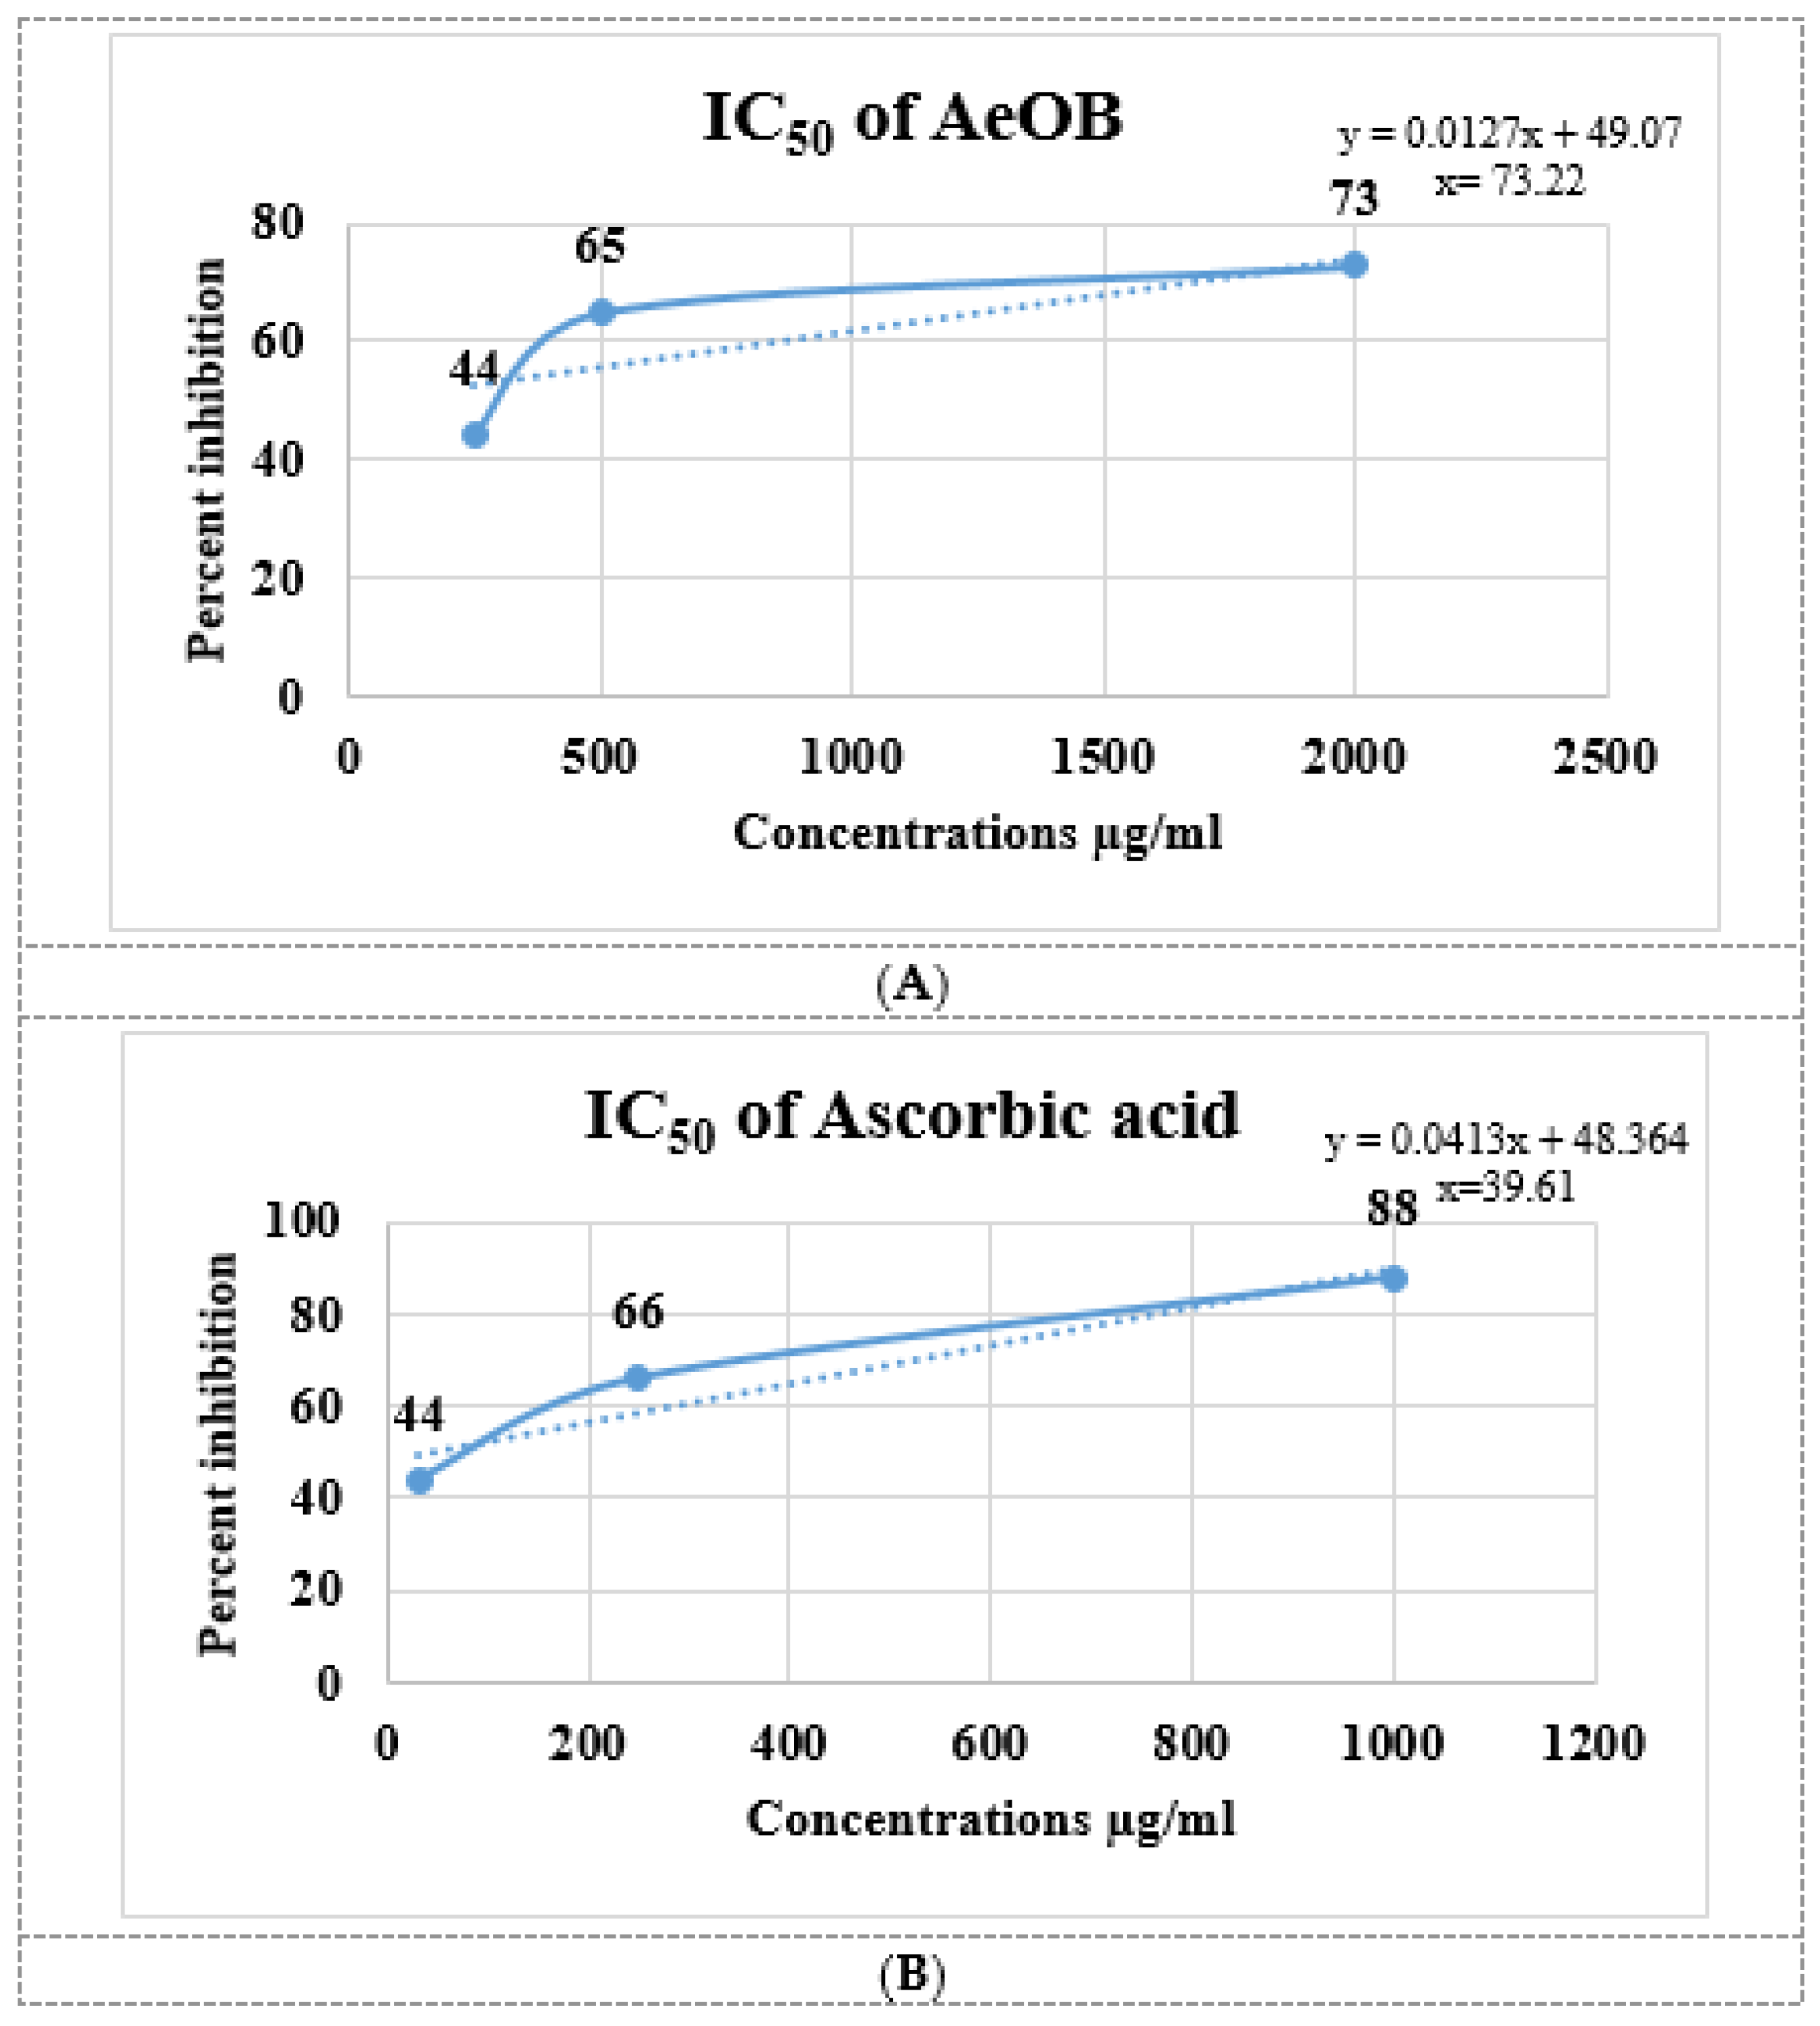
2.4. In Vitro Antioxidant Activity by 2,2-Diphenyl-1-Picrylhydrazyl Assay
2.5. In Vitro Anti-Inflammatory Activity
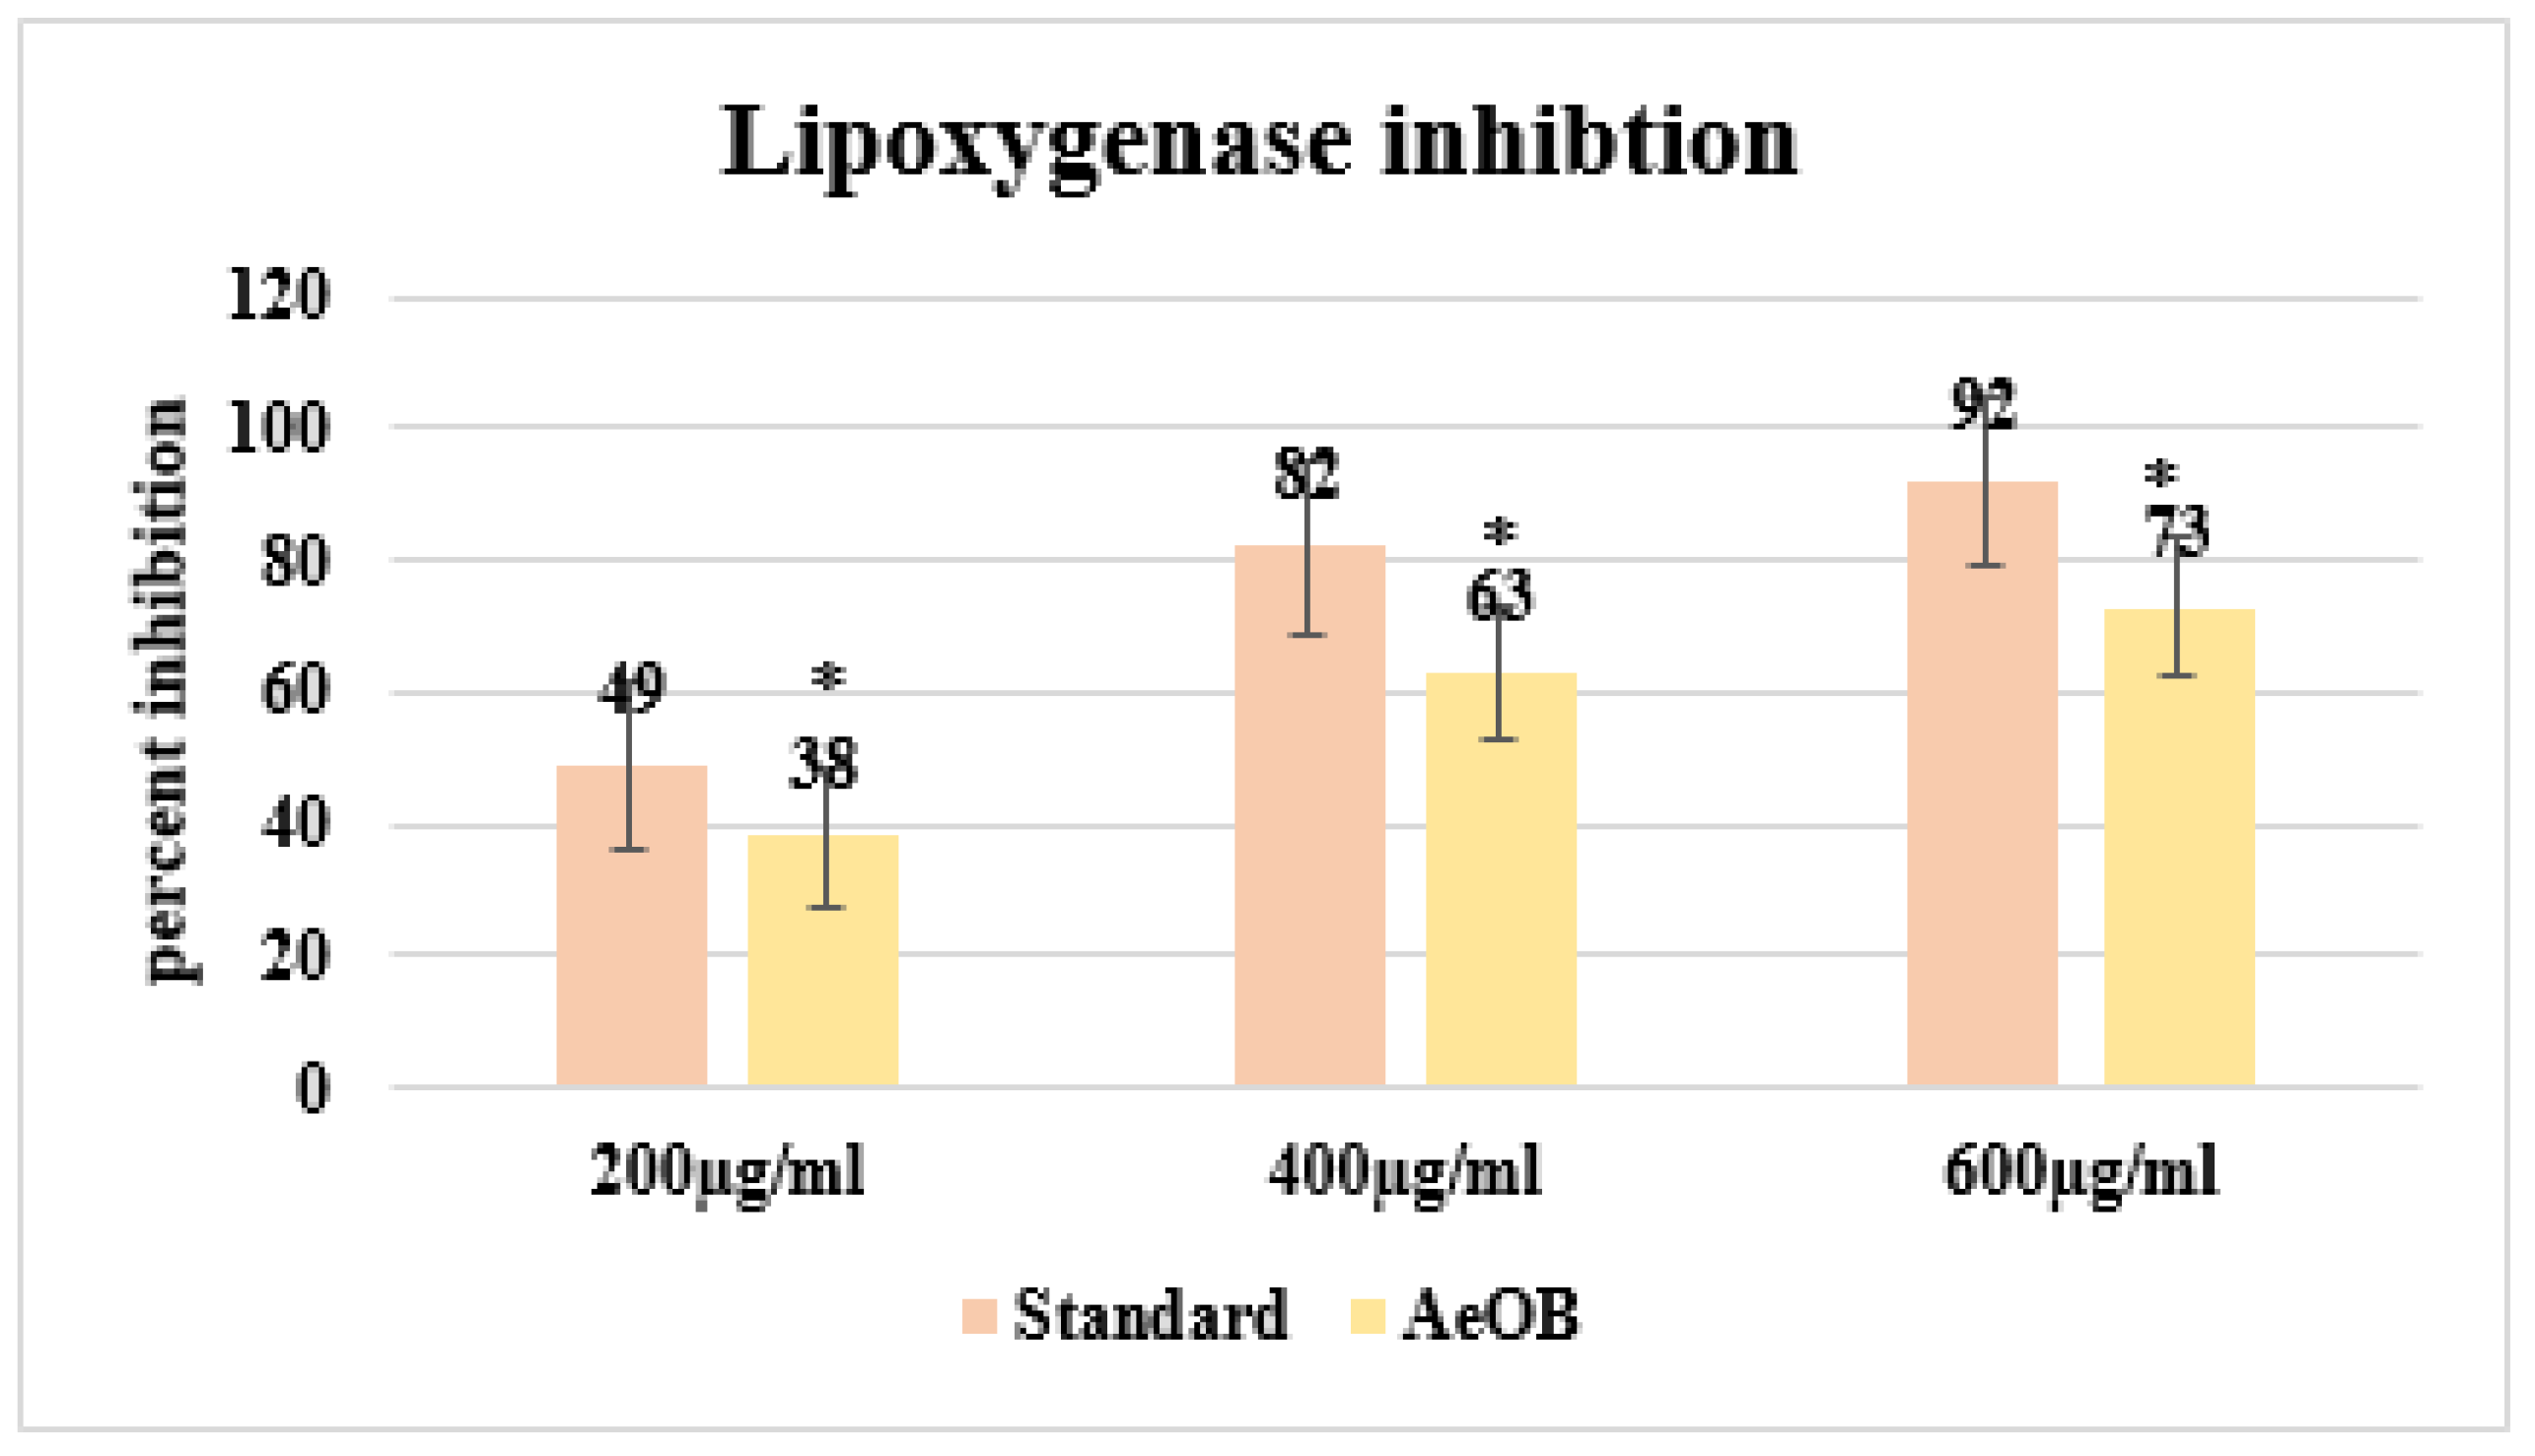
2.5.1. Lipoxygenase (LOX) Inhibitory Assay
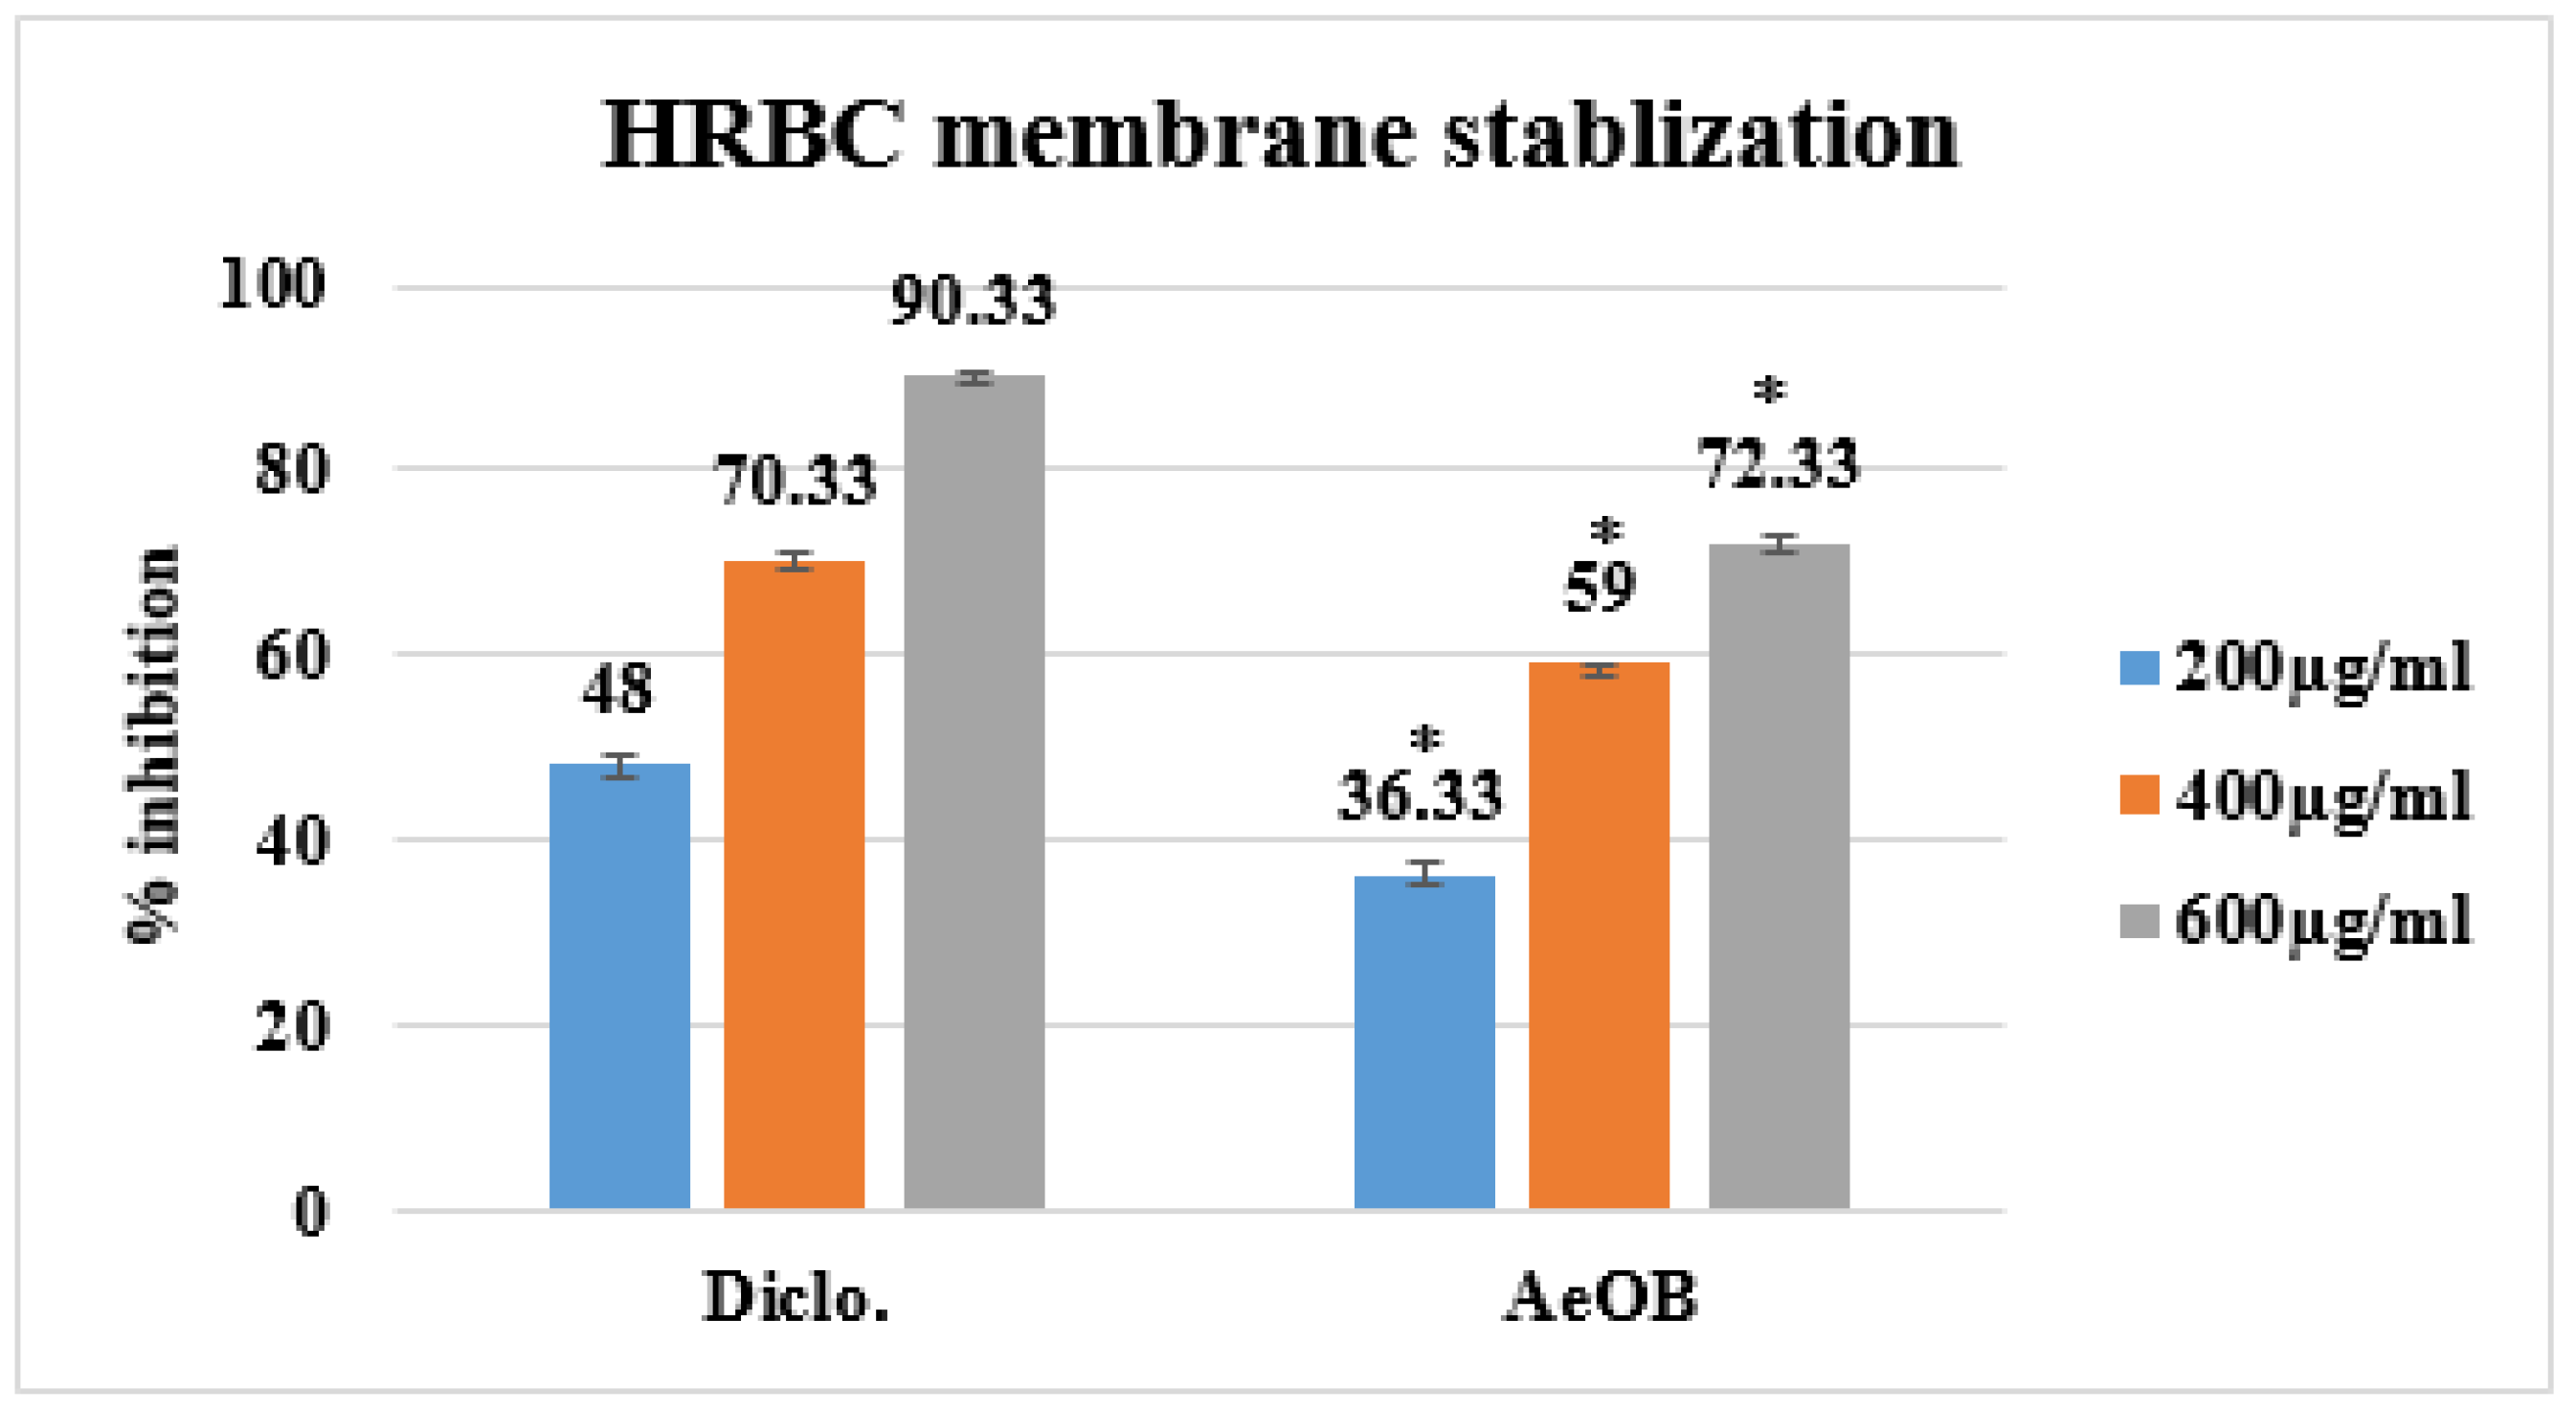
2.5.2. Human Red Blood Cell (HRBC) Membrane Stabilization Method
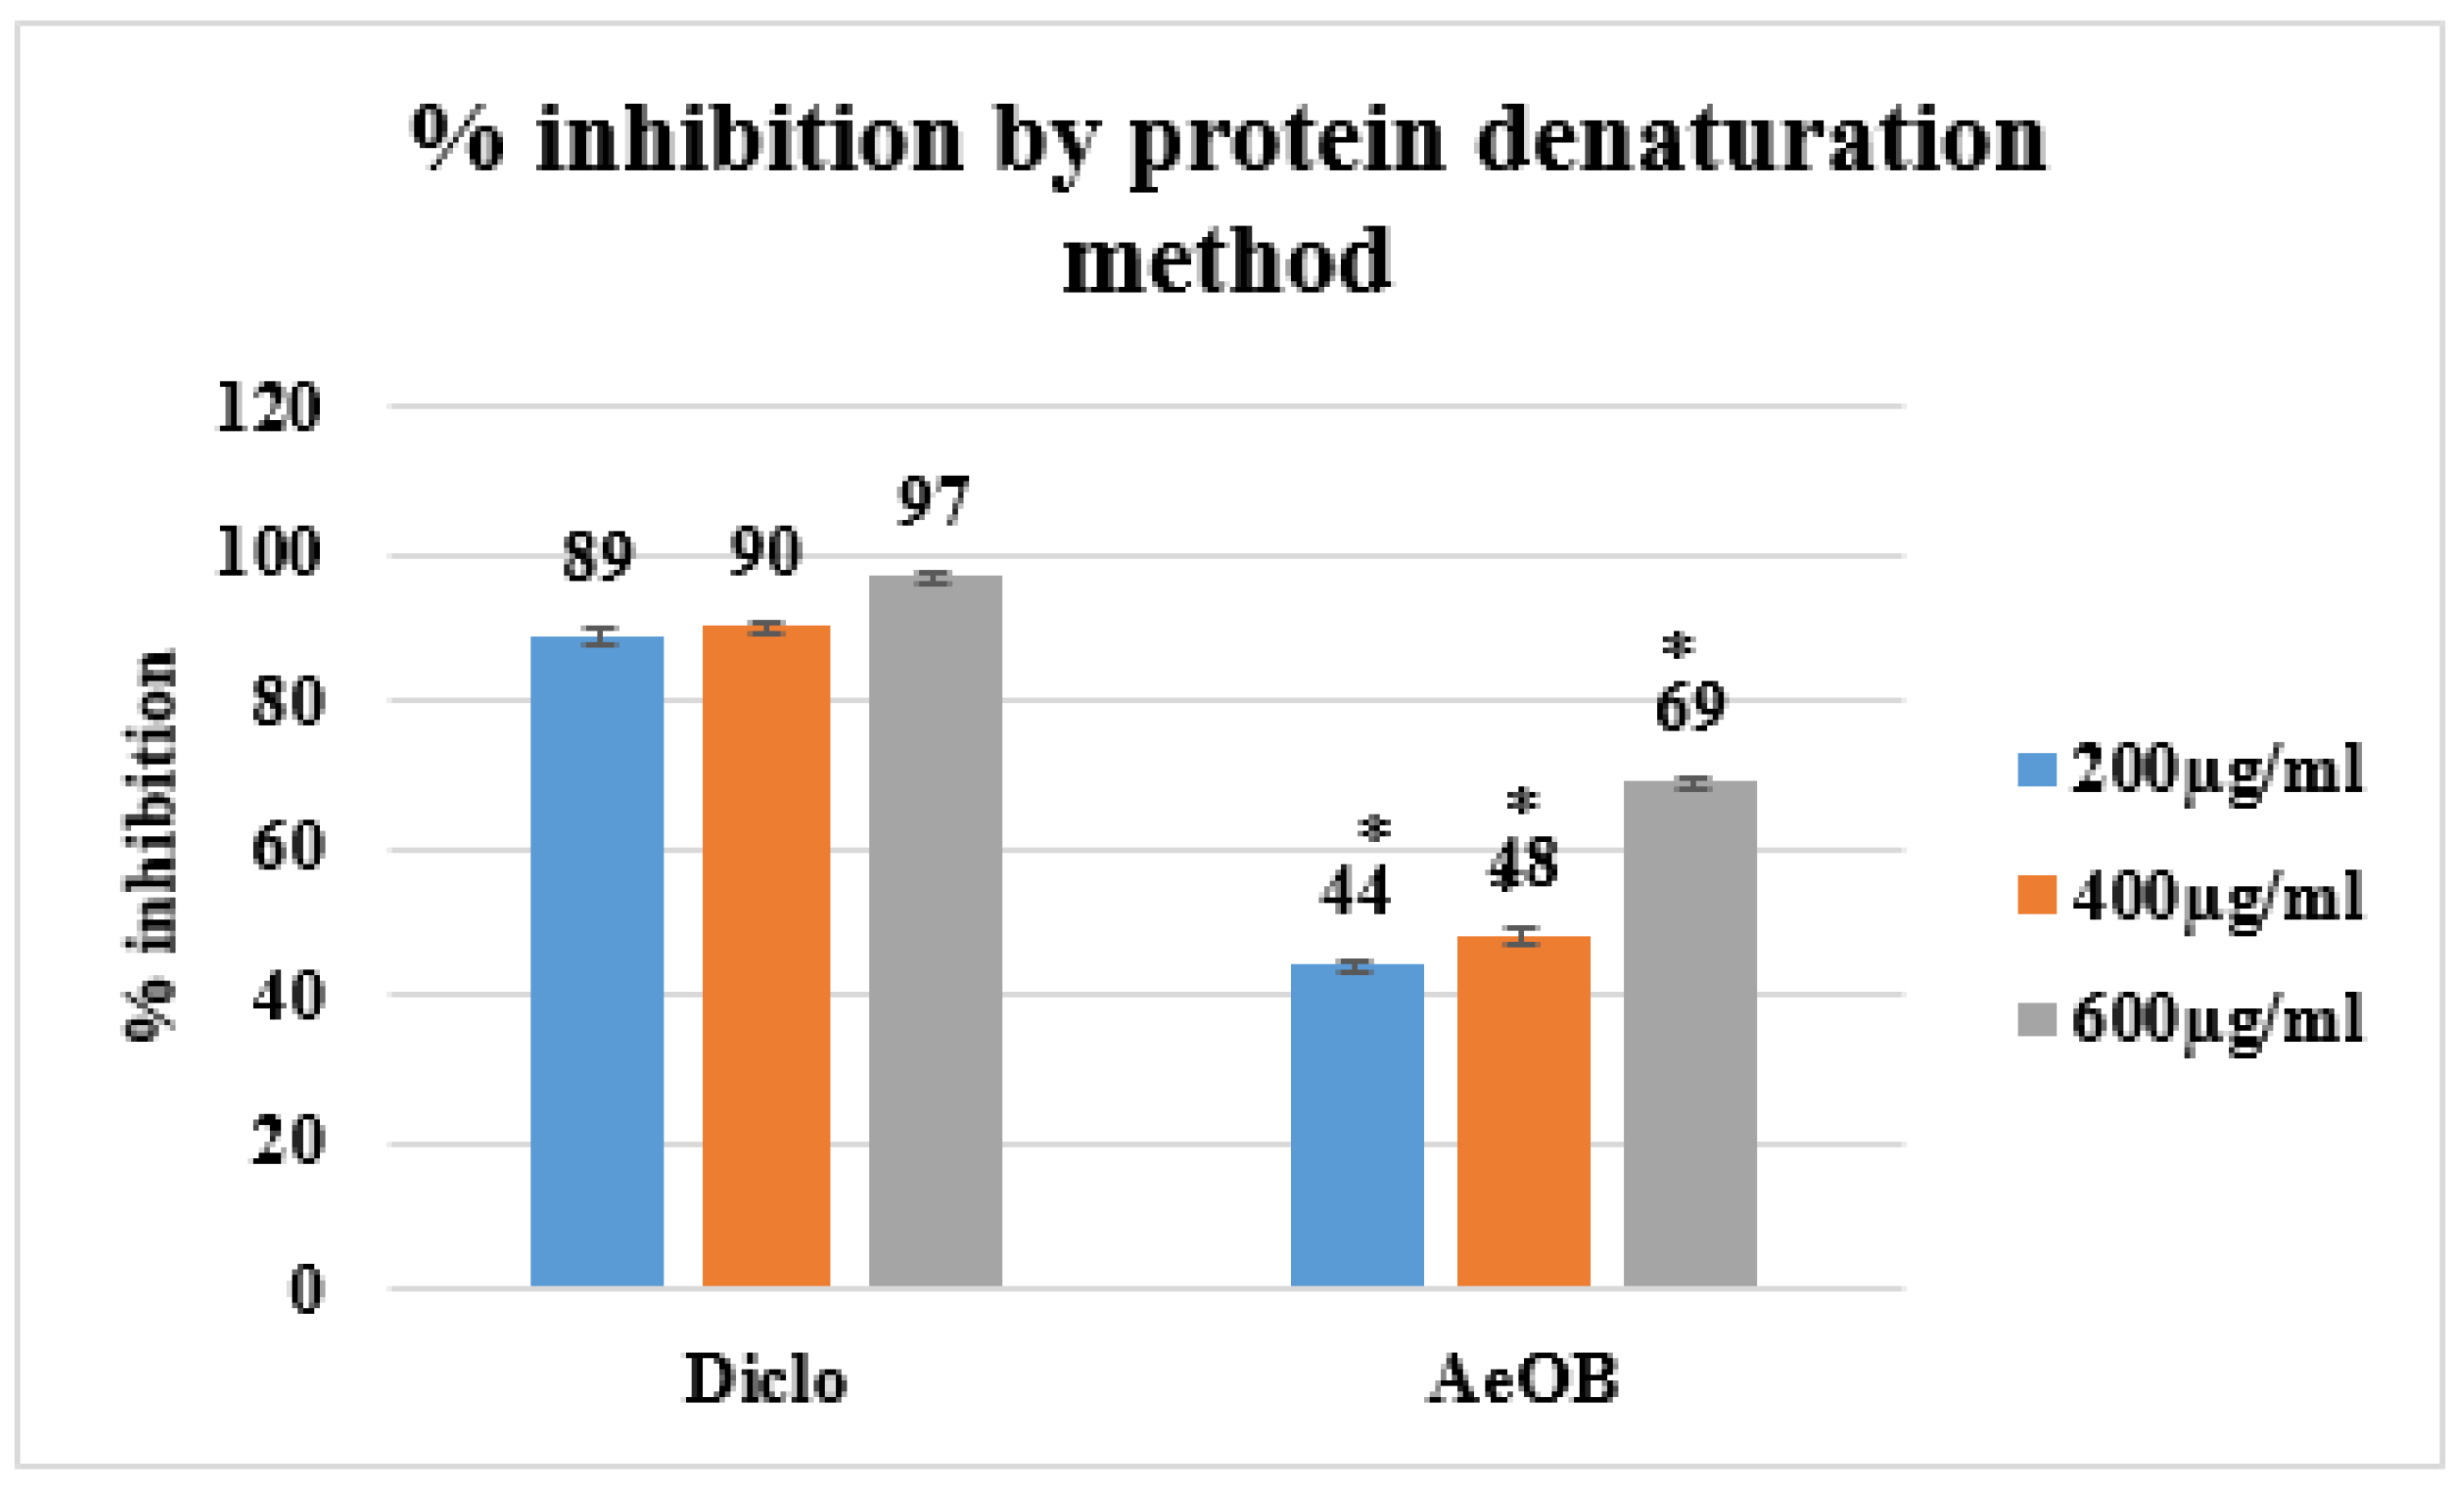
2.5.3. Egg Albumin Denaturation Method
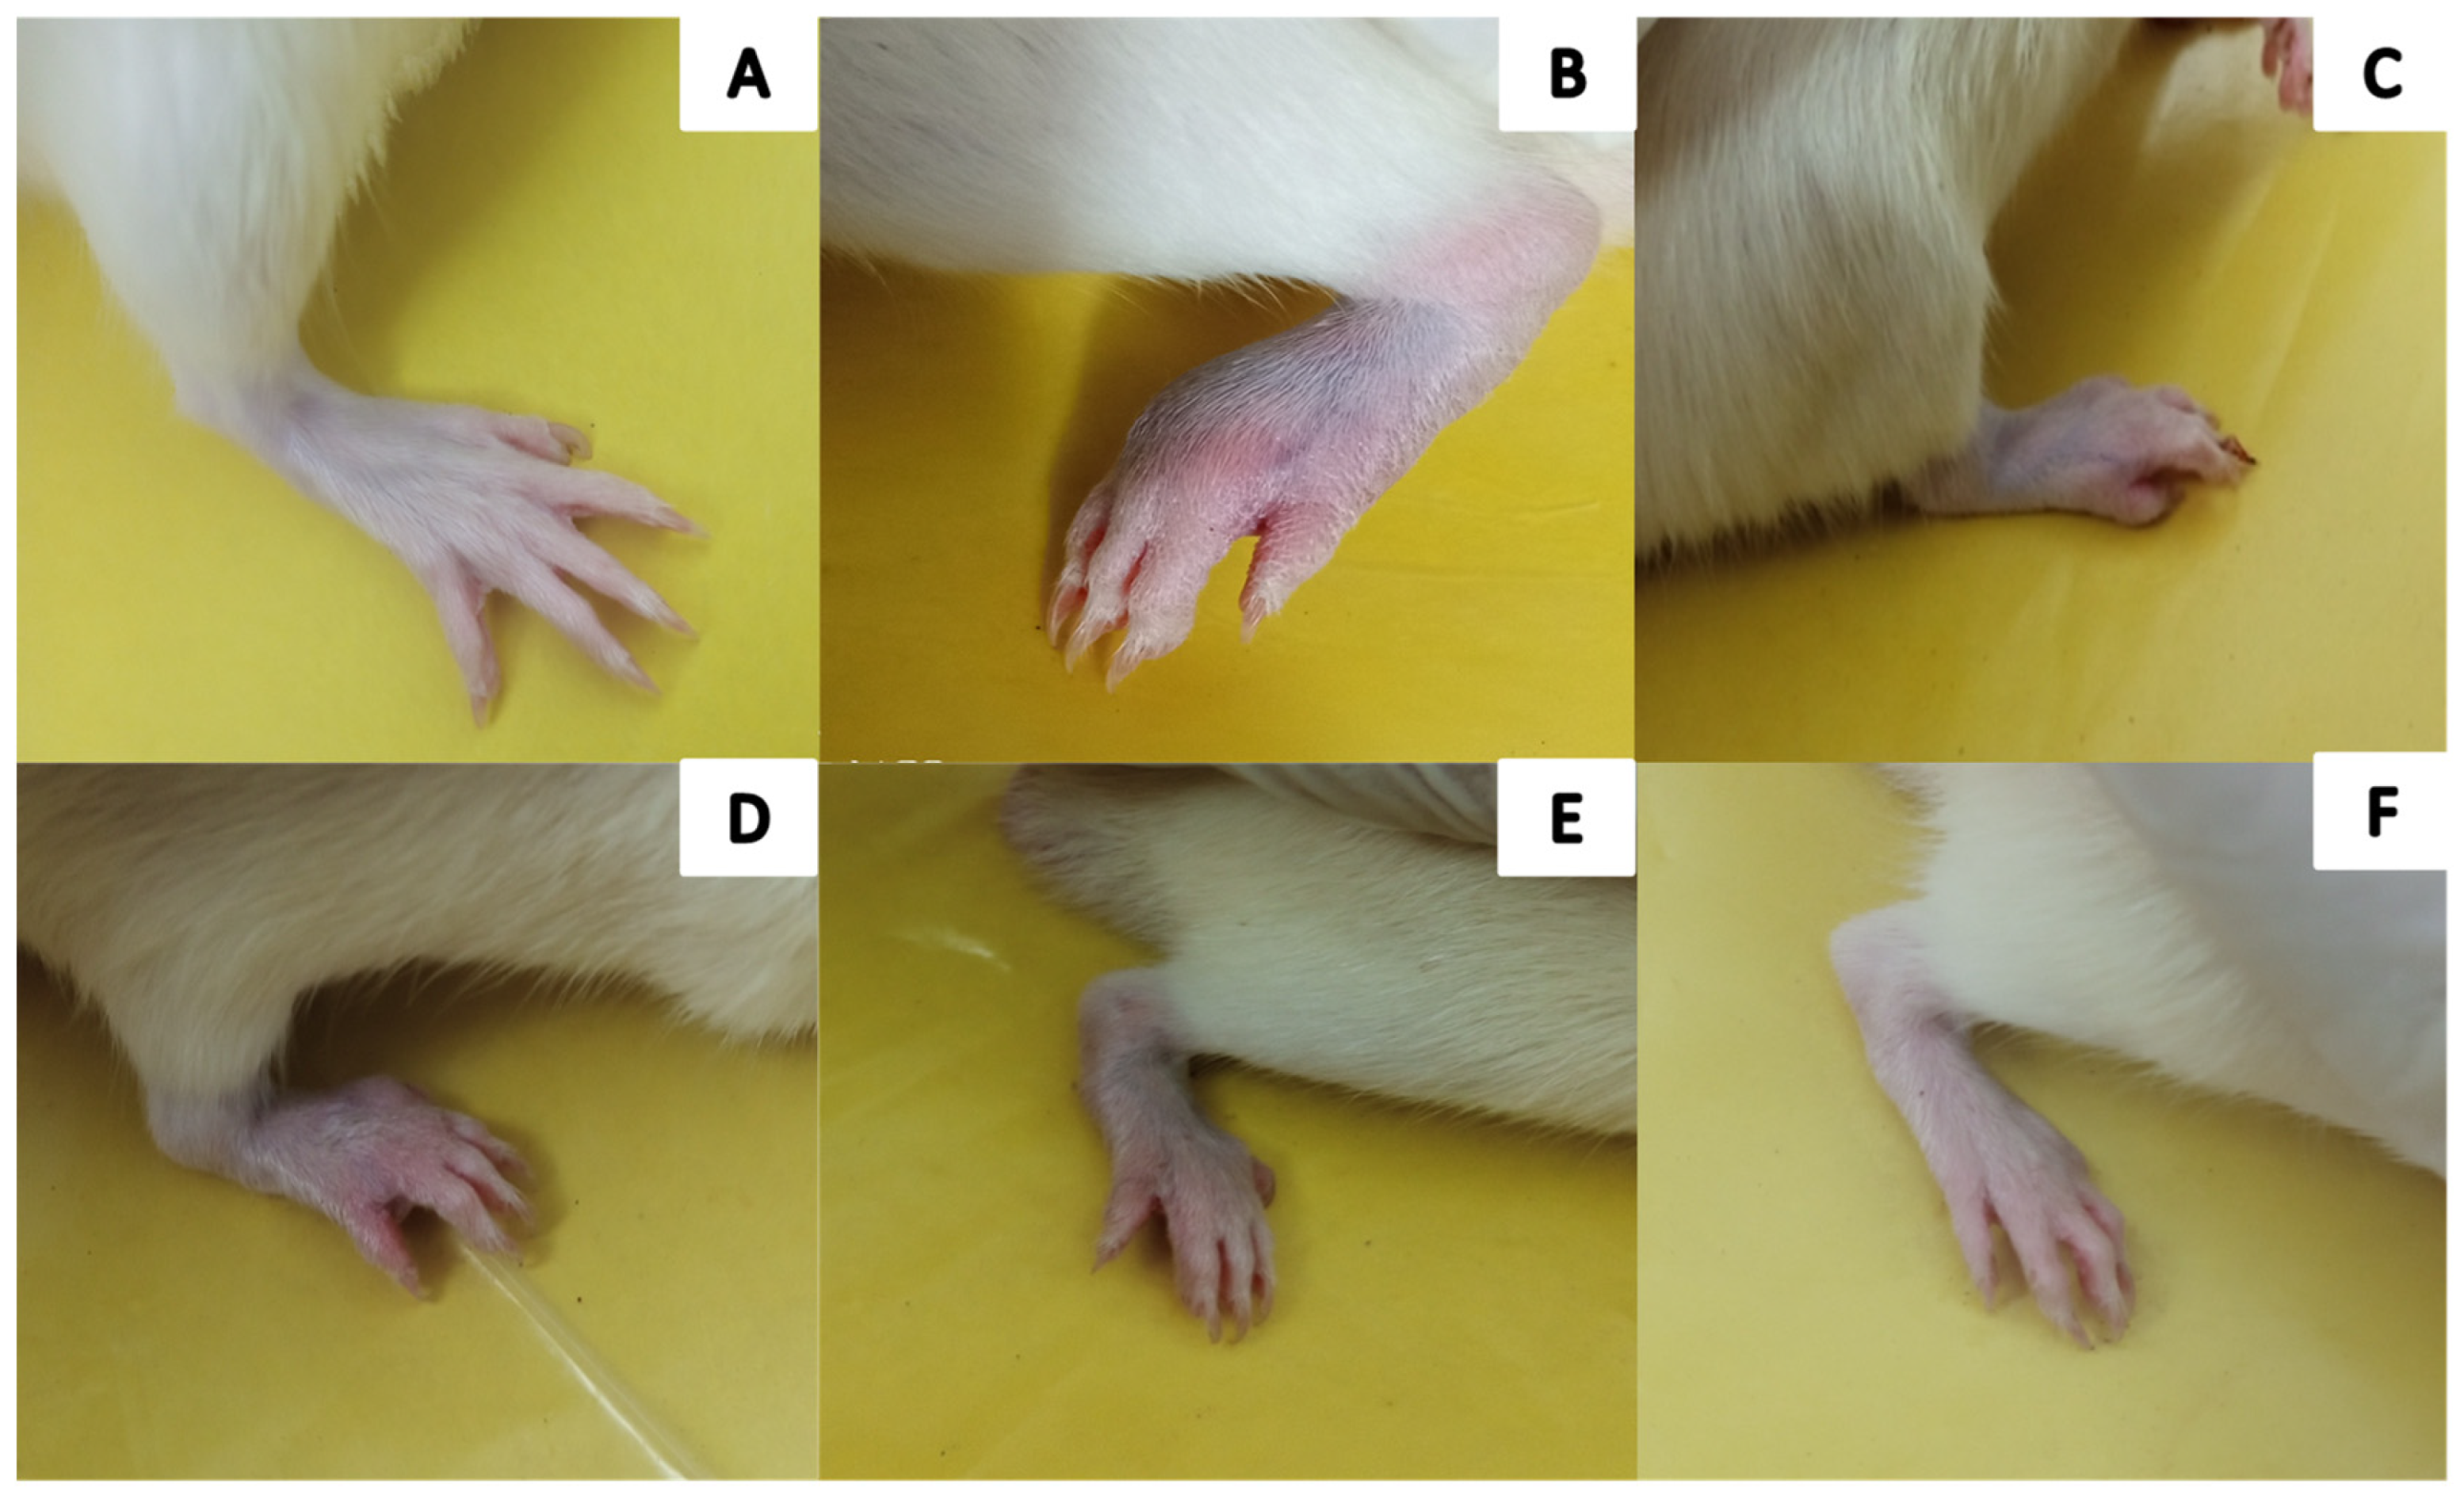
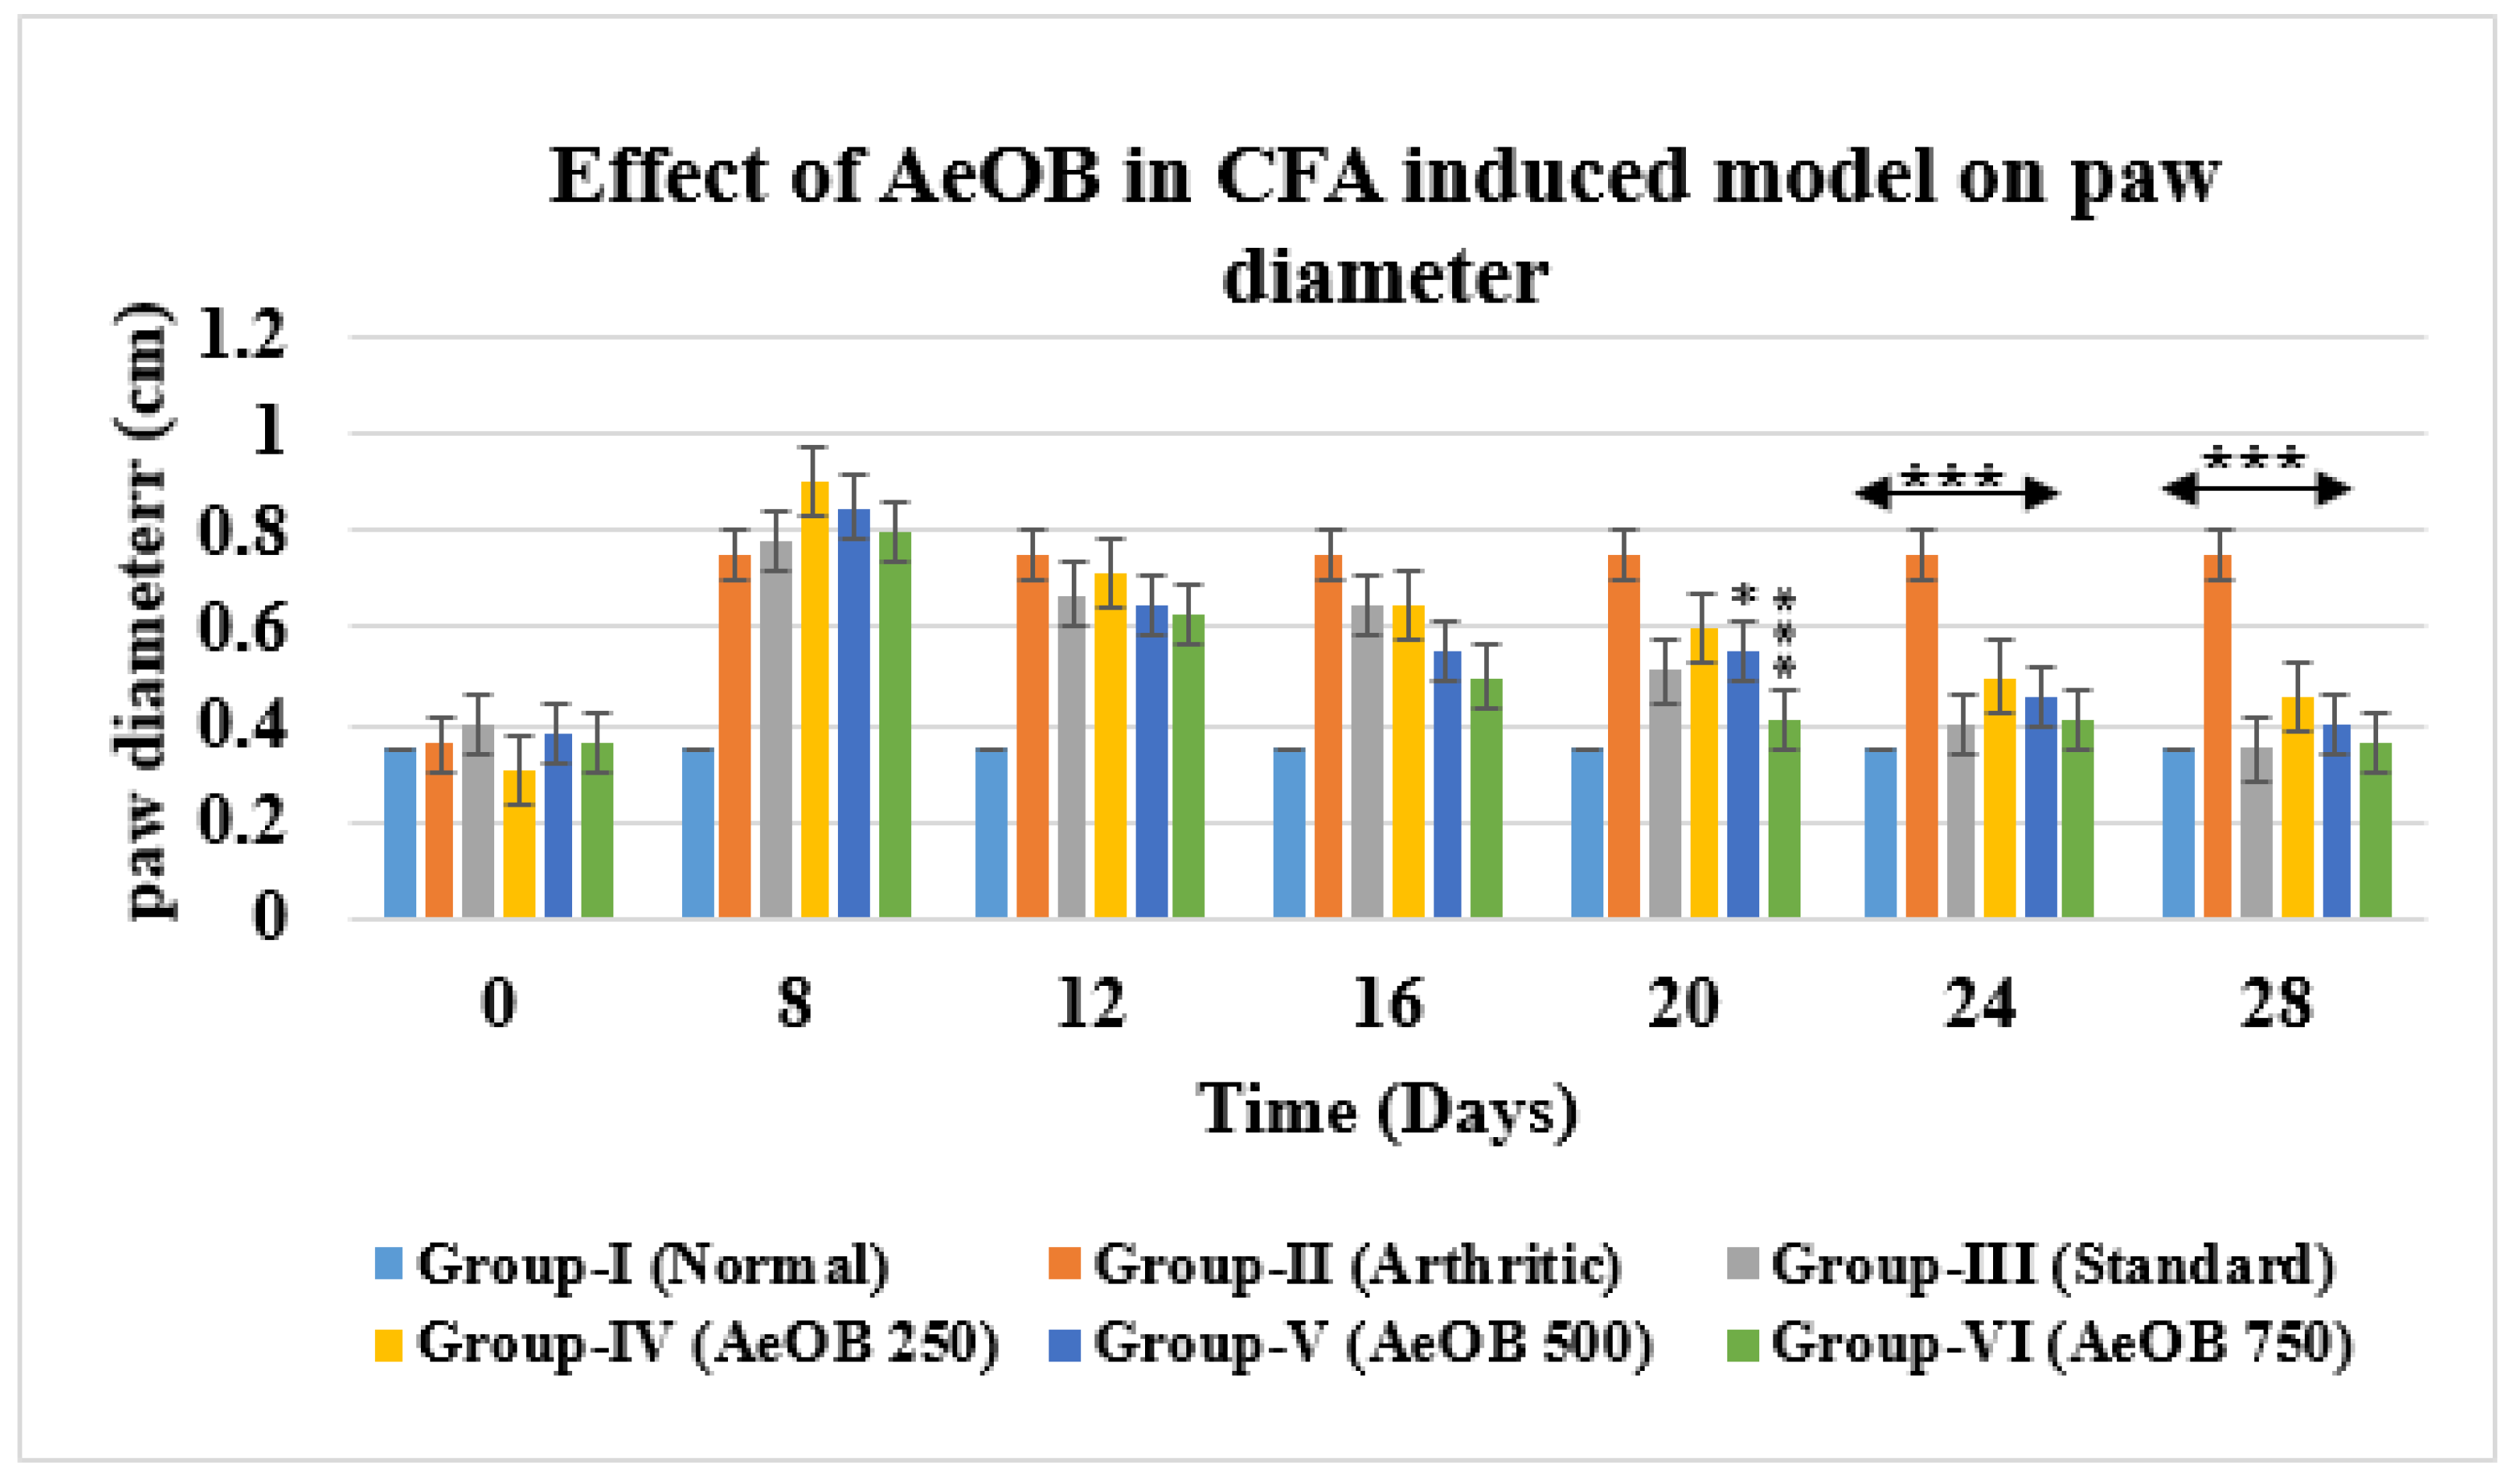
2.6. Complete Freund’s Adjuvant-Induced Model Paw Diameter
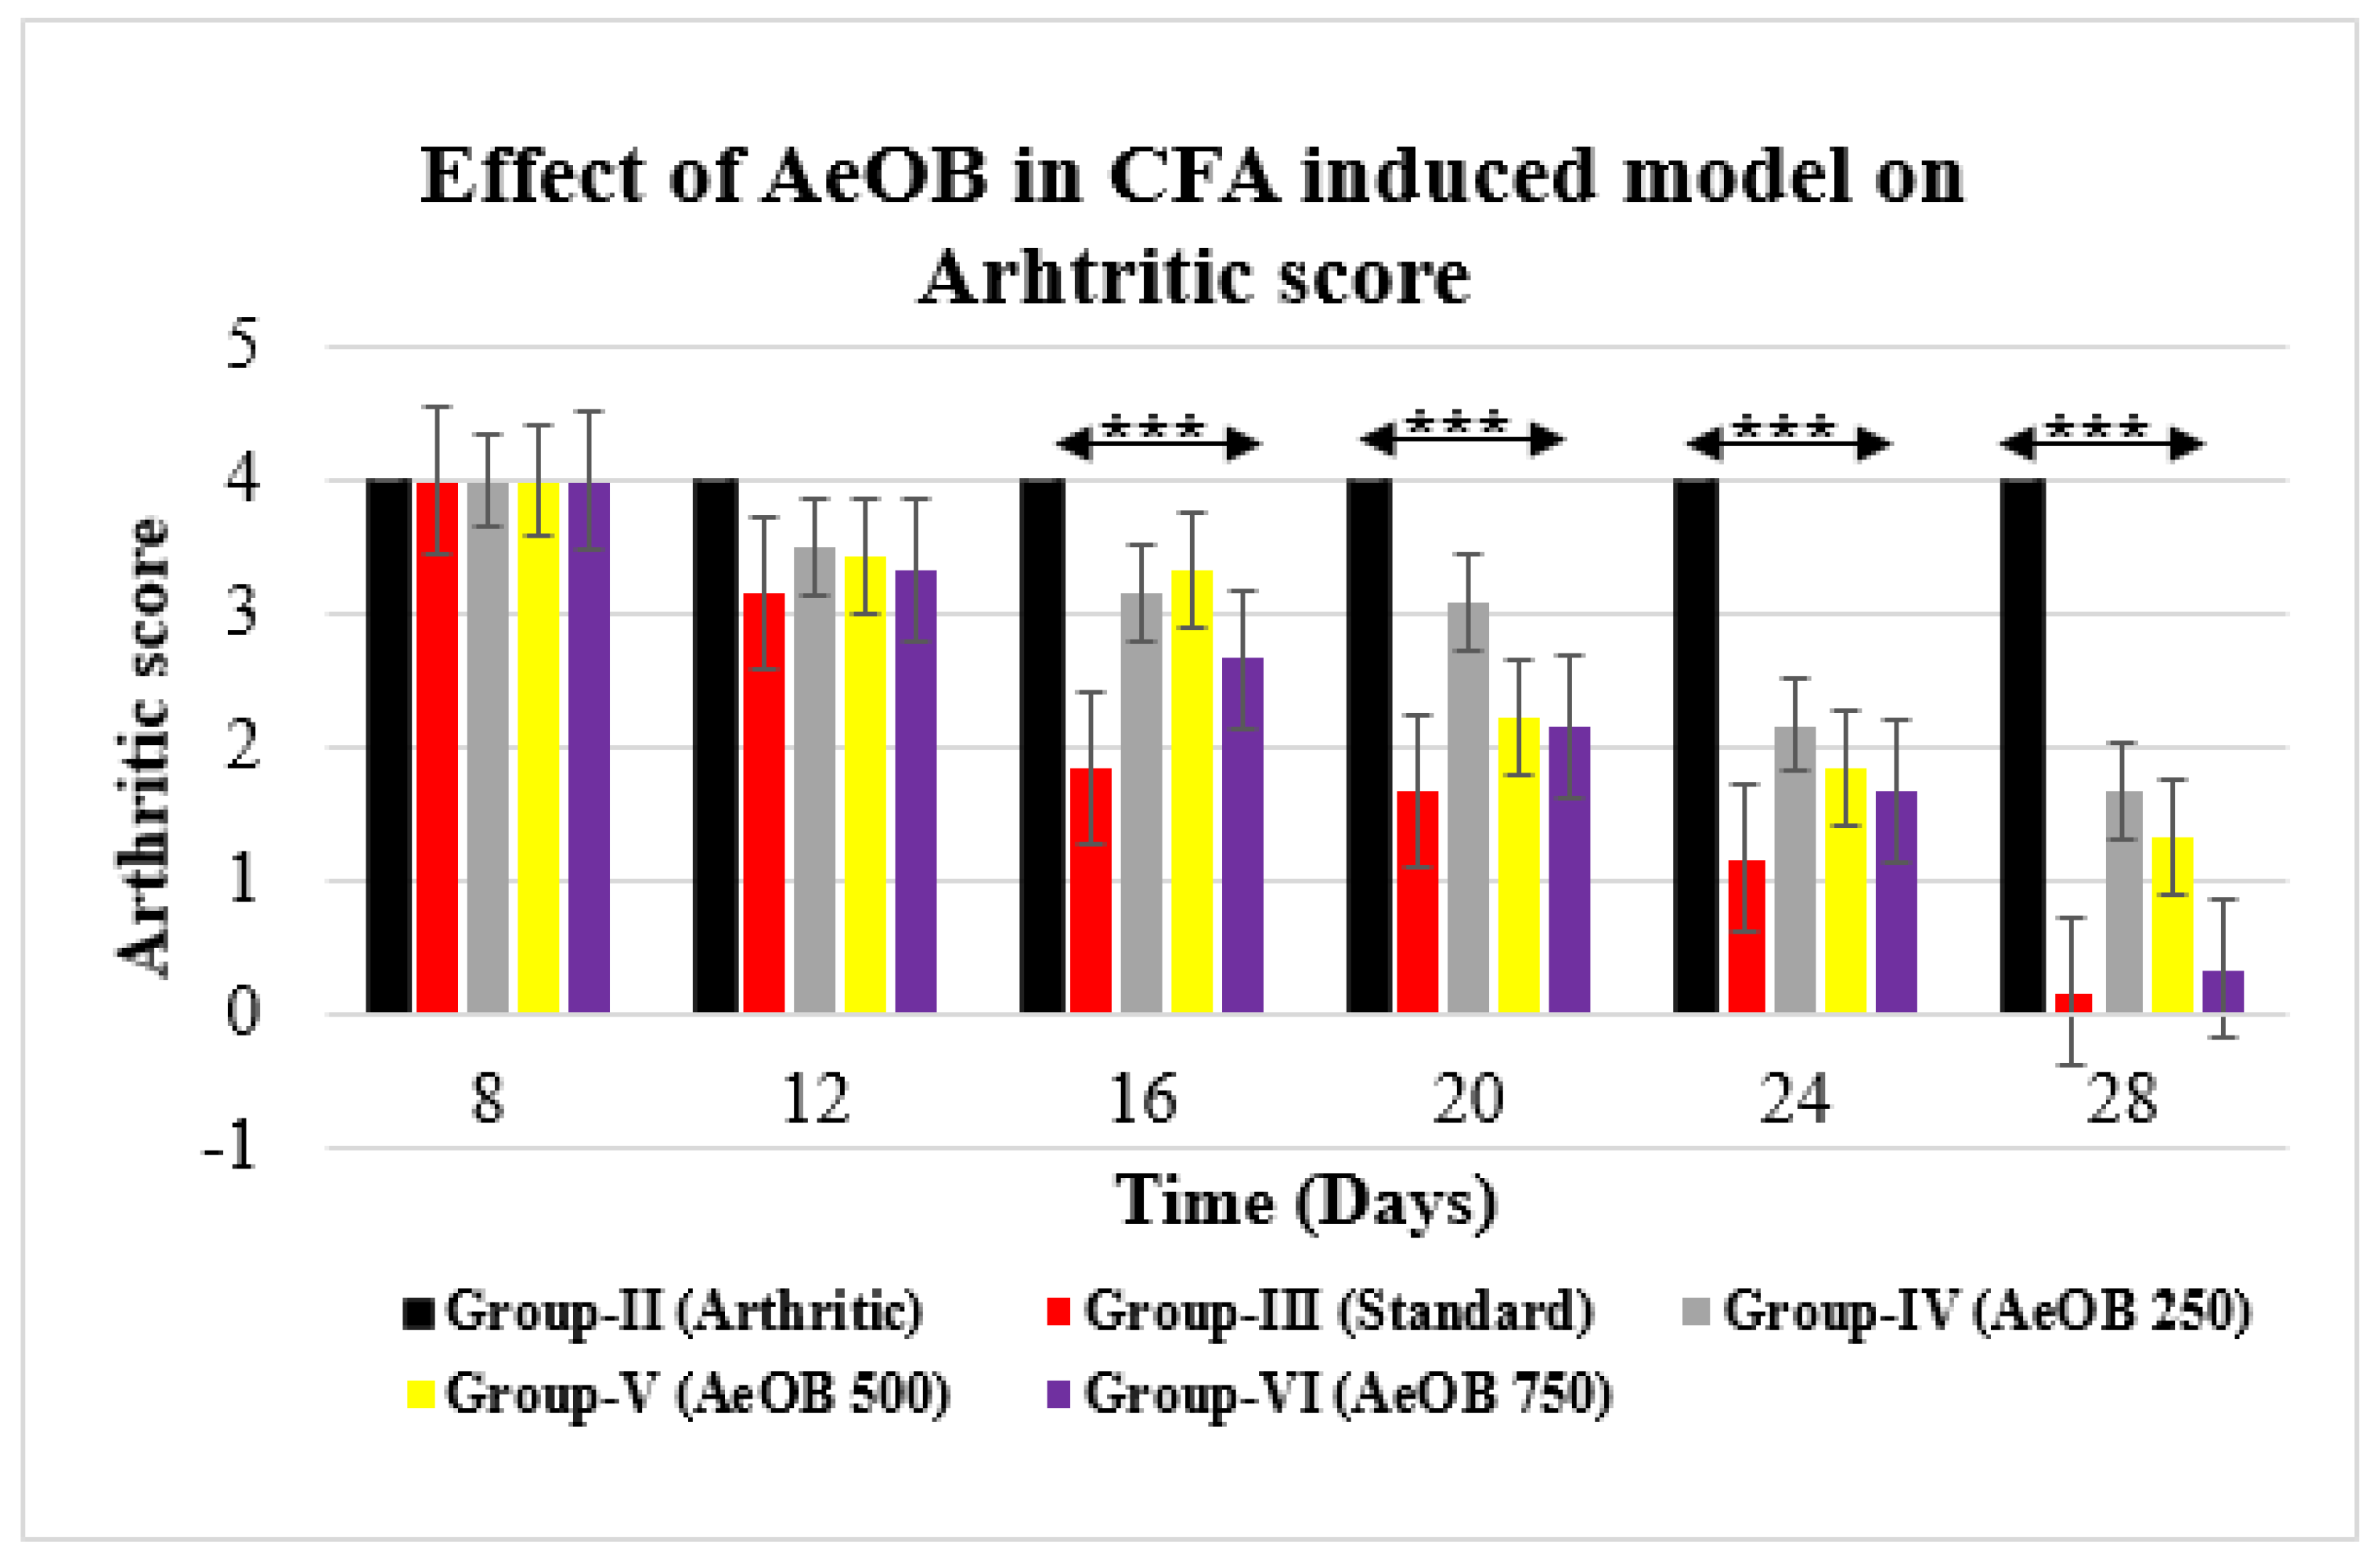
2.6.1. The Visual Arthritic Scoring System
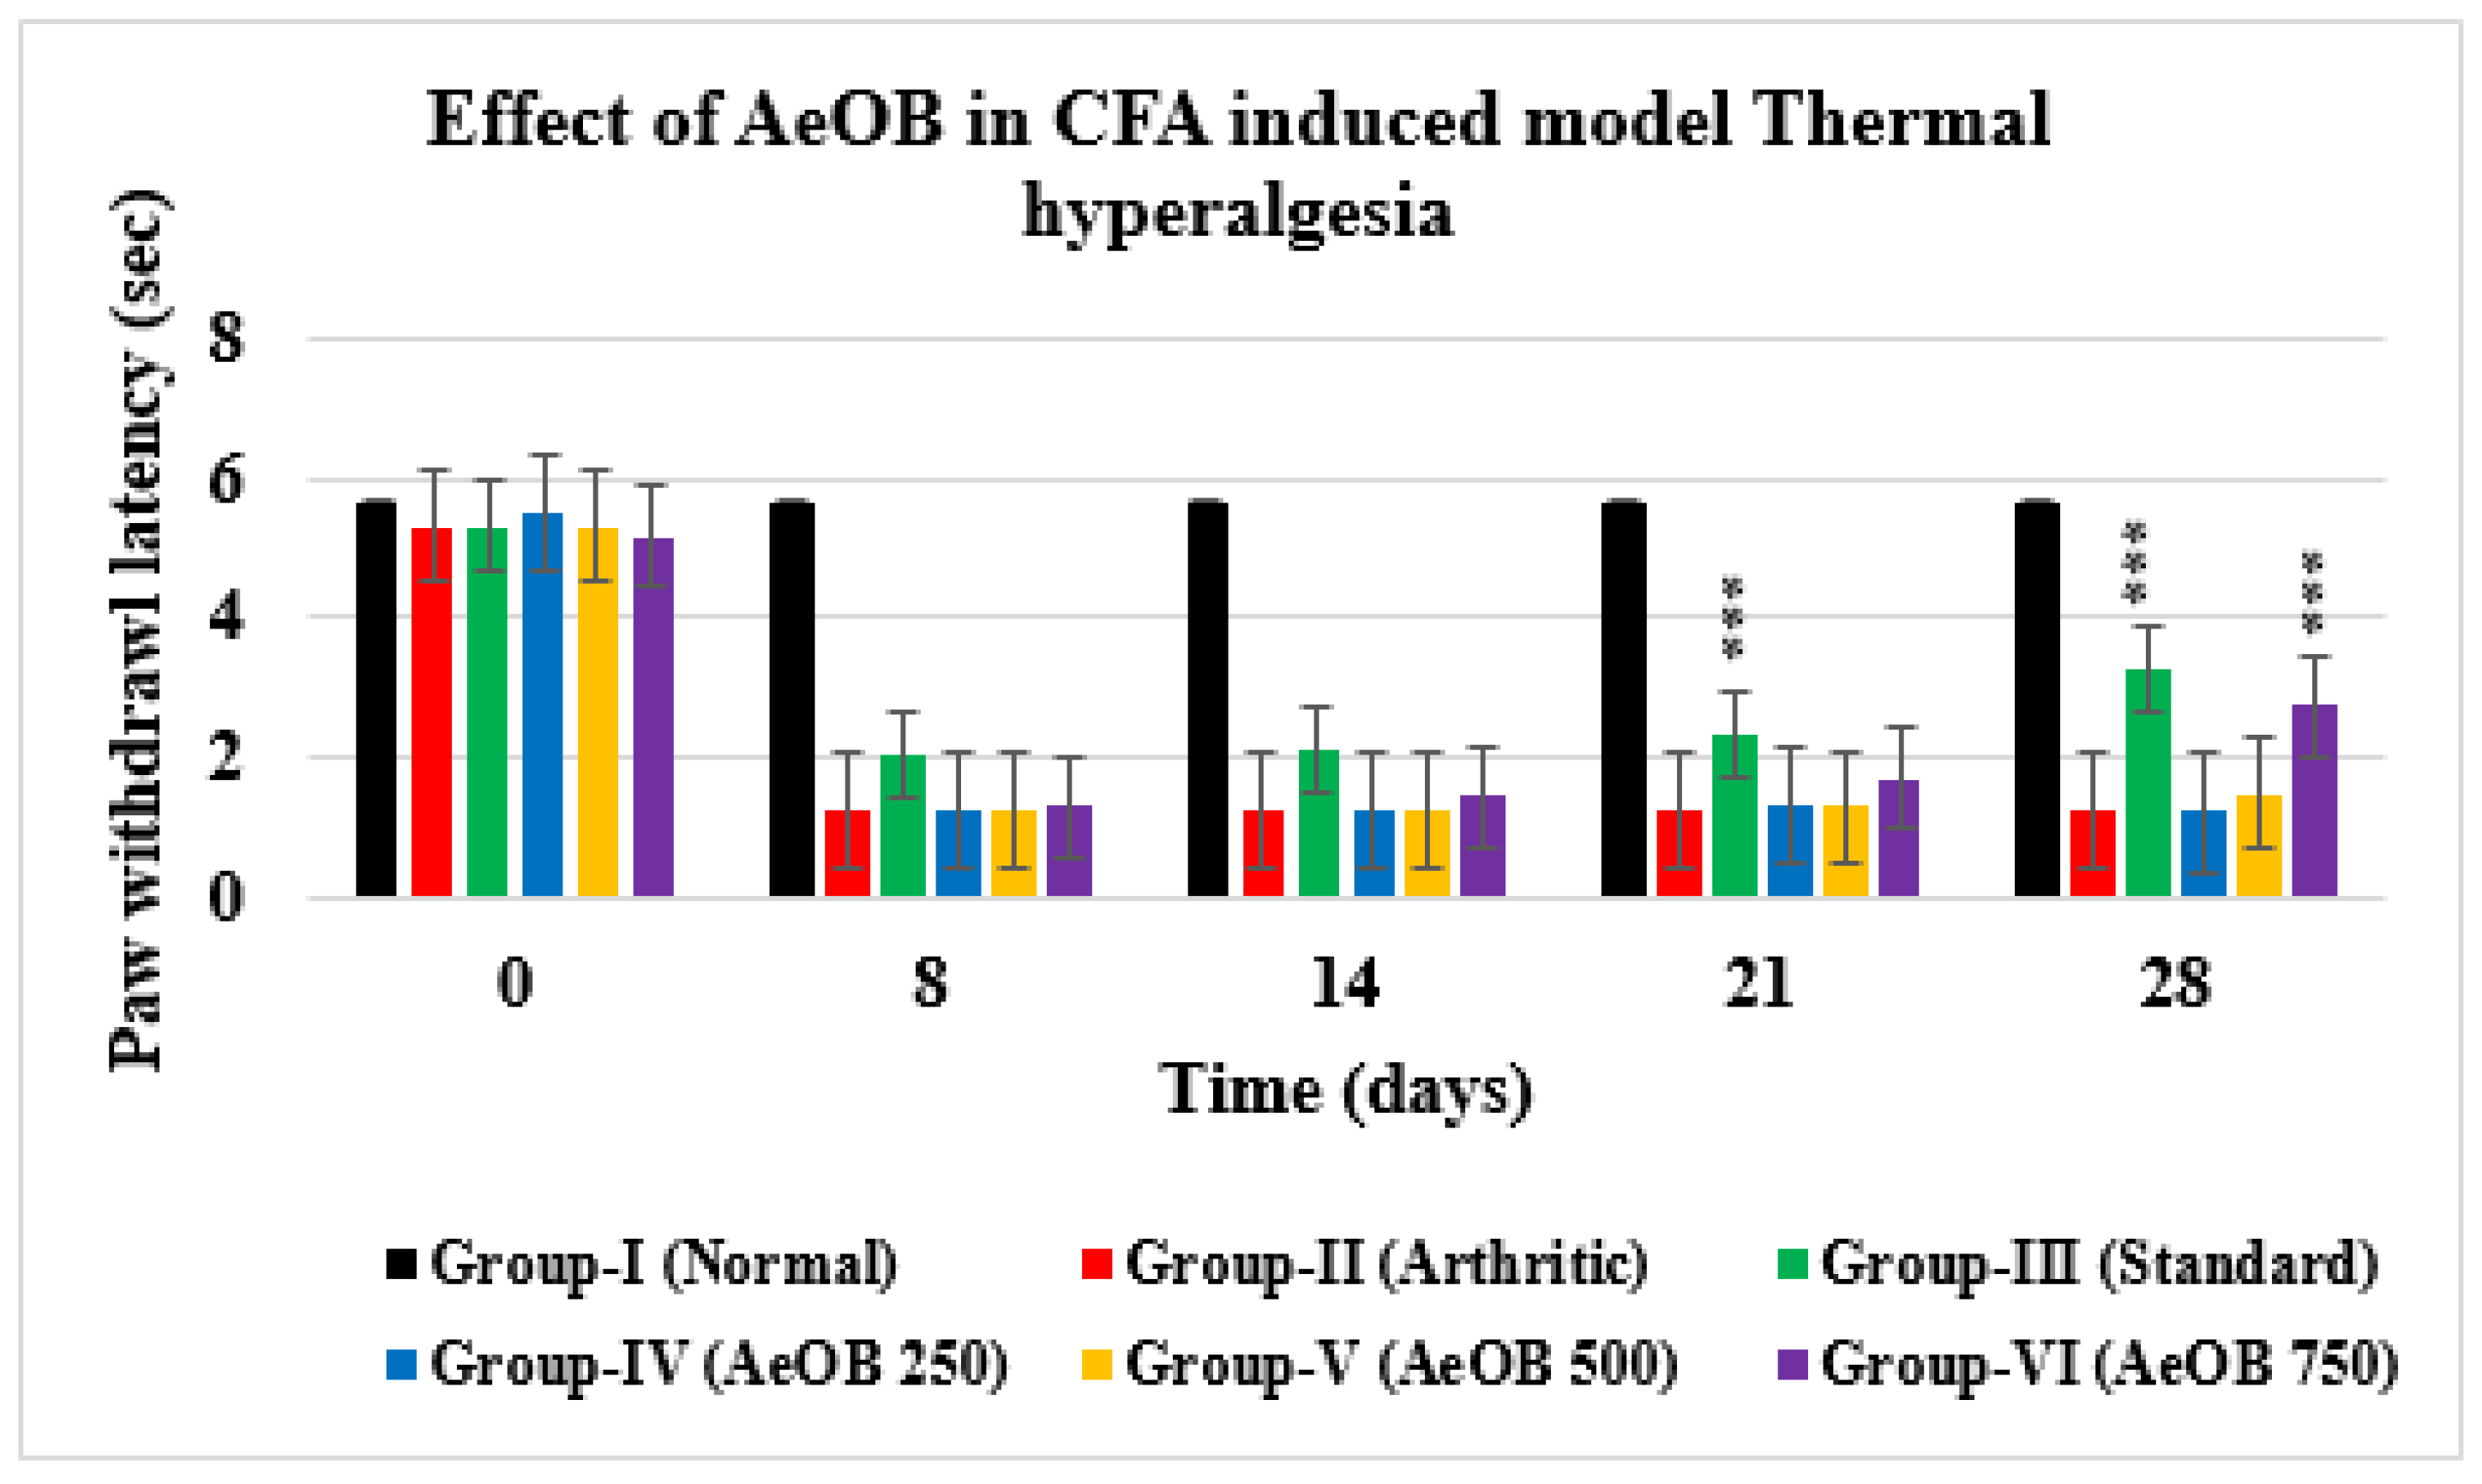
2.6.2. Hot Plate/Thermal Hyperalgesia
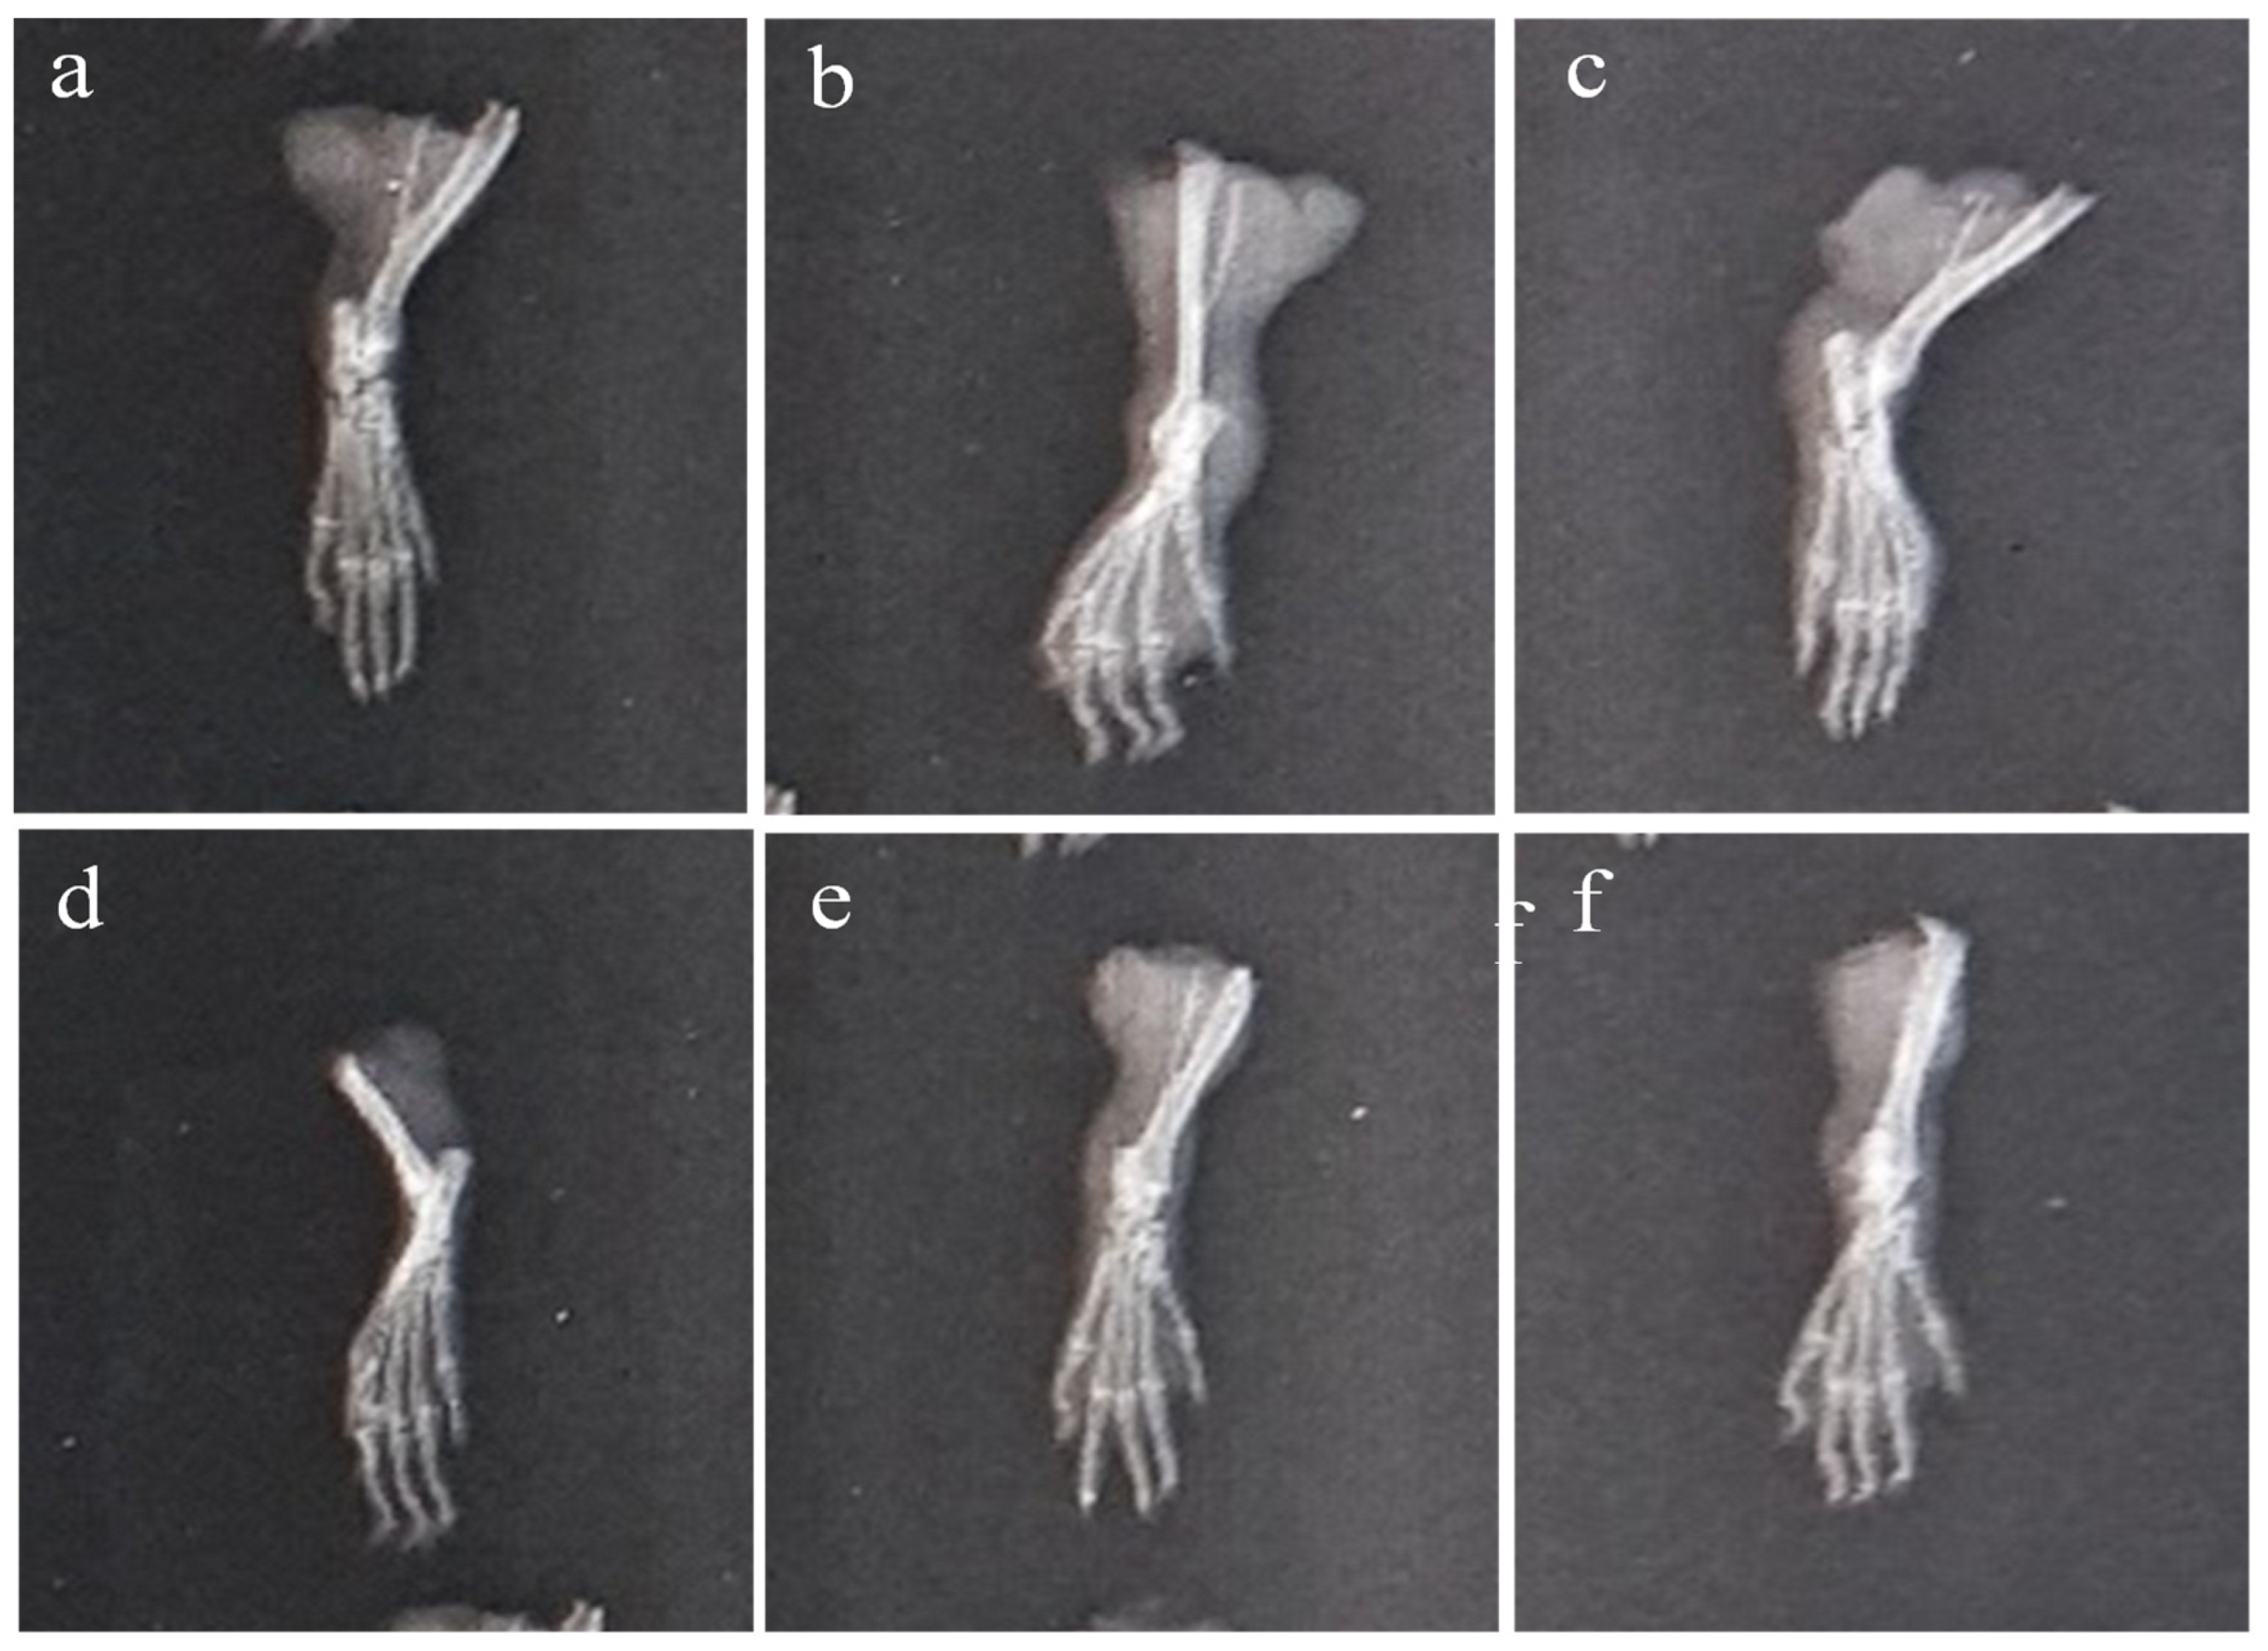
2.6.3. X-ray of Left Hind Paw
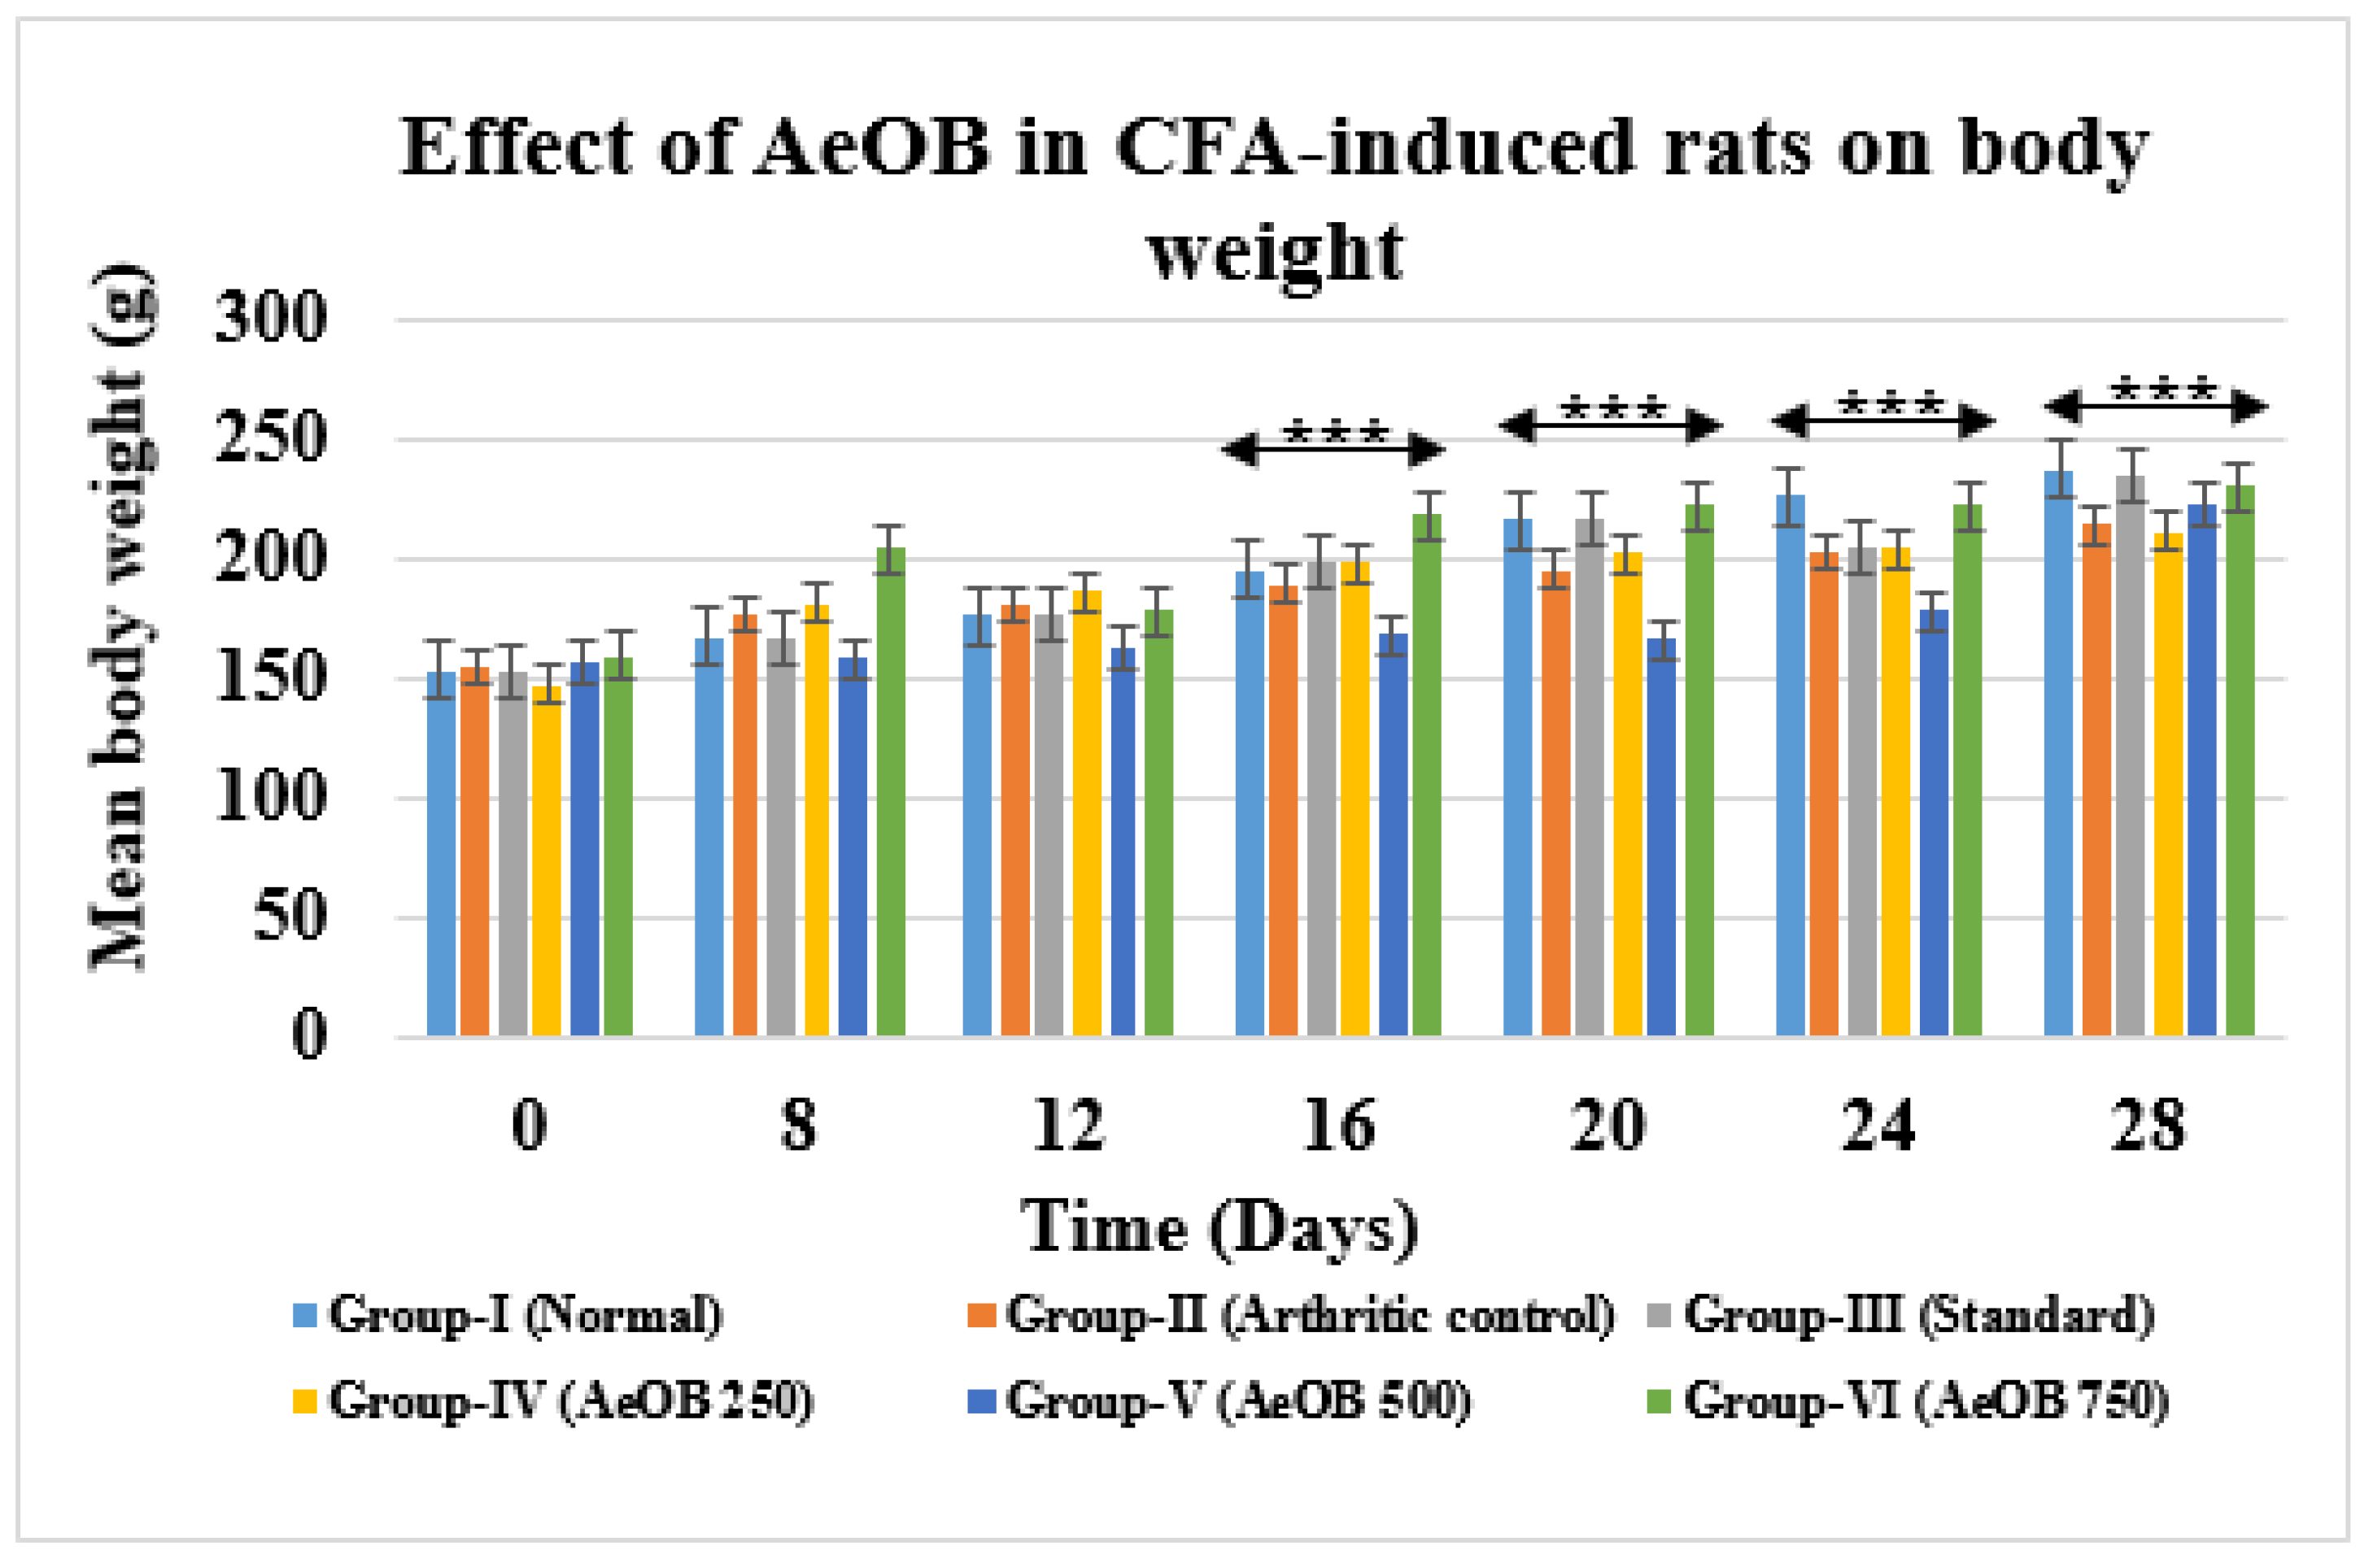
2.6.4. Body Weight
2.6.5. Effect of AEOB on Serum TNF-α, IL-6 Gene Expression, and CRP in CFA-Induced Arthritic Model
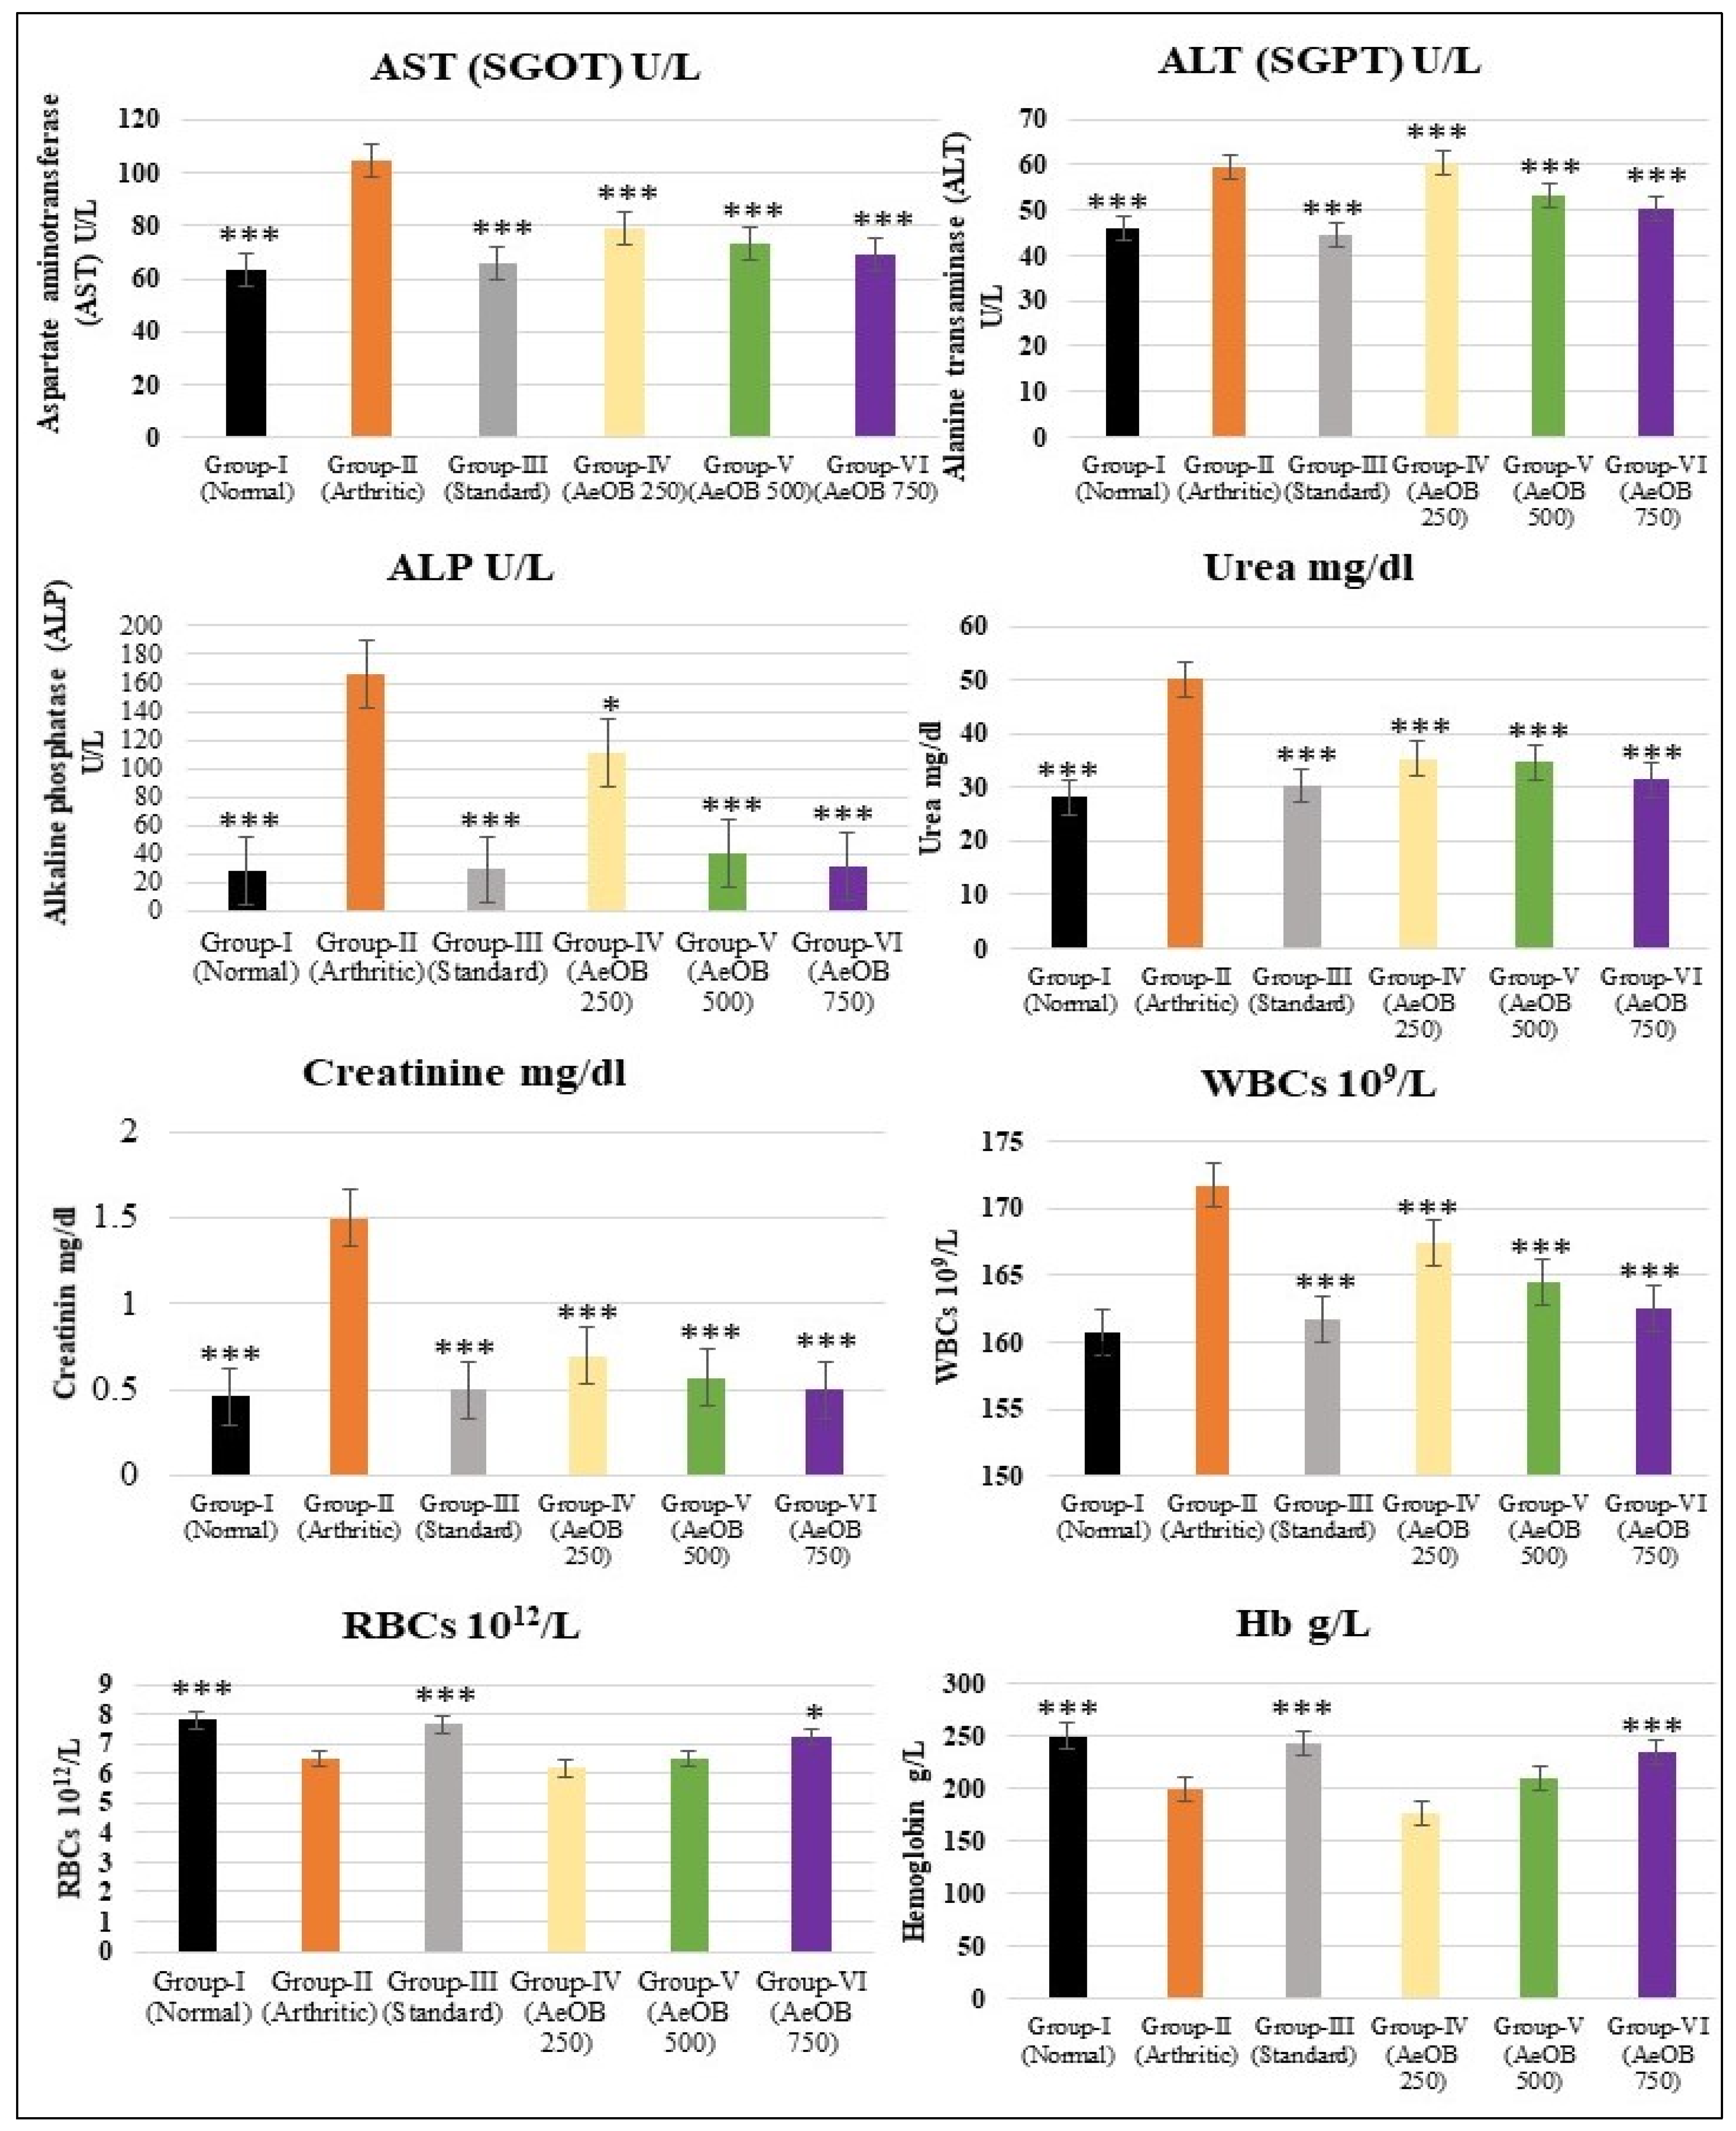
2.6.6. Hematological and Biochemical Estimation
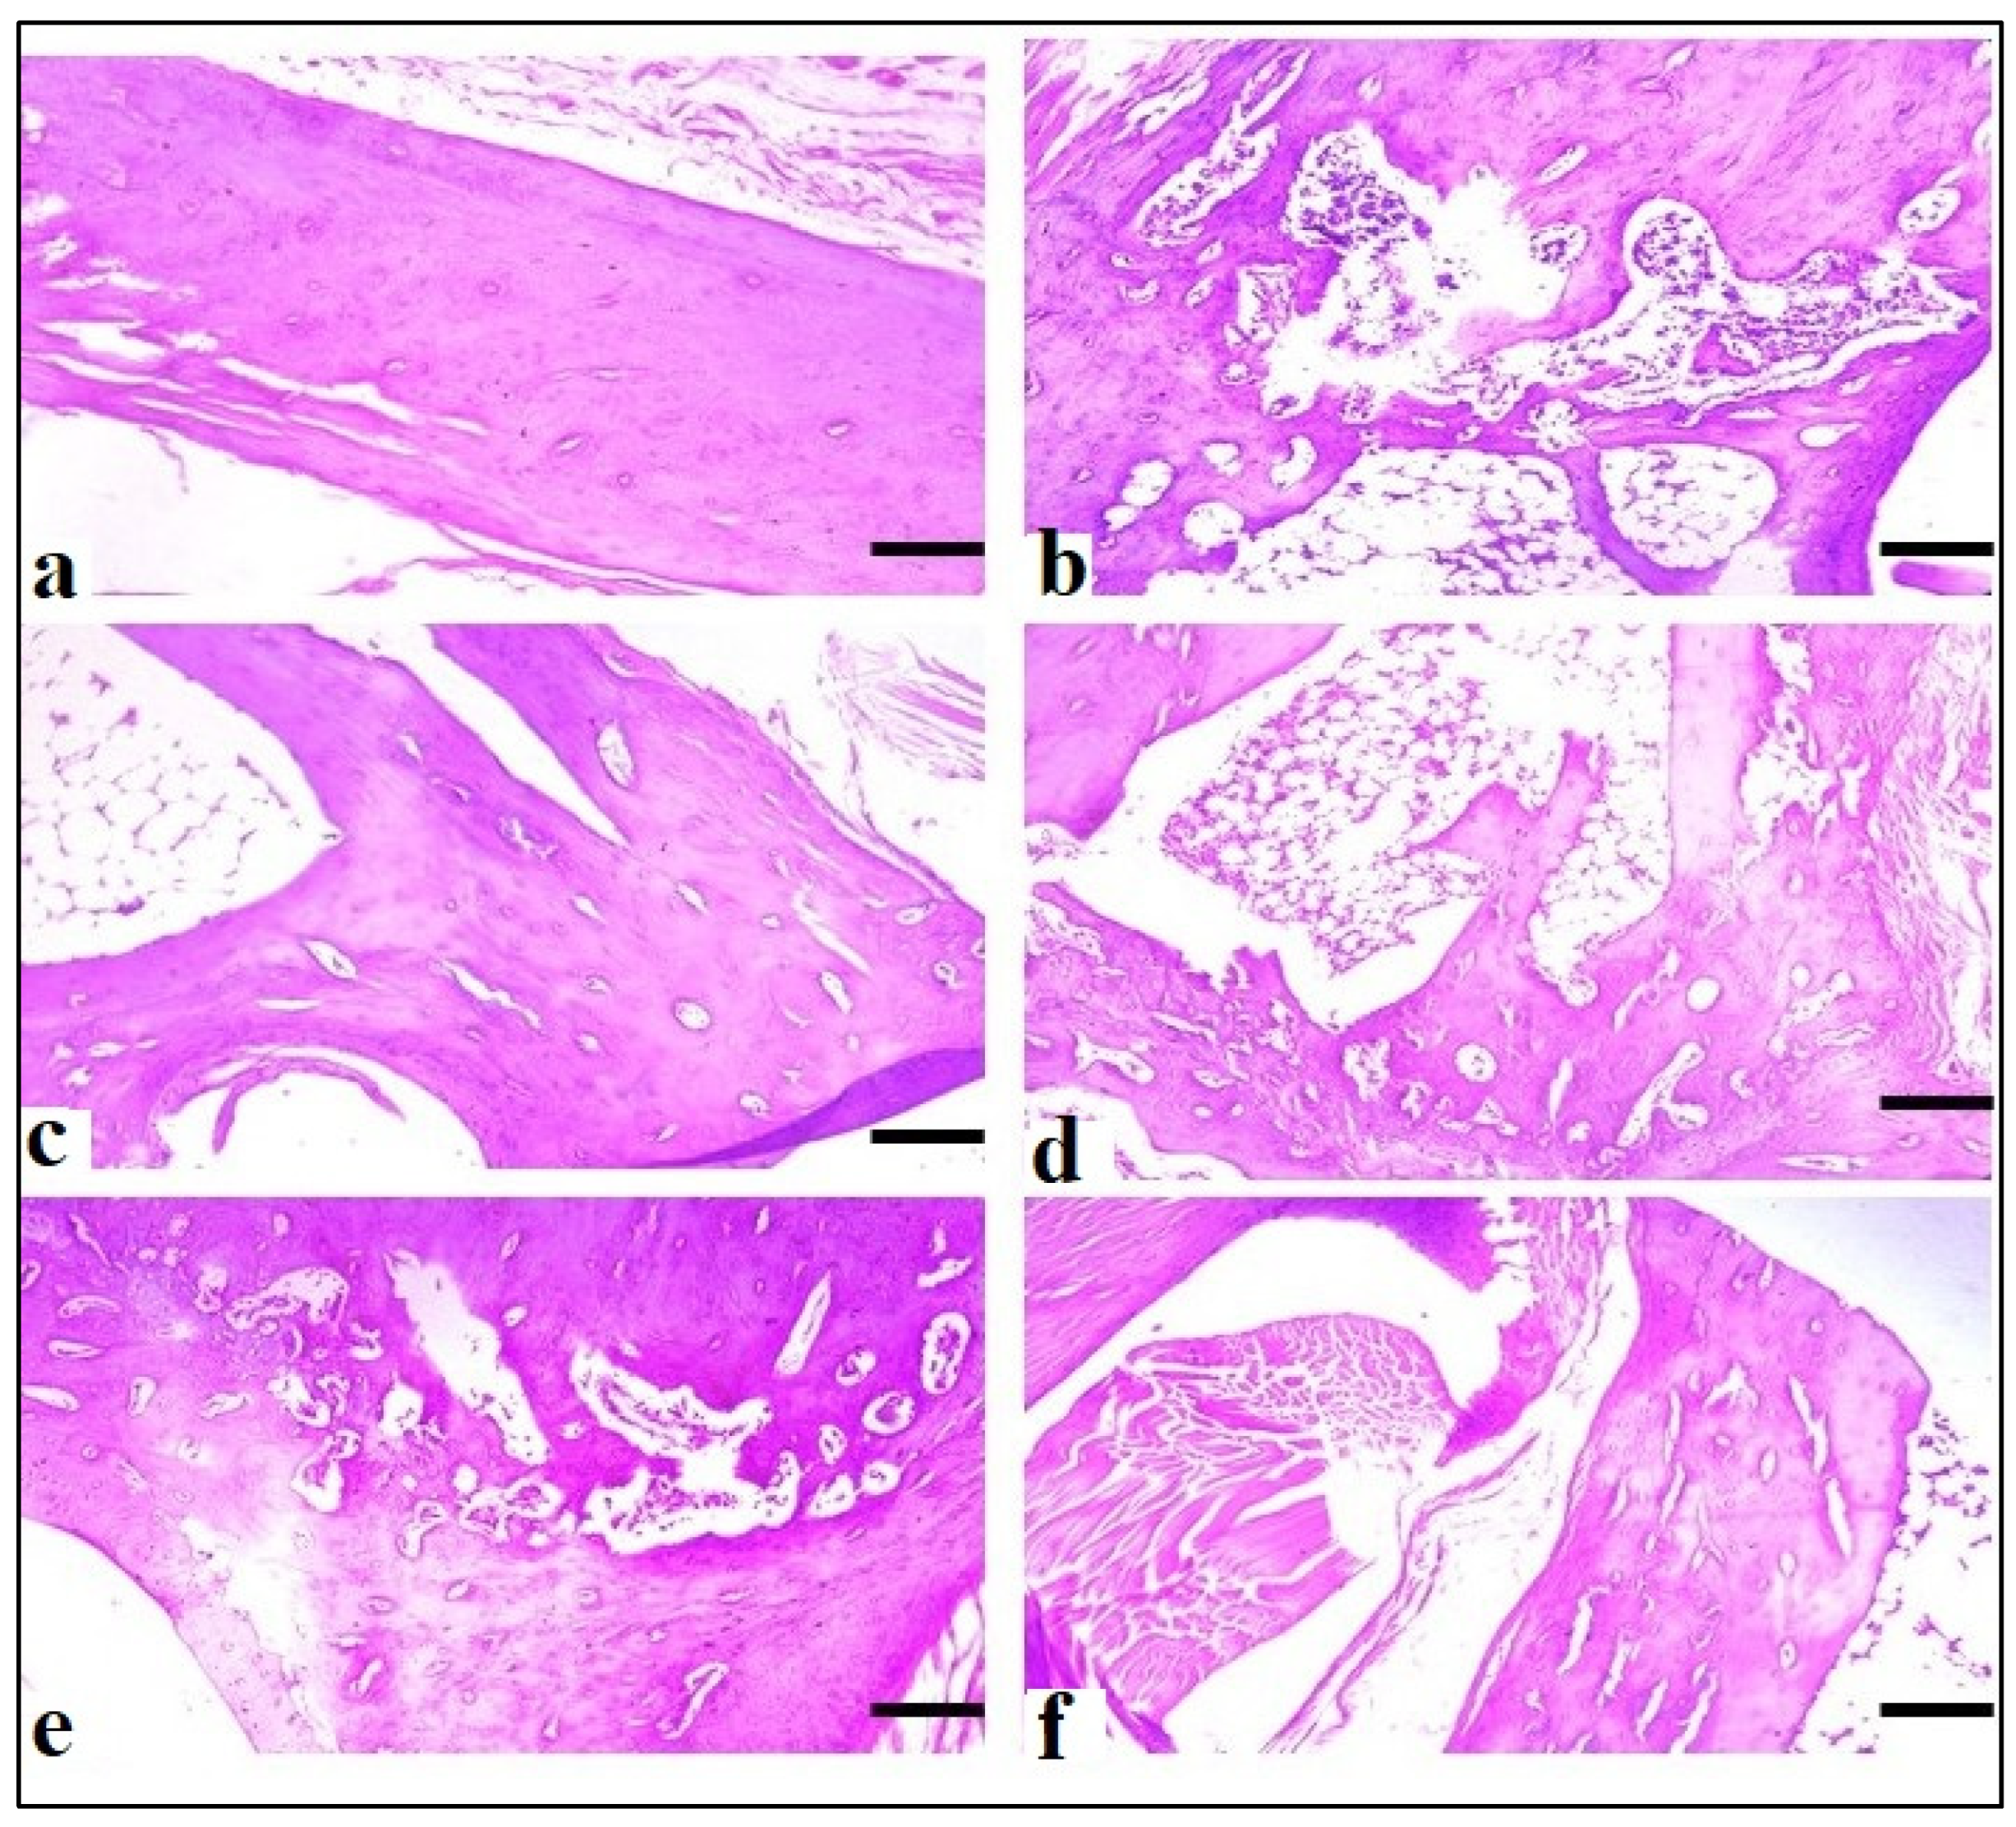
2.6.7. Histopathology of Left Hind Paw
3. Discussion
4. Material and Methods
4.1. Materials
4.2. Experimental Animals
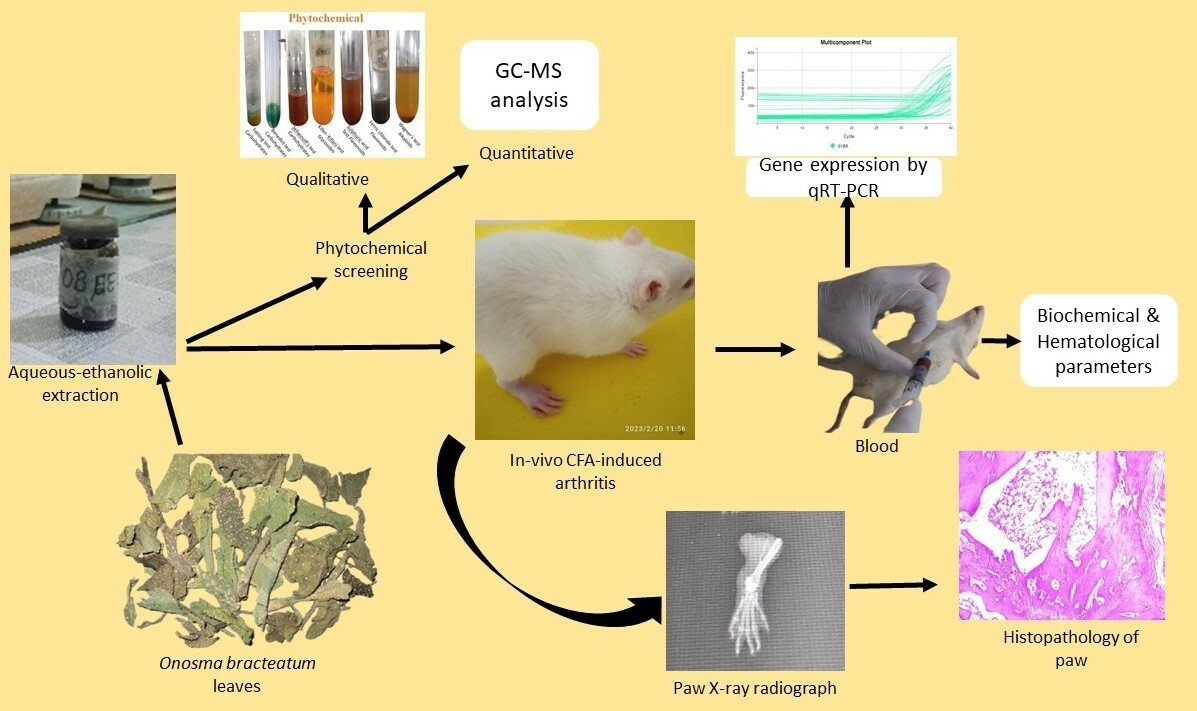
4.3. Plant Assortment
Method for Forming an Aqueous–Ethanolic Extract
4.4. Screening of Phytochemical
4.5. Estimation of Gas Chromatography–Mass Spectrometry (GC-MC)
4.6. In Vitro Antioxidant Activity by 2,2-Diphenyl-1-Picrylhydrazyl Assay
4.7. In Vitro Anti-Inflammatory Activity
4.7.1. Lipoxygenase (LOX) Inhibitory Assay
4.7.2. Human Red Blood Cell (HRBC) Membrane Stabilization Method
4.7.3. Egg Albumin Denaturation Method
4.7.4. Complete Freund’s Adjuvant-Induced Arthritis Model
4.7.5. Paw Diameter
4.7.6. Visual Arthritic Scoring System
4.7.7. Hot Plate/Thermal Hyperalgesia
4.7.8. X-ray and Histopathology
4.7.9. Body Weight Measurements
4.7.10. Quantitative Real-Time Polymerase Chain Reaction (qRT-PCR)
4.7.11. Biochemical and Hematological Estimation
4.8. Statistical Analysis
5. Conclusions
Author Contributions
Funding
Institutional Review Board Statement
Informed Consent Statement
Data Availability Statement
Acknowledgments
Conflicts of Interest
References
- Anyfanti, P.; Triantafyllou, A.; Panagopoulos, P.; Triantafyllou, G.; Pyrpasopoulou, A.; Chatzimichailidou, S.; Koletsos, N.; Botis, I.; Aslanidis, S.; Douma, S. Predictors of impaired quality of life in patients with rheumatic diseases. Clin. Rheumatol. 2016, 35, 1705–1711. [Google Scholar] [CrossRef]
- Akhter, S.; Irfan, H.M.; Alamgeer; Jahan, S.; Shahzad, M.; Latif, M.B. Nerolidol: A potential approach in rheumatoid arthritis through reduction of TNF-α, IL-1β, IL-6, NF-kB, COX-2 and antioxidant effect in CFA-induced arthritic model. Inflammopharmacology 2022, 30, 537–548. [Google Scholar] [CrossRef]
- Agonia, I.; Couras, J.; Cunha, A.; Andrade, A.J.; Macedo, J.; Sousa-Pinto, B. IL-17, IL-21 and IL-22 polymorphisms in rheumatoid arthritis: A systematic review and meta-analysis. Cytokine 2020, 125, 154813. [Google Scholar] [CrossRef] [PubMed]
- Uttra, A.M.; Shahzad, M.; Shabbir, A.; Jahan, S. Ephedra gerardiana aqueous ethanolic extract and fractions attenuate Freund Complete Adjuvant induced arthritis in Sprague Dawley rats by downregulating PGE2, COX2, IL-1β, IL-6, TNF-α, NF-kB and upregulating IL-4 and IL-10. J. Ethnopharmacol. 2018, 224, 482–496. [Google Scholar] [CrossRef] [PubMed]
- De Carvalho, R.B.; De Almeida, A.A.C.; Campelo, N.B.; Lellis, D.R.O.D.; Nunes, L.C.C. Nerolidol and its pharmacological application in treating neurodegenerative diseases: A review. Recent Pat. Biotechnol. 2018, 12, 158–168. [Google Scholar] [CrossRef] [PubMed]
- Khan, S.E.A.; Saeed, M.A.; Batool, S.; Farman, S.; Ahmad, N.M.; Hasni, S.A. A rheumatology curriculum in Pakistan for empowering family physicians and fighting disability. Clin. Rheumatol. 2020, 39, 681–687. [Google Scholar] [CrossRef] [PubMed]
- Khaliq, T.; Khan, A.; Malik, I.A. Clinical profile and treatment outcomes of patients with rheumatoid arthritis at a tertiary care hospital of Pakistan. Age 2020, 70, 1143–1149. [Google Scholar] [CrossRef] [PubMed]
- Nichols, H. What are the causes and types of arthritis? In Medical News Today; Healthline Media UK Ltd.: Brighton, UK, 2017. [Google Scholar]
- Lin, Y.-J.; Anzaghe, M.; Schülke, S. Update on the pathomechanism, diagnosis, and treatment options for rheumatoid arthritis. Cells 2020, 9, 880. [Google Scholar] [CrossRef] [PubMed]
- Saleem, M.; Iftikhar, A.; Asif, M.; Hussain, K.; Alamgeer; Shah, P.A.; Saleem, A.; Akhtar, M.F.; Tanzeem, M.; Yaseen, H.S. Asphodelus tenuifolius extracts arrested inflammation and arthritis through modulation of TNF-α, NF-κB, ILs, and COX-2 activities in in vivo models. Inflammopharmacology 2021, 29, 483–497. [Google Scholar] [CrossRef] [PubMed]
- Akhtar, M.F.; Raza, S.A.; Saleem, A.; Hamid, I.; Ashraf Baig, M.M.F.; Sharif, A.; Sohail, K.; Javaid, Z.; Saleem, U.; Rasul, A. Appraisal of anti-arthritic and anti-inflammatory potential of folkloric medicinal plant Peganum harmala. Endocr. Metab. Immune Disord.-Drug Targets (Former. Curr. Drug Targets-Immune Endocr. Metab. Disord.) 2022, 22, 49–63. [Google Scholar] [CrossRef] [PubMed]
- Singh, S.; Singh, T.G.; Mahajan, K.; Dhiman, S. Medicinal plants used against various inflammatory biomarkers for the management of rheumatoid arthritis. J. Pharm. Pharmacol. 2020, 72, 1306–1327. [Google Scholar] [CrossRef] [PubMed]
- Huang, Q.-C.; Wang, M.-J.; Chen, X.-M.; Yu, W.-L.; Chu, Y.-L.; He, X.-H.; Huang, R.-Y. Can active components of licorice, glycyrrhizin and glycyrrhetinic acid, lick rheumatoid arthritis? Oncotarget 2016, 7, 1193. [Google Scholar] [CrossRef] [PubMed]
- Singh, V.S.; Dhawale, S.C.; Shakeel, F.; Faiyazuddin, M.; Alshehri, S. Antiarthritic Potential of Calotropis procera leaf fractions in FCA-induced arthritic rats: Involvement of cellular inflammatory mediators and other biomarkers. Agriculture 2021, 11, 68. [Google Scholar] [CrossRef]
- Zhang, F.; Zhang, H.; Qian, W.; Xi, Y.; Chang, L.; Wu, X.; Li, M. Matrine exerts antitumor activity in cervical cancer by protective autophagy via the Akt/mTOR pathway in vitro and in vivo. Oncol. Lett. 2022, 23, 110. [Google Scholar] [CrossRef] [PubMed]
- Sun, X.-Y.; Jia, L.-Y.; Rong, Z.; Zhou, X.; Cao, L.-Q.; Li, A.-H.; Guo, M.; Jin, J.; Wang, Y.-D.; Huang, L. Research advances on matrine. Front. Chem. 2022, 10, 867318. [Google Scholar] [CrossRef] [PubMed]
- Ly, T.L.; Phan, T.A.H.; Ma, C.T. Flavonoids from the Rhizomes of Kaempferia Parviflora Wall. Ex Baker. VNU J. Sci. Nat. Sci. Technol. 2023, 39, 100–107. [Google Scholar] [CrossRef]
- Ahmad, F.; Sirat, H.M.; Jamaludin, F.; Mustapha, N.M.a.; Ali, R.M.; Arbain, D.; Aboul-Enein, H.Y. Antimicrobial and anti-inflammatory activities of Piper porphyrophyllum (Fam. Piperaceae). Arab. J. Chem. 2014, 7, 1031–1033. [Google Scholar] [CrossRef]
- Alafe, A.; Elufioye, T.; Faborode, O.; Moody, J. Anti-Inflamatory and Analgesic Activities of Securidaca longepedunculata Fers (Polygalaceae) Leaf and Stem Bark Methanolic Extract. Afr. J. Biomed. Res. 2014, 17, 187–191. [Google Scholar]
- Jeelan Basha, N.; Basavarajaiah, S.; Shyamsunder, K. Therapeutic potential of pyrrole and pyrrolidine analogs: An update. Mol. Divers. 2022, 26, 2915–2937. [Google Scholar] [CrossRef] [PubMed]
- Ullah, H.; Minno, A.D.; Santarcangelo, C.; Tantipongpiradet, A.; Dacrema, M.; Matteo, R.d.; El-Seedi, H.R.; Khalifa, S.A.; Baldi, A.; Rossi, A. In Vitro Bioaccessibility and Anti-Inflammatory Activity of a Chemically Characterized Allium cepa L. Extract Rich in Quercetin Derivatives Optimized by the Design of Experiments. Molecules 2022, 27, 9065. [Google Scholar] [CrossRef] [PubMed]
- Asghari, A.; Ghanbary, T.; Bakhshi, M.; Babaeizad, V. Bioactive potential and GC-MS fingerprinting of extracts from endophytic fungi associated with seeds of some medicinal plants. Mycol. Iran. 2023, 10, 55–67. [Google Scholar]
- Devi, R.B.; Barkath, T.; Vijayaraghavan, P.; Rejiniemon, T. Gc-Ms Analysis of Phytochemical From Psidium guajava Linn Leaf Extract and Their Invitro Antimicrobial Activities. Int. J. Pharma Biol. Sci. 2018, 8, 583–589. [Google Scholar]
- Tiwari, R.K.; Chanda, S.; Singh, M.; Agarwal, S. Anti-inflammatory and anti-arthritic potential of standardized extract of Clerodendrum serratum (L.) Moon. Front. Pharmacol. 2021, 12, 629607. [Google Scholar] [CrossRef] [PubMed]
- Farooq, S.; Shaheen, G.; Asif, H.M.; Aslam, M.R.; Zahid, R.; Rajpoot, S.R.; Jabbar, S.; Zafar, F. Preliminary phytochemical analysis: In-Vitro comparative evaluation of anti-arthritic and anti-inflammatory potential of some traditionally used medicinal plants. Dose-Response 2022, 20, 15593258211069720. [Google Scholar] [CrossRef] [PubMed]
- Saleem, A.; Khalid, H.; Akhtar, M.F.; Zeb, A. HPLC-DAD analysis, anti-inflammatory and anti-arthritic potentials of Coronopus didymus (L.) Sm. extracts: Effects on pro-and anti-inflammatory cytokines, COX-2, I-κβ, NF-κβ and oxidative stress biomarkers. Food Funct. 2022, 13, 6244–6258. [Google Scholar] [CrossRef] [PubMed]
- Haider, S.I.; Asif, A.; Rasheed, H.M.F.; Akram, A.; Jabeen, Q. Caralluma tuberculata exhibits analgesic and anti-arthritic potential by downregulating pro-inflammatory cytokines and attenuating oxidative stress. Inflammopharmacology 2022, 30, 621–638. [Google Scholar] [CrossRef] [PubMed]
- Dias, M.C.; Pinto, D.C.; Silva, A.M. Plant flavonoids: Chemical characteristics and biological activity. Molecules 2021, 26, 5377. [Google Scholar] [CrossRef] [PubMed]
- Apel, F.; Zychlinsky, A.; Kenny, E.F. The role of neutrophil extracellular traps in rheumatic diseases. Nat. Rev. Rheumatol. 2018, 14, 467–475. [Google Scholar] [CrossRef] [PubMed]
- Patil, K.R.; Mahajan, U.B.; Unger, B.S.; Goyal, S.N.; Belemkar, S.; Surana, S.J.; Ojha, S.; Patil, C.R. Animal models of inflammation for screening of anti-inflammatory drugs: Implications for the discovery and development of phytopharmaceuticals. Int. J. Mol. Sci. 2019, 20, 4367. [Google Scholar] [CrossRef] [PubMed]
- Shabbir, A.; Batool, S.A.; Basheer, M.I.; Shahzad, M.; Sultana, K.; Tareen, R.B.; Iqbal, J. Ziziphora clinopodioides ameliorated rheumatoid arthritis and inflammatory paw edema in different models of acute and chronic inflammation. Biomed. Pharmacother. 2018, 97, 1710–1721. [Google Scholar] [CrossRef]
- Williams, R. Rodent models of arthritis: Relevance for human disease. Clin. Exp. Immunol. 1998, 114, 330–332. [Google Scholar] [CrossRef] [PubMed]
- Seo, J.-Y.; Kim, T.-H.; Kang, K.-R.; Lim, H.; Choi, M.-C.; Kim, D.K.; Chun, H.S.; Kim, H.-J.; Yu, S.-K.; Kim, J.-S. 7α, 25-Dihydroxycholesterol-induced oxiapoptophagic chondrocyte death via the modulation of p53-Akt-mTOR axis in osteoarthritis pathogenesis. Mol. Cells 2023, 46, 245–255. [Google Scholar] [CrossRef] [PubMed]
- Ding, H.; Mei, X.; Li, L.; Fang, P.; Guo, T.; Zhao, J. RUNX1 ameliorates rheumatoid arthritis progression through epigenetic inhibition of LRRC15. Mol. Cells 2023, 46, 231–244. [Google Scholar] [CrossRef] [PubMed]
- Foyet, H.S.; Tsala, D.E.; Bodo, J.Z.E.; Carine, A.N.; Heroyne, L.T.; Oben, E.K. Anti-inflammatory and anti-arthritic activity of a methanol extract from Vitellaria paradoxa stem bark. Pharmacogn. Res. 2015, 7, 367. [Google Scholar] [CrossRef] [PubMed]
- Voon, F.-L.; Sulaiman, M.R.; Akhtar, M.N.; Idris, M.F.; Akira, A.; Perimal, E.K.; Israf, D.A.; Ming-Tatt, L. Cardamonin (2′, 4′-dihydroxy-6′-methoxychalcone) isolated from Boesenbergia rotunda (L.) Mansf. inhibits CFA-induced rheumatoid arthritis in rats. Eur. J. Pharmacol. 2017, 794, 127–134. [Google Scholar] [CrossRef] [PubMed]
- Weng, W.; Wang, F.; He, X.; Zhou, K.; Wu, X.; Wu, X. Protective effect of corynoline on the CFA induced rheumatoid arthritis via attenuation of oxidative and inflammatory mediators. Mol. Cell. Biochem. 2021, 476, 831–839. [Google Scholar] [CrossRef] [PubMed]
- Dhandapani, R.; Sabna, B. Phytochemical constituents of some Indian medicinal plants. Anc. Sci. Life 2008, 27, 1–8. [Google Scholar] [PubMed]
- Jabbar, A.A.; Abdullah, F.O.; Hassan, A.O.; Galali, Y.; Hassan, R.R.; Rashid, E.Q.; Salih, M.I.; Aziz, K.F. Ethnobotanical, phytochemistry, and pharmacological activity of Onosma (Boraginaceae): An updated review. Molecules 2022, 27, 8687. [Google Scholar] [CrossRef] [PubMed]
- Perumal, S.S.; Ekambaram, S.P.; Dhanam, T. In vivo antiarthritic activity of the ethanol extracts of stem bark and seeds of Calophyllum inophyllum in Freund’s complete adjuvant induced arthritis. Pharm. Biol. 2017, 55, 1330–1336. [Google Scholar] [CrossRef] [PubMed]
- Younus, M.; Hasan, M.M.; Ahmad, K.; Haq, I.; Ahmad, R.; Nasir, B.; Amin, A.; Shirazi, J.H.; Hanif, M.; Shaheen, G. Evaluation of Hepato-protective and Nephron-Protective Potential of Euphorbia nivulia Buch.-Ham. Against Carbon Tetrachloride-induced Toxicity in Sprague Dawley Rats. J. Pharm. Res. Int. 2021; 33, 83–100. [Google Scholar] [CrossRef]
- Zinjarde, S.S.; Bhargava, S.Y.; Kumar, A.R. Potent α-amylase inhibitory activity of Indian Ayurvedic medicinal plants. BMC Complement. Altern. Med. 2011, 11, 5. [Google Scholar]
- Ahmad, S.; Hassan, A.; Rehman, T.; Basit, A.; Tahir, A.; Arshad, M.A. In vitro bioactivity of extracts from seeds of Cassia absus L. growing in Pakistan. J. Herb. Med. 2019, 16, 100258. [Google Scholar] [CrossRef]
- Ondua, M.; Njoya, E.M.; Abdalla, M.A.; McGaw, L.J. Anti-inflammatory and antioxidant properties of leaf extracts of eleven South African medicinal plants used traditionally to treat inflammation. J. Ethnopharmacol. 2019, 234, 27–35. [Google Scholar] [CrossRef] [PubMed]
- Abbas, M.W.; Hussain, M.; Qamar, M.; Ali, S.; Shafiq, Z.; Wilairatana, P.; Mubarak, M.S. Antioxidant and anti-inflammatory effects of Peganum harmala extracts: An in vitro and in vivo study. Molecules 2021, 26, 6084. [Google Scholar] [CrossRef] [PubMed]


| Sr. NO. | Class of Secondary Metabolites | Result |
|---|---|---|
| 1 | Tannins | + |
| 2 | Flavonoids | + |
| 3 | Saponins | + |
| 4 | Alkaloids | + |
| 5 | Glycosides | + |
| 6 | Carbohydrates | + |
| 7 | Phenolic compounds | + |
| S. No. | Compound | M.W | Formula | Class | RT | Area % | Biological Activities | Ref. |
|---|---|---|---|---|---|---|---|---|
| 1. | Matrine | 248 | C15H24N2O | Alkaloid | 3.94 | 3.09 | Antitumor, anti-inflammatory | [15,16] |
| 2. | 3′,4′,5,7-Tetramethoxyflavone | 342 | C19H18 O6 | Flavonoid | 6.02 | 0.29 | Antioxidant | [17] |
| 3. | 6-ethyl-2,3,5,7-tetrahydroxy, 1,4-Naphthoquinone | 250 | C12H10O6 | Spinochrome | 10.15 | 0.92 | Anti-inflammatory, Antimicrobial | [18] |
| 4. | Thebaine | 311 | C19H21NO3 | Opiate alkaloid | 10.82 | 0.64 | Analgesic | [19] |
| 5. | Pyrrolidine | 207 | C14H25N | Alkaloid | 15.16 | 0.57 | Anticancer, anti-inflammatory, antiviral, anti-tuberculosis | [20] |
| 6. | Quercetin-4’-glucoside | 464 | C21H20O12 | Flavonoid o-glycosides | 15.65 | 0.54 | Antioxidant, anti-inflammatory | [21] |
| 7. | Cyclohexane, 1,1′-(2-methyl-1,3 propanediyl) bis- | 222 | C16H30 | - | 20.62 | 1.07 | Antioxidant | [22] |
| 8. | 2,4,6-Cycloheptatrien-1-one,3,5-bis-trimethylsilyl- | 250 | C13H22OSi2 | - | 26.65 | 16.73 | Antioxidant, antimicrobial | [23] |
| Time (Days) | Group-I (Normal Control) | Group-II (Negative) | Group-III (Standard) | Group-IV (AeOB, 250 mg/kg) | Group-V (AeOB, 500 mg/kg) | Group-VI (AeOB, 750 mg/kg) |
|---|---|---|---|---|---|---|
| TNF-α | 0.5019 ± 0.03 * | 1.0002 ± 0.02 | 0.004 ± 0.00 *** | 7.32 07 ± 0.77 * | 2.19 ± 0.39 *** | 0.36 ± 0.43 *** |
| IL-6 | 0.0301± 0.00 *** | 1.0015 ± 0.06 | 0.001 ± 0.00 *** | 0.385 ± 0.04 *** | 0.0052 ± 0.00 *** | 0.002 ± 0.00 *** |
| Time (Days) | Group-II (Normal) | Group-II (Negative) | Group-III (Standard) | Group-IV (AeOB, 250 mg/kg) | Group-V (AeOB, 500 mg/kg) | Group-VI (AeOB, 750 mg/kg) |
|---|---|---|---|---|---|---|
| CRP | 1.00 ± 0.00 | 4.92 ± 0.05 | 1.09 ± 0.03 *** | 3.84 ± 0.17 *** | 2.50 ± 0.17 *** | 1.40 ± 0.03 *** |
| Histopathological Lesions | Groups | |||||
|---|---|---|---|---|---|---|
| Group-I (Normal) | Group-II (Arthritic) Control | Group-III (Standard) | Group-IV (AeOB, 250 mg) | Group-V (AeOB, 500 mg) | Group-VI (AeOB, 750 mg) | |
| Cartilage | ||||||
| Cartilage matrix destruction | − | ++++ | + | +++ | ++ | + |
| Degeneration and resorption | − | ++++ | + | +++ | ++ | + |
| Inflammatory cell infiltration | − | ++++ | + | +++ | ++ | + |
| Joint/synovial space narrowing | − | ++++ | + | +++ | ++ | + |
| Cellular infiltration with granuloma | − | ++++ | + | +++ | ++ | + |
| Edema | − | ++++ | + | +++ | ++ | + |
| Macrophage infiltration | − | ++++ | + | +++ | ++ | + |
| Synovial membrane | ||||||
| Hyperplasia of covering cells | − | ++++ | + | +++ | ++ | + |
| Marker | Sequence | Forward/Reverse |
|---|---|---|
| TNF-α | 5′-ATGGGCTCCCTCTCATCAGT-3′ | Forward |
| 5′-GCTTGGTGGTTTGCTACGAC-3′ | Reverse | |
| IL-6 | 5′-CCCACCAGGAACGAAAGTCA-3′ | Forward |
| 5′-ACTGGCTGGAAGTCTCTTGC-3′ | Reverse |
Disclaimer/Publisher’s Note: The statements, opinions and data contained in all publications are solely those of the individual author(s) and contributor(s) and not of MDPI and/or the editor(s). MDPI and/or the editor(s) disclaim responsibility for any injury to people or property resulting from any ideas, methods, instructions or products referred to in the content. |
© 2024 by the authors. Licensee MDPI, Basel, Switzerland. This article is an open access article distributed under the terms and conditions of the Creative Commons Attribution (CC BY) license (https://creativecommons.org/licenses/by/4.0/).
Share and Cite
Zafar, F.; Shaheen, G.; Asif, H.M.; Farhan, M.; Muteeb, G.; Aatif, M. Onosma bracteatum Wall Aqueous–Ethanolic Extract Suppresses Complete Freund’s Adjuvant-Induced Arthritis in Rats via Regulation of TNF-α, IL-6, and C-Reactive Protein. Molecules 2024, 29, 1830. https://doi.org/10.3390/molecules29081830
Zafar F, Shaheen G, Asif HM, Farhan M, Muteeb G, Aatif M. Onosma bracteatum Wall Aqueous–Ethanolic Extract Suppresses Complete Freund’s Adjuvant-Induced Arthritis in Rats via Regulation of TNF-α, IL-6, and C-Reactive Protein. Molecules. 2024; 29(8):1830. https://doi.org/10.3390/molecules29081830
Chicago/Turabian StyleZafar, Farah, Ghazala Shaheen, Hafiz Muhammad Asif, Mohd Farhan, Ghazala Muteeb, and Mohammad Aatif. 2024. "Onosma bracteatum Wall Aqueous–Ethanolic Extract Suppresses Complete Freund’s Adjuvant-Induced Arthritis in Rats via Regulation of TNF-α, IL-6, and C-Reactive Protein" Molecules 29, no. 8: 1830. https://doi.org/10.3390/molecules29081830