
Design, Structure–Activity Relationships, and Computational Modeling Studies of a Series of α-Helix Biased, Ultra-Short Glucagon-like Peptide-1 Receptor Agonists

 , ,
, ,
Abstract
:1. Introduction
2. Results and Discussion
2.1. Phe6 Modifications
2.2. Ala-Scanning
2.3. Aib-Scanning
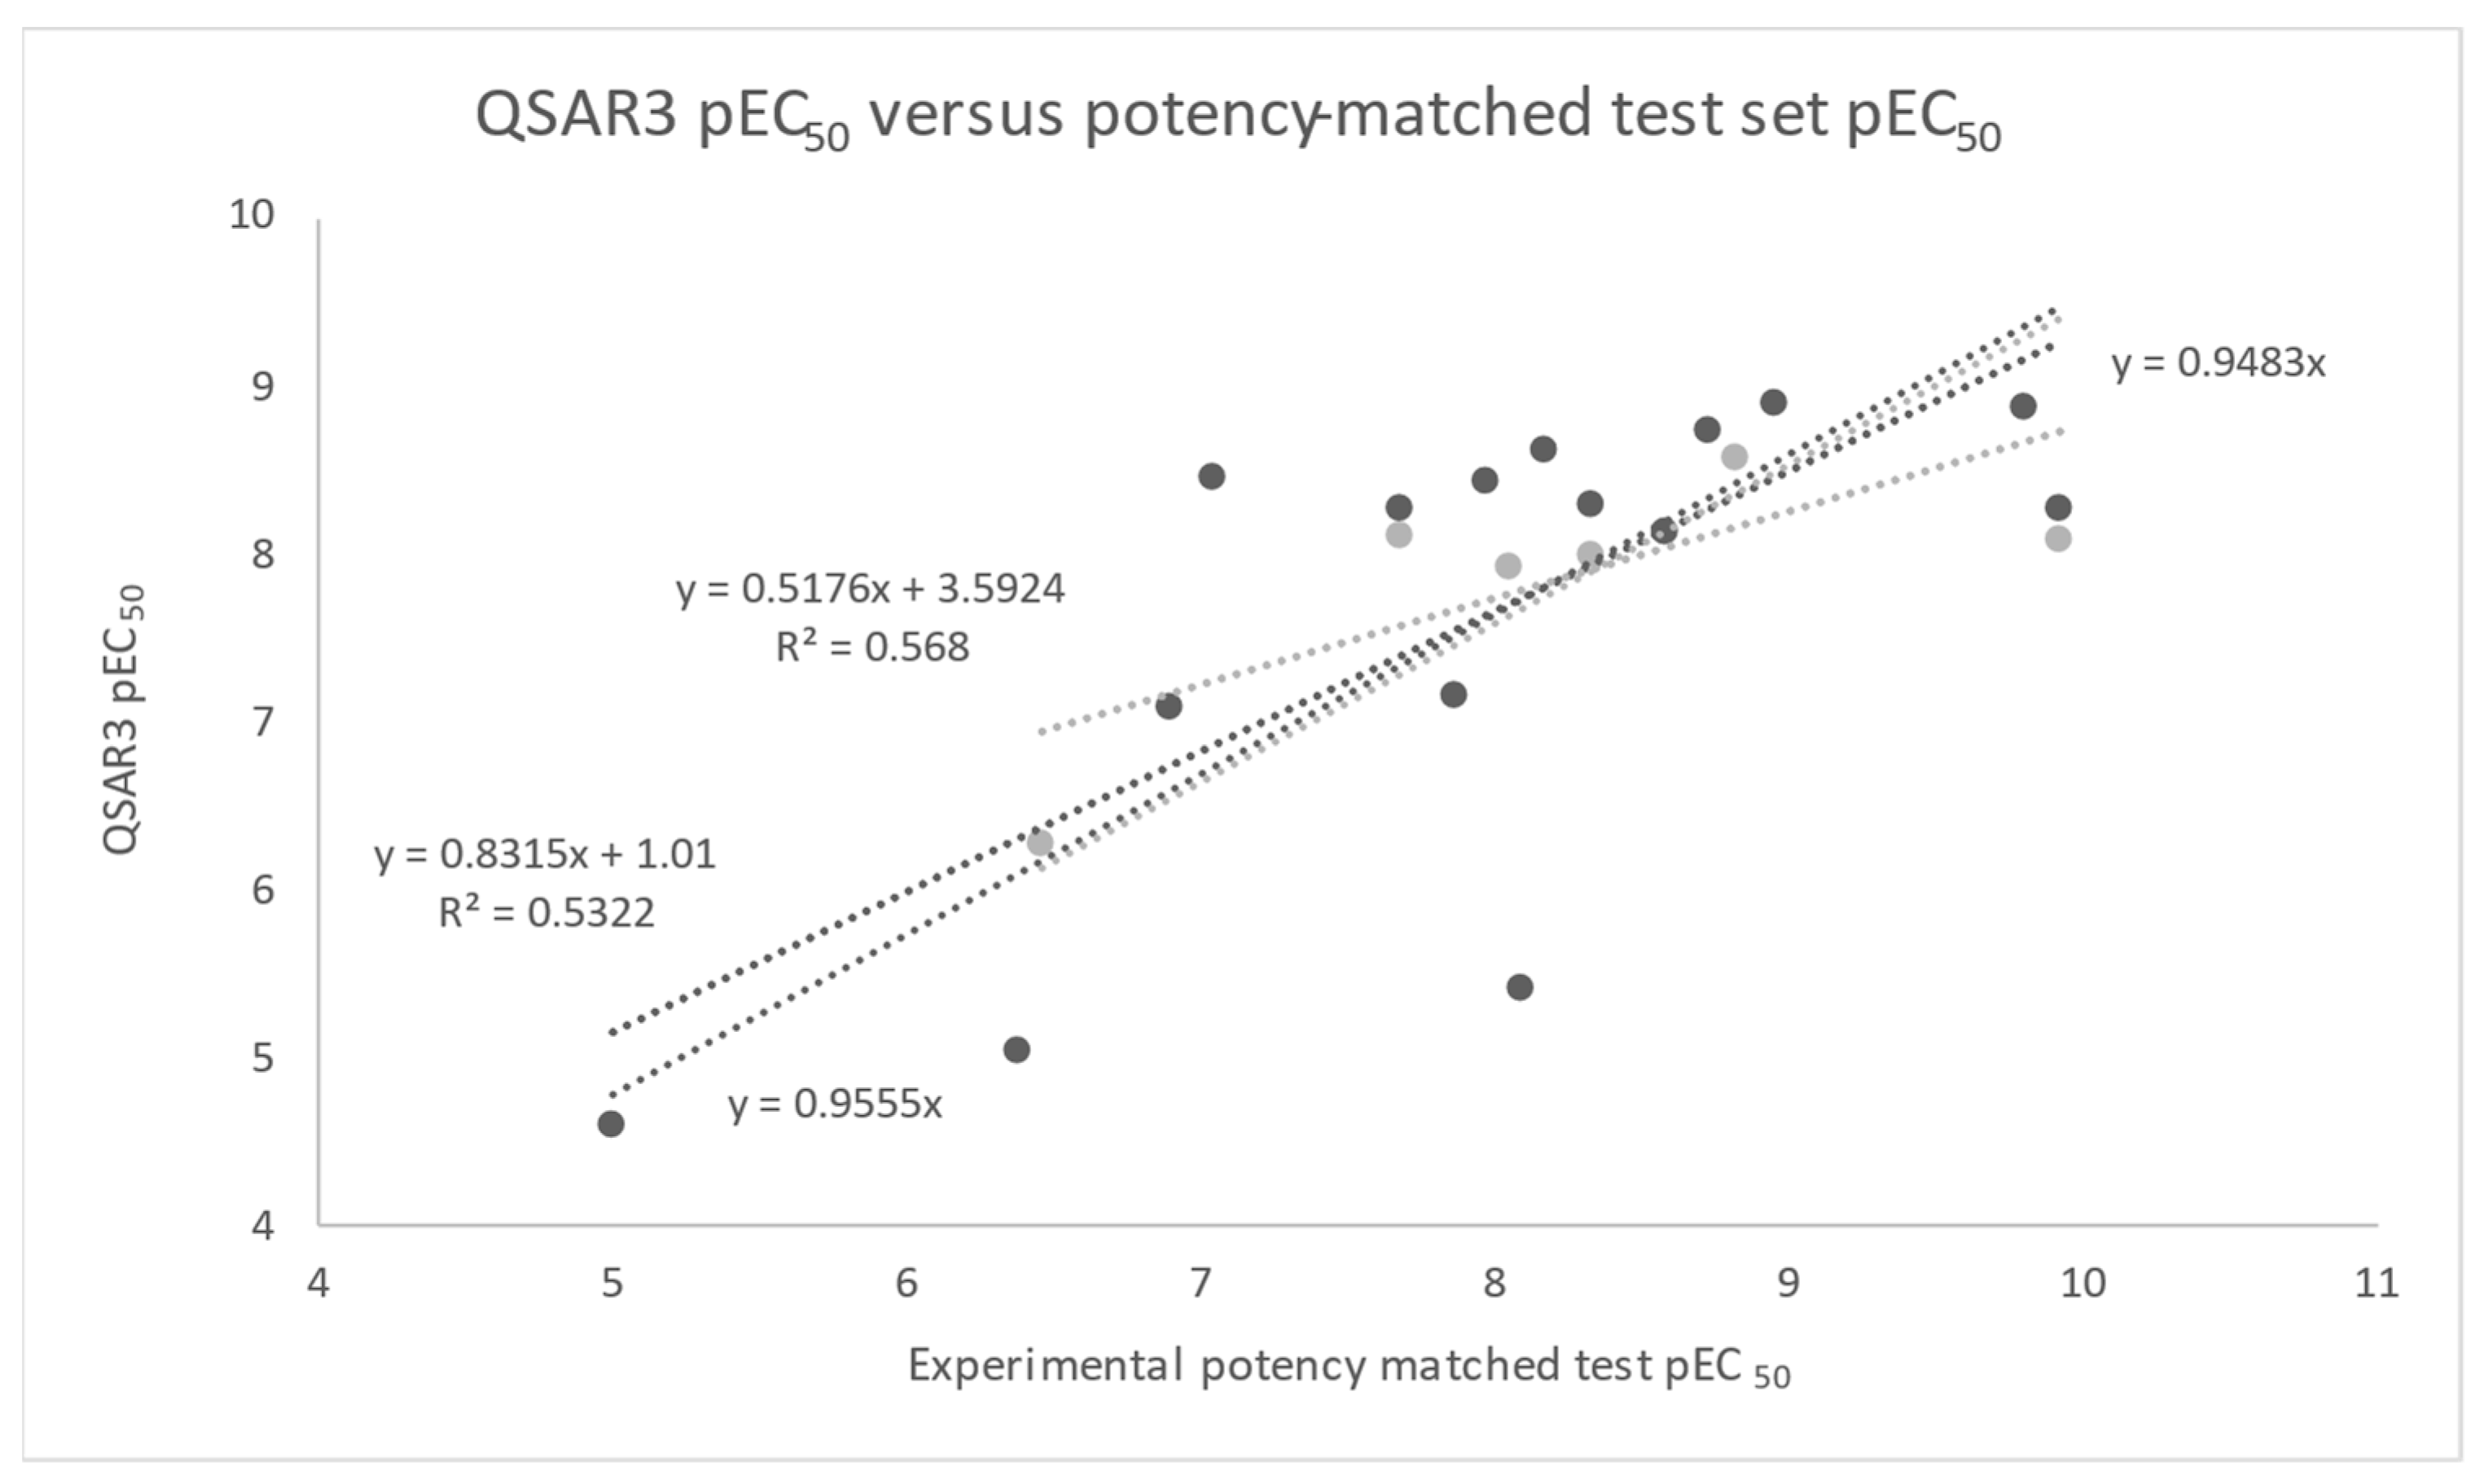
2.4. Computational Modeling and Comparative Analysis of GLP-1/GLP-R-Based and Non-GLP-1/GLP-1R-Based QSAR Analysis of Phe6 Modification, Ala-Scanning, and Aib-Scanning
3. Materials and Methods
3.1. Peptide Synthesis, Purification, and Characterization
3.2. GLP-1 Receptor Agonism Assay
3.3. Computational Structural Modeling and QSAR Model Development, Validation, and Testing
3.3.1. Peptide/Receptor Structural Modeling Using Sampler and YASARA
Initial Model Building of the RXL-100:GLP-1R Complex
Phe, Ala-Scan, and Aib-Scan Chemical Modifications and Structural Modeling
Physics-Based QSAR Descriptors and Calculations
Cation-π count + Pi-Pi count + Ion-Ion count
Cation-π energy +Pi-Pi energy + Ion-Ion energy
QSAR Model Training
QSAR Model Validation and Selection Using Two Approaches
QSAR Model Testing
4. Conclusions and Future Directions
Supplementary Materials
Author Contributions
Funding
Institutional Review Board Statement
Informed Consent Statement
Data Availability Statement
Acknowledgments
Conflicts of Interest
Abbreviations
| MLR | Multiple linear regression |
| SW-MLR | Stepwise multiple linear regression |
| R2 | Correlation (R) squared goodness-of-fit for training set MLR/experimental data |
| R2adj | Parameter adjusted goodness-of-fit for the training set MLR/experimental data |
| p(f-test) | f-test probability of regression model |
| p(t-test) | t-test probability of regression model terms |
| VIF | Variance inflation factor obtained in regression analysis |
| Q2 | Leave-one-out cross-validation R2 obtained using a training set |
| AIC | Akaike Information Criterion |
| AICc | Corrected Akaike Information Criterion |
| R2pred | Correlation (R) squared goodness-of-fit for test set predictions |
| RMSE | Root mean squared error for training set MLR/experimental data |
| RMSEpred | Root mean squared error for test set predictions |
References
- Nauk, M.A.; Quast, D.R.; Wefers, J.; Meier, J.J. GLP-1 receptor agonists in the treatment of type 2 diabetes –– state-of-the-art. Mol. Metab. 2021, 46, 101102. [Google Scholar] [CrossRef]
- Suzuki, R.; Brown, G.A.; Christopher, J.A.; Scully, C.C.G.; Congress, M. Recent developments in therapeutic peptides for the glucagon-like peptide 1 and 2 receptors. J. Med. Chem. 2020, 63, 905–927. [Google Scholar] [CrossRef] [PubMed]
- Knudsen, L.B.; Lau, J. The discovery and development of liraglutide and semaglutide. Front. Endocrinol. 2019, 10, 155. [Google Scholar] [CrossRef] [PubMed]
- Mojsov, S.; Weir, G.C.; Habener, J.F. Insulinotropin: Glucagon-like peptide I (7-37) co-encoded in the glucagon gene is a potent stimulator of insulin release in the perfused rat pancreas. J. Clin. Investig. 1987, 79, 616–619. [Google Scholar] [CrossRef]
- Agersø, H.; Jensen, L.B.; Elbrønd, B.; Rolan, P.; Zdravkovic, M. The pharmacokinetics, pharmacodynamics, safety and tolerability of NN2211, a new long-acting GLP-1 derivative, in healthy men. Diabetologia 2002, 45, 195–202. [Google Scholar] [CrossRef]
- Naver, S.V.; Jimenez-Solem, E.; Christensen, M.; Andersen, J.T.; Knop, F.K. Dulaglutide: A novel once-weekly glucagon-like peptide-1 receptor agonist. Clin. Investig. 2014, 4, 729–743. [Google Scholar] [CrossRef]
- Lau, J.; Bloch, P.; Schäffer, L.; Pettersson, I.; Spetzler, J.; Kofoed, J.; Madsen, K.; Knudsen, L.B.; McGuire, J.; Steensgaard, D.B.; et al. Discovery of the once-weekly glucagon-like peptide-1 (GLP-1) analogue semaglutide. J. Med. Chem. 2015, 58, 7370–7380. [Google Scholar] [CrossRef]
- Sawyer, J.S. Structure-Activity Studies of α-melanotropin and Ultra-Short GLP-1 Analogs to Benchmark the Development of Improved Anti-Obesity Drugs. Ph.D. Dissertation, The University of Arizona, Tucson, AZ, USA, 16 December 2022. [Google Scholar]
- Adelhorst, K.; Hedegaard; Knudsen, L.B.; Kirk, O. Structure-activity studies of glucagon-like peptide-1. J. Biol. Chem. 1994, 269, 6275–6278. [Google Scholar] [CrossRef] [PubMed]
- Gallwitz, B.; Witt, M.; Paetzold, G.; Morys-Wortmann, C.; Zimmerman, B.; Eckart, K.; Folsch, U.R.; Schmidt, W.E. Structure/activity characterization of glucagon-like peptide-1. Eur. J. Biochem. 1994, 225, 1151–1156. [Google Scholar] [CrossRef]
- Mapelli, C.; Natarajan, S.I.; Meyer, J.P.; Bastos, M.M.; Bernatowicz, M.S.; Lee, V.G.; Pluscec, J.; Riexinger, D.J.; Sieber-McMaster, E.S.; Constantine, K.L.; et al. Eleven amino acid glucagon-like peptide-1 receptor agonists with antidiabetic activity. J. Med. Chem. 2009, 52, 7788–7799. [Google Scholar] [CrossRef]
- Haque, T.S.; Lee, V.G.; Riexinger, D.; Lei, M.; Malmstrom, S.; Xin, L.; Han, S.; Mapelli, C.; Cooper, C.B.; Zhang, G.; et al. Identification of potent 11-mer glucagon-like peptide-1 receptor peptides with novel c-terminal amino acids: Homohomophenylalanine analogs. Peptides 2010, 31, 950–955. [Google Scholar] [CrossRef]
- Haque, T.S.; Martinez, R.L.; Lee, V.G.; Riexinger, D.G.; Lei, M.; Feng, M.; Koplowitz, B.; Mapelli, C.; Cooper, C.B.; Zhang, G.; et al. Exploration of structure-activity relationships at the two c-terminal residues of potent 11-mer glucagon-like peptide-1 receptor agonist peptides via parallel synthesis. Peptides 2010, 31, 1353–1360. [Google Scholar] [CrossRef]
- Yabut, J.M.; Drucker, D.J. Glucagon-like peptide-1 receptor-based therapeutics for metabolic liver disease. Endocr. Rev. 2023, 44, 14–32. [Google Scholar] [CrossRef]
- Palani, A.; Nawrocki, A.R.; Orvieto, F.; Bianchi, E.; Mandic, E.; Pessi, A.; Huang, C.; Deng, Q.; Toussaint, N.; Walsh, E.; et al. Discovery of MK-1462: GlP-1 and glucagon receptor dual agonist for the treatment of obesity and diabetes. ACS Med. Chem. Lett. 2022, 13, 1248–1254. [Google Scholar] [CrossRef] [PubMed]
- Griffith, D.A.; Edmonds, D.J.; Fortin, J.P.; Kalgutkar, A.S.; Kuzmiski, J.B.; Loria, P.M.; Saxena, A.R.; Bagley, S.W.; Buckeridge, C.; Curto, J.M.; et al. A small molecule oral agonist of the human glucagon-like peptide-1 receptor. J. Med. Chem. 2022, 65, 8208–8226. [Google Scholar] [CrossRef]
- Cong, Z.; Zhou, Q.; Li, Y.; Chen, L.N.; Zhang, Z.C.; Liang, A.; Liu, Q.; Wu, X.; Dai, A.; Xia, T.; et al. Structural basis of peptidomimetic agonist revealed by small-molecule GLP-1R agonists Boc5 and WB4-24. Proc. Natl. Acad. Sci. USA 2022, 119, e2200155119. [Google Scholar] [CrossRef]
- Girdhar, K.; Thakur, S.; Gaur, P.; Choubey, A.; Dogra, S.; Dehury, B.; Kumar, S.; Biswas, B.; Dwivedi, D.K.; Ghosh, S.; et al. Design, synthesis, and biological evaluation of a small molecule oral agonist or the glucagon-like-peptide-1 receptor. J. Biol. Chem. 2022, 298, 101889. [Google Scholar] [CrossRef]
- Decara, J.M.; Vazquez-Villa, H.; Brea, J.; Alonso, M.; Srivastava, R.K.; Orio, L.; Alen, F.; Suarez, J.; Baixeras, E.; Garcia-Carceles, J.; et al. Discovery of V-0219: A small-molecule positive allosteric modulator of the glucagon-like peptide-1 receptor toward oral treatment for “diabesity. J. Med. Chem. 2022, 65, 5449–5461. [Google Scholar] [CrossRef]
- Zhang, Y.; Sun, B.; Feng, D.; Hu, H.; Chu, M.; Qu, Q.; Tarrasch, J.T.; Li, S.; Sun Kobilka, T.; Kobilka, B.K.; et al. Cryo-EM structure of the activated GLP-1 receptor in complex with a G protein. Nature 2017, 546, 248–253. [Google Scholar] [CrossRef]
- Liang, Y.L.; Khoshouei, M.; Glukhova, A.; Furness, S.G.B.; Zhao, P.; Clydesdale, L.; Koole, C.; Truong, T.T.; Thal, D.M.; Lei, S.; et al. Phase-plate cryo-EM structure of a biased agonist-bound human GLP-1 receptor-Gs complex. Nature 2018, 555, 121–125. [Google Scholar] [CrossRef] [PubMed]
- Oddo, A.; Mortensen, S.; Thogersen, H.; De Maria, L.; Hennen, S.; McGuire, J.N.; Kofoed, J.; Linderoth, L.; Reedtz-Runge, S. α-Helix or β-turn? An investigation into N-terminally constrained analogues of glucagon-like peptide-1 (GLP-1) and exendin-4. Biochemistry 2018, 57, 4148–4154. [Google Scholar] [CrossRef]
- Zhang, X.; Belousoff, M.J.; Zhao, P.; Kooistra, A.J.; Truong, T.T.; Ang, S.Y.; Underwood, C.R.; Egebjerg, T.; Šenel, P.; Stewart, G.D.; et al. Differential GLP-1R binding and activation and peptide and non-peptide agonists. Mol. Cell 2020, 80, 486–500. [Google Scholar] [CrossRef] [PubMed]
- Jazayeri, A.; Rappas, M.; Brown, A.J.H.; Kean, J.; Errey, J.C.; Robertson, N.J.; Fiez-Vandal, C.; Andrews, S.P.; Congreve, M.; Bortolato, A.; et al. Crystal structure of the GLP-1 receptor bound to a peptide agonist. Nature 2017, 546, 254–258. [Google Scholar] [CrossRef]
- Zhao, P.; Liang, Y.L.; Belousoff, M.J.; Deganutti, G.; Fletcher, M.M.; Willard, F.S.; Bell, M.G.; Christe, M.E.; Sloop, K.W.; Inoue, A.; et al. Activation of the GLP-1 receptor by a non-peptide agonist. Nature 2020, 577, 432–436. [Google Scholar] [CrossRef] [PubMed]
- YASARA. Available online: http://www.yasara.org (accessed on 1 July 2024).
- Chen, N.; Chen, J.; Yao, B.; Li, Z. QSAR study on antioxidant tripeptides and the antioxidant activity of the designed tripeptides in free radical systems. Molecules 2018, 23, 1407. [Google Scholar] [CrossRef]
- Akbari, S.; Zebardast, T.; Zarghi, A.; Hajimahdi, Z. QSAR modeling of COX-2 inhibitory activity of some dihydropyridine and hydroquinoline derivatives using multiple linear regression (MLR) method. Iran. J. Pharm. Res. 2017, 16, 525–532. [Google Scholar] [PubMed]
- Ghafourian, T.; Amin, Z. QSAR models for the prediction of plasma protein binding. Bioimpacts 2013, 3, 21–27. [Google Scholar]
- Tomorowicz, L.; Slawinski, J.; Zolnowska, B.; Szafranski, K.; Kawiak, A. Synthesis, antitumor evaluation, molecular modeling and quantitative structure-activity relationship (QSAR) of novel 2-[(4-Amino-6-N-substituted-1,3,5-triazin-2-yl)methylthio]-4-chloro-5-methyl-N-(1 H-benzo[d]imidazol-2(3 H)-ylidene)benzenesulfonamides. Int. J. Mol. Sci. 2020, 22, 2924. [Google Scholar] [CrossRef]
- Chen, M.; Yang, F.; Kang, J.; Gan, H.; Yang, X.; Lai, X.; Gao, Y. Identification of potent LXRβ-selective agonists without LXRα activation by in silico approaches. Molecules 2018, 23, 1349. [Google Scholar] [CrossRef] [PubMed]
- Hajimahdi, Z.; Safizadeh, F.; Zarghi, Z. QSAR analysis for some 1,2-Benzisothiazol-3-one derivatives as caspase-3 inhibitors by stepwise MLR method. Iran. J. Pharm. Res. 2016, 15, 439–448. [Google Scholar] [PubMed]
- Scior, T.; Medina-Franco, J.L.; Do, Q.-T.; Martinez-Mayorga, K.; Yunes Rojas, J.A.; Bernard, P. How to recognize and workaround pitfalls in QSAR studies: A critical review. Curr. Med. Chem. 2009, 16, 4297–4313. [Google Scholar] [CrossRef]
- Daoui, O.; Elkhattabi, S.; Chtita, S.; Elkhalabi, R.; Zgou, H.; Benjelloun, A.T. QSAR, molecular docking and ADMET properties in silico studies of novel 4,5,6,7-tetrahydrobenzo[D]-thiazol-2-Yl derivatives derived from dimedone as potent anti-tumor agents through inhibition of C-Met receptor tyrosine kinase. Heliyon 2021, 7, e07463. [Google Scholar] [CrossRef]
- Alexander, D.L.; Tropsha, A.; Winkler, D.A. Beware of R(2): Simple, unambiguous assessment of the prediction accuracy of QSAR and QSPR models. J. Chem. Inf. Model. 2015, 55, 1316–1322. [Google Scholar] [CrossRef]
- Diller, D.J.; Swanson, J.; Bayden, A.S.; Brown, C.J.; Thean, D.; Lane, D.P.; Partridge, A.W.; Sawyer, T.K.; Audie, J. Rigorous computational and experimental investigations on MDM2/MDMX-targeted linear and macrocyclic peptides. Molecules 2019, 24, 4586. [Google Scholar] [CrossRef] [PubMed]
- Wang, J.; Wang, W.; Kollman, P.A.; Case, D.A. Automatic atom type and bond type perception in molecular mechanical calculations. J. Mol. Graph. Model. 2006, 25, 247–260. [Google Scholar] [CrossRef] [PubMed]
- Wang, J.; Wolf, R.M.; Caldwell, J.W.; Kollman, P.A.; Case, D.A. Development and testing of a general amber force field. J. Comput. Chem. 2004, 25, 1157–1174. [Google Scholar] [CrossRef]
- Abagyan, R.; Totrov, M. Biased probability Monte Carlo conformational searches and electrostatic calculations for peptides and proteins. J. Mol. Biol. 1994, 235, 983–1002. [Google Scholar] [CrossRef] [PubMed]
- Lazaridis, T.; Karplus, M. Effective energy function for proteins in solution. Proteins 1999, 35, 133–152. [Google Scholar] [CrossRef]
- Ozvoldik, K.; Stockner, T.; Rammner, B.; Krieger, E. Assembly of biomolecular gigastructures and visualization with the Vulkan graphics API. J. Chem. Inf. Model. 2021, 61, 5293–5303. [Google Scholar] [CrossRef]
- Krieger, E.; Vriend, G. YASARA View—Molecular graphics for all devices—From smartphones to workstations. Bioinformatics 2014, 30, 2981–2982. [Google Scholar] [CrossRef] [PubMed]
- Krieger, E.; Joo, K.; Lee, J.; Lee, J.; Raman, S.; Thompson, J.; Tyka, M.; Baker, D.; Karplus, K. Improving physical realism, stereochemistry, and side-chain accuracy in homology modeling: Four approaches that performed well in CASP8. Proteins 2009, 77 (Suppl. 9), 114–122. [Google Scholar] [CrossRef]
- Krieger, E.; Koraimann, G.; Vriend, G. Increasing the precision of comparative models with YASARA NOVA--a self-parameterizing force field. Proteins 2002, 47, 393–402. [Google Scholar] [CrossRef]
- Klamt, A. Conductor-like screening model for real solvents: A new approach to the quantitative calculation of solvation phenomena. J. Phys. Chem. 1995, 99, 2224–2235. [Google Scholar] [CrossRef]
- Jakalian, A.; Jack, D.B.; Bayly, C.I. Fast, efficient generation of high-quality atomic charges. AM1-BCC model: II. parameterization and validation. J. Comput. Chem. 2002, 23, 1623–1641. [Google Scholar] [CrossRef] [PubMed]

| Peptide | Peptide Structure (N-Terminus, Amino Acid Sequence, C-Terminus) | cAMP EC50, nM | ||
|---|---|---|---|---|
| GLP-1 | H | His1-Ala-Glu-Gly-Thr-Phe6-Thr-Ser-Asp-Val-Ser11 | Residues 12–30 | *** |
| RXL-100 | H | His-Aib-Glu-Gly-Thr-Phe-Thr-Ser-Asp-Bip-Bip | NH2 | 0.5 |
| RXL-3000 | H | His-Aib-Glu-Gly-Thr-Phe(2-F)-Thr-Ser-Asp-Bip-Bip | NH2 | 0.1 |
| RXL-3010 | H | His-Aib-Glu-Gly-Thr-Phe(2-Br)-Thr-Ser-Asp-Bip-Bip | NH2 | 3.85 |
| RXL-3011 | H | His-Aib-Glu-Gly-Thr-Phe(2-Cl)-Thr-Ser-Asp-Bip-Bip | NH2 | 0.9 |
| RXL-3012 | H | His-Aib-Glu-Gly-Thr-Phe(2-CF3)-Thr-Ser-Asp-Bip-Bip | NH2 | 13.9 |
| RXL-3013 | H | His-Aib-Glu-Gly-Thr-Phe(2-CH3)-Thr-Ser-Asp-Bip-Bip | NH2 | 2.1 |
| RXL-3014 | H | His-Aib-Glu-Gly-Thr-Phe(2-NO2)-Thr-Ser-Asp-Bip-Bip | NH2 | 1.1 |
| RXL-3015 | H | His-Aib-Glu-Gly-Thr-Phe(2-CN)-Thr-Ser-Asp-Bip-Bip | NH2 | 7.7 |
| RXL-3016 | H | His-Aib-Glu-Gly-Thr-Phe(3-CF3)-Thr-Ser-Asp-Bip-Bip | NH2 | 13.9 |
| RXL-3039 | H | His-Aib-Glu-Gly-Thr-Phe(2,6-F)-Thr-Ser-Asp-Bip-Bip | NH2 | 0.16 |
| RXL-3017 | H | His-Aib-Glu-Gly-Thr-Phe(3,4,5-F)-Thr-Ser-Asp-Bip-Bip | NH2 | 7.2 |
| RXL-3018 | H | His-Aib-Glu-Gly-Thr-Phe(2,3,4,5,6-F)-Thr-Ser-Asp-Bip-Bip | NH2 | 0.3 |
| RXL-3019 | H | His-Aib-Glu-Gly-Thr-Hph-Thr-Ser-Asp-Bip-Bip | NH2 | 16.0 |
| RXL-3024 | H | His-Aib-Glu-Gly-Thr-Bip-Thr-Ser-Asp-Bip-Bip | NH2 | 10.8 |
| RXL-3021 | H | His-Aib-Glu-Gly-Thr-Tyr-Thr-Ser-Asp-Bip-Bip | NH2 | 3.0 |
| RXL-3023 | H | His-Aib-Glu-Gly-Thr-Trp-Thr-Ser-Asp-Bip-Bip | NH2 | 13.8 |
| RXL-3022 | H | His-Aib-Glu-Gly-Thr-D-Phe-Thr-Ser-Asp-Bip-Bip | NH2 | 23.2 |
| Peptide | Peptide Structure (N-Terminus, Amino Acid Sequence, C-Terminus) | cAMP EC50, nM | ||
|---|---|---|---|---|
| GLP-1 | H | His1-Ala-Glu-Gly-Thr-Phe6-Thr-Ser-Asp-Val-Ser11 | Residues 12–30 | *** |
| RXL-100 | H | His-Aib-Glu-Gly-Thr-Phe-Thr-Ser-Asp-Bip-Bip | NH2 | 0.5 |
| RXL-3000 | H | His-Aib-Glu-Gly-Thr-Phe(2-F)-Thr-Ser-Asp-Bip-Bip | NH2 | 0.1 |
| RXL-3001 | H | Ala-Aib-Glu-Gly-Thr-Phe(2-F)-Thr-Ser-Asp-Bip-Bip | NH2 | 21.9 |
| RXL-3002 | H | His-Ala-Glu-Gly-Thr-Phe(2-F)-Thr-Ser-Asp-Bip-Bip | NH2 | 0.2 |
| RXL-3003 | H | His-Aib-Ala-Gly-Thr-Phe(2-F)-Thr-Ser-Asp-Bip-Bip | NH2 | 7.9 |
| RXL-3037 | H | His-Aib-Glu-Ala-Thr-Phe(2F)-Thr-Ser-Asp-Bip-Bip | NH2 | 210.0 |
| RXL-3004 | H | His-Aib-Glu-Gly-Ala-Phe(2-F)-Thr-Ser-Asp-Bip-Bip | NH2 | 7.7 |
| RXL-3038 | H | His-Aib-Glu-Gly-Thr-Ala-Thr-Ser-Asp-Bip-Bip | NH2 | >1000 |
| RXL-3005 | H | His-Aib-Glu-Gly-Thr-Phe(2-F)-Ala-Ser-Asp-Bip-Bip | NH2 | 47.5 |
| RXL-3006 | H | His-Aib-Glu-Gly-Thr-Phe(2-F)-Thr-Ala-Asp-Bip-Bip | NH2 | 8.5 |
| RXL-3007 | H | His-Aib-Glu-Gly-Thr-Phe(2-F)-Thr-Ser-Ala-Bip-Bip | NH2 | 14.0 |
| RXL-3008 | H | His-Aib-Glu-Gly-Thr-Phe(2-F)-Thr-Ser-Asp-Ala-Bip | NH2 | >1000 |
| RXL-3009 | H | His-Aib-Glu-Gly-Thr-Phe(2-F)-Thr-Ser-Asp-Bip-Ala | NH2 | >1000 |
| Peptide | Peptide Structure (N-Terminus, Amino Acid Sequence, C-Terminus) | cAMP EC50, nM | ||
|---|---|---|---|---|
| GLP-1 | H | His1-Ala-Glu-Gly-Thr-Phe6-Thr-Ser-Asp-Val-Ser11 | Residues 12–30 | *** |
| RXL-100 | H | His-Aib-Glu-Gly-Thr-Phe-Thr-Ser-Asp-Bip-Bip | NH2 | 0.5 |
| RXL-3000 | H | His-Aib-Glu-Gly-Thr-Phe(2-F)-Thr-Ser-Asp-Bip-Bip | NH2 | 0.1 |
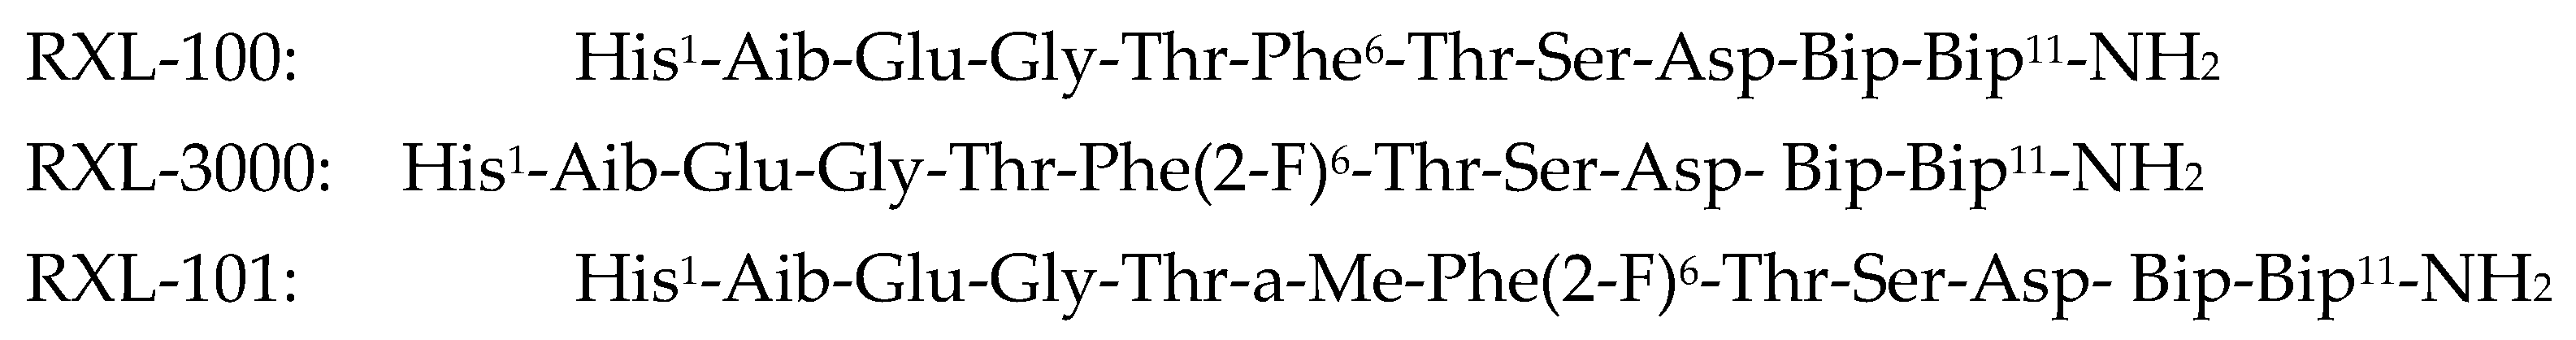
| RXL-101 | H | His-Aib-Glu-Gly-Thr-a-Me-Phe(2-F)-Thr-Ser-Asp-Bip-Bip | NH2 | 0.01 |
| RXL-3030 | H | Aib-Aib-Glu-Gly-Thr-a-Me-Phe(2-F)-Thr-Ser-Asp-Bip-Bip | NH2 | 1.3 |
| RXL-3031 | H | His-Aib-Aib-Gly-Thr-a-Me-Phe(2-F)-Thr-Ser-Asp-Bip-Bip | NH2 | 4.0 |
| RXL-3032 | H | His-Aib-Glu-Aib-Thr-a-Me-Phe(2-F)-Thr-Ser-Asp-Bip-Bip | NH2 | 14.2 |
| RXL-3033 | H | His-Aib-Glu-Gly-Aib-a-Me-Phe(2-F)-Thr-Ser-Asp-Bip-Bip | NH2 | 6.9 |
| RXL-3028 | H | His-Aib-Glu-Gly-Thr-Aib-Thr-Ser-Asp-Bip-Bip | NH2 | 161.0 |
| RXL-3034 | H | His-Aib-Glu-Gly-Thr-a-Me-Phe(2-F)-Aib-Ser-Asp-Bip-Bip | NH2 | 80.2 |
| RXL-3035 | H | His-Aib-Glu-Gly-Thr-a-Me-Phe(2-F)-Thr-Aib-Asp-Bip-Bip | NH2 | 111.0 |
| RXL-3036 | H | His-Aib-Glu-Gly-Thr-a-Me-Phe(2-F)-Thr-Ser-Aib-Bip-Bip | NH2 | 67.5 |
| RXL-3051 | H | His-Aib-Glu-Gly-Thr-a-Me-Phe(2-F)-Thr-Ser-Asp-Aib-Bip | NH2 | >1000 |
| RXL-3052 | H | His-Aib-Glu-Gly-Thr-a-Me-Phe(2-F)-Thr-Ser-Asp-Bip-Aib | NH2 | 7.4 |
| Peptide | Peptide Structure | pEC50 | Peptide | Peptide Structure | pEC50 | dpEC50 |
|---|---|---|---|---|---|---|
| RXL-101 | His-Aib-Glu-Gly-Thr-α-Me-Phe(2-F)-Thr-Ser-Asp-Bip-Bip | 10.89 | RXL-3000 | His-Aib-Glu-Gly-Thr-Phe(2-F)-Thr-Ser-Asp-Bip-Bip | 9.92 | 0.97 |
| RXL-3030 | Aib-Aib-Glu-Gly-Thr-α-Me-Phe(2-F)-Thr-Ser-Asp-Bip-Bip | 8.58 | RXL-3001 | Ala-Aib-Glu-Gly-Thr-Phe(2-F)-Thr-Ser-Asp-Bip-Bip | 7.86 | −0.26 |
| RXL-101 | His-Aib-Glu-Gly-Thr-α-Me-Phe(2-F)-Thr-Ser-Asp-Bip-Bip | 10.89 | RXL-3002 | His-Ala-Glu-Gly-Thr-Phe(2-F)-Thr-Ser-Asp-Bip-Bip | 9.92 | 0.00 |
| RXL-3031 | His-Aib-Aib-Gly-Thr-α-Me-Phe(2-F)-Thr-Ser-Asp-Bip-Bip | 8.31 | RXL-3003 | His-Aib-Ala-Gly-Thr-Phe(2-F)-Thr-Ser-Asp-Bip-Bip | 8.47 | −1.13 |
| RXL-3032 | His-Aib-Glu-Aib-Thr-α-Me-Phe(2-F)-Thr-Ser-Asp-Bip-Bip | 7.80 | RXL-3037 | His-Aib-Glu-Ala-Thr-Phe(2F)-Thr-Ser-Asp-Bip-Bip | 6.46 | 0.37 |
| RXL-3033 | His-Aib-Glu-Gly-Aib-α-Me-Phe(2-F)-Thr-Ser-Asp-Bip-Bip | 8.13 | RXL-3004 | His-Aib-Glu-Gly-Ala-Phe(2-F)-Thr-Ser-Asp-Bip-Bip | 8.16 | −1.00 |
| RXL-3028 | His-Aib-Glu-Gly-Thr-Aib-Thr-Ser-Asp-Bip-Bip | 6.98 | RXL-3038 | His-Aib-Glu-Gly-Thr-Ala-Thr-Ser-Asp-Bip-Bip | 5.55 | 0.46 |
| RXL-3034 | His-Aib-Glu-Gly-Thr-α-Me-Phe(2-F)-Aib-Ser-Asp-Bip-Bip | 7.04 | RXL-3005 | His-Aib-Glu-Gly-Thr-Phe(2-F)-Ala-Ser-Asp-Bip-Bip | 7.67 | −1.60 |
| RXL-3035 | His-Aib-Glu-Gly-Thr-α-Me-Phe(2-F)-Thr-Aib-Asp-Bip-Bip | 6.89 | RXL-3006 | His-Aib-Glu-Gly-Thr-Phe(2-F)-Thr-Ala-Asp-Bip-Bip | 8.72 | −2.80 |
| RXL-3036 | His-Aib-Glu-Gly-Thr-α-Me-Phe(2-F)-Thr-Ser-Aib-Bip-Bip | 7.04 | RXL-3007 | His-Aib-Glu-Gly-Thr-Phe(2-F)-Thr-Ser-Ala-Bip-Bip | 8.32 | −2.26 |
| RXL-3051 | His-Aib-Glu-Gly-Thr-α-Me-Phe(2-F)-Thr-Ser-Asp-Aib-Bip | 6.00 | RXL-3008 | His-Aib-Glu-Gly-Thr-Phe(2-F)-Thr-Ser-Asp-Ala-Bip | 6.37 | −1.34 |
| RXL-3052 | His-Aib-Glu-Gly-Thr-α-Me-Phe(2-F)-Thr-Ser-Asp-Bip-Aib | 8.08 | RXL-3009 | His-Aib-Glu-Gly-Thr-Phe(2-F)-Thr-Ser-Asp-Bip-Ala | 6.00 | 1.11 |
| Model a | Template | Descriptors | Equation b | R2adj | AIC c AIC c | p(F) | p(t1) d | p(t2) e | P(t3) f | Q2 |
|---|---|---|---|---|---|---|---|---|---|---|
| Assay | N/A | pIC50 | N/A | 0.62 | −10.9 −6.1 | 4.1 × 10⁻³ | 4.1 × 10⁻³ | N/A | N/A | 0.53 |
| Ref. | 5NX2 | NOVA2 Binding | pEC50 = −0.009BE − 8.58 | 0.37 | 5.11 6.00 | 1.8 × 10⁻⁴ | 1.8 × 10⁻⁴ | N/A | N/A | 0.24 |
| QSAR1 | 5NX2 | Interface Contacts | pEC50 = 0.203InteractionCount − 0.717 | 0.41 | 3.18 4.07 | 7.0 × 10⁻⁵ | 7.0 × 10⁻⁵ | N/A | N/A | 0.34 |
| QSAR2 | 5NX2 | YASARA Packing | pEC50 = −0.0018BindPack1D + 2.63 | 0.31 | 8.00 8.89 | 7.5 × 10⁻⁴ | 7.5 × 10⁻⁴ | N/A | N/A | 0.20 |
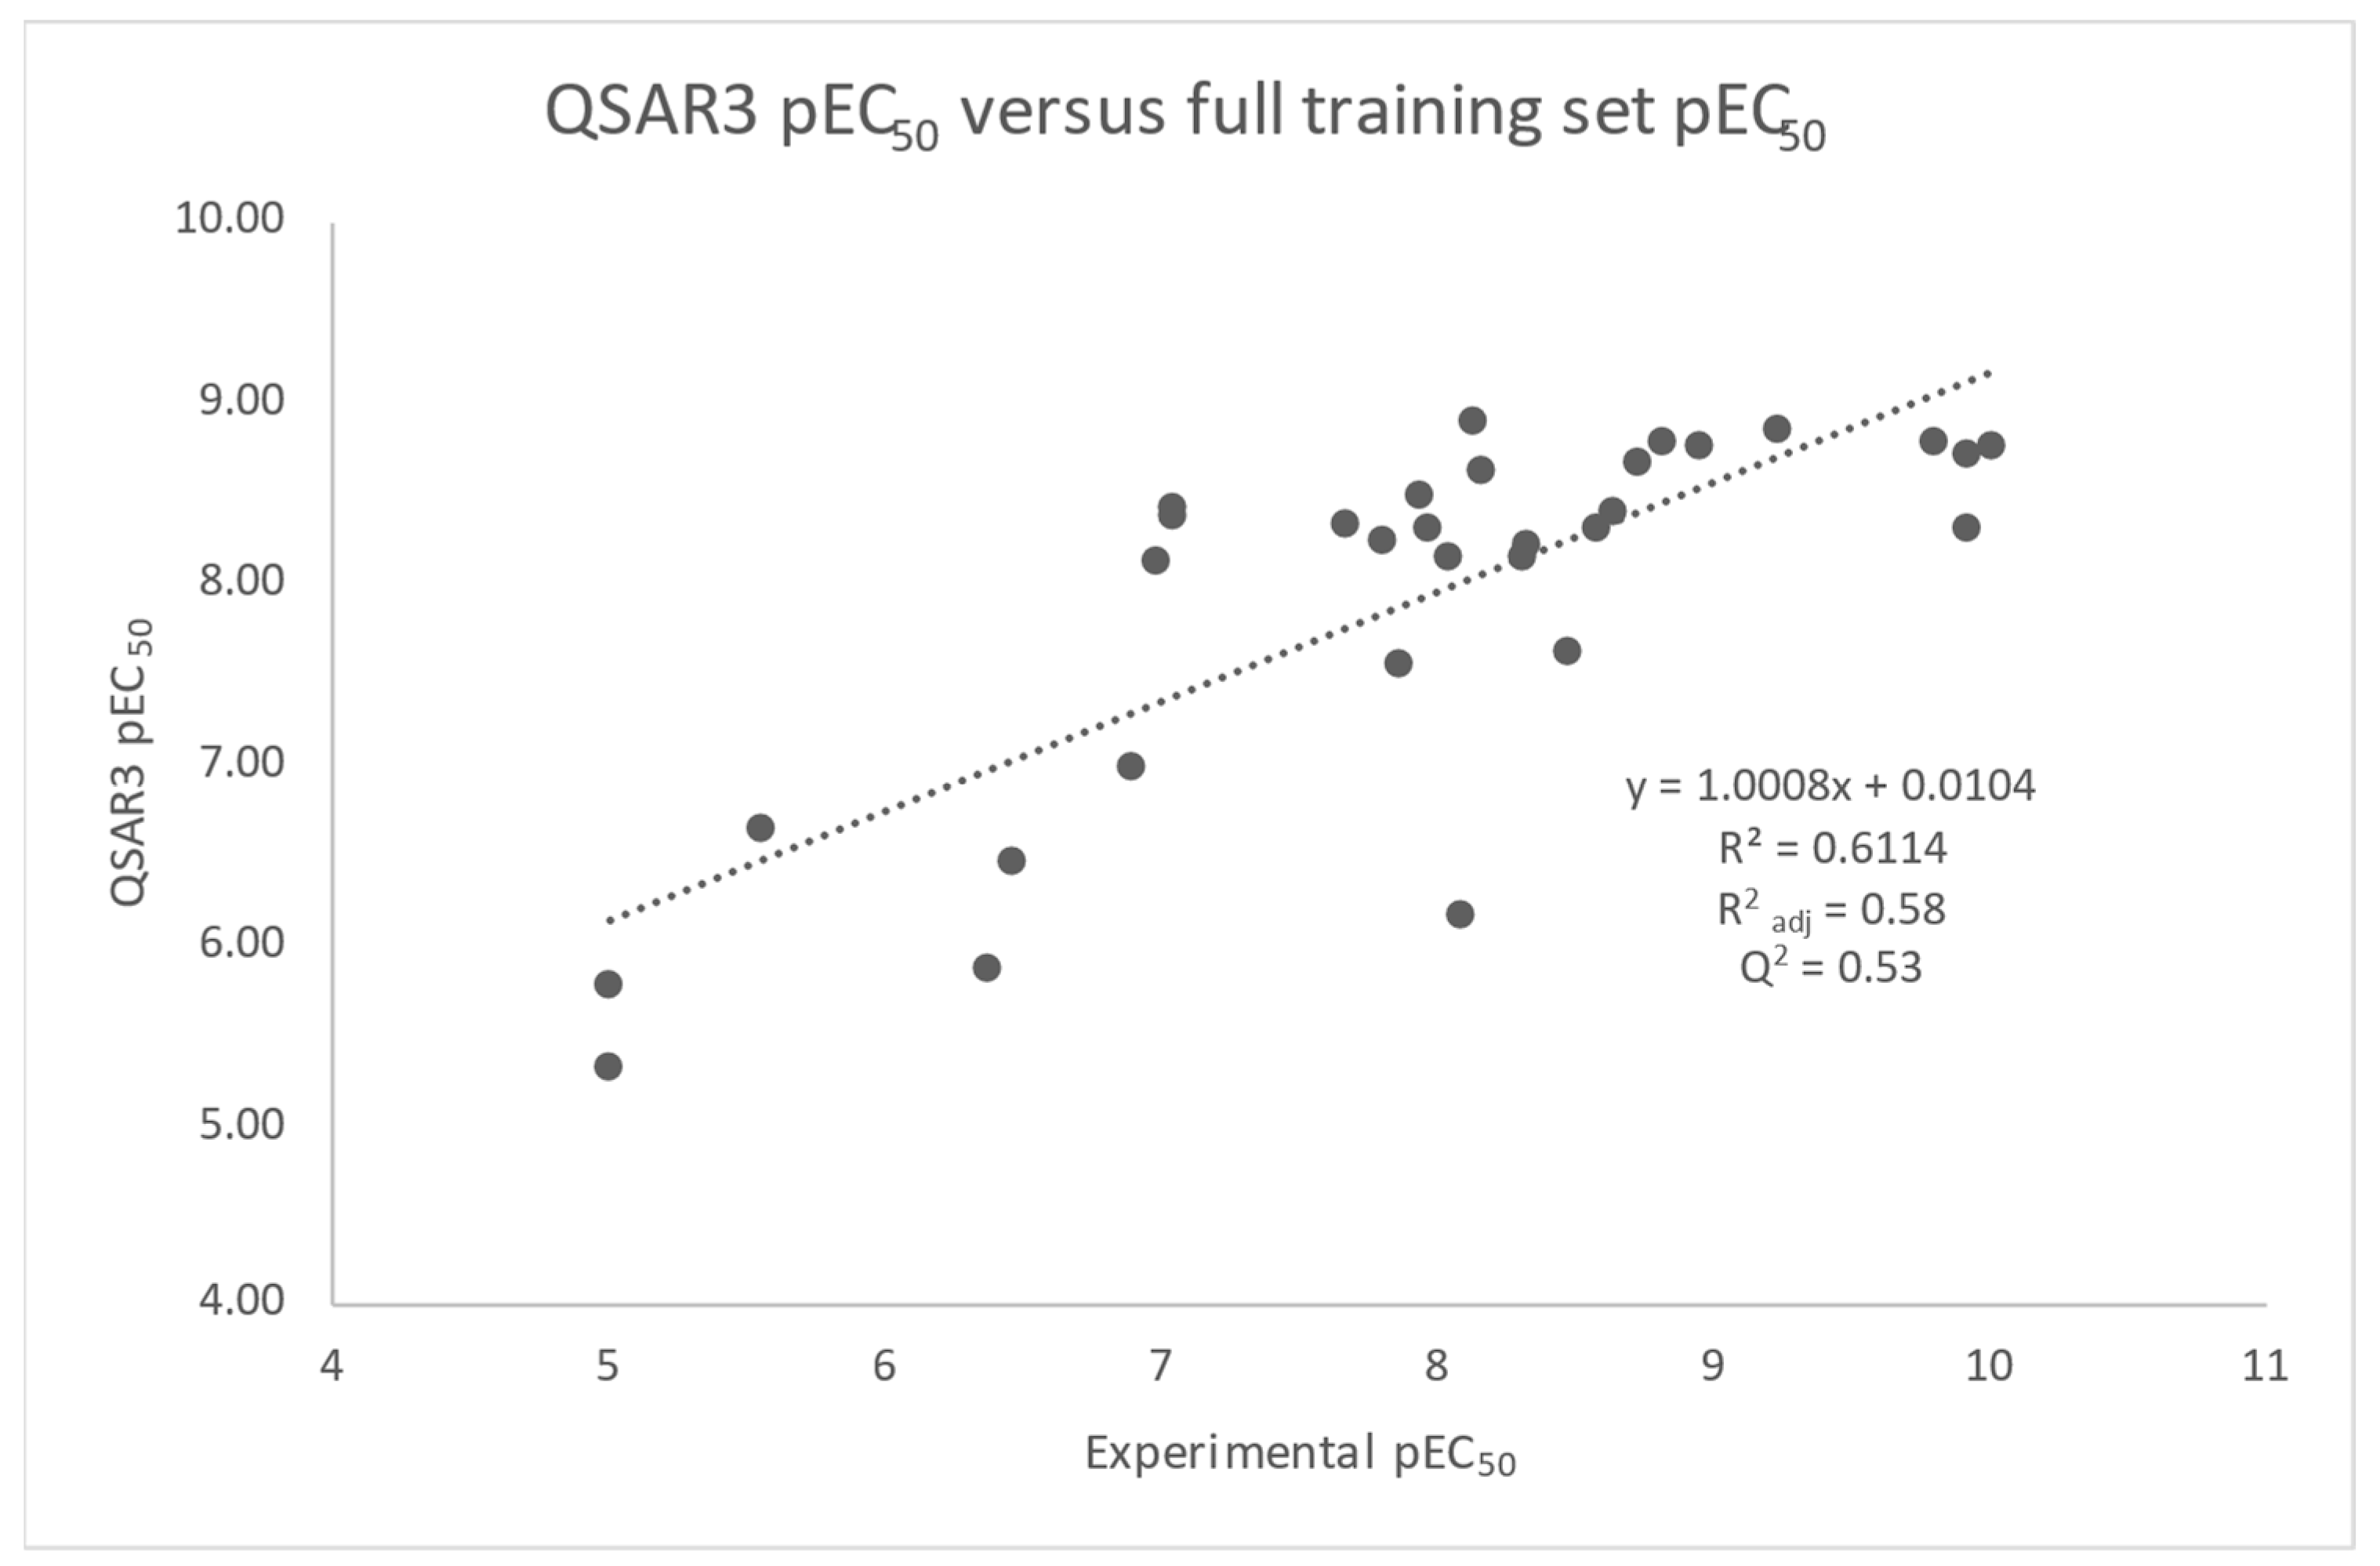
| QSAR3 | 5NX2 | NOVA2 Terms | pEC50 = −0.026BEpot + 0.019BSvdw − 7.26 | 0.58 | −6.95 −5.41 | 1.8 × 10⁻⁶ | 8.6 × 10⁻⁴ | 0.009 | N/A | 0.53 |
| QSAR4 | 5NX2 | Mixed | pEC50 = −0.029BEpot + 0.037BSvdw + 0.00038BindPack1D − 9.13 | 0.63 | −9.81 −7.41 | 1.2 × 10⁻⁶ | 1.9 × 10⁻⁴ | 0.0017 | 0.04 | 0.54 |
| Peptide | Peptide Structure | EC50 (nM) | EMAX, % | RXL-3000 | RXL-101 |
|---|---|---|---|---|---|
| RXL-3000 | His-Aib-Glu-Gly-Thr-Phe(2-F)-Thr-Ser-Asp-Bip-Bip-NH2 | 0.1 | 109.2 | PARENT | |
| RXL-3001 | Ala-Aib-Glu-Gly-Thr-Phe(2-F)-Thr-Ser-Asp-Bip-Bip-NH2 | 21.9 | 107.5 | ||
| RXL-3002 | His-Ala-Glu-Gly-Thr-Phe(2-F)-Thr-Ser-Asp-Bip-Bip-NH2 | 0.2 | 102.5 | ||
| RXL-3003 | His-Aib-Ala-Gly-Thr-Phe(2-F)-Thr-Ser-Asp-Bip-Bip-NH2 | 7.9 | 108.2 | ||
| RXL-3037 | His-Aib-Glu-Ala-Thr-Phe(2-F)-Thr-Ser-Asp-Bip-Bip-NH2 | 210.0 | 73.8 | ||
| RXL-3004 | His-Aib-Glu-Gly-Ala-Phe(2-F)-Thr-Ser-Asp-Bip-Bip-NH2 | 7.7 | 108.2 | ||
| RXL-3038 | His-Aib-Glu-Gly-Thr-Ala-Thr-Ser-Asp-Bip-Bip-NH2 | >1000 | 37.4 | ||
| RXL-3005 | His-Aib-Glu-Gly-Thr-Phe(2-F)-Ala-Ser-Asp-Bip-Bip-NH2 | 47.5 | 102.4 | ||
| RXL-3006 | His-Aib-Glu-Gly-Thr-Phe(2-F)-Thr-Ala-Asp-Bip-Bip-NH2 | 8.5 | 120.1 | ||
| RXL-3007 | His-Aib-Glu-Gly-Thr-Phe(2-F)-Thr-Ser-Ala-Bip-Bip-NH2 | 14 | 131.6 | ||
| RXL-3008 | His-Aib-Glu-Gly-Thr-Phe(2-F)-Thr-Ser-Asp-Ala-Bip-NH2 | >1000 | 43.6 | ||
| RXL-3009 | His-Aib-Glu-Gly-Thr-Phe(2-F)-Thr-Ser-Asp-Bip-Ala-NH2 | >1000 | 43.2 | ||
| RXL-101 | His-Aib-Glu-Gly-Thr-α-Me-Phe(2-F)-Thr-Ser-Asp-Bip-Bip-NH2 | 0.01 | 116.7 | PARENT | |
| RXL-3030 | Aib-Aib-Glu-Gly-Thr-α-Me-Phe(2-F)-Thr-Ser-Asp-Bip-Bip-NH2 | 1.3 | 111.6 | ||
| RXL-3031 | His-Aib-Aib-Gly-Thr-α-Me-Phe(2-F)-Thr-Ser-Asp-Bip-Bip-NH2 | 4.0 | 121.3 | ||
| RXL-3032 | His-Aib-Glu-Aib-Thr-α-Me-Phe(2-F)-Thr-Ser-Asp-Bip-Bip-NH2 | 14.2 | 117.7 | ||
| RXL-3033 | His-Aib-Glu-Gly-Aib-α-Me-Phe(2-F)-Thr-Ser-Asp-Bip-Bip-NH2 | 6.9 | 119.9 | ||
| RXL-3028 | His-Aib-Glu-Gly-Thr-Aib-Thr-Ser-Asp-Bip-Bip-NH2 | 161.0 | 76.1 | ||
| RXL-3034 | His-Aib-Glu-Gly-Thr-α-Me-Phe(2-F)-Aib-Ser-Asp-Bip-Bip-NH2 | 80.2 | 105.7 | ||
| RXL-3035 | His-Aib-Glu-Gly-Thr-α-Me-Phe(2-F)-Thr-Aib-Asp-Bip-Bip-NH2 | 111.0 | 79.1 | ||
| RXL-3036 | His-Aib-Glu-Gly-Thr-α-Me-Phe(2-F)-Thr-Ser-Aib-Bip-Bip-NH2 | 67.5 | 96.7 | ||
| RXL-3051 | His-Aib-Glu-Gly-Thr-α-Me-Phe(2-F)-Thr-Ser-Asp-Aib-Bip-NH2 | >1000 | 26.8 | ||
| RXL-3052 | His-Aib-Glu-Gly-Thr-α-Me-Phe(2-F)-Thr-Ser-Asp-Bip-Aib-NH2 | 7.4 | 112.3 | ||
| RXL-100 | His-Aib-Glu-Gly-Thr-Phe-Thr-Ser-Asp-Bip-Bip-NH2 | 0.5 | 109.6 | ||
| RXL-3010 | His-Aib-Glu-Gly-Thr-Phe(2-Br)-Thr-Ser-Asp-Bip-Bip-NH2 | 3.9 | 120.6 | ||
| RXL-3011 | His-Aib-Glu-Gly-Thr-Phe(2-Cl)-Thr-Ser-Asp-Bip-Bip-NH2 | 0.9 | 91.3 | ||
| RXL-3012 | His-Aib-Glu-Gly-Thr-Phe(2-CF3)-Thr-Ser-Asp-Bip-Bip-NH2 | 13.9 | 99.3 | ||
| RXL-3013 | His-Aib-Glu-Gly-Thr-Phe(2-CH3)-Thr-Ser-Asp-Bip-Bip-NH2 | 2.1 | 98.6 | ||
| RXL-3014 | His-Aib-Glu-Gly-Thr-Phe(2-NO2)-Thr-Ser-Asp-Bip-Bip-NH2 | 1.1 | 104.5 | ||
| RXL-3015 | His-Aib-Glu-Gly-Thr-Phe(2-CN)-Thr-Ser-Asp-Bip-Bip-NH2 | 7.7 | 101 | ||
| RXL-3016 | His-Aib-Glu-Gly-Thr-Phe(3-CF3)-Thr-Ser-Asp-Bip-Bip-NH2 | 13.9 | 108.9 | ||
| RXL-3017 | His-Aib-Glu-Gly-Thr-Phe(3,4,5-F)-Thr-Ser-Asp-Bip-Bip-NH2 | 7.2 | 113.1 | ||
| RXL-3018 | His-Aib-Glu-Gly-Thr-Phe(2,3,4,5,6-F)-Thr-Ser-Asp-Bip-Bip-NH2 | 0.3 | 102.5 | ||
| RXL-3019 | His-Aib-Glu-Gly-Thr-hPhe-Thr-Ser-Asp-Bip-Bip-NH2 | 16.0 | 109.5 | ||
| RXL-3020 | His-Aib-Glu-Gly-Thr-α-Me-Phe-Thr-Ser-Asp-Bip-Bip-NH2 | 0.02 | 107.9 | ||
| RXL-3021 | His-Aib-Glu-Gly-Thr-Tyr-Thr-Ser-Asp-Bip-Bip-NH2 | 3.0 | 100.2 | ||
| RXL-3022 | His-Aib-Glu-Gly-Thr-D-Phe-Thr-Ser-Asp-Bip-Bip-NH2 | 23.2 | 101.4 | ||
| RXL-3023 | His-Aib-Glu-Gly-Thr-Trp-Thr-Ser-Asp-Bip-Bip-NH2 | 13.8 | 106.3 | ||
| RXL-3024 | His-Aib-Glu-Gly-Thr-Bip-Thr-Ser-Asp-Bip-Bip-NH2 | 10.8 | 102.3 |

Disclaimer/Publisher’s Note: The statements, opinions and data contained in all publications are solely those of the individual author(s) and contributor(s) and not of MDPI and/or the editor(s). MDPI and/or the editor(s) disclaim responsibility for any injury to people or property resulting from any ideas, methods, instructions or products referred to in the content. |
© 2024 by the authors. Licensee MDPI, Basel, Switzerland. This article is an open access article distributed under the terms and conditions of the Creative Commons Attribution (CC BY) license (https://creativecommons.org/licenses/by/4.0/).
Share and Cite
Sawyer, J.R.; Audie, J.A.; Swanson, J.; Diller, D.; Santiago, S.; Gribkoff, V.K.; Ackerman, A.; Hruby, V.J.; Gobbo, G.; Bellucci, M.A.; et al. Design, Structure–Activity Relationships, and Computational Modeling Studies of a Series of α-Helix Biased, Ultra-Short Glucagon-like Peptide-1 Receptor Agonists. Molecules 2025, 30, 12. https://doi.org/10.3390/molecules30010012
Sawyer JR, Audie JA, Swanson J, Diller D, Santiago S, Gribkoff VK, Ackerman A, Hruby VJ, Gobbo G, Bellucci MA, et al. Design, Structure–Activity Relationships, and Computational Modeling Studies of a Series of α-Helix Biased, Ultra-Short Glucagon-like Peptide-1 Receptor Agonists. Molecules. 2025; 30(1):12. https://doi.org/10.3390/molecules30010012
Chicago/Turabian StyleSawyer, Jonathon R., Joseph A. Audie, Jon Swanson, David Diller, Solimar Santiago, Valentin K. Gribkoff, Allison Ackerman, Victor J. Hruby, Gianpaolo Gobbo, Michael A. Bellucci, and et al. 2025. "Design, Structure–Activity Relationships, and Computational Modeling Studies of a Series of α-Helix Biased, Ultra-Short Glucagon-like Peptide-1 Receptor Agonists" Molecules 30, no. 1: 12. https://doi.org/10.3390/molecules30010012
APA StyleSawyer, J. R., Audie, J. A., Swanson, J., Diller, D., Santiago, S., Gribkoff, V. K., Ackerman, A., Hruby, V. J., Gobbo, G., Bellucci, M. A., Glauser, W. A., Pentelute, B. L., & Sawyer, T. K. (2025). Design, Structure–Activity Relationships, and Computational Modeling Studies of a Series of α-Helix Biased, Ultra-Short Glucagon-like Peptide-1 Receptor Agonists. Molecules, 30(1), 12. https://doi.org/10.3390/molecules30010012