

Thermal Characterization and Heat Capacities of Seven Polyphenols


Abstract
1. Introduction
2. Results and Discussion
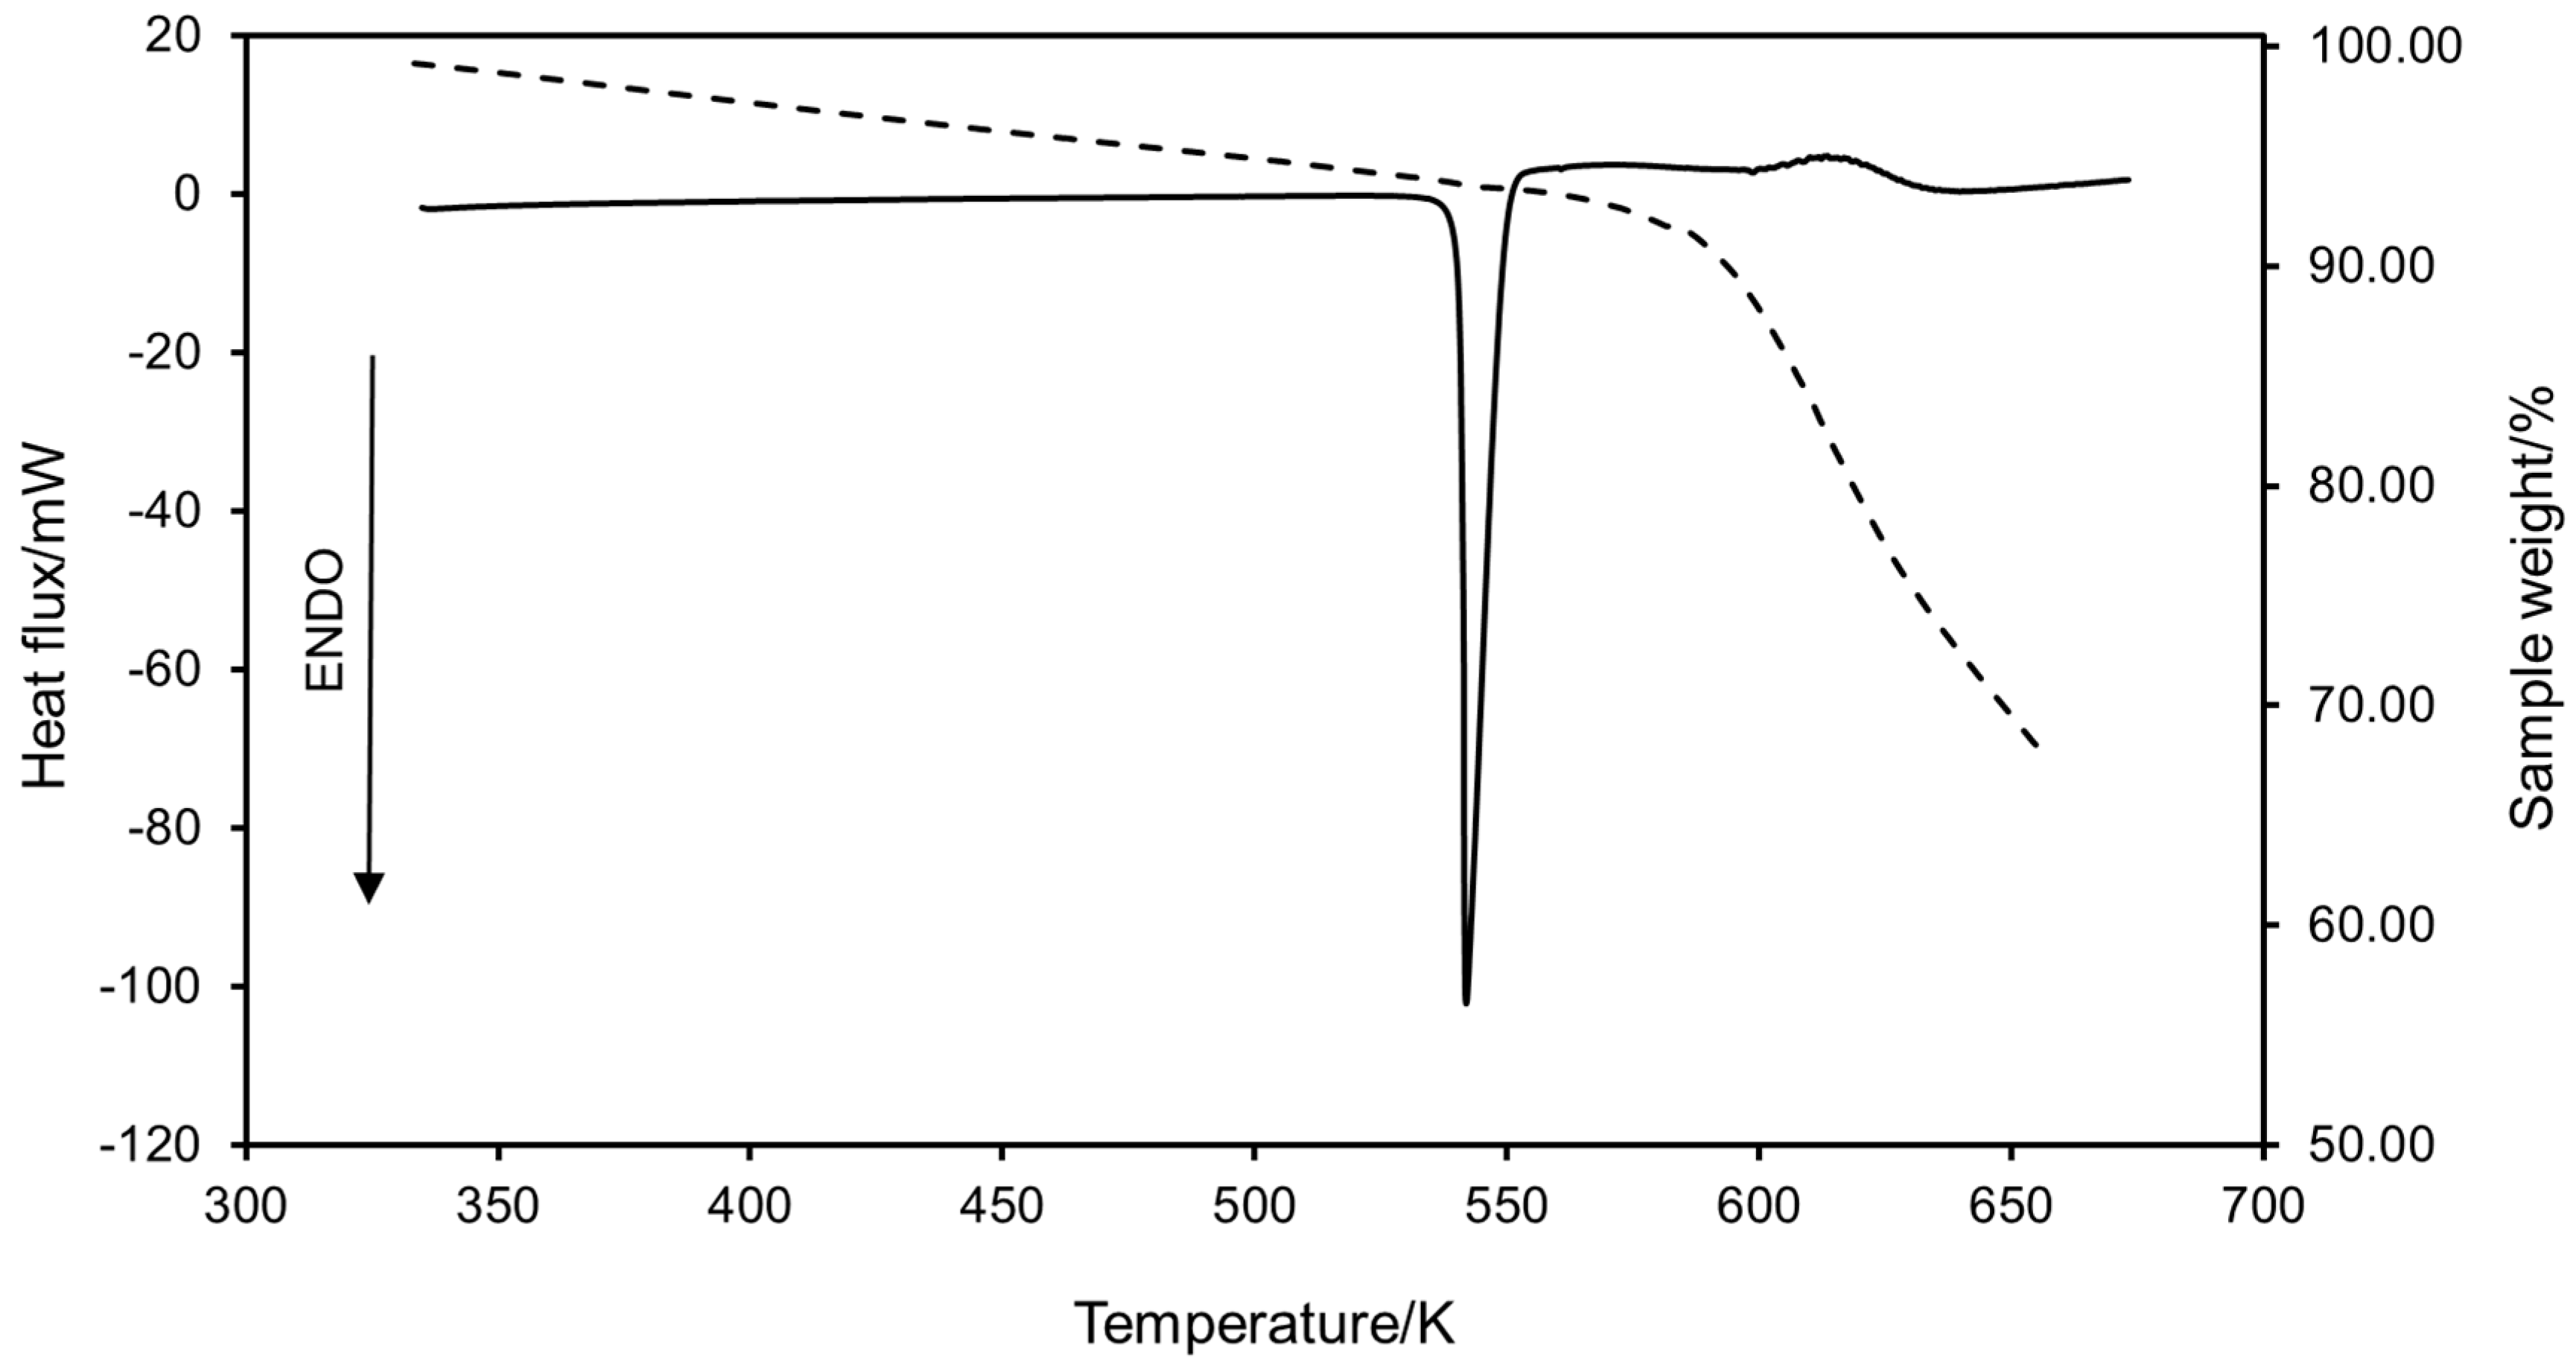
2.1. Thermal Analysis
2.1.1. Experimental Results

| Compound | Tm/K | |||
|---|---|---|---|---|
| Exp. | Ref. | Exp. | Ref. | |
| Trans-resveratrol | 541.95 | 541.25 [30], 542.25 [31], 541.66 [32] | 294.53 | 303.20 [33], 293.6 [34], 298.2 [35] |
| Trans-polydatin | 504.65 | 503.15 [36], 501.15 [37], 495.85 [38] | 187.93 | No data found |
| Kaempferol | 557.51 | 558.15 [39], 561.23 [40], 560.15 [41] | 163.68 | 34.45 [29] |
| Quercetin | 596.49 | 596.15 [42], 596.15 [43], 596.25 [44] | 176.96 | 155 [43], 206.6 [45], 115.37 [46] |
| Myricetin | 638.75 | 646.15 [28], 641.15 [27], 629.21 [47] | 81.26 | No data found |
| Hesperidin | 532.77 | 531.15 [42], 532.15 [48], 533.15 [49] | 120.76 | 122 [42], 101.24 [50] |
| (−)-Epicatechin | 524.84 | 512.15 [51], 520.32 [52], 509.15 [53] | 150.78 | 139.6 [52] |
2.1.2. Property Prediction by Group Contribution Method
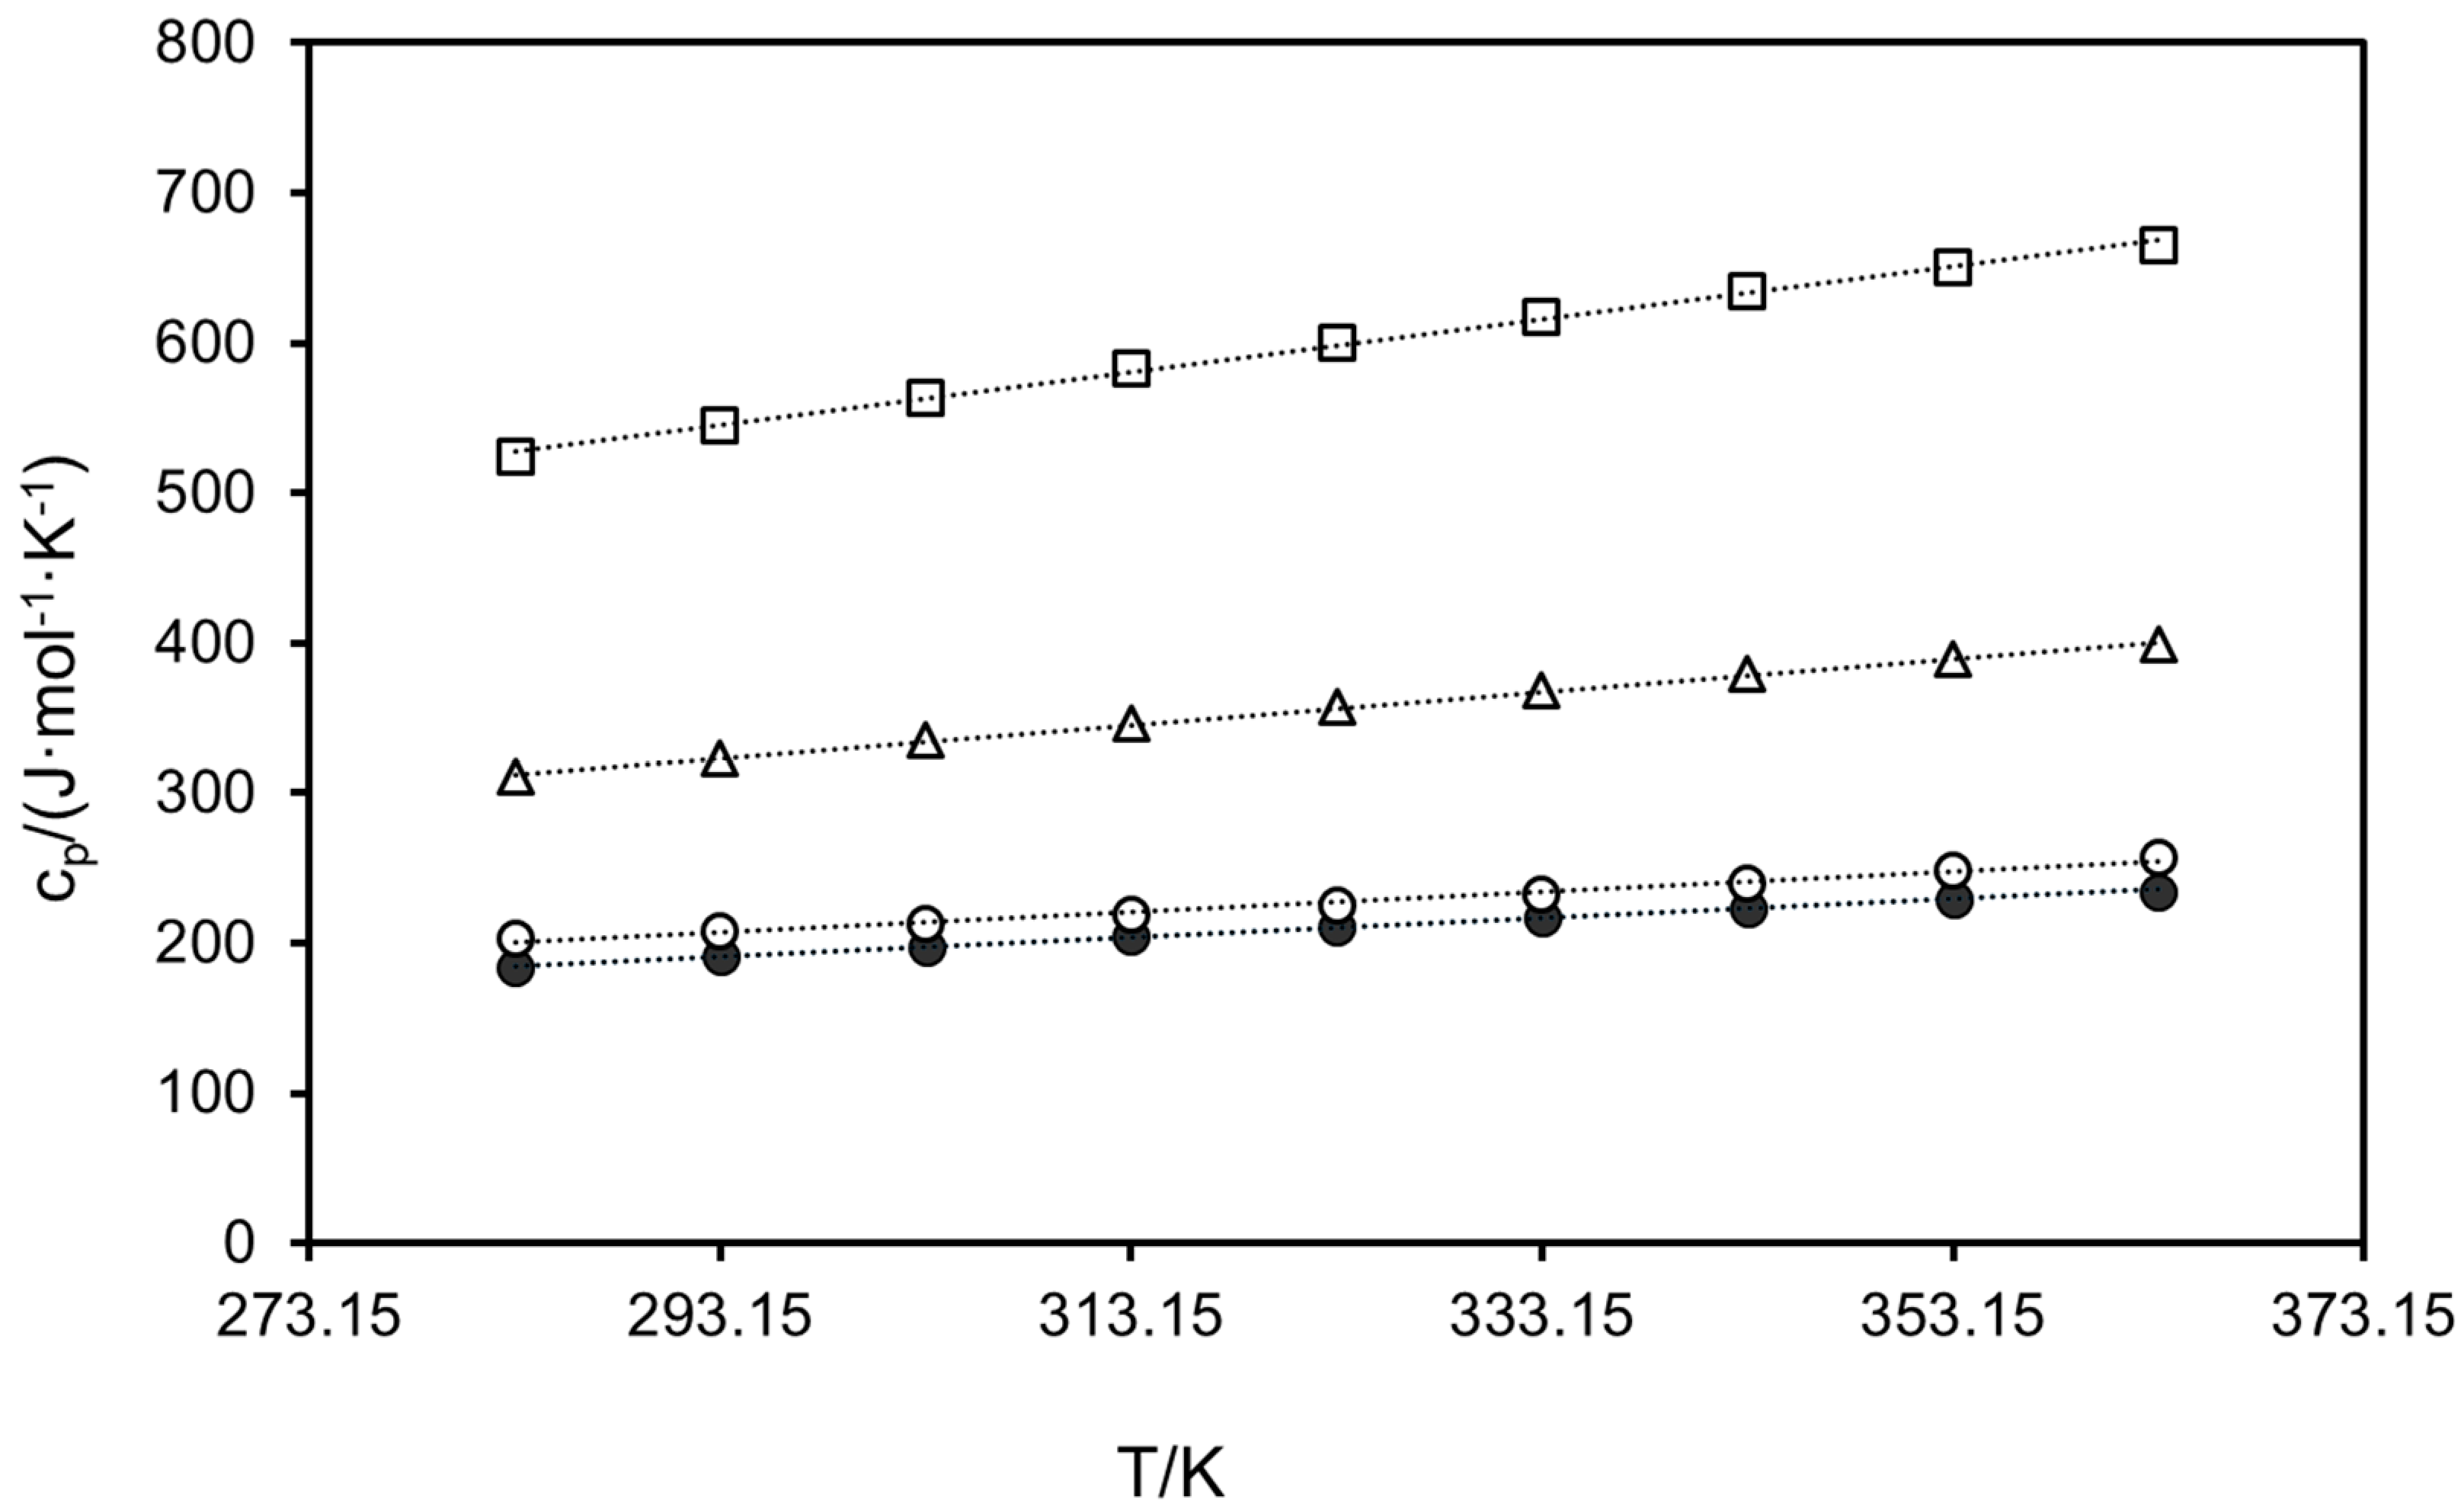
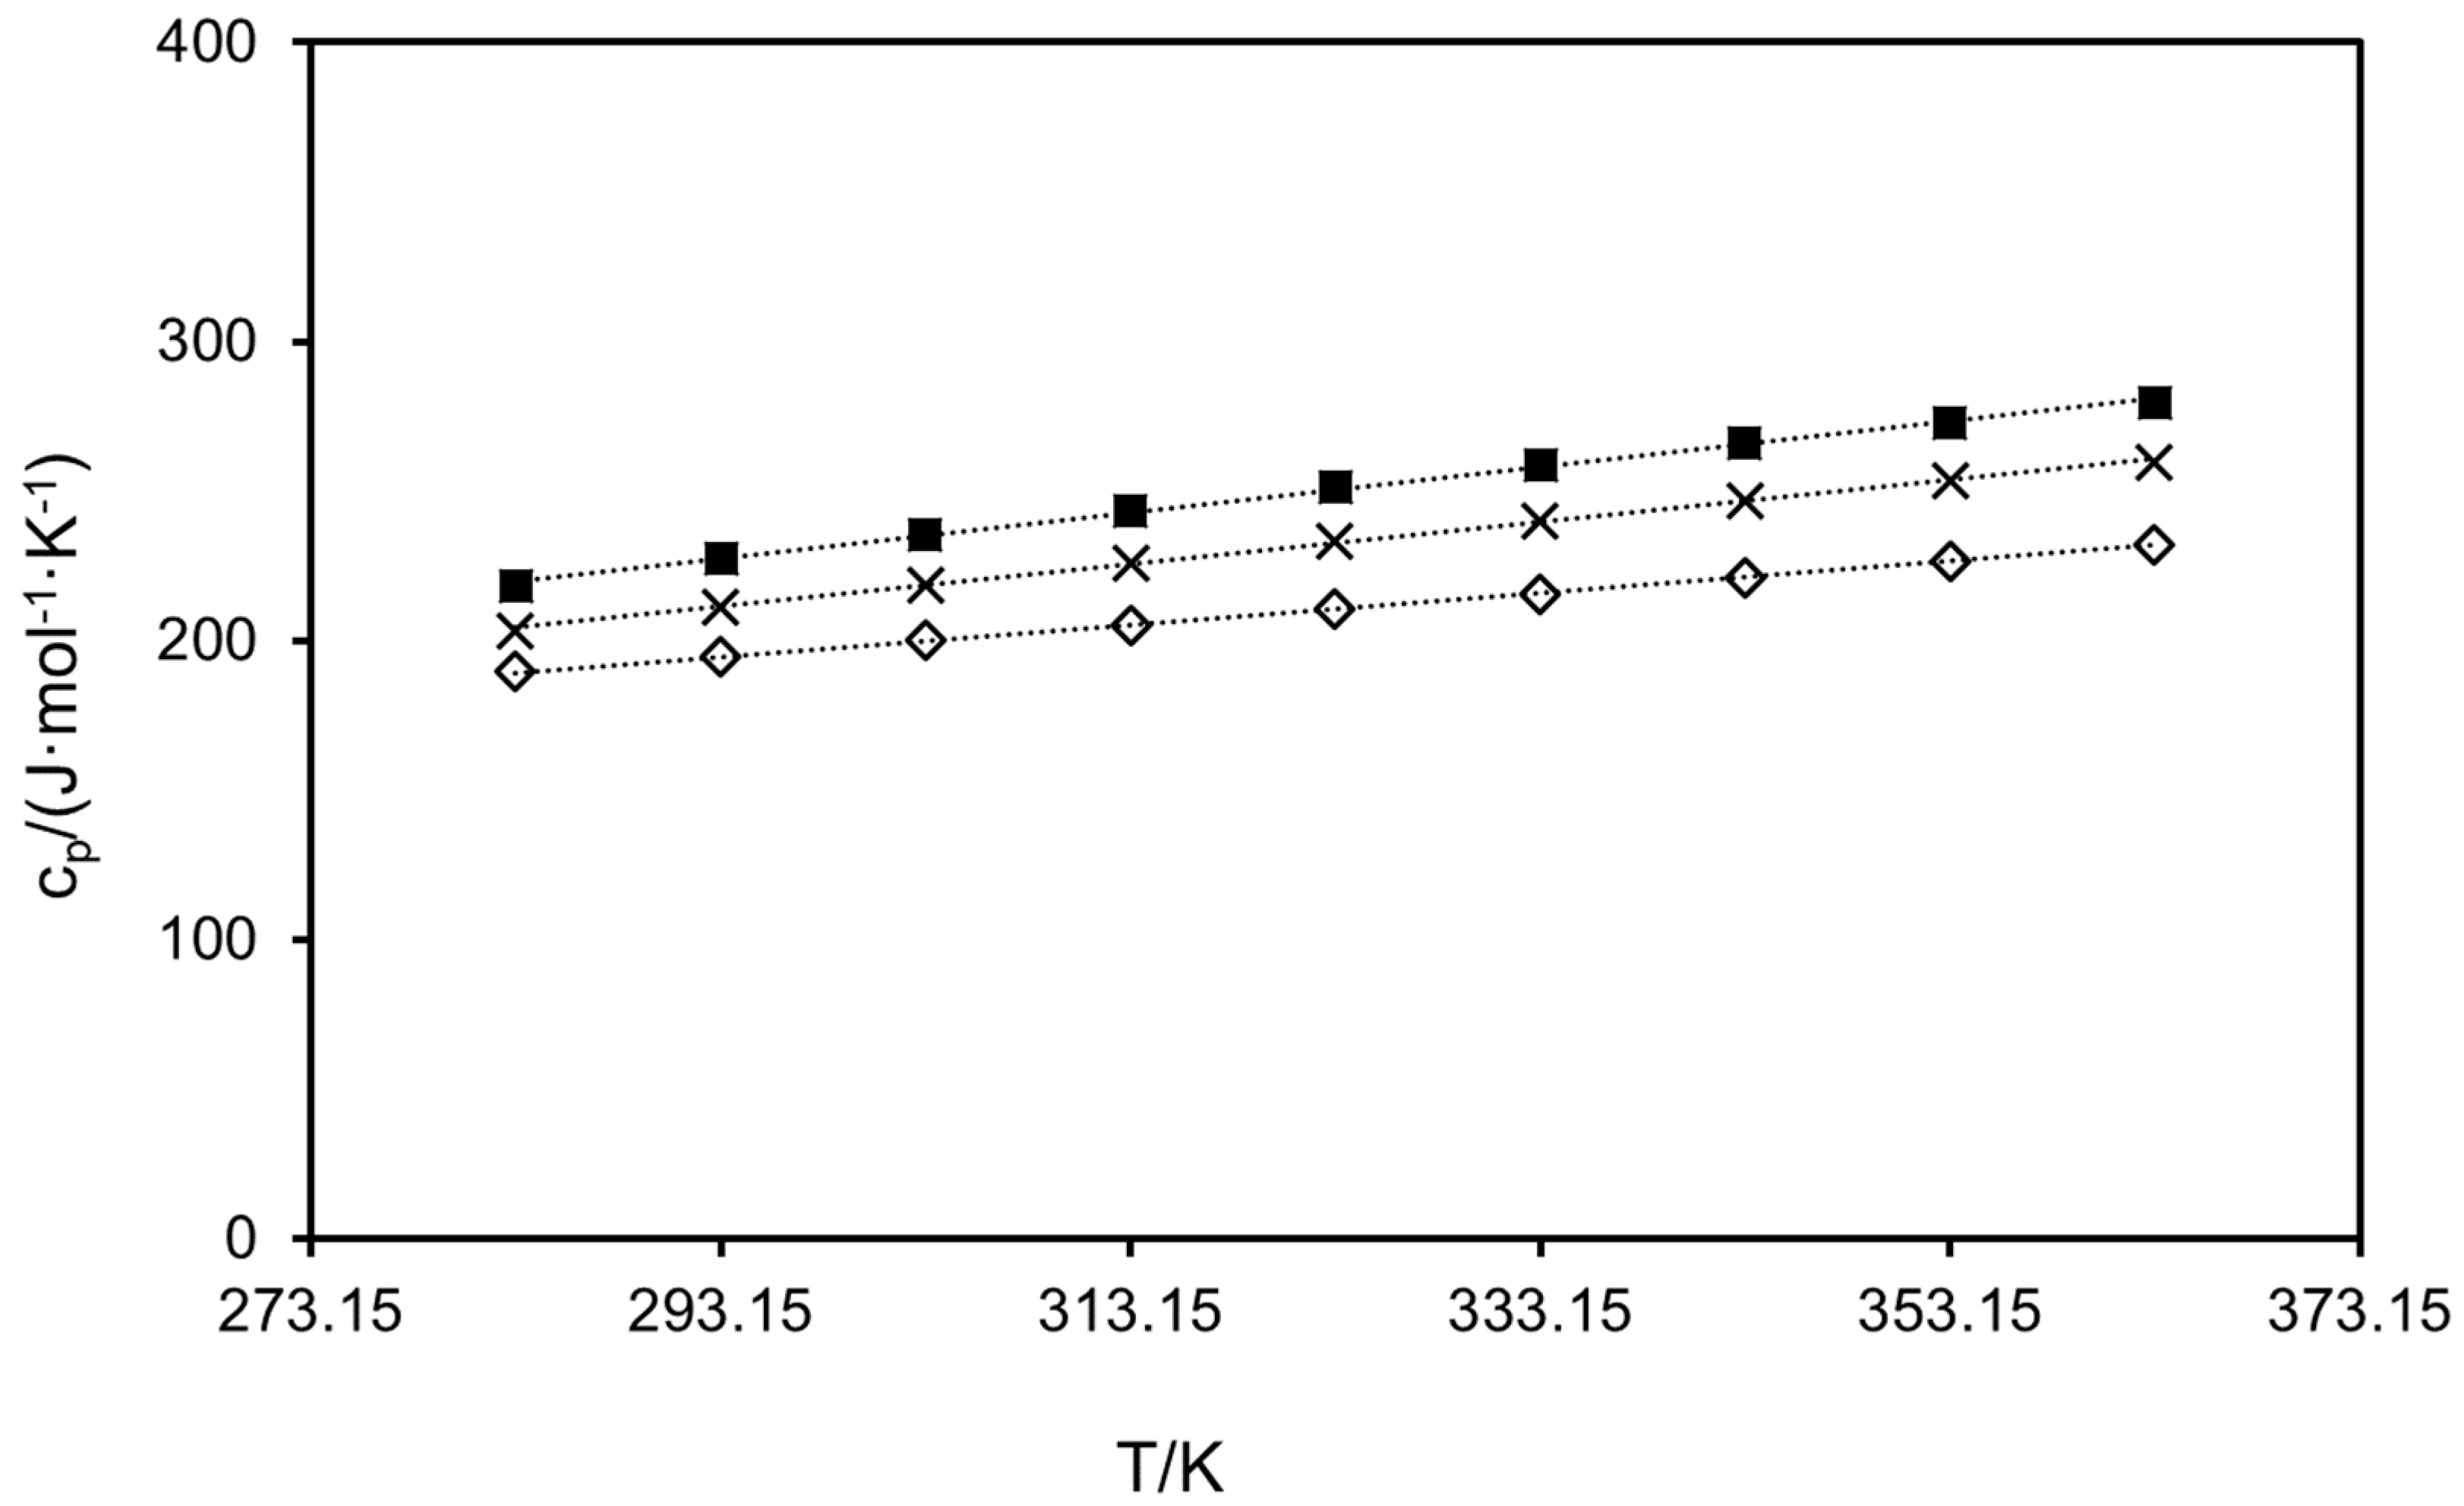
2.2. Heat Capacities
3. Materials and Methods
3.1. Materials
3.2. Methods
3.2.1. Thermal Analysis
Melting Point and Enthalpy of Fusion
3.2.2. Heat Capacity
3.2.3. Thermogravimetric Analysis
4. Conclusions
Supplementary Materials
Author Contributions
Funding
Data Availability Statement
Acknowledgments
Conflicts of Interest
References
- Ashrafizaveh, S.; Ashrafizadeh, M.; Zarrabi, A.; Husmandi, K.; Zabolian, A.; Shahinozzaman, M.; Aref, A.R.; Hamblin, M.R.; Nabavi, N.; Crea, F.; et al. Long non-coding RNAs in the doxorubicin resistance of cancer cells. Cancer Lett. 2021, 508, 104–114. [Google Scholar] [CrossRef] [PubMed]
- Joy, A.T.; Harish, M.; Rishad, K.S. Anti-Inflammatory Activity of Phytoconstituents of Ginseng Plant—Insilico Approach. Biomed. Pharmacol. J. 2023, 16, 1179–1188. [Google Scholar] [CrossRef]
- Aliaño-González, M.J.; Gabaston, J.; Ortiz-Somovilla, V.; Cantos-Villar, E. Wood Waste from Fruit Trees: Biomolecules and Their Applications in Agri-Food Industry. Biomolecules 2022, 12, 238. [Google Scholar] [CrossRef] [PubMed]
- Auguste, S.; Yan, B.; Magina, R.; Xue, L.; Neto, C.; Guo, M. Cranberry extracts and cranberry polyphenols induce mitophagy in human fibroblast cells. Food Biosci. 2023, 57, 103549. [Google Scholar] [CrossRef]
- Li, W.; Chen, H.; Xu, B.; Wang, Y.; Zhang, C.; Cao, Y.; Xing, X. Research progress on classification, sources and functions of dietary polyphenols for prevention and treatment of chronic diseases. J. Future Foods 2023, 3, 289–305. [Google Scholar] [CrossRef]
- Abotaleb, M.; Samuel, S.M.; Varghese, E.; Varghese, S.; Kubatka, P.; Liskova, A.; Büsselberg, D. Flavonoids in cancer and apoptosis. Cancers 2019, 11, 28. [Google Scholar] [CrossRef] [PubMed]
- Poveda, J.M.; Loarce, L.; Alarcón, M.; Díaz-Maroto, M.C.; Alañón, M.E. Revalorization of winery by-products as source of natural preservatives obtained by means of green extraction techniques. Ind. Crops Prod. 2018, 112, 617–625. [Google Scholar] [CrossRef]
- Russo, G.L.; Spagnuolo, C.; Russo, M.; Tedesco, I.; Moccia, S.; Cervellera, C. Mechanisms of aging and potential role of selected polyphenols in extending healthspan. Biochem. Pharmacol. Inc. 2020, 173, 113719. [Google Scholar] [CrossRef]
- Trujillo-Mayol, I.; Sobral, M.M.C.; Viegas, O.; Cunha, S.C.; Alarcón-Enos, J.; Pinho, O.; Ferreira, I.M. Incorporation of avocado peel extract to reduce cooking-induced hazards in beef and soy burgers: A clean label ingredient. Food Res. Int. 2021, 147, 110434. [Google Scholar] [CrossRef]
- López-Pedrouso, M.; Lorenzo, J.M.; Franco, D. Advances in Natural Antioxidants for Food Improvement. Antioxidants 2022, 11, 1825. [Google Scholar] [CrossRef]
- Pinela, J.; Prieto, M.; Barreiro, M.F.; Carvalho, A.M.; Oliveira, M.B.P.; Curran, T.P.; Ferreira, I.C. Valorisation of tomato wastes for development of nutrient-rich antioxidant ingredients: A sustainable approach towards the needs of the today’s society. Innov. Food Sci. Emerg. Technol. 2017, 41, 160–171. [Google Scholar] [CrossRef]
- Montagner, G.E.; Wingert, N.R.; Stein, C.d.S.; Moresco, R.N.; Fogaça, A.d.O.; Gomes, P. Optimization of the extraction of antioxidant compounds from grape seed from winemaking waste. Sustain. Chem. Pharm. 2022, 30, 100856. [Google Scholar] [CrossRef]
- Ghasemzadeh, A.; Baghdadi, A.; Jaafar, H.Z.E.; Swamy, M.K.; Megat Wahab, P.E. Optimization of flavonoid extraction from red and brown rice bran and evaluation of the antioxidant properties. Molecules 2018, 23, 1863. [Google Scholar] [CrossRef] [PubMed]
- Kumar, M.; Dahuja, A.; Sachdev, A.; Tomar, M.; Lorenzo, J.M.; Dhumal, S.; Radha, M.; Chandran, D.; Varghese, E.; Saha, S.; et al. Optimization of the use of cellulolytic enzyme preparation for the extraction of health promoting anthocyanins from black carrot using response surface methodology. LWT 2022, 163, 113528. [Google Scholar] [CrossRef]
- Gómez-Mejía, E.; Vicente-Zurdo, D.; Rosales-Conrado, N.; León-González, M.E.; Madrid, Y. Screening the extraction process of phenolic compounds from pressed grape seed residue: Towards an integrated and sustainable management of viticultural waste. LWT 2022, 169, 113988. [Google Scholar] [CrossRef]
- Zentelis, A.D.; Kodjapashis, M.P.; Kotrotsos, N.; Zagklis, D.P.; Sygouni, V.; Lamari, F.N.; Paraskeva, C.A. Separation, Isolation, and Enrichment of Samples of Phenolic Compounds from Winemaking By-Products. Sustainability 2023, 15, 12221. [Google Scholar] [CrossRef]
- Fernandez, A.; Sette, P.; Echegaray, M.; Soria, J.; Salvatori, D.; Mazza, G.; Rodriguez, R. Clean recovery of phenolic compounds, pyro-gasification thermokinetics, and bioenergy potential of spent agro-industrial bio-wastes. Biomass. Convers. Biorefin. 2023, 13, 12509–12526. [Google Scholar] [CrossRef]
- Pollini, L.; Blasi, F.; Ianni, F.; Grispoldi, L.; Moretti, S.; Di Veroli, A.; Cossignani, L.; Cenci-Goga, B.T. Ultrasound-Assisted Extraction and Characterization of Polyphenols from Apple Pomace, Functional Ingredients for Beef Burger Fortification. Molecules 2022, 27, 1993. [Google Scholar] [CrossRef]
- Vorobyova, V.; Vasyliev, G.; Skiba, M.; Frolenkova, S.; Zaporozhets, J.; Gnatko, O.; Linyucheva, O. Green extraction of phenolic compounds from grape pomace by deep eutectic solvent extraction: Physicochemical properties, antioxidant capacity. Chem. Pap. 2023, 77, 2447–2458. [Google Scholar] [CrossRef]
- Mattonai, M.; Massai, P.; Ribechini, E. Sustainable microwave-assisted eutectic solvent extraction of polyphenols from vine pruning residues. Microchem. J. 2024, 197, 109816. [Google Scholar] [CrossRef]
- Hobbi, P.; Okoro, O.V.; Hajiabbas, M.; Hamidi, M.; Nie, L.; Megalizzi, V.; Musonge, P.; Dodi, G.; Shavandi, A. Chemical Composition, Antioxidant Activity and Cytocompatibility of Polyphenolic Compounds Extracted from Food Industry Apple Waste: Potential in Biomedical Application. Molecules 2023, 28, 675. [Google Scholar] [CrossRef] [PubMed]
- Caldas, T.W.; Mazza, K.E.L.; Teles, A.S.C.; Mattos, G.N.; Brígida, A.I.S.; Conte-Junior, C.A.; Borguini, R.G.; Godoy, R.L.O.; Cabral, L.M.C.; Tonon, R.V. Phenolic compounds recovery from grape skin using conventional and non-conventional extraction methods. Ind. Crops. Prod. 2018, 111, 86–91. [Google Scholar] [CrossRef]
- Panche, A.N.; Diwan, A.D.; Chandra, S.R. Flavonoids: An overview. J. Nutr. Sci. 2016, 5, 5–15. [Google Scholar] [CrossRef] [PubMed]
- Patel, K.; Patel, D.K. Medicinal Importance and Therapeutic Benefit of Bioactive Flavonoid Eriocitrin: An Update on Pharmacological Activity and Analytical Aspects. Nat. Prod. J. 2024, 14, 2. [Google Scholar] [CrossRef]
- Brezoiu, A.-M.; Matei, C.; Deaconu, M.; Stanciuc, A.-M.; Trifan, A.; Gaspar-Pintiliescu, A.; Berger, D. Polyphenols extract from grape pomace. Characterization and valorisation through encapsulation into mesoporous silica-type matrices. Food Chem. Toxicol. 2019, 133, 110787. [Google Scholar] [CrossRef]
- Marrero, J.; Gani, R. Group-contribution based estimation of pure component properties. Fluid Phase Equilib. 2001, 183–184, 183–208. [Google Scholar] [CrossRef]
- Franklin, S.J.; Myrdal, P.B. Solid-State and Solution Characterization of Myricetin. AAPS PharmSciTech 2015, 16, 1400–1408. [Google Scholar] [CrossRef] [PubMed]
- Yan, T.; Tao, Y.; Wang, X.; Lv, C.; Miao, G.; Wang, S.; Wang, D.; Wang, Z. Preparation, characterization and evaluation of the antioxidant capacity and antitumor activity of myricetin microparticles formated by supercritical antisolvent technology. J. Supercrit. Fluids 2021, 175, 105290. [Google Scholar] [CrossRef]
- Corina, D.; Bojin, F.; Ambrus, R.; Muntean, D.; Soica, C.; Paunescu, V.; Cristea, M.; Pinzaru, I.; Dehelean, C. Physico-chemical and Biological Evaluation of Flavonols: Fisetin, Quercetin and Kaempferol Alone and Incorporated in beta Cyclodextrins. Anti-Cancer Agents Med. Chem. 2017, 17, 615–626. [Google Scholar] [CrossRef]
- Zhao, Z.; Xiong, W.; Ju, X.; Yao, Y.; Zhang, J.; Wang, L. Fabrication and Characterization of Resveratrol-Loaded Gliadin Particles Stabilized by Gelatin. Food Biophys. 2023, 18, 510–519. [Google Scholar] [CrossRef]
- Xie, X.; Jin, X.; Huang, J.; Yi, J.; Li, X.; Huang, Z.; Lin, Q.; Guo, B. High resveratrol-loaded microcapsules with trehalose and OSA starch as the wall materials: Fabrication, characterization, and evaluation. Int. J. Biol. Macromol. 2023, 242, 124825. [Google Scholar] [CrossRef] [PubMed]
- Yang, X.; Shen, J.; Liu, J.; Yang, Y.; Hu, A.; Ren, N.; Cheng, Z.; Liu, W. Spray-Drying of Hydroxypropyl β-Cyclodextrin Microcapsules for Co-Encapsulation of Resveratrol and Piperine with Enhanced Solubility. Crystals 2022, 12, 596. [Google Scholar] [CrossRef]
- Bhatt, P.; Fnu, G.; Bhatia, D.; Shahid, A.; Sutariya, V. Nanodelivery of Resveratrol-Loaded PLGA Nanoparticles for Age-Related Macular Degeneration. AAPS PharmSciTech 2020, 21, 291. [Google Scholar] [CrossRef] [PubMed]
- Zhou, Z.; Li, W.; Sun, W.-J.; Lu, T.; Tong, H.H.; Sun, C.C.; Zheng, Y. Resveratrol cocrystals with enhanced solubility and tabletability. Int. J. Pharm. 2016, 509, 391–399. [Google Scholar] [CrossRef] [PubMed]
- Zhang, X.P.; Le, Y.; Wang, J.X.; Zhao, H.; Chen, J.F. Resveratrol nanodispersion with high stability and dissolution rate. LWT 2013, 50, 622–628. [Google Scholar] [CrossRef]
- Li, S.; Yuan, L.; Zhang, B.; Zhou, W.; Wang, X.; Bai, D. Photostability and antioxidant activity studies on the inclusion complexes of: Trans -polydatin with β-cyclodextrin and derivatives. RSC Adv. 2018, 8, 25941–25948. [Google Scholar] [CrossRef] [PubMed]
- Zhang, J.Q.; Jiang, K.M.; Xie, X.G.; Jin, Y.; Lin, J. Water-soluble inclusion complexes of trans-polydatin by cyclodextrin complexation: Preparation, characterization and bioactivity evaluation. J. Mol. Liq. 2016, 219, 592–598. [Google Scholar] [CrossRef]
- Kang, M.; Du, D.; Zhang, S.; Zhang, S.; Li, Z.; Dongye, Z.; Wang, L.; Qian, Y.; Chen, C.; Cheng, X.; et al. Non-covalent Complexes Between β-lactoglobulin and Baicalein: Characteristics and Binding Properties. Food Biophys. 2024, 19, 58–70. [Google Scholar] [CrossRef]
- Raghav, S.S.; Kumar, B.; Sethiya, N.K.; Pahwa, S. Development and optimization of kaempferol loaded ethosomes using Box–Behnken statistical design: In vitro and ex-vivo assessments. J. Biomed. Mater. Res. B Appl. Biomater. 2024, 112, e35394. [Google Scholar] [CrossRef] [PubMed]
- Zhou, H.; Duan, C.; Qin, H.; Huang, C.; Hou, J.; Chen, Y.; Zhu, J.; Xu, C.; Jin, J.; Zhuang, T. Synthesis and structural characterization of a novel palbociclib-kaempferol cocrystal with improved tabletability and synergistic antitumor activity. J. Mol. Struct. 2023, 1281, 135101. [Google Scholar] [CrossRef]
- Colombo, M.; Melchiades, G.d.L.; Michels, L.R.; Figueiró, F.; Bassani, V.L.; Teixeira, H.F.; Koester, L.S. Solid Dispersion of Kaempferol: Formulation Development, Characterization, and Oral Bioavailability Assessment. AAPS PharmSciTech. 2019, 20, 106. [Google Scholar] [CrossRef]
- Krekora, M.; Markiewicz, K.H.; Wilczewska, A.Z.; Nawrocka, A. Raman and thermal (TGA and DSC) studies of gluten proteins supplemented with flavonoids and their glycosides. J. Cereal Sci. 2023, 111, 103672. [Google Scholar] [CrossRef]
- Wang, L.; Li, S.; Xu, X.; Xu, X.; Wang, Q.; Li, D.; Zhang, H. Drug-drug cocrystals of theophylline with quercetin. J. Drug Deliv. Sci. Technol. 2022, 70, 103228. [Google Scholar] [CrossRef]
- Han, J.; Tong, M.; Li, S.; Yu, X.; Hu, Z.; Zhang, Q.; Xu, R.; Wang, J. Surfactant-free amorphous solid dispersion with high dissolution for bioavailability enhancement of hydrophobic drugs: A case of quercetin. Drug Dev. Ind. Pharm. 2021, 47, 153–162. [Google Scholar] [CrossRef]
- Alhajj, N.; O’Reilly, N.J.; Cathcart, H. Development and characterization of a spray-dried inhalable ciprofloxacin-quercetin co-amorphous system. Int. J. Pharm. 2022, 618, 121657. [Google Scholar] [CrossRef] [PubMed]
- Manta, K.; Papakyriakopoulou, P.; Chountoulesi, M.; Diamantis, D.A.; Spaneas, D.; Vakali, V.; Naziris, N.; Chatziathanasiadou, M.V.; Andreadelis, I.; Moschovou, K.; et al. Preparation and Biophysical Characterization of Quercetin Inclusion Complexes with β-Cyclodextrin Derivatives to be Formulated as Possible Nose-to-Brain Quercetin Delivery Systems. Mol. Pharm. 2020, 17, 4241–4255. [Google Scholar] [CrossRef]
- Hong, C.; Xie, Y.; Yao, Y.; Li, G.; Yuan, X.; Shen, H. A Novel strategy for pharmaceutical cocrystal generation without knowledge of stoichiometric ratio: Myricetin cocrystals and a ternary phase diagram. Pharm. Res. 2015, 32, 47–60. [Google Scholar] [CrossRef] [PubMed]
- Rosiak, N.; Wdowiak, K.; Tykarska, E.; Cielecka-Piontek, J. Amorphous Solid Dispersion of Hesperidin with Polymer Excipients for Enhanced Apparent Solubility as a More Effective Approach to the Treatment of Civilization Diseases. Int. J. Mol. Sci. 2022, 23, 15198. [Google Scholar] [CrossRef] [PubMed]
- Afkhami, R.; Goli, M.; Keramat, J. Loading lime by-product into derivative cellulose carrier for food enrichment. Food Sci. Nutr. 2019, 7, 2353–2360. [Google Scholar] [CrossRef]
- Joshi, S.; Dhingra, A.K.; Chopra, B.; Dass, R.; Guarve, K.; Sapra, S. Formulation and Evaluation of Solid Dispersions of Poorly Water-Soluble Drug-Hesperidin. Lett. Appl. NanoBioSci. 2023, 12, 50. [Google Scholar] [CrossRef]
- Kim, J.S. Study of flavonoid/hydroxypropyl-β;-cyclodextrin inclusion complexes by UV-Vis, FT-IR, DSC, and X-Ray diffraction analysis. Prev. Nutr. Food Sci. 2020, 25, 449–456. [Google Scholar] [CrossRef] [PubMed]
- Álvarez, C.M.; Restrepo-Uribe, L.; López, J.A.; Estrada, O.A.; Noriega, M.D.P. Improvement of stability and release of (-)-epicatechin by hot melt extrusion. J. Pol. Eng. 2020, 40, 75–85. [Google Scholar] [CrossRef]
- Shi, J.; Yu, J.; Pohorly, J.E.; Kakuda, Y. Polyphenolics in Grape Seeds-Biochemistry and Functionality. J. Med. Food. 2003, 6, 291–299. [Google Scholar] [CrossRef] [PubMed]
- Cao, R.; Zhao, Y.; Zhou, Z.; Zhao, X. Enhancement of the water solubility and antioxidant activity of hesperidin by chitooligosaccharide. J. Sci. Food Agric. 2018, 98, 2422–2427. [Google Scholar] [CrossRef] [PubMed]
- Freire, T.B.; Castro Lima CRR de Oliveira Pinto CAS de Borge, L.F.; Baby, A.R.; Velasco, M.V.R. Evaluation of interaction between natural antioxidants and chemical sunscreens aiming the photoprotective efficacy. J. Therm. Anal. Calorim. 2022, 147, 7829–7836. [Google Scholar] [CrossRef]
- Fan, W.; Zhu, W.; Zhang, X.; Xu, Y.; Di, L. Application of the combination of ball-milling and hot-melt extrusion in the development of an amorphous solid dispersion of a poorly water-soluble drug with high melting point. RSC Adv. 2019, 9, 22263–22273. [Google Scholar] [CrossRef] [PubMed]
- Gong, N.; Wang, X.; Wang, Y.; Yang, S.; Song, J.; Lu, Y.; Du, G. Control over Polymorph Formation of Polydatin in Binary Solvent System and Structural Characterization. J. Pharm. Biomed. Anal. 2020, 190, 113260. [Google Scholar] [CrossRef]
- Liu, B.; Li, Y.; Xiao, H.; Liu, Y.; Mo, H.; Ma, H.; Liang, G. Characterization of the Supermolecular Structure of Polydatin/6-O-α-Maltosyl-β-cyclodextrin Inclusion Complex. J. Food Sci. 2015, 80, C1156–C1161. [Google Scholar] [CrossRef]
- Ao, F.; Shen, W.; Ge, X.; Wang, L.; Ning, Y.; Ren, H.; Fan, G.; Huang, M. Effects of the crystallinity on quercetin loaded the Eudragit L-100 electrospun nanofibers. Colloids Surf. B Biointerfaces 2020, 195, 111264. [Google Scholar] [CrossRef]
- Moreira da Costa, E.; Maria Barbosa Filho, J.; Gomes do Nascimento, T.; Oliveira Macêdo, R. Thermal characterization of the quercetin and rutin flavonoids. Thermochim. Acta. 2002, 392–393, 79–84. [Google Scholar] [CrossRef]
- Xin, M.; Ma, Y.; Lin, W.; Xu, K.; Chen, M. Study on the structure-activity of dihydromyricetin and its new production: Myricetin by using ESR and spectroscopic techniques. J. Therm. Anal. Calorim. 2014, 116, 241–248. [Google Scholar] [CrossRef]
- Li, Y.L.; Yang, Y.; Bai, T.C.; Zhu, J.J. Heat capacity for the binary system of quercetin and poly(vinylpyrrolidone) K30. J. Chem. Eng. Data 2010, 55, 5856–5861. [Google Scholar] [CrossRef]
- Höhne, G.W.H.; Hemminger, W.F.; Flammershein, H.-J. Applications of Differential Scanning Calorimetry. In Differential Scanning Calorimetry, 2nd ed.; Springer: Berlin/Heidelberg, Germany, 2003; pp. 147–152. [Google Scholar] [CrossRef]
- Measuring Specific Heat Capacities; USER COM 7 TA TIP; Metller Toledo: Schwerzenbach, Switzerland, 1998.
| Compound | Td/K | |
|---|---|---|
| Exp. | Ref. | |
| Trans-resveratrol | 593.25 | 511.45 [55], 546.15 [56], 563.75 [34] |
| Trans-polydatin | 542.58 | 543.15.15 [57], 553.15 [58], 546.15 [37] |
| Kaempferol | 631.97 | 561.25 [54] |
| Quercetin | 623.58 | 609.15 [42], 594.15 [59], 617 [60] |
| Myricetin | 633.30 | 633.15 [61] |
| Hesperidin | 553.6 | 555.15 [42], 539.15 [54] |
| (−)-Epicatechin | 524.84 a | 521.15 K [52] |
| Compound | Tm/K | Tm,GC/K | ARDTm/% | ΔHm/J·g−1 | ΔHm,GC/J·g−1 | ARDΔHm/% |
|---|---|---|---|---|---|---|
| Trans-resveratrol | 541.95 | 486.89 | 10.16 | 294.53 | 201.52 | 31.58 |
| Trans-polydatin | 504.65 | 525.15 | 4.06 | 187.93 | 194.03 | 3.24 |
| Kaempferol | 557.51 | 525.40 | 5.76 | 163.68 | 145.78 | 10.93 |
| Quercetin | 596.49 | 538.24 | 9.77 | 176.96 | 154.39 | 12.76 |
| Myricetin | 638.75 | 557.55 | 12.71 | 81.26 | 160.88 | 97.98 |
| Hesperidin | 532.77 | 582.71 | 9.37 | 120.76 | 159.35 | 31.96 |
| (−)-Epicatechin | 524.84 | 512.01 | 2.44 | 150.78 | 170.56 | 13.12 |
| Compound | y0 | a·103 | R2 |
|---|---|---|---|
| Trans-resveratrol | 0.0181 | 2.80 | 0.998 |
| Trans-polydatin | 0.0038 | 2.81 | 0.998 |
| Kaempferol | 0.0158 | 2.46 | 0.998 |
| Quercetin | 0.1305 | 1.75 | 0.999 |
| Myricetin | 0.0134 | 2.39 | 0.998 |
| Hesperidin | 0.0456 | 2.89 | 0.998 |
| (−)-Epicatechin | 0.0318 | 2.33 | 0.990 |
| Compound | CAS Number | Source | Molecular Weight/g·mol−1 | Mass Purity a/% |
|---|---|---|---|---|
| Trans-resveratrol | 501-36-0 | TCI | 228.24 | >99.0 |
| Trans-polydatin | 65914-17-2 | Sigma-Aldrich | 390.38 | ≥95 |
| Kaempferol | 520-18-3 | Apollo Scientific | 286.24 | 98 |
| Quercetin | 117-39-5 | Sigma-Aldrich | 302.24 | ≥95 |
| Myricetin | 529-44-2 | Sigma-Aldrich | 318.24 | >97.0 |
| Hesperidin | 520-26-3 | Supelco | 610.57 | ≥99.9 |
| (−)-Epicatechin | 490-46-0 | TCI | 290.27 | ≥97.0 |
Disclaimer/Publisher’s Note: The statements, opinions and data contained in all publications are solely those of the individual author(s) and contributor(s) and not of MDPI and/or the editor(s). MDPI and/or the editor(s) disclaim responsibility for any injury to people or property resulting from any ideas, methods, instructions or products referred to in the content. |
© 2025 by the authors. Licensee MDPI, Basel, Switzerland. This article is an open access article distributed under the terms and conditions of the Creative Commons Attribution (CC BY) license (https://creativecommons.org/licenses/by/4.0/).
Share and Cite
Montenegro, I.; Pérez, C.; González, B.; Domínguez, Á.; Gómez, E. Thermal Characterization and Heat Capacities of Seven Polyphenols. Molecules 2025, 30, 199. https://doi.org/10.3390/molecules30010199
Montenegro I, Pérez C, González B, Domínguez Á, Gómez E. Thermal Characterization and Heat Capacities of Seven Polyphenols. Molecules. 2025; 30(1):199. https://doi.org/10.3390/molecules30010199
Chicago/Turabian StyleMontenegro, Iván, Carmen Pérez, Begoña González, Ángeles Domínguez, and Elena Gómez. 2025. "Thermal Characterization and Heat Capacities of Seven Polyphenols" Molecules 30, no. 1: 199. https://doi.org/10.3390/molecules30010199
APA StyleMontenegro, I., Pérez, C., González, B., Domínguez, Á., & Gómez, E. (2025). Thermal Characterization and Heat Capacities of Seven Polyphenols. Molecules, 30(1), 199. https://doi.org/10.3390/molecules30010199