

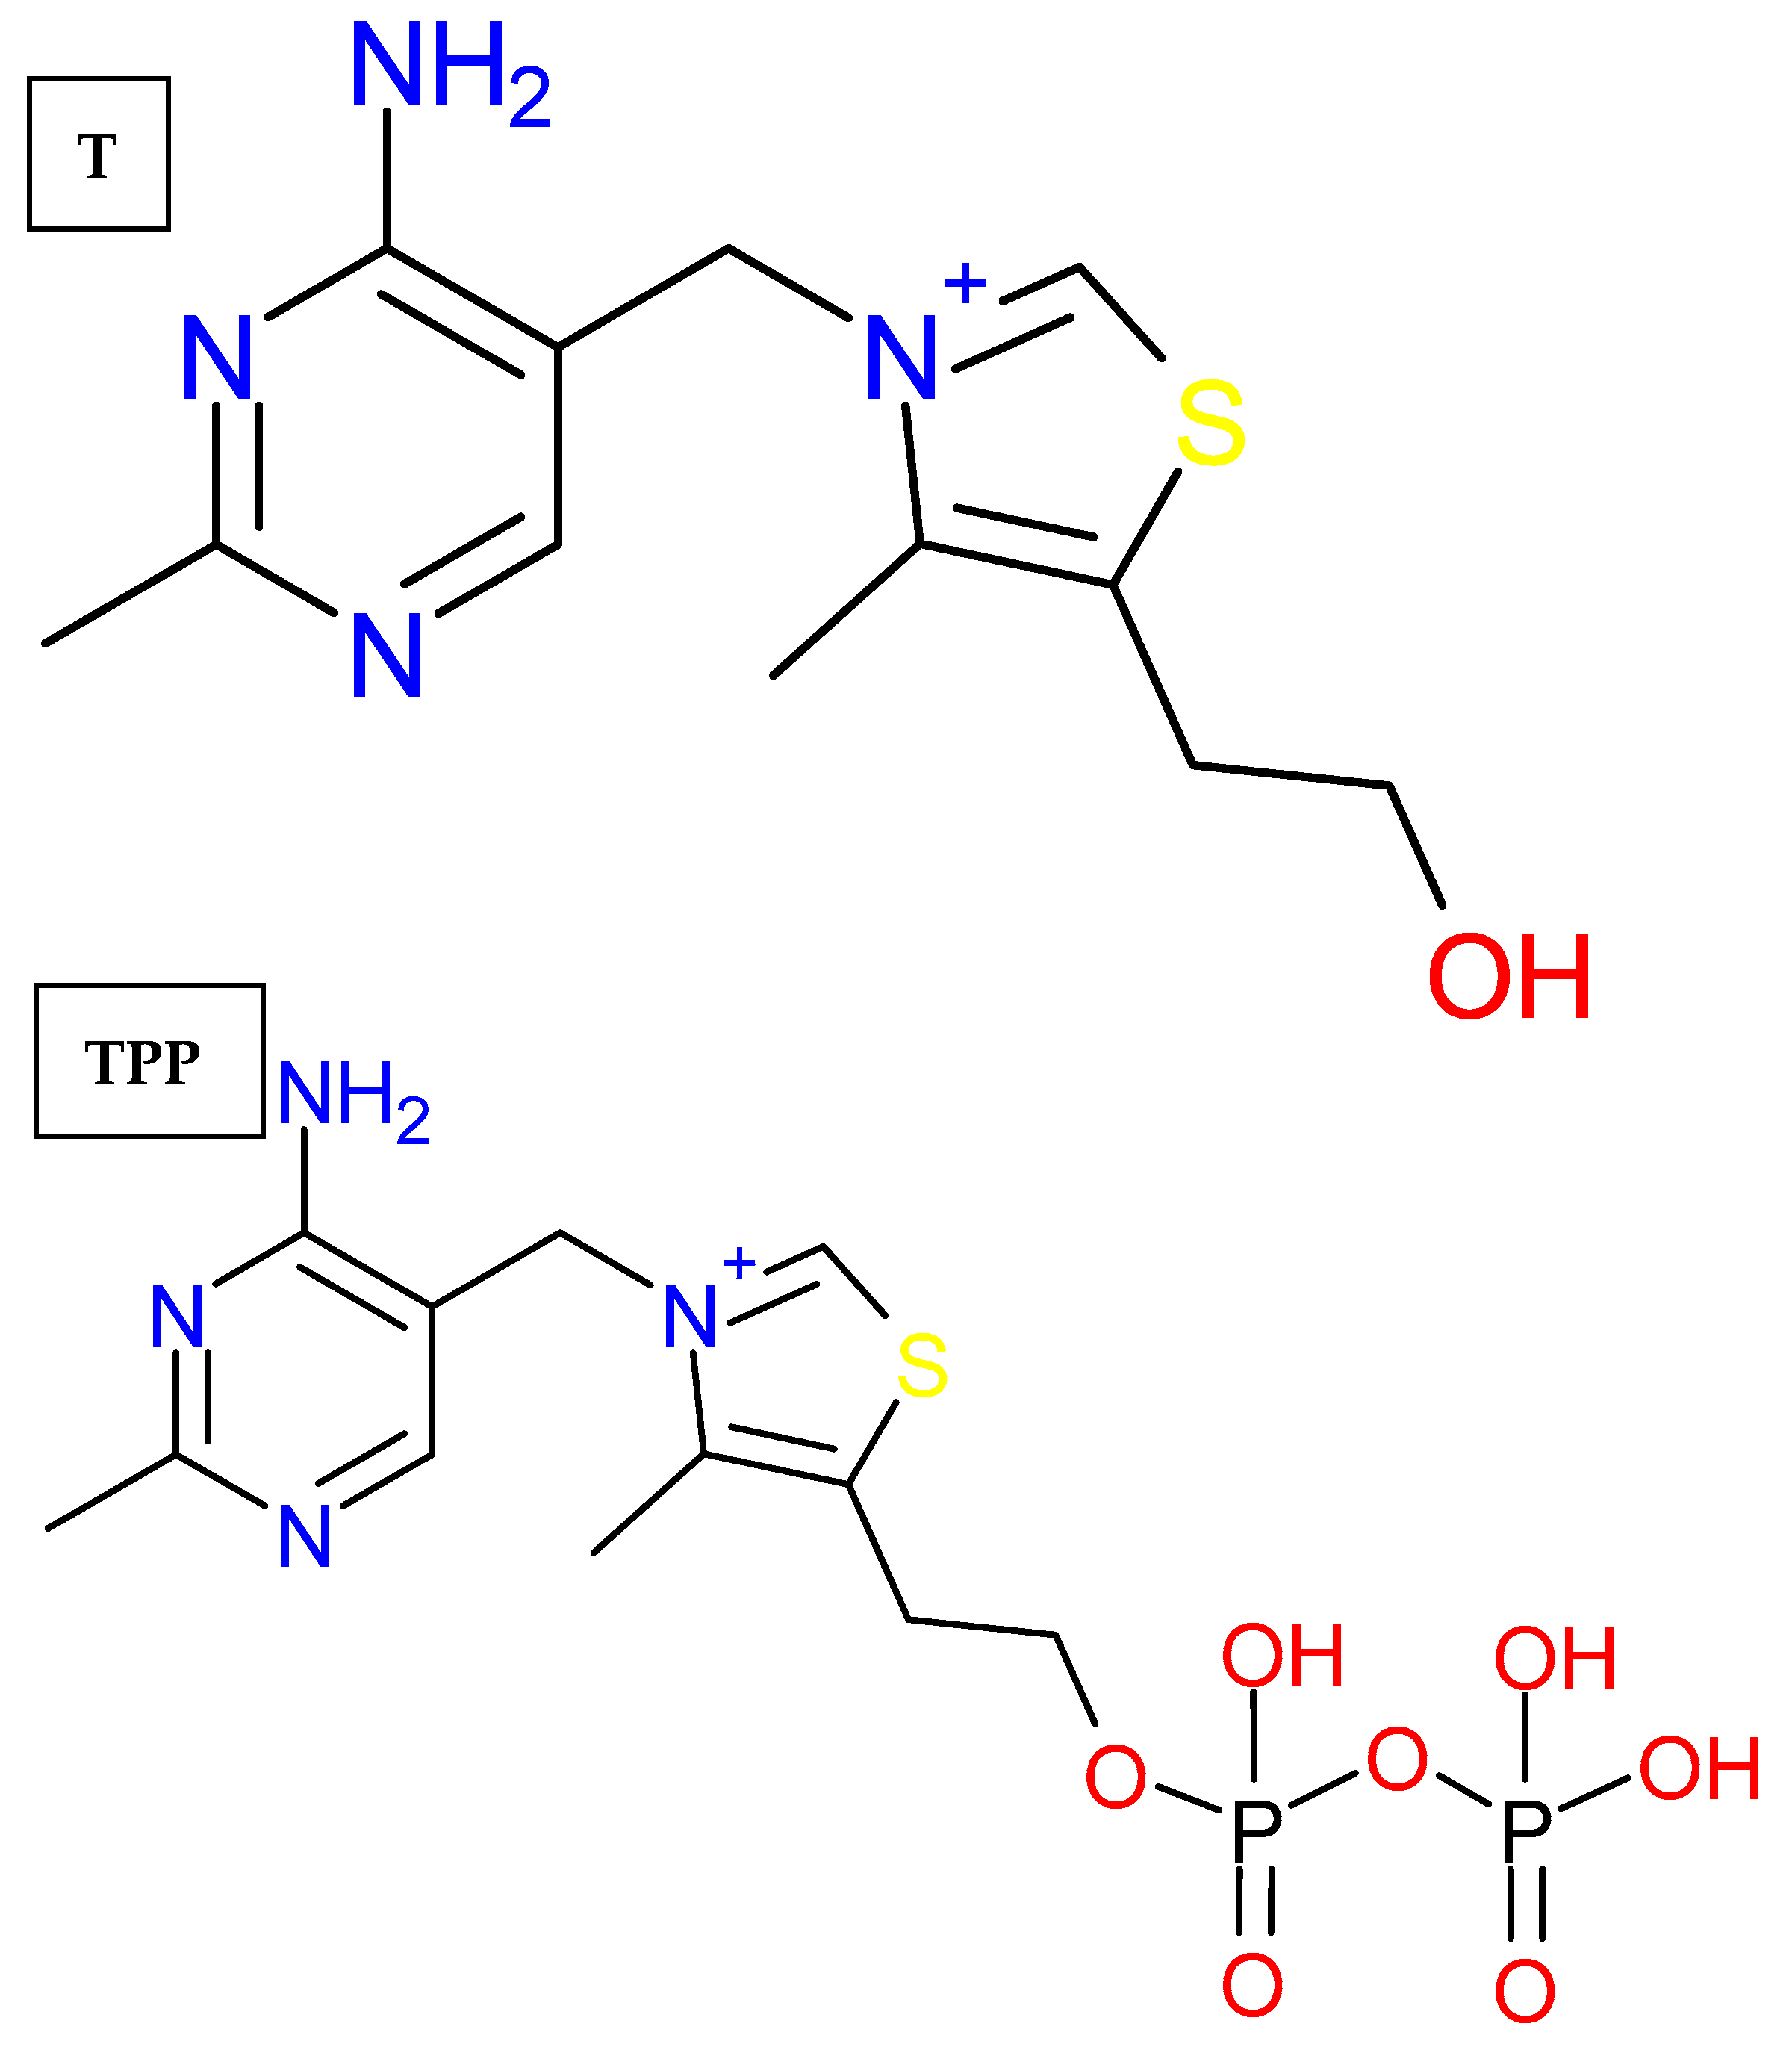
Thiamine and Thiamine Pyrophosphate as Non-Competitive Inhibitors of Acetylcholinesterase—Experimental and Theoretical Investigations


Abstract
1. Introduction
2. Results and Discussion
2.1. Experimental Results Analysis
2.2. Conclusions of Experimental Results
2.3. Molecular Modeling Analysis
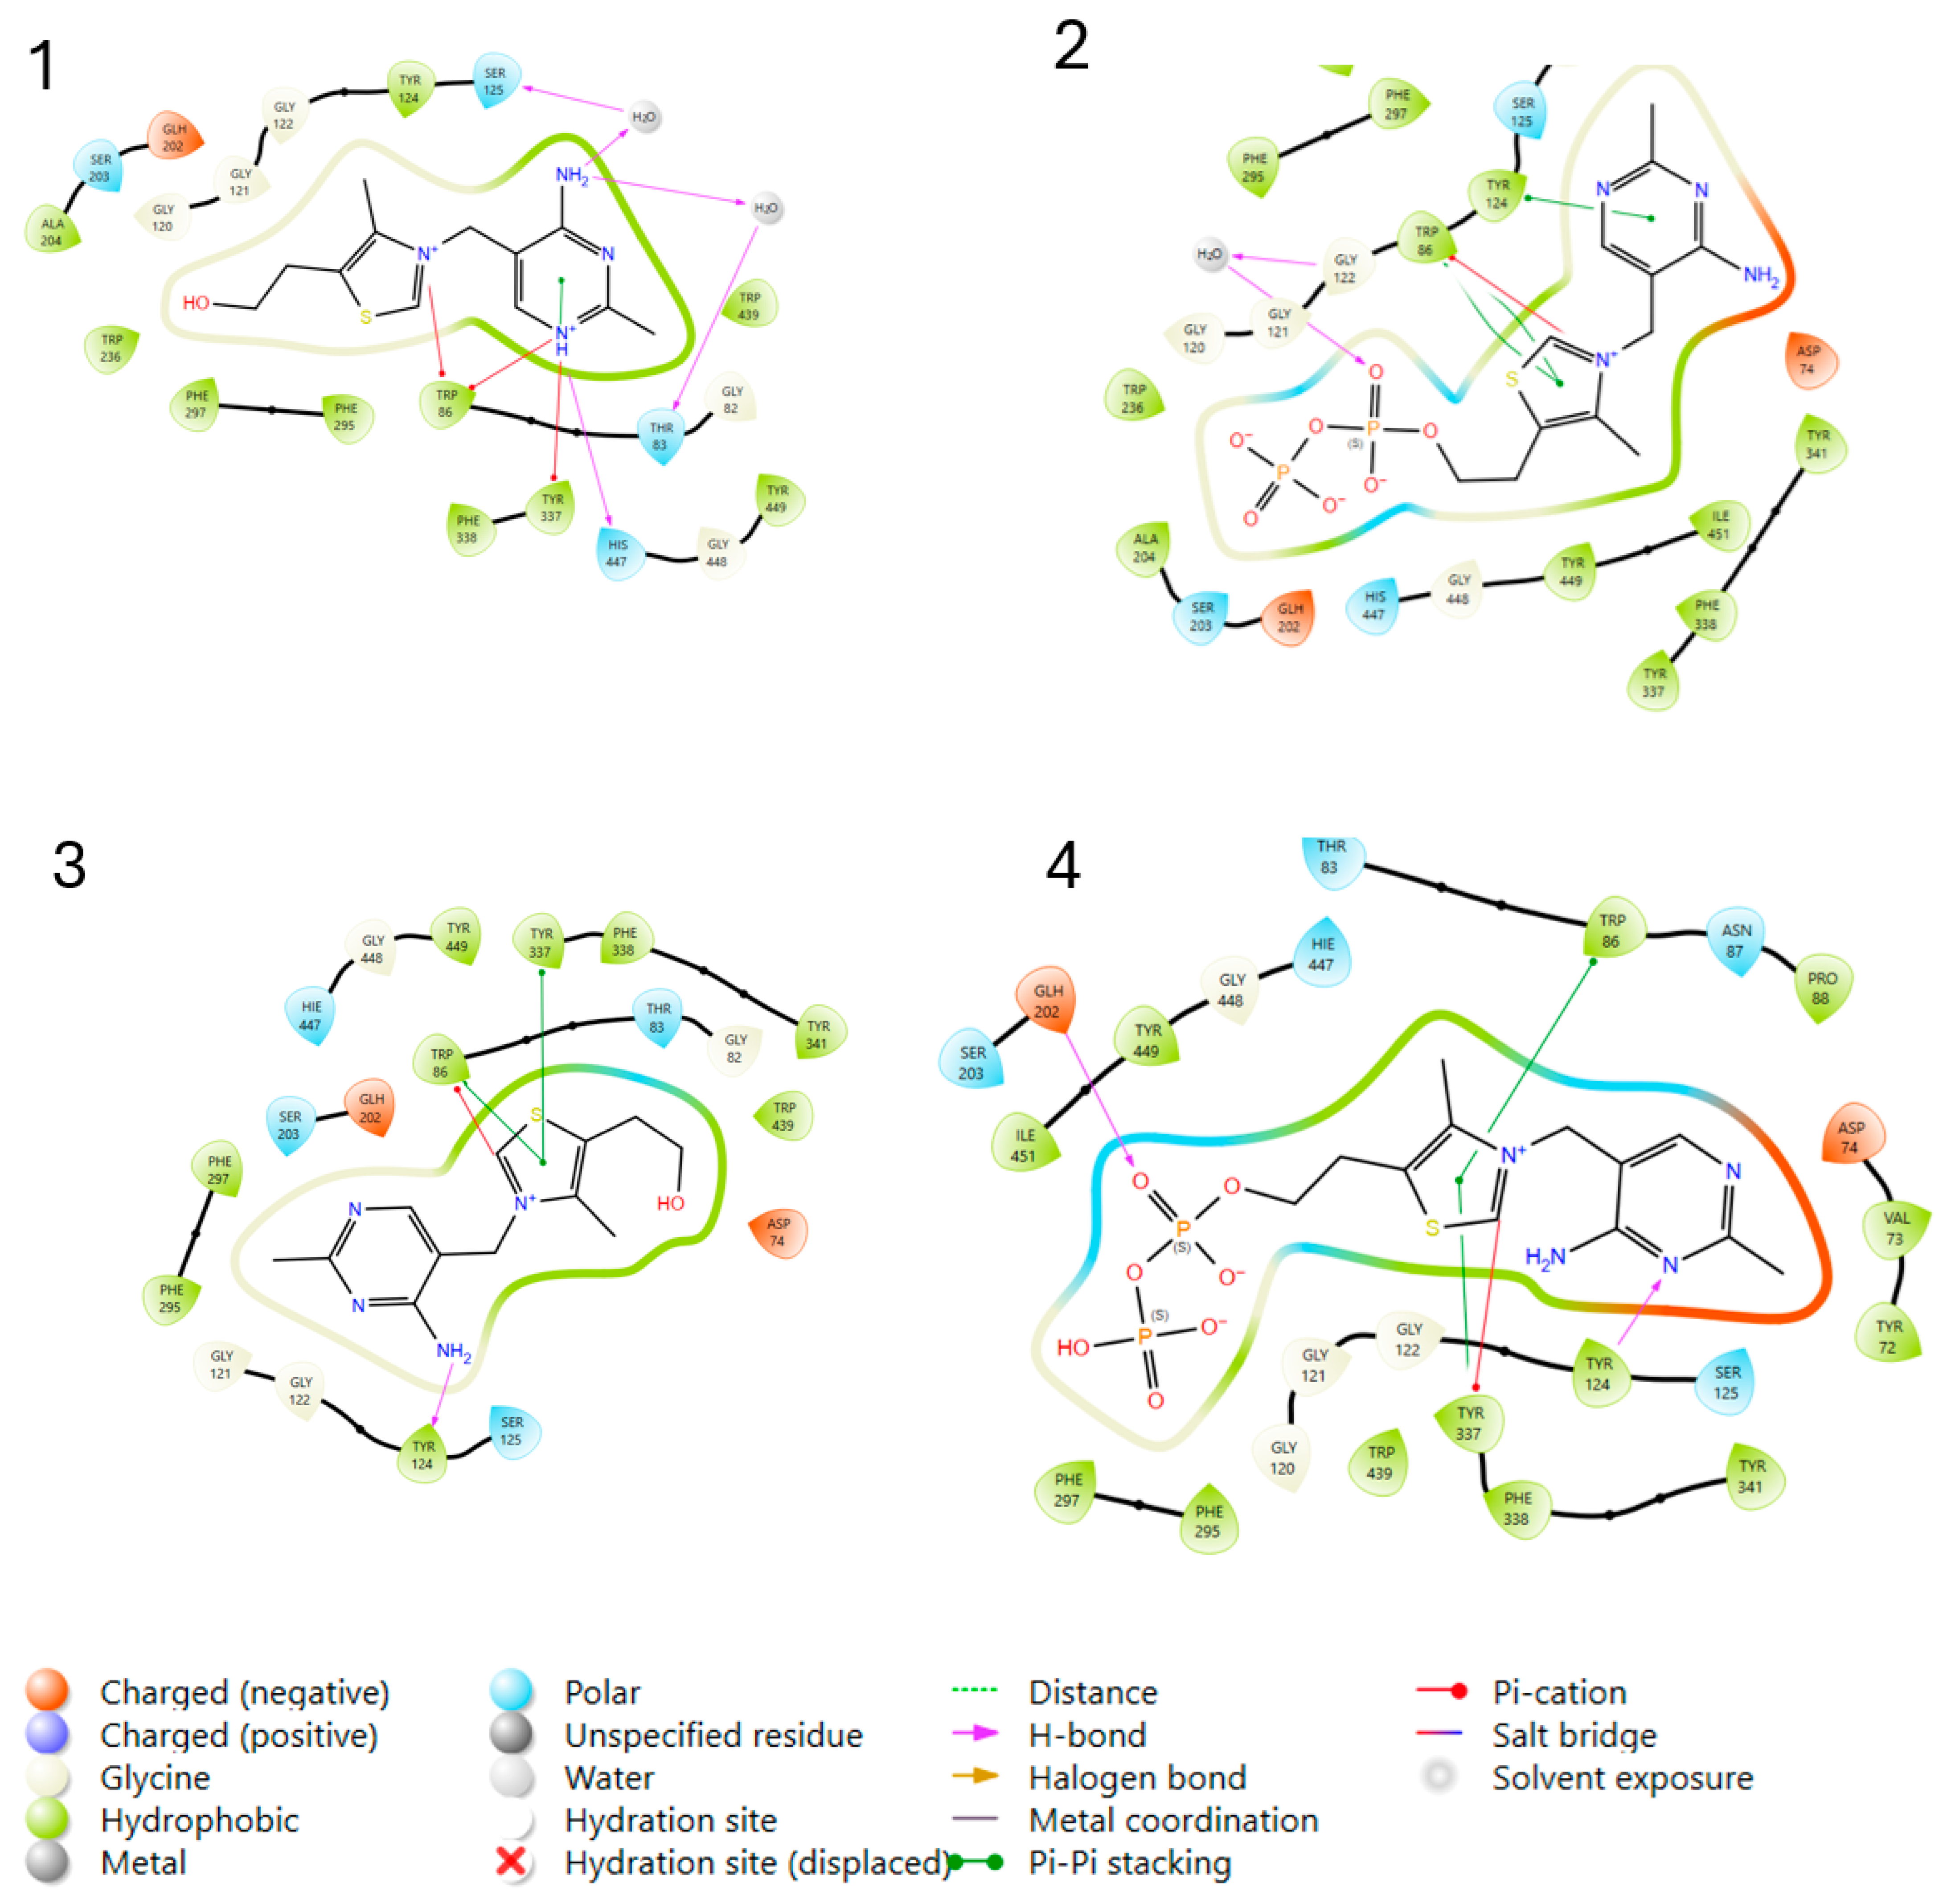
2.3.1. Molecular Docking Studies
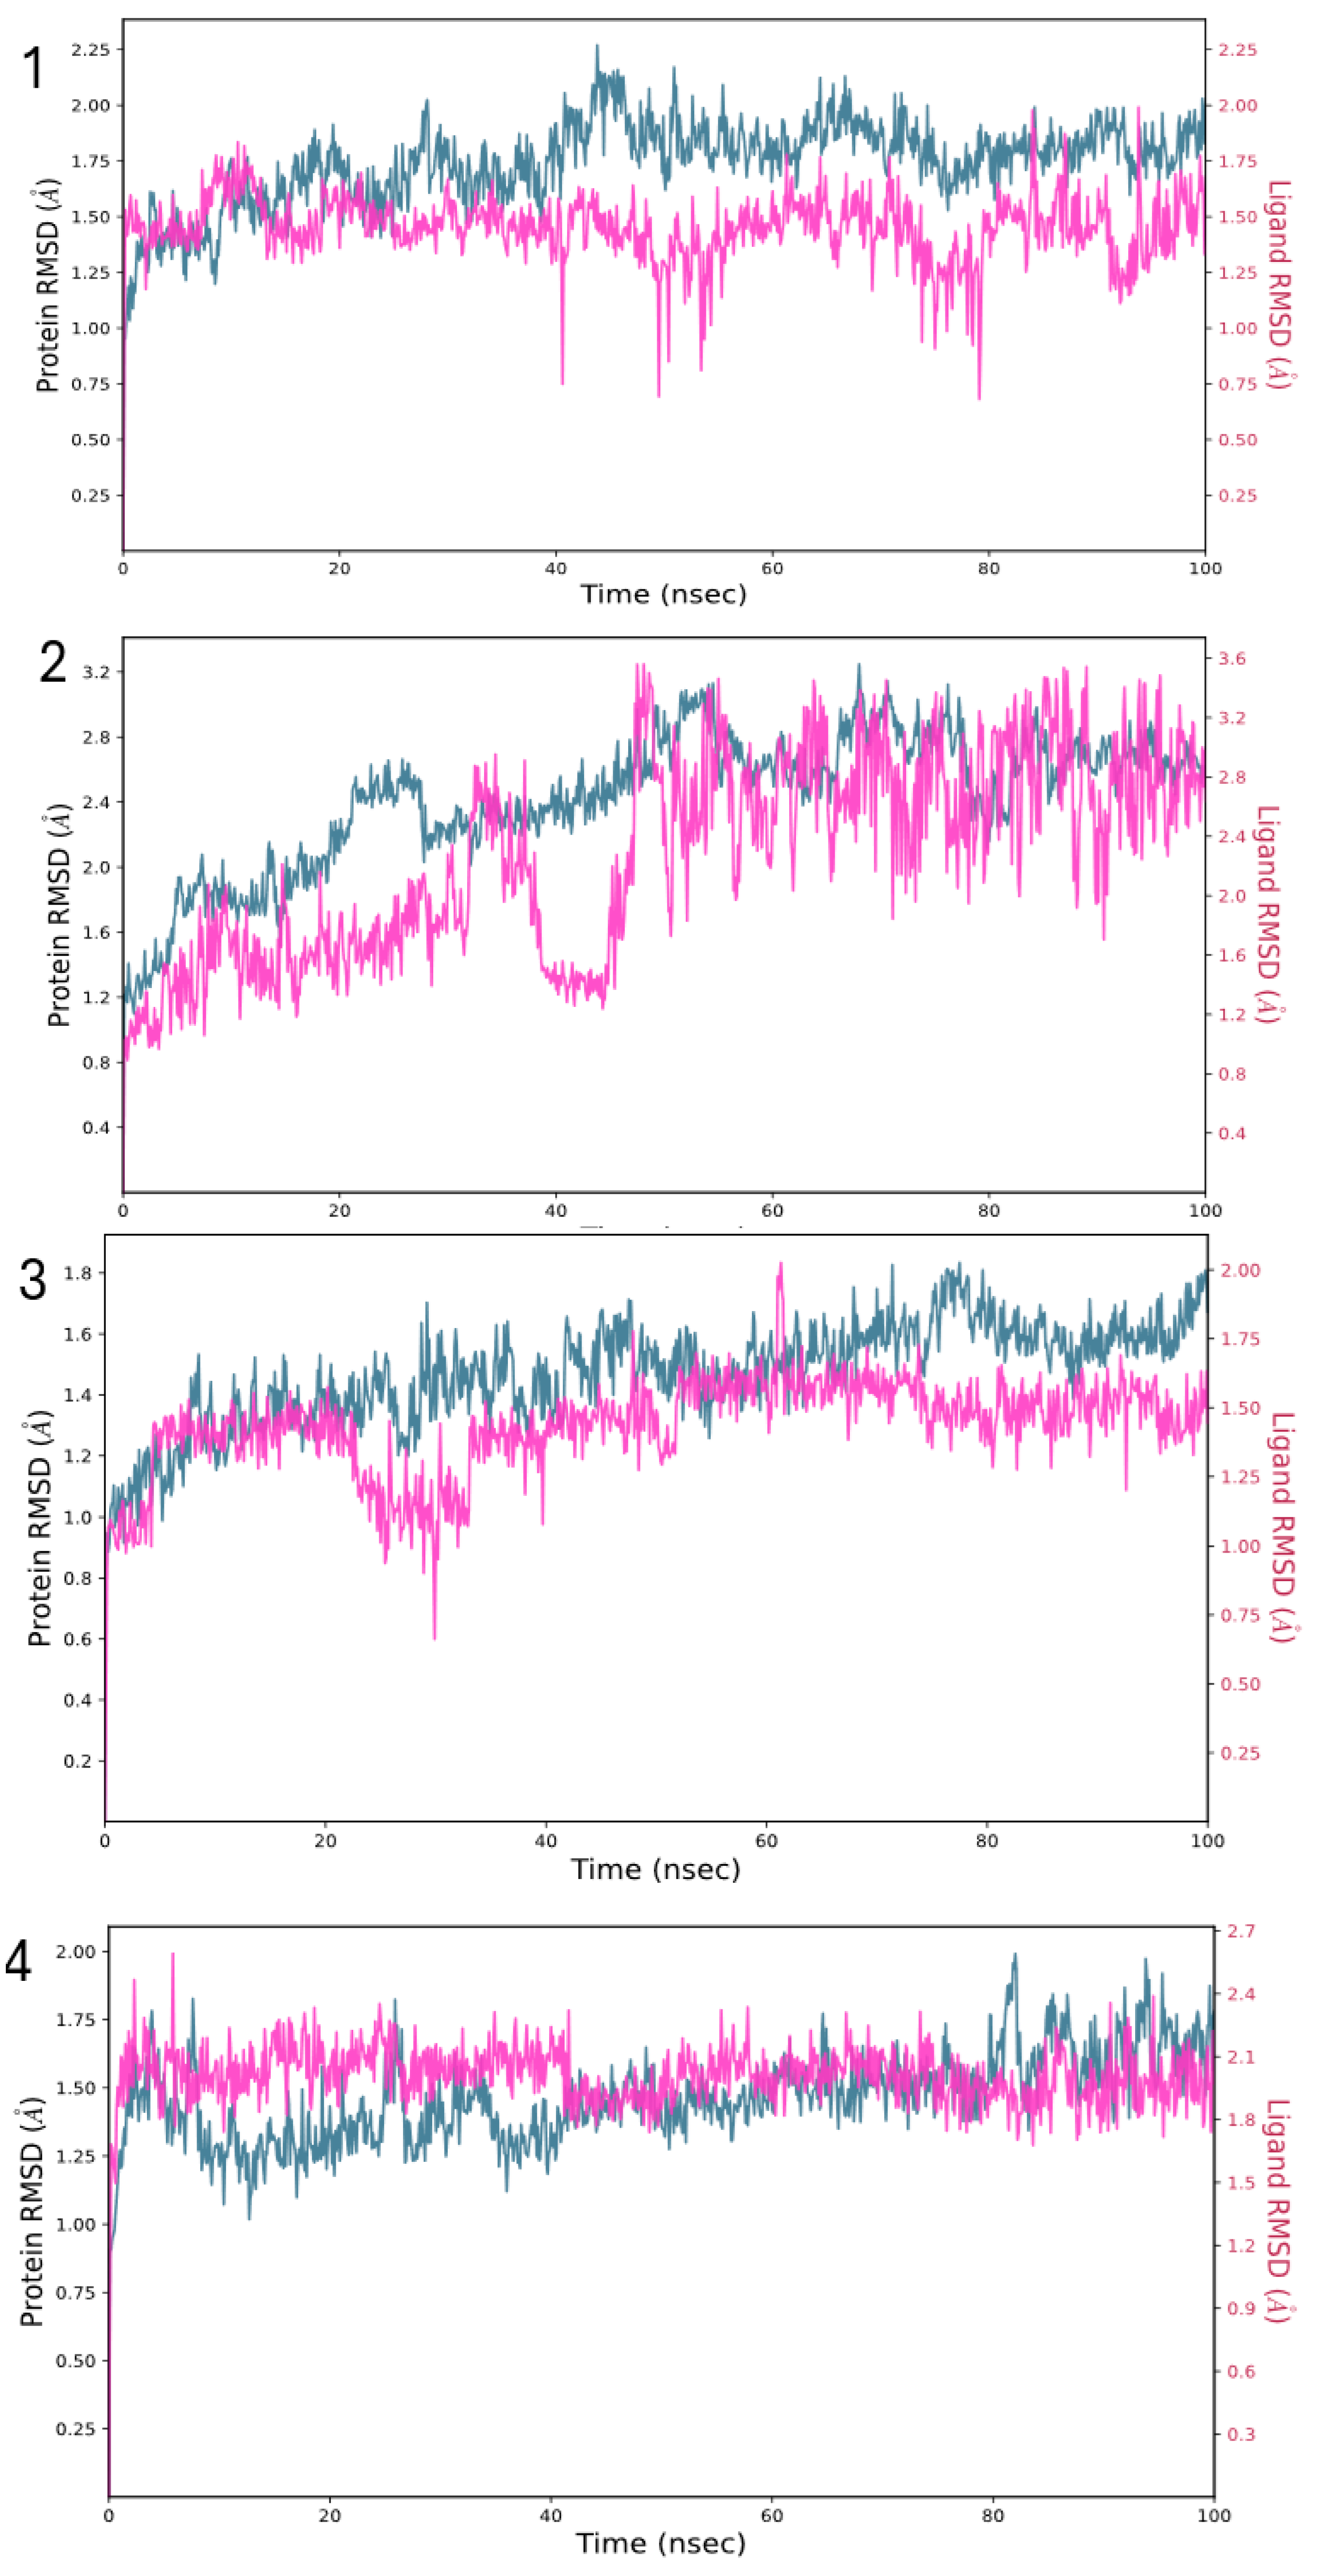
2.3.2. Molecular Dynamics (MDs) Simulations Setup
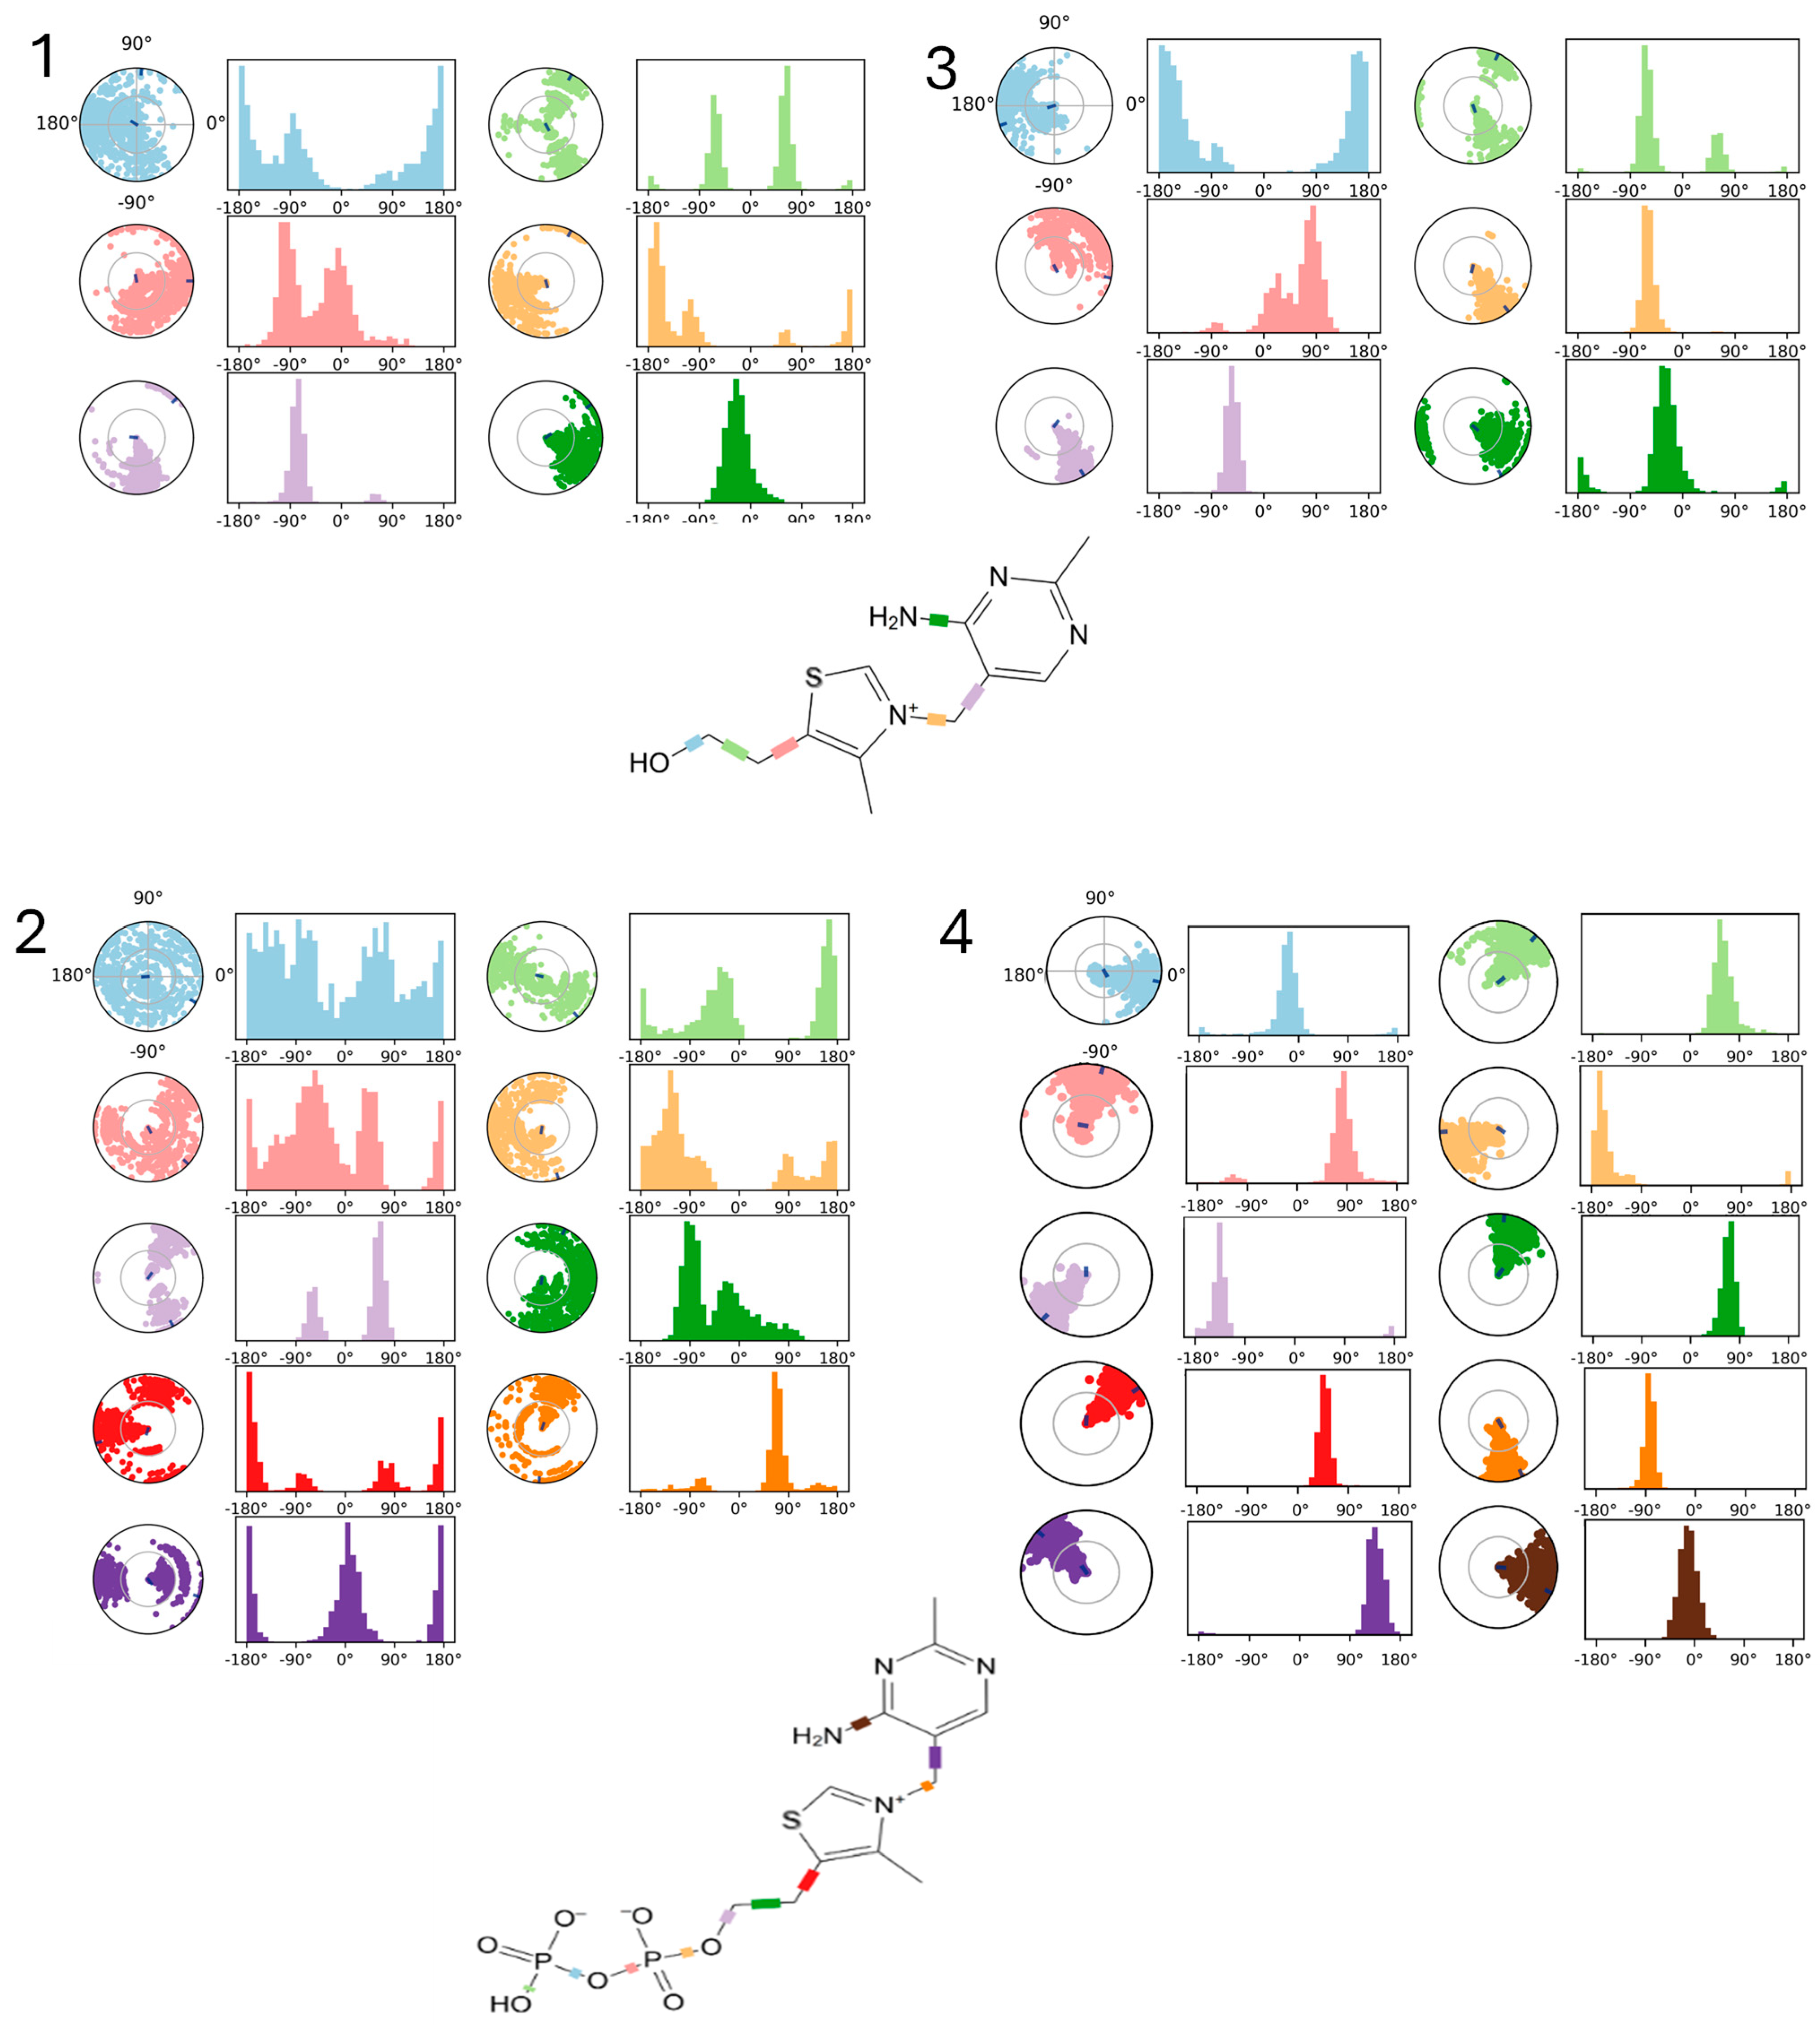
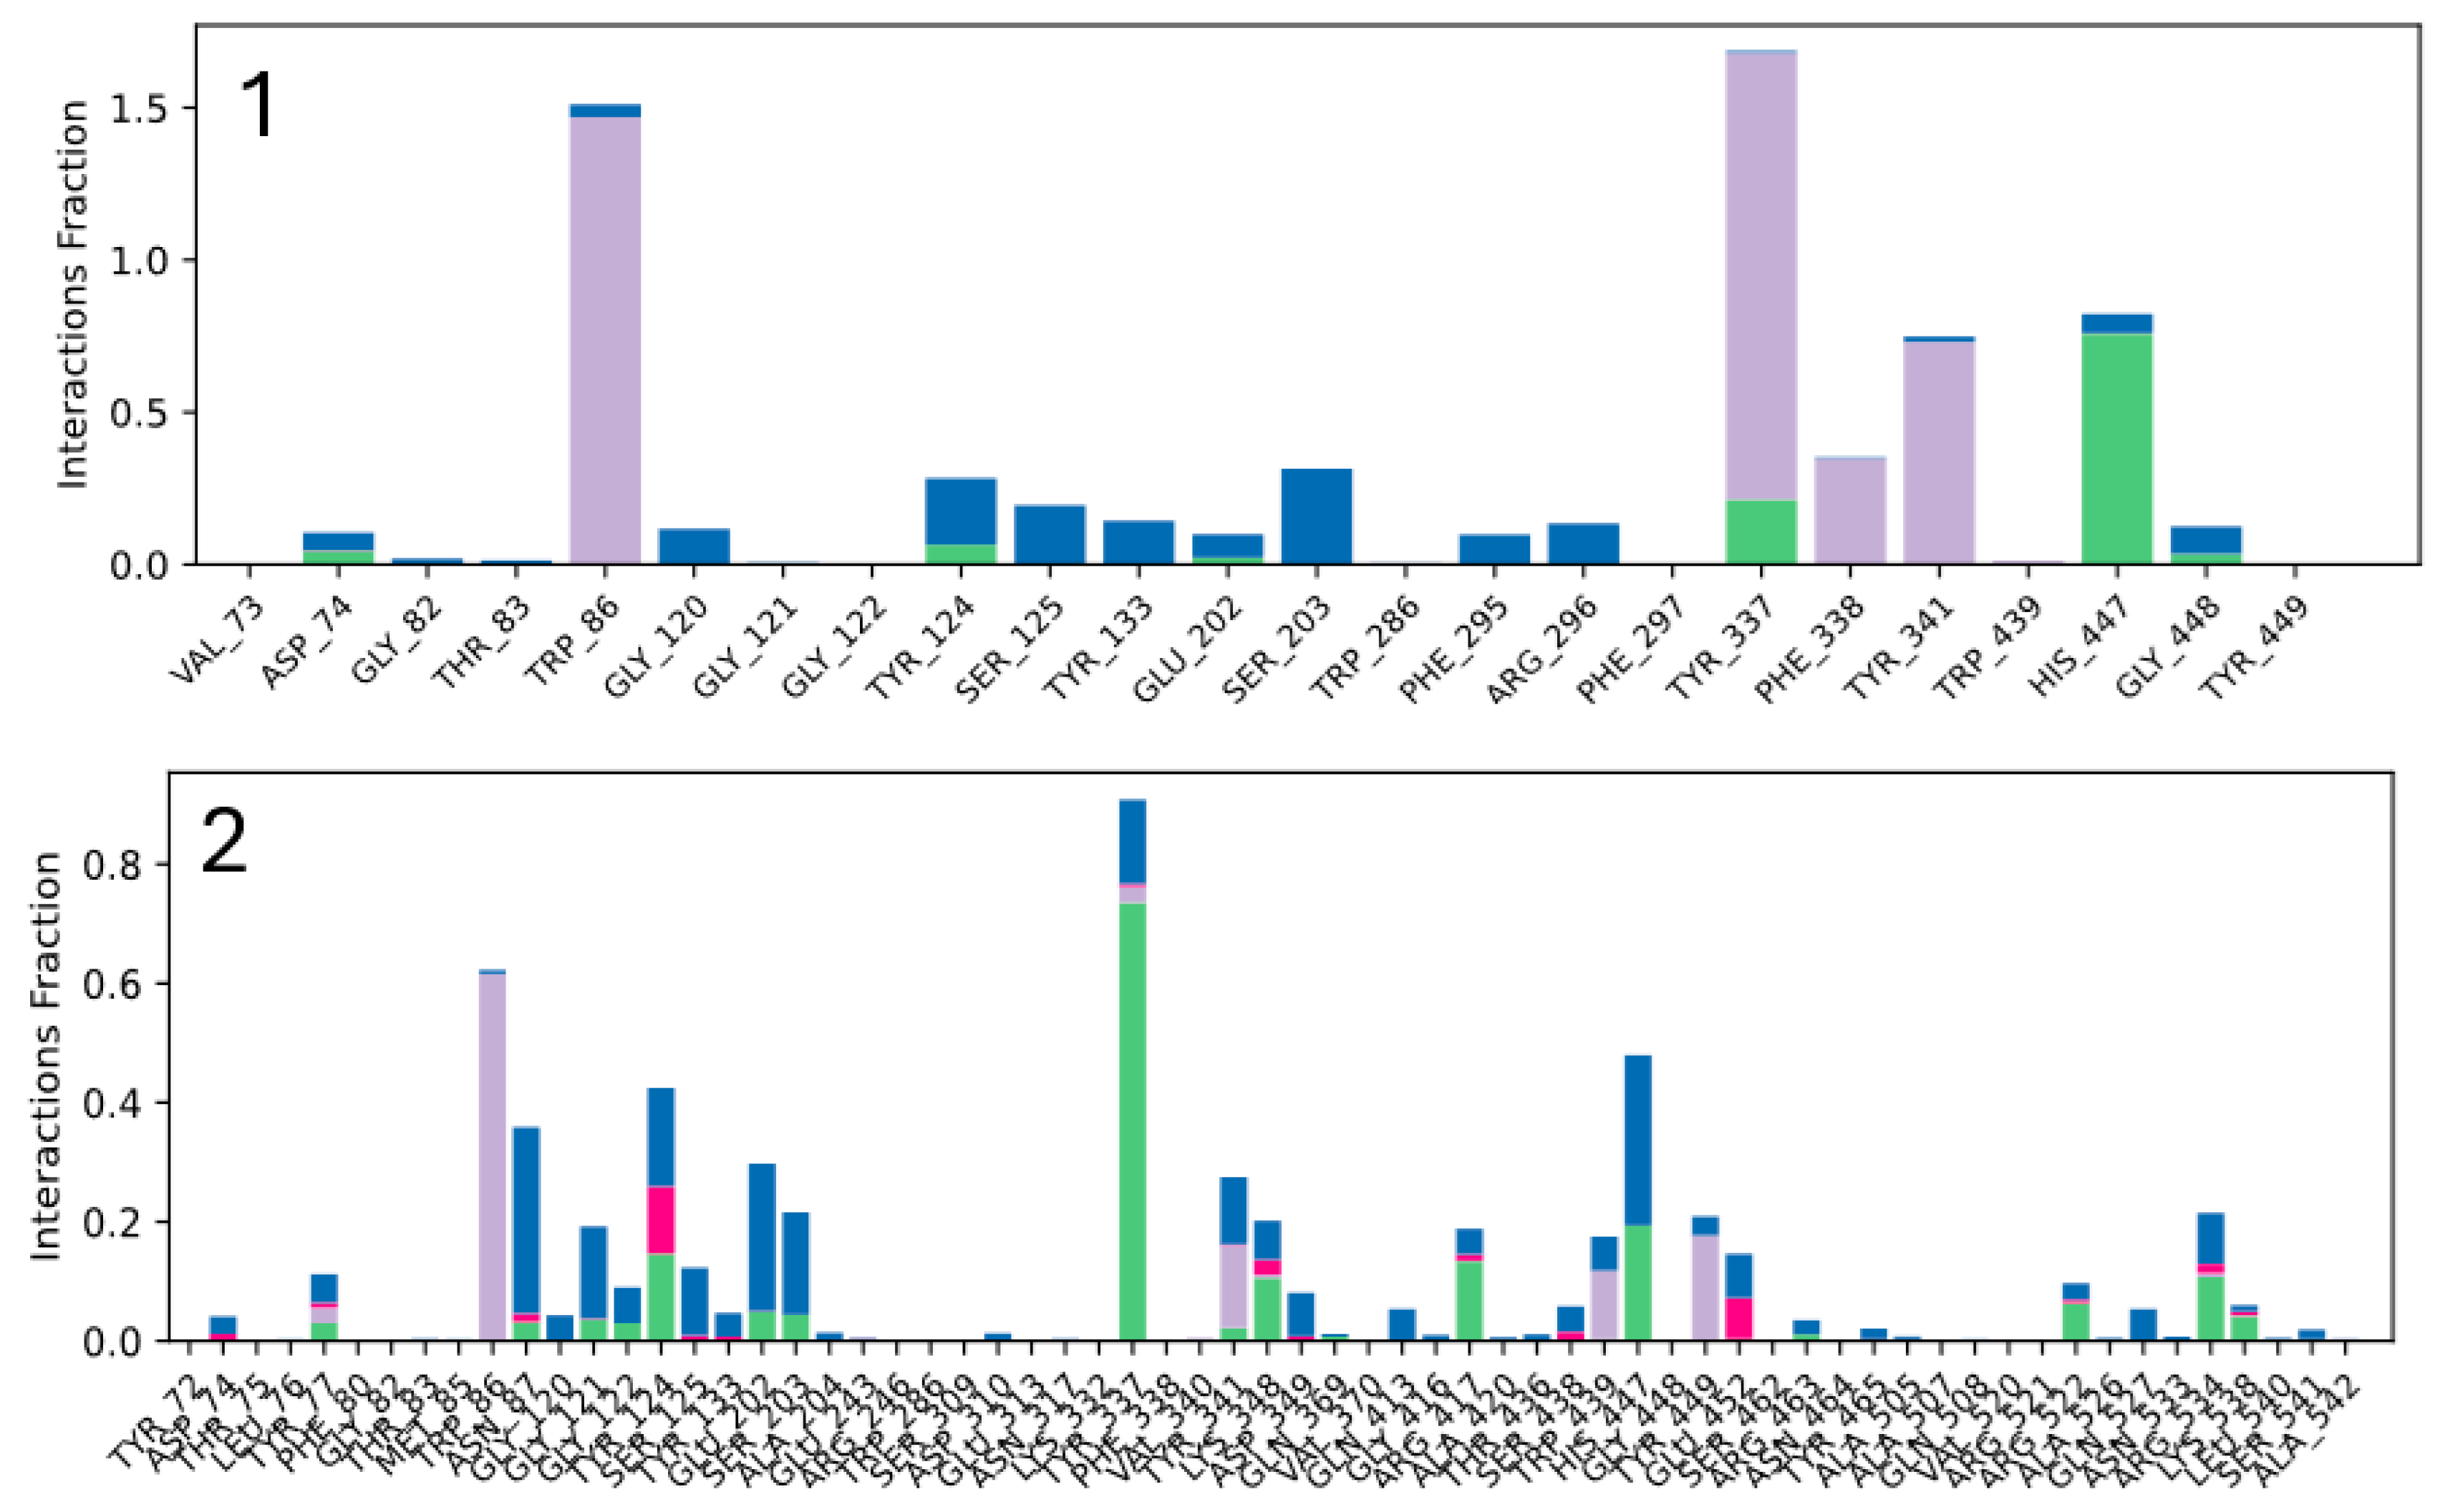
2.3.3. Molecular Dynamics (MDs) Simulations Analysis
2.3.4. MM-GBSA Calculations
2.3.5. Molecular Modeling Conclusions
3. Materials and Methods
3.1. Experimental Studies
3.1.1. Materials
3.1.2. Working Solutions
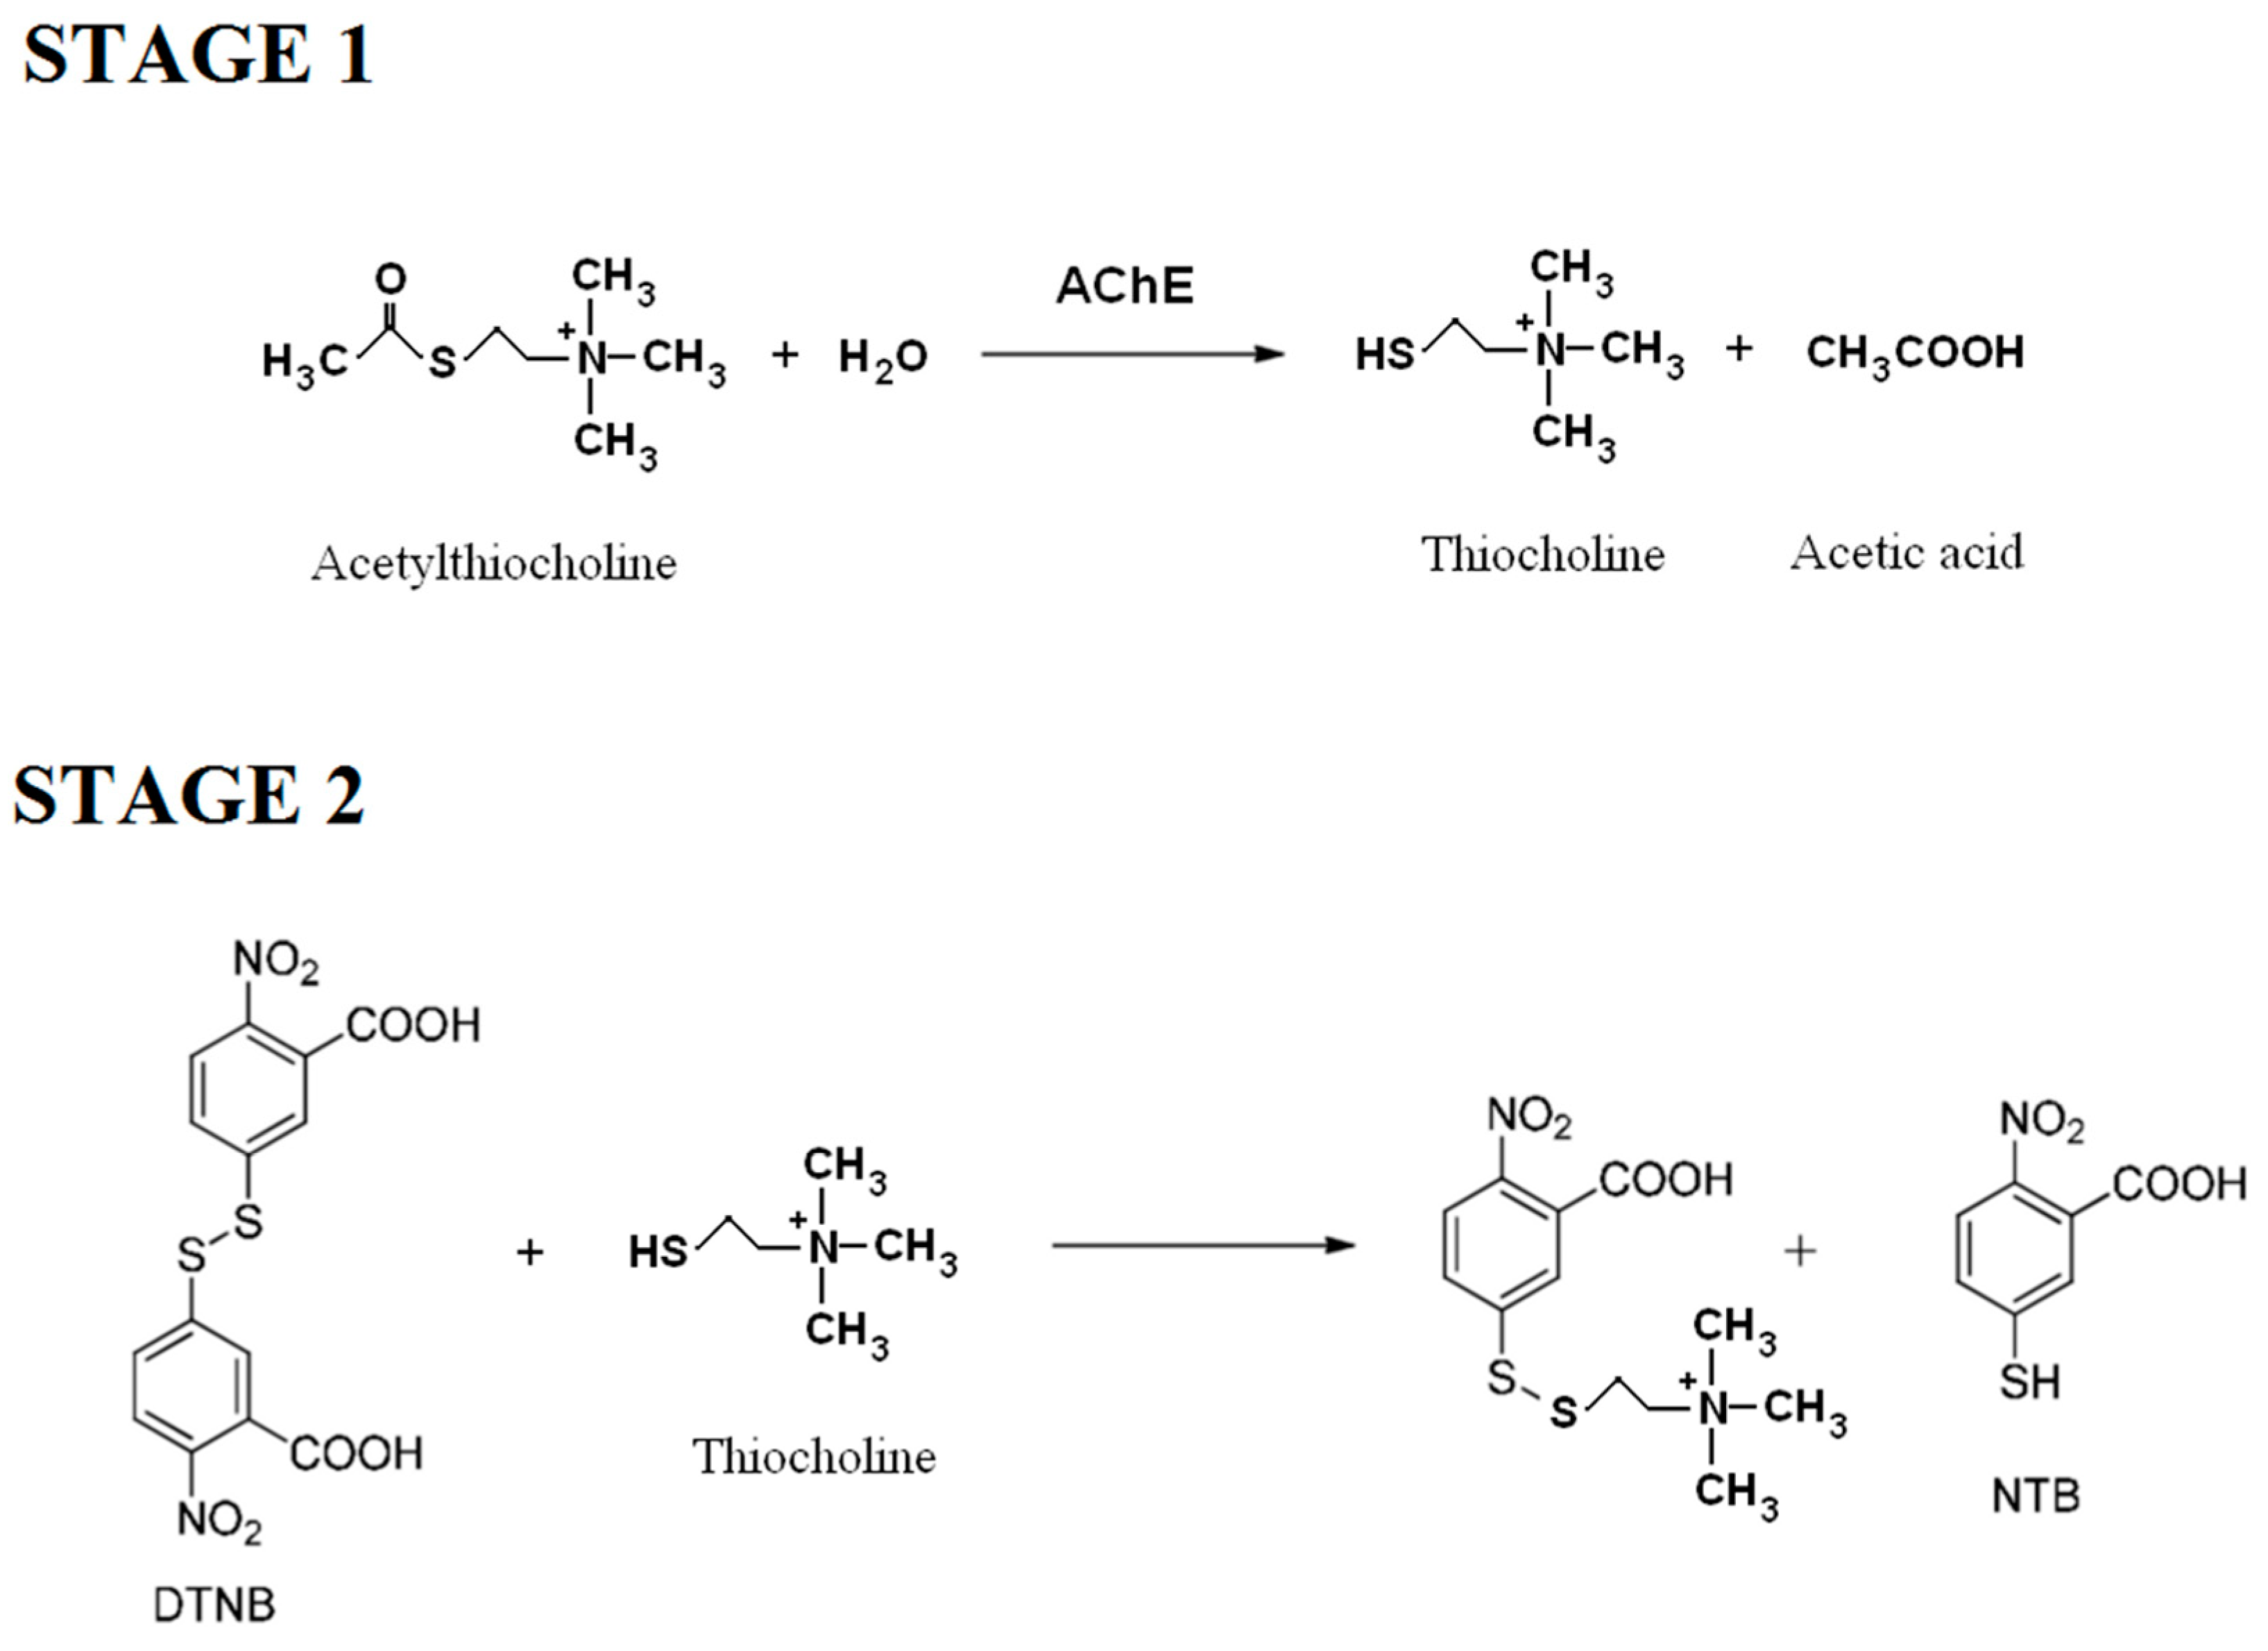
3.1.3. Method
3.2. Molecular Modelling
3.2.1. Software Used
3.2.2. Ligands Preparation
3.2.3. Protein Preparation
3.2.4. Docking Calculations
3.2.5. Molecular Dynamics (MDs) Simulations
3.2.6. MM-GBSA Calculations
4. Conclusions
Author Contributions
Funding
Institutional Review Board Statement
Informed Consent Statement
Data Availability Statement
Conflicts of Interest
References
- Moszczyński, P.; Pyć, R. Biochemia Witamin. Część I. Witaminy Grupy B I Koenzymy; Wydawnictwo Naukowe PWN: Warsaw, Poland, 1998. [Google Scholar]
- Alexi, T.; Borlongan, C.V.; Faull, R.L.; Williams, C.E.; Clark, R.G.; Gluckman, P.D.; Hughes, P.E. Neuroprotective strategies for basal ganglia degeneration: Parkinson’s and Huntington’s diseases. Prog. Neurobiol. 2000, 60, 409–470. [Google Scholar] [CrossRef]
- Fattal-Valevski, A. Thiamine (vitamin B1). J. Evid. Based Complement. Altern. Med. 2011, 16, 12–20. [Google Scholar] [CrossRef]
- Gangolf, M.; Czerniecki, J.; Radermecker, M.; Detry, O.; Nisolle, M.; Jouan, C.; Martin, D.; Chantraine, F.; Lakaye, B.; Wins, P.; et al. Thiamine status in humans and content of phosphorylated thiamine derivatives in biopsies and cultured cells. PLoS ONE 2010, 5, e13616. [Google Scholar] [CrossRef]
- Małecka, S.A.; Poprawski, K.; Bilski, B. Profilaktyczne i terapeutyczne zastosowanie tiaminy (witaminy B1)—Nowe spojrzenie na stary lek. Wiad. Lek. 2006, 59, 383–387. [Google Scholar]
- Tylicki, A.; Siemieniuk, M. Tiamina i jej pochodne w regulacji metabolizmu komórek. Postępy Hig. Med. Dośw. 2011, 65, 447–469. [Google Scholar] [CrossRef] [PubMed]
- Napiórkowska, E. Thiamine: Overview of History of Discovery, Mechanism of Action, Role and Deficiency. Prosp. Pharm. Sc. 2023, 21, 15–21. [Google Scholar] [CrossRef]
- Bâ, A. Metabolic and structural role of thiamine in nervous tissues. Cell Mol. Neurobiol. 2008, 28, 923–931. [Google Scholar] [CrossRef] [PubMed]
- Manzetti, S.; Zhang, J.; van der Spoel, D. Thiamin function, metabolism, uptake, and transport. Biochemistry 2014, 53, 821–835. [Google Scholar] [CrossRef]
- Ziemlański, Ś. Normy Żywienia Człowieka. Fizjologiczne Podstawy; PZWL: Warszawa, Poland, 2001. [Google Scholar]
- Heneka, M.T.; Rodriguez, J.J.; Verkhratsky, A. Neuroglia in neurodegeneration. Brain Res. Rev. 2010, 63, 189–211. [Google Scholar] [CrossRef]
- Leszek, J. Choroby Otępienne. Teoria i Praktyka; Continuo: Wrocław, Poland, 2003. [Google Scholar]
- Ball, M.J.; Fisman, M.; Hachinski, V. A new definition of Alzheimer’s disease: A hippocampal dementia. Lancet 1985, 8419, 14–16. [Google Scholar] [CrossRef] [PubMed]
- Ball, S. Chemia Szarych Komórek. Neurochemia i Toksykologia Ośrodkowego Układu Nerwowego; Medyk: Warszawa, Poland, 2003. [Google Scholar]
- Magierski, R.; Kłoszewska, I.; Sobów, T. Farmakoterapia otępienia w chorobie Alzheimera i otępienia mieszanego w chorobie Alzheimera. Aktual. Neurol. 2004, 3, 171–179. [Google Scholar]
- Kostowski, W.; Herman, Z.S. Farmakologia. Podstawy Farmakoterapii; Wydawnictwo Lekarskie PZWL: Warszawa, Poland, 2005; Volume 2, pp. 161–167. [Google Scholar]
- Hassan, M.; Rahman, H.; Yasmeen, B.H.; Mukti, A.; Haque, H.; Khan, M. Thiamine deficiency—Beriberi—A forgotten disease. North. Int. Med. Coll. 2018, 10, 351–354. [Google Scholar] [CrossRef]
- Mikkelsen, K.; Apostolopoulos, V. Vitamin B1, B2, B3, B5, and B6 and the immune system. In Nutrition and Immunity; Mahmoudi, M., Rezaei, N., Eds.; Springer: Cham, Switzerland, 2019. [Google Scholar]
- Yu, Q.; Liu, H.; Sang, S.; Chen, L.; Zhao, Y.; Wang, Y. Thiamine deficiency contributes to synapse and neural circuit defects. Biol. Res. 2018, 51, 35. [Google Scholar] [CrossRef] [PubMed]
- Costantini, A.; Pala, M.I.; Grossi, E.; Mondonico, S.; Cardelli, L.E.; Jenner, C. Long-term treatment with high-dose thiamine in Parkinson’s disease: An open-label pilot study. J. Altern. Complement. Med. 2015, 21, 740–747. [Google Scholar] [CrossRef]
- Carney, M.W.; Williams, D.G.; Sheffield, B.F. Thiamine and pyridoxine lack in newly admitted psychiatric patients. Br. J. Psychiatry 1979, 135, 249–254. [Google Scholar] [CrossRef]
- Zhang, G.; Ding, H.; Chen, H.; Ye, X.; Li, H.; Lin, X. Thiamine nutritional status and depressive symptoms are inversely associated among older Chinese adults. J. Nutr. 2013, 143, 53–58. [Google Scholar] [CrossRef] [PubMed]
- Ghaleiha, A.; Davari, H.; Jahangard, L.; Haghighi, M.; Ahmadpanah, M.; Seifrabie, M.A. Adjuvant thiamine improved standard treatment in patients with major depressive disorder: Results from a randomized, double-blind, and placebo-controlled clinical trial. Eur. Arch. Psychiatry Clin. Neurosci. 2016, 266, 695–702. [Google Scholar] [CrossRef]
- Lu’o’ng, K.V.Q.; Nguyen, L.T.H. Role of thiamine in Alzheimer’s disease. Am. J. Alzheimers Dis. Other Demen. 2011, 26, 588–598. [Google Scholar] [CrossRef]
- Gibson, G.E.; Feldman, H.H.; Zhang, S.; Flowers, S.A.; Luchsinger, J.A. Pharmacological thiamine levels as a therapeutic approach in Alzheimer’s disease. Front. Med. 2022, 9, 1033272. [Google Scholar] [CrossRef]
- Sang, S.; Pan, X.; Chen, Z. Thiamine diphosphate reduction strongly correlates with brain glucose hypometabolism in Alzheimer’s disease, whereas amyloid deposition does not. Alz. Res. Ther. 2018, 10, 26. [Google Scholar] [CrossRef]
- Alspach, J.D.; Ingraham, L.L. Inhibition of acetylcholinesterase by thiamine: A structure-function study. J. Med. Chem. 1977, 20, 161–164. [Google Scholar] [CrossRef]
- Ngo, T.T.; Tunnicliff, G.; Yam, C.F.; Charbonneau, M.; Barbeau, A. The inhibition of human plasma acetylcholinesterase by some naturally occurring compounds. Gen. Pharmacol. Vasc. Syst. 1978, 9, 21–24. [Google Scholar] [CrossRef]
- Yoon, S.K.; Bae, K.S.; Hong, D.H.; Kim, S.S.; Choi, Y.K.; Lim, H.S. Pharmacokinetic evaluation by modeling and simulation analysis of a donepezil patch formulation in healthy male volunteers. Drug Des. Devel. Ther. 2020, 14, 1729–1737. [Google Scholar] [CrossRef] [PubMed]
- Al-Jafari, A.A.; Kamal, M.A.; Greig, N.H.; Alhomida, A.S.; Perry, E.R. Kinetics of human erythrocyte acetylcholinesterase inhibition by a novel derivative of physostigmine: Phenserine. Biochem. Biophys. Res. Commun. 1998, 248, 180–185. [Google Scholar] [CrossRef]
- Kobzar, O.; Ocheretniuk, A.; Buldenko, V.; Babiy, L.; Brovarets, V.; Vovk, A. O-Substituted N(3)-benzyl analogs of vitamin B1 as inhibitors of acetylcholinesterase or butyrylcholinesterase. Curr. Chem. Lett. 2020, 9, 51–62. [Google Scholar] [CrossRef]
- Scott, L.J.; Goa, K.L. Galantamine. Drugs 2000, 60, 1095–1122. [Google Scholar] [CrossRef]
- Marquis, J.K. Pharmacological significance of acetylcholinesterase inhibition by tetrahydroaminoacridine. Biochem. Pharmacol. 1990, 40, 1071–1076. [Google Scholar] [CrossRef] [PubMed]
- Ellman, G.L.; DianeCourtney, K.; Andres, V., Jr.; Featherstone, R.M. A new and rapid colorimetric determination of acetylcholinesterase activity. Biochem. Pharmacol. 1961, 7, 88–90. [Google Scholar] [CrossRef]
- Grodner, B.; Napiórkowska, M.; Pisklak, D.M. In vitro and in silico kinetic studies of patented 1,7-diethyl and 1,7-dimethyl aminoalkanol derivatives as new inhibitors of acetylcholinesterase. Int. J. Mol. Sci. 2021, 23, 270. [Google Scholar] [CrossRef]
- Kim, S.; Thiessen, P.A.; Bolton, E.E.; Chen, J.; Fu, G.; Gindulyte, A. PubChem substance and compound databases. Nucleic Acids Res. 2016, 44, D1202–D1213. [Google Scholar] [CrossRef] [PubMed]


| Thiamine (T) | |||
|---|---|---|---|
| Concentration (mg/mL) | Straight Line Equation | R2 | Tilt Angle (°) |
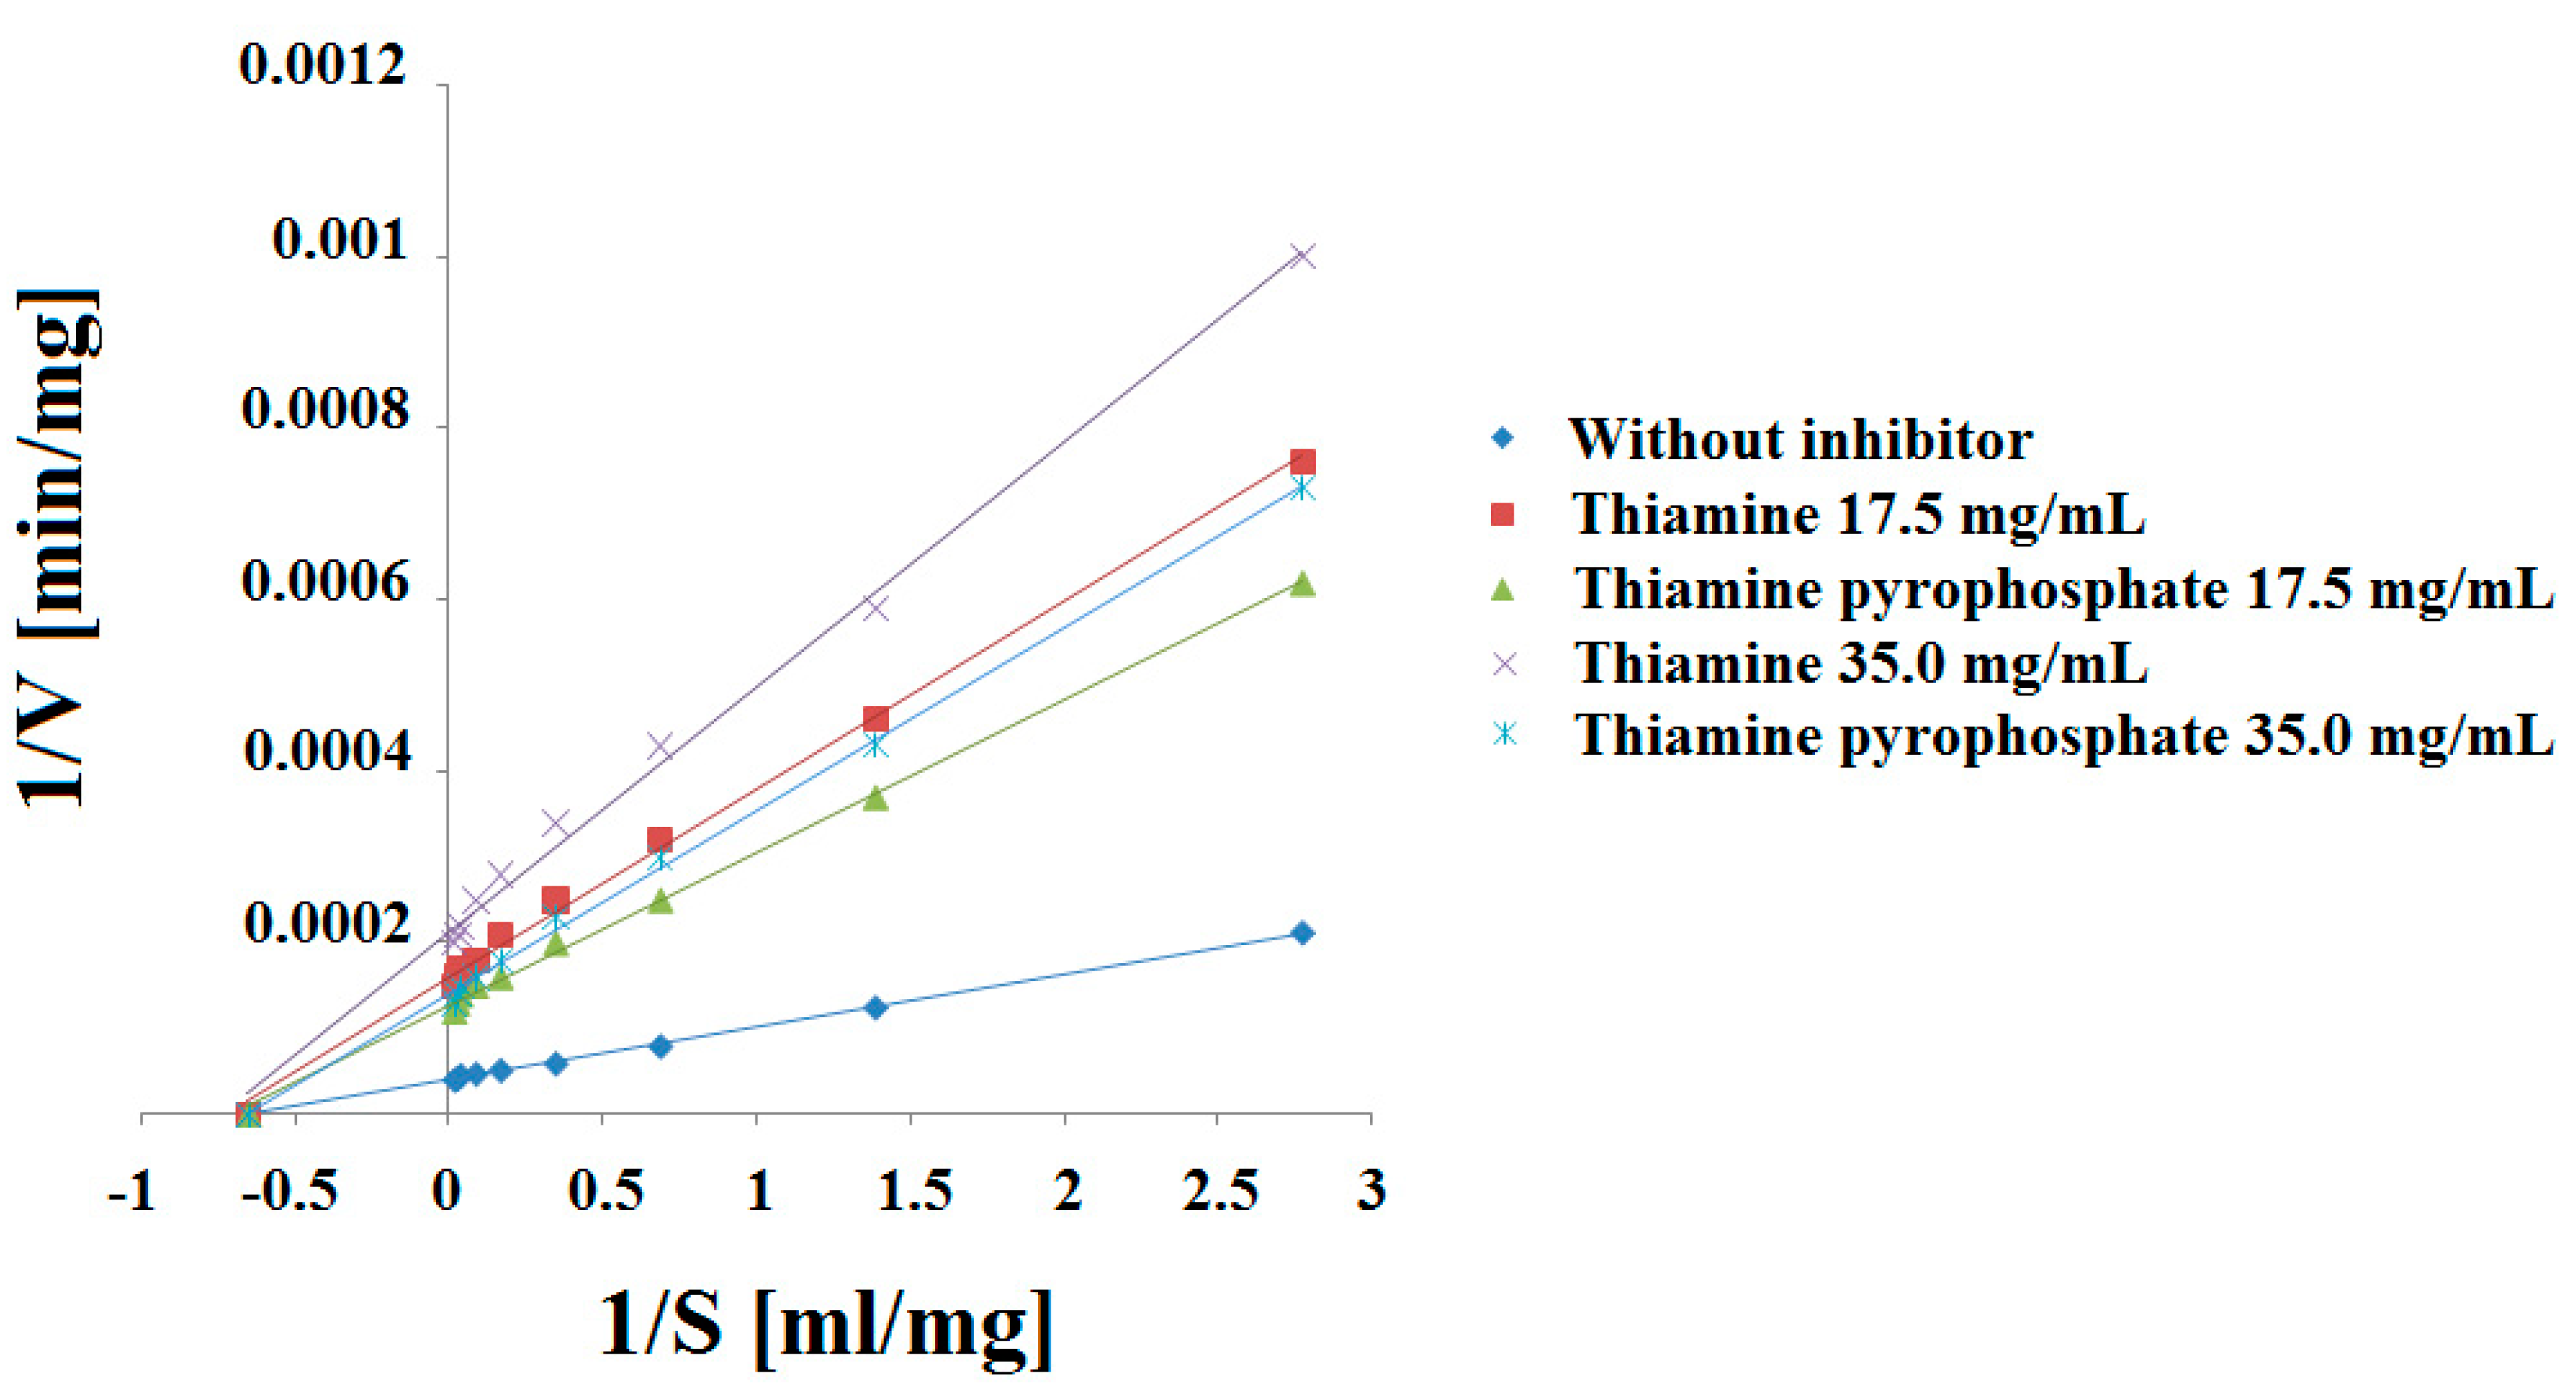
| (T) 0.00 | y = 0.00006x + 0.00004 | 0.9991 ± 0.0015 | 3.44 × 10⁻³ ± 3.10 × 10⁻⁵ |
| (T) 17.5 | y = 0.00020x + 0.00029 | 0.9985 ± 0.0037 | 11.46 × 10⁻³ ± 4.72 × 10⁻⁵ |
| (T) 35.0 | y = 0.00028x + 0.00042 | 0.9986 ± 0.0032 | 16.04 × 10⁻³ ± 3.86 × 10⁻⁵ |
| Concentration (mg/mL) | Km (mg/mL) | Vmax (mg/min) | Ki (mg) |
| (T) 0.00 | 1.49 ± 0.03 | 25,000 ± 78.6 | --- |
| (T) 17.5 | 1.45 ± 0.08 | 3448 ± 45.7 | 0.2384 ± 0.006 |
| (T) 35.0 | 1.49 ± 0.07 | 2381 ± 36.4 | 0.1568 ± 0.004 |
| Thiamine pyrophosphate (TPP) | |||
| Concentration (mg/mL) | Straight Line Equation | R2 | Tilt Angle (°) |
| (TPP) 0.00 | y = 0.00006x + 0.00004 | 0.9991 ± 0.0015 | 3.44 × 10⁻³ ± 3.10 × 10⁻⁵ |
| (TPP) 17.5 | y = 0.00016x + 0.00023 | 0.9988 ± 0.0038 | 9.17 × 10⁻³ ± 4.83 × 10⁻⁵ |
| (TPP) 35.0 | y = 0.00019x + 0.00028 | 0.9985 ± 0.0034 | 10.90 × 10⁻³ ± 4.78 × 10⁻⁵ |
| Concentration (mg/mL) | Km (mg/mL) | Vmax (mg/min) | Ki (mg) |
| (TPP) 0.00 | 1.49 ± 0.03 | 25,000 ± 78.6 | --- |
| (TPP) 17.5 | 1.44 ± 0.05 | 4348 ± 42.1 | 0.3137 ± 0.008 |
| (TPP) 35.0 | 1.47 ± 0.08 | 3571 ± 37.3 | 0.2483 ± 0.007 |
| Protein PDB Code | Co-Crystalized Inhibitor | Docked Ligand | Model | GLIDE XP Score |
|---|---|---|---|---|
| 4EY6 | Competitive Galantamine | Thiamine T | 1 | −2.465 |
| Thiamine pyrophosphate TPP | 2 | 0.823 | ||
| 7XN1 | Non-competitive Tacrine | Thiamine T | 3 | −10.735 |
| Thiamine pyrophosphate TPP | 4 | −11.054 |
| Protein PDB Code | Co-Crystalized Inhibitor | Docked Ligand | MM-GBSA [kcal/mol] |
|---|---|---|---|
| 4EY6 | Competitive galantamine | Thiamine T | −42.57 |
| Thiamine pyrophosphate TPP | −9.57 | ||
| 7XN1 | Non-competitive tacrine | Thiamine T | −63.00 |
| Thiamine pyrophosphate TPP | −45.44 |
Disclaimer/Publisher’s Note: The statements, opinions and data contained in all publications are solely those of the individual author(s) and contributor(s) and not of MDPI and/or the editor(s). MDPI and/or the editor(s) disclaim responsibility for any injury to people or property resulting from any ideas, methods, instructions or products referred to in the content. |
© 2025 by the authors. Licensee MDPI, Basel, Switzerland. This article is an open access article distributed under the terms and conditions of the Creative Commons Attribution (CC BY) license (https://creativecommons.org/licenses/by/4.0/).
Share and Cite
Szeleszczuk, Ł.; Pisklak, D.M.; Grodner, B. Thiamine and Thiamine Pyrophosphate as Non-Competitive Inhibitors of Acetylcholinesterase—Experimental and Theoretical Investigations. Molecules 2025, 30, 412. https://doi.org/10.3390/molecules30020412
Szeleszczuk Ł, Pisklak DM, Grodner B. Thiamine and Thiamine Pyrophosphate as Non-Competitive Inhibitors of Acetylcholinesterase—Experimental and Theoretical Investigations. Molecules. 2025; 30(2):412. https://doi.org/10.3390/molecules30020412
Chicago/Turabian StyleSzeleszczuk, Łukasz, Dariusz Maciej Pisklak, and Błażej Grodner. 2025. "Thiamine and Thiamine Pyrophosphate as Non-Competitive Inhibitors of Acetylcholinesterase—Experimental and Theoretical Investigations" Molecules 30, no. 2: 412. https://doi.org/10.3390/molecules30020412
APA StyleSzeleszczuk, Ł., Pisklak, D. M., & Grodner, B. (2025). Thiamine and Thiamine Pyrophosphate as Non-Competitive Inhibitors of Acetylcholinesterase—Experimental and Theoretical Investigations. Molecules, 30(2), 412. https://doi.org/10.3390/molecules30020412