Abstract
In Cameroon, like in other African countries, infusions of Artemisia afra and Artemisia annua are widely used for the management of health-related problems, including malaria. The secondary metabolite contents of medicinal plants vary between different geographical regions and seasons, directly influencing their effectiveness in treating ailments. This study explores the phytochemical diversity and anti-plasmodial potential of A. annua and A. afra from distinct geographical locations within Cameroon, aiming to define the optimal chemical composition in terms of anti-plasmodial activity. Extracts were prepared from plants collected from diverse regions in Cameroon during both the rainy and dry seasons, and their metabolic contents were analyzed using Thin-Layer Chromatography (TLC), High Performance Liquid Chromatography (HPLC), and Gas Chromatography (GC). Their anti-plasmodial potential was assessed on a chloroquine-sensitive 3D7 Plasmodium falciparum strain. Additionally, the environmental parameters of the collecting sites were retrieved from multispectral satellite imagery. The activity profiles of the samples were associated with their environment, with distinct phytochemical compositions observed for each sample based on its geographical origin and season. Traces of artemisinin were detected in some of the A. afra samples, but it was present in the A. annua samples at a significantly higher concentration, especially in the rainy season samples (highest concentration in the Adamawa region, at 8.9% m/m artemisinin in the dry extract). Both plants are active at different levels, with A. annua more active due to the presence of artemisinin and A. afra probably active due to the presence of polyphenols. Both season and geographical location influence both plants’ metabolic contents and hence their antimalaria activity. These findings suggest that the selection of a suitable Artemisia sample for use as a potential antimalarial treatment should take into consideration its geographical origin and the period of collection.
1. Introduction
Malaria is a disease of public health importance caused by parasites of the Plasmodium family and transmitted by female Anopheles mosquitoes. In most countries where malaria is endemic, this disease disproportionately affects children under the age of five and pregnant women. Globally, over 250 million malaria cases and 608,000 deaths were reported in 2022 in 85 malaria-endemic countries, with an estimated additional 13.4 million increased cases between 2019 and 2021 [1]. Sub-Saharan African countries are the hardest-hit zones, with approximately 95% of the world’s malaria burden and 96% of the death rate, with over 80% of these being children under the age of five and pregnant women [1]. According to WHO data, 70% of all malaria cases are concentrated in 11 countries, with Cameroon accounting for over 2.7 million cases [1]. This can be related to increasing antimalarial drug resistance to all of the chemotherapeutic measures recommended at present, including “Artemisinin-based Combination Therapy” (ACT) [1]. The situation is further aggravated not only by Histidine-Rich Protein-2 gene (HRP2 gene) deletion [2], which makes a diagnosis problematic, but also by the widespread resistance of mosquito to insecticides, as well as the rapid spread of invasive vector species (Anopheles stephensi) from the Horn of Africa. The fight against this life-threatening disease is one of the goals of the World Health Organization’s (WHO) Global Technical Strategy for malaria to reduce transmission and achieve a world free of malaria by 2030. Natural products have been investigated as potential medications for diseases including malaria [3] and are used by 80% of the global population in primary health care [4]. Artemisia afra Jacq. ex Willd and Artemisia annua L are annual herbs belonging to the Asteraceae family that have a long history of use against fevers related to malaria [5,6]. Due to their complex mixtures of different phytochemicals, both plant species have proven to be effective in the clinical management of diseases as traditional remedies. Several studies have been reported indicating the effectiveness of both plants against malaria. For instance, in vitro studies, including clinical investigations, have shown that A. afra, despite being devoid of artemisinin or having a negligible artemisinin content [7], can exhibit good anti-plasmodial properties against erythrocytic forms (IC50 between 5 μg/mL and 15 μg/mL) [8], hepatic forms, and gametocidal stages of the malaria parasite [7,9,10,11,12,13]. The pharmacological properties of A. afra and A. annua were well documented in reviews by du Toit and Van de Kooy [11] and Soni et al. [13], respectively.
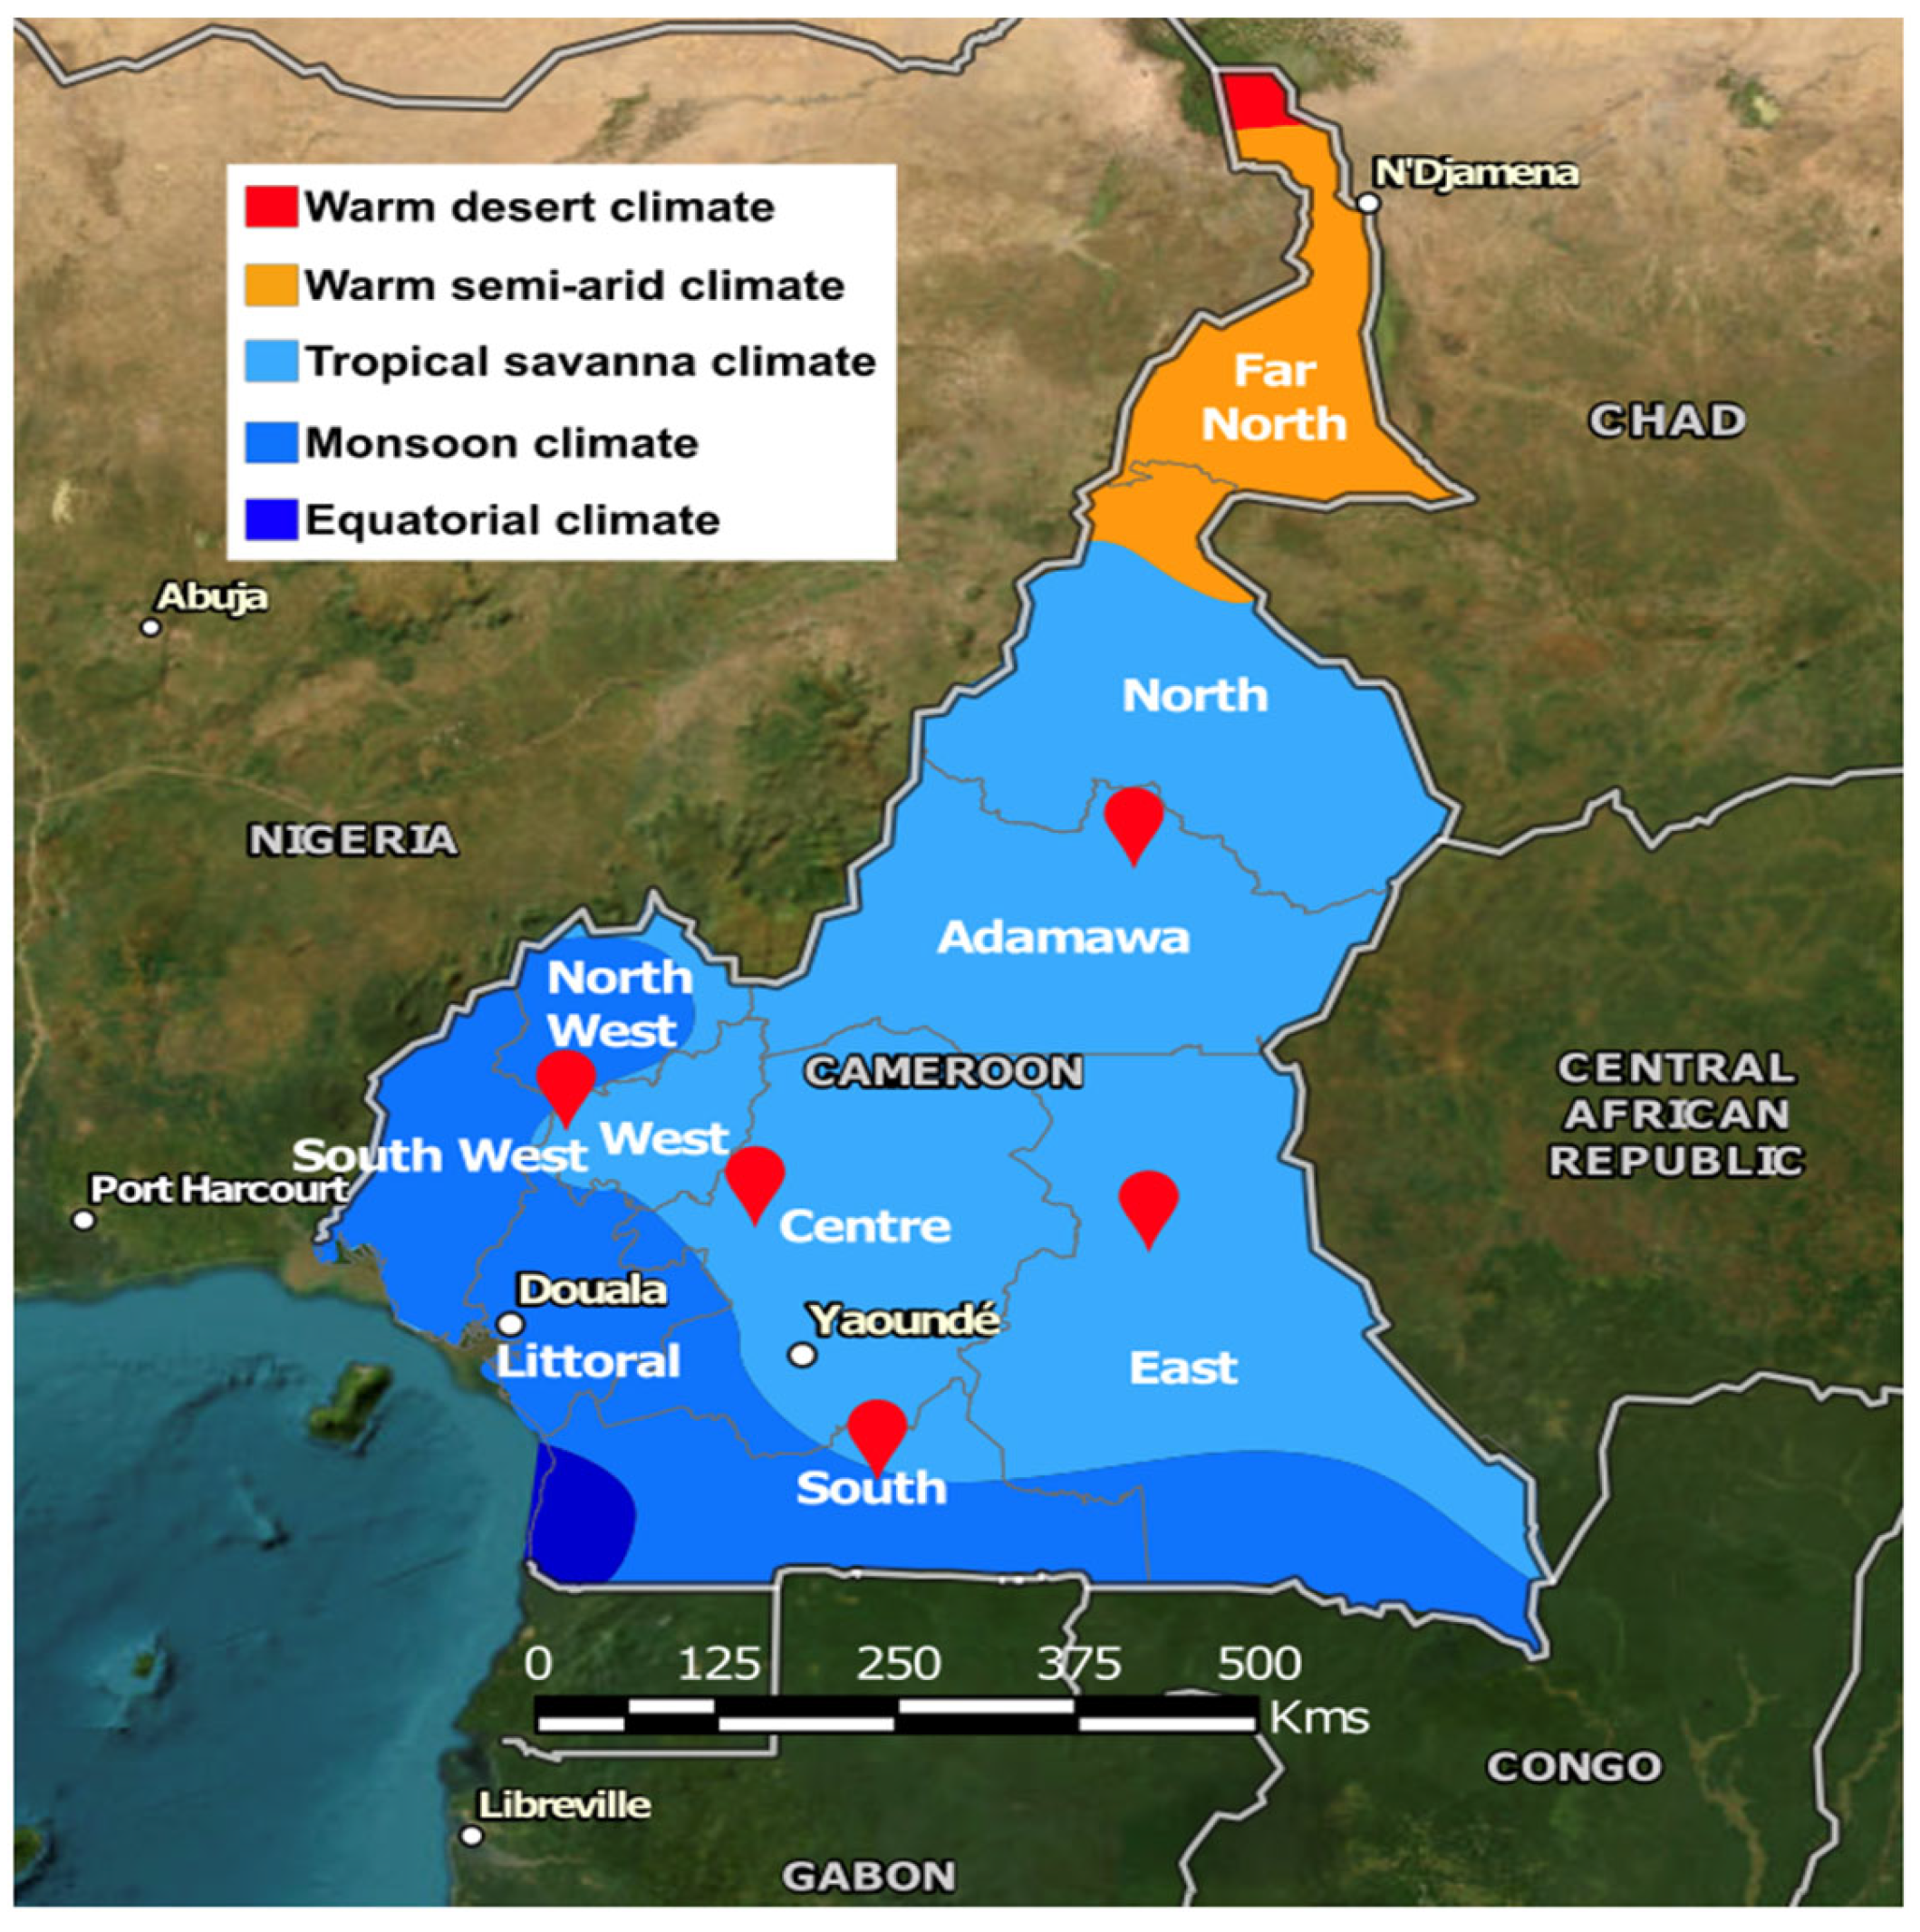
The isolation of artemisinin from A. annua [14], a potent antimalarial compound, has made the plant a subject of intensive phytochemical investigation in recent decades. Interestingly, phytochemical investigation has confirmed the isolation of almost 700 secondary metabolites from A. annua and almost 500 from A. afra [15]. The qualitative and quantitative contents of plant secondary metabolites are greatly influenced by temperature, humidity, soil type, soil micro-organisms, soil pH, and altitude [16]. This has a direct influence on a medicinal plant’s ability to effectively treat a well-diagnosed disease. In Cameroon, like in other African countries, A. annua and A. afra are cultivated in different geographical regions, formulated as herbal tea, and sold throughout several regions for the management of health-related problems, including malaria, but without pharmacological quality control. Additionally, given the close morphological similarity between the two Artemisia species, it is difficult to distinguish between the two medicinal plants physically (Supplementary Figure S1), and hence, discerning the authenticity of herbal tea is problematic. There is an absolute need to compare the metabolic contents and profiling of these plants obtained from different regions and during different cultivation periods and to develop a pharmaceutical monograph for plant authenticity and for quality control measures. This study explores the phytochemical diversity and anti-plasmodial potential of A. annua and A. afra sourced from distinct geographical locations in Cameroon. The chemical composition of these Artemisia species was investigated, aiming to discern potential variations in the phytochemical profiles attributable to geographic factors and correlated with observed activity, for plant authenticity, the optimal chemical composition, and quality control of these herbal products. To achieve this, both plant species were harvested in different seasons from different locations in Cameroon (Figure 1) and analyzed using TLC, HPLC, and GC. The environmental parameters of the collecting sites were retrieved from multispectral satellite imagery to monitor the health status of the vegetation where these plants were collected. Additionally, their anti-plasmodial activities were assessed, and a correlation was made between the observed activity and their metabolic fingerprints. The results of these findings show that the activity profiles of Artemisia plants are associated with their environment, with distinct phytochemical compositions observed for each plant sample based on its geographical origin and season of collection. Higher Normalized Different Vegetation Index (NDVI) values were observed during the rainy season regardless of the location of collection, indicating healthier and denser vegetation, which correlated with a higher artemisinin content (trend) and was associated with stronger antimalaria activity in A. annua.
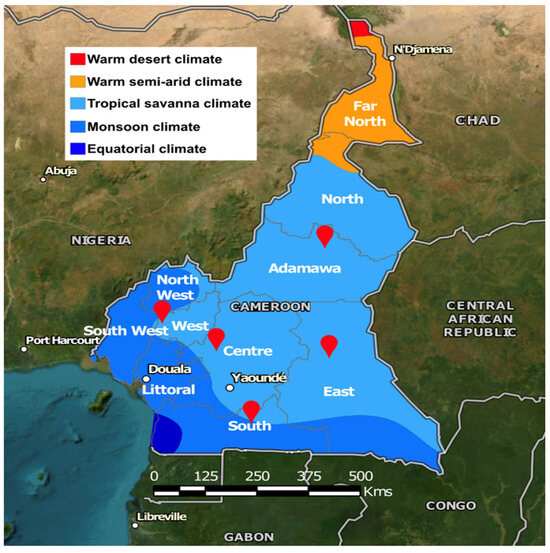
Figure 1.
Location of the five collection sites. The map displays the administrative regions of Cameroon, and the colors indicate the climate type [17].
2. Results
2.1. Comparison of TLC Fingerprints of Samples from Different Regions and Seasons
Thin-Layer Chromatography (TLC) fingerprints show inter-species and intra-species variation in the chemical patterns of metabolites. For example, we observed the presence of a pink-colored compound in all of the A. afra samples with a retention factor (RF) of 0.78, while this was absent in all of the A. annua extracts (Supplementary Figure S2a). The chemical patterns from TLC also indicate the absence of artemisinin in all of the A. afra extracts but its presence in the A. annua samples (RF = 0.51) (Supplementary Figure S2a). Additionally, the TLC fingerprints of the A. afra samples from different locations show intra-species variation in the chemical patterns, indicating the influence of harvest location on the chemical profile. For example, the A. afra extracts from the Center, South, and Adamawa regions show the same chemical pattern of terpenes, while the extracts from the West and East are characterized by a blue spot with different RF values and which is absent in the other samples (Supplementary Figure S2b).
The polyphenol fingerprints of both plants also show a distinct chemical pattern. For instance, luteolin and rutin are present in all A. afra samples but absent in the A. annua samples. Additionally, a region with black bands is detected in all A. annua samples though this is absent in A. afra. Samples of A. afra obtained from different regions show the same profile in terms of polyphenol composition (Supplementary Figure S2c). While seasonal variation was observed in the profile of terpene composition, there was no clear effect of season on polyphenol composition (Supplementary Figure S2d).
2.2. Influence of Season and Growing Location on the Natural Abundance of Major Polyphenols
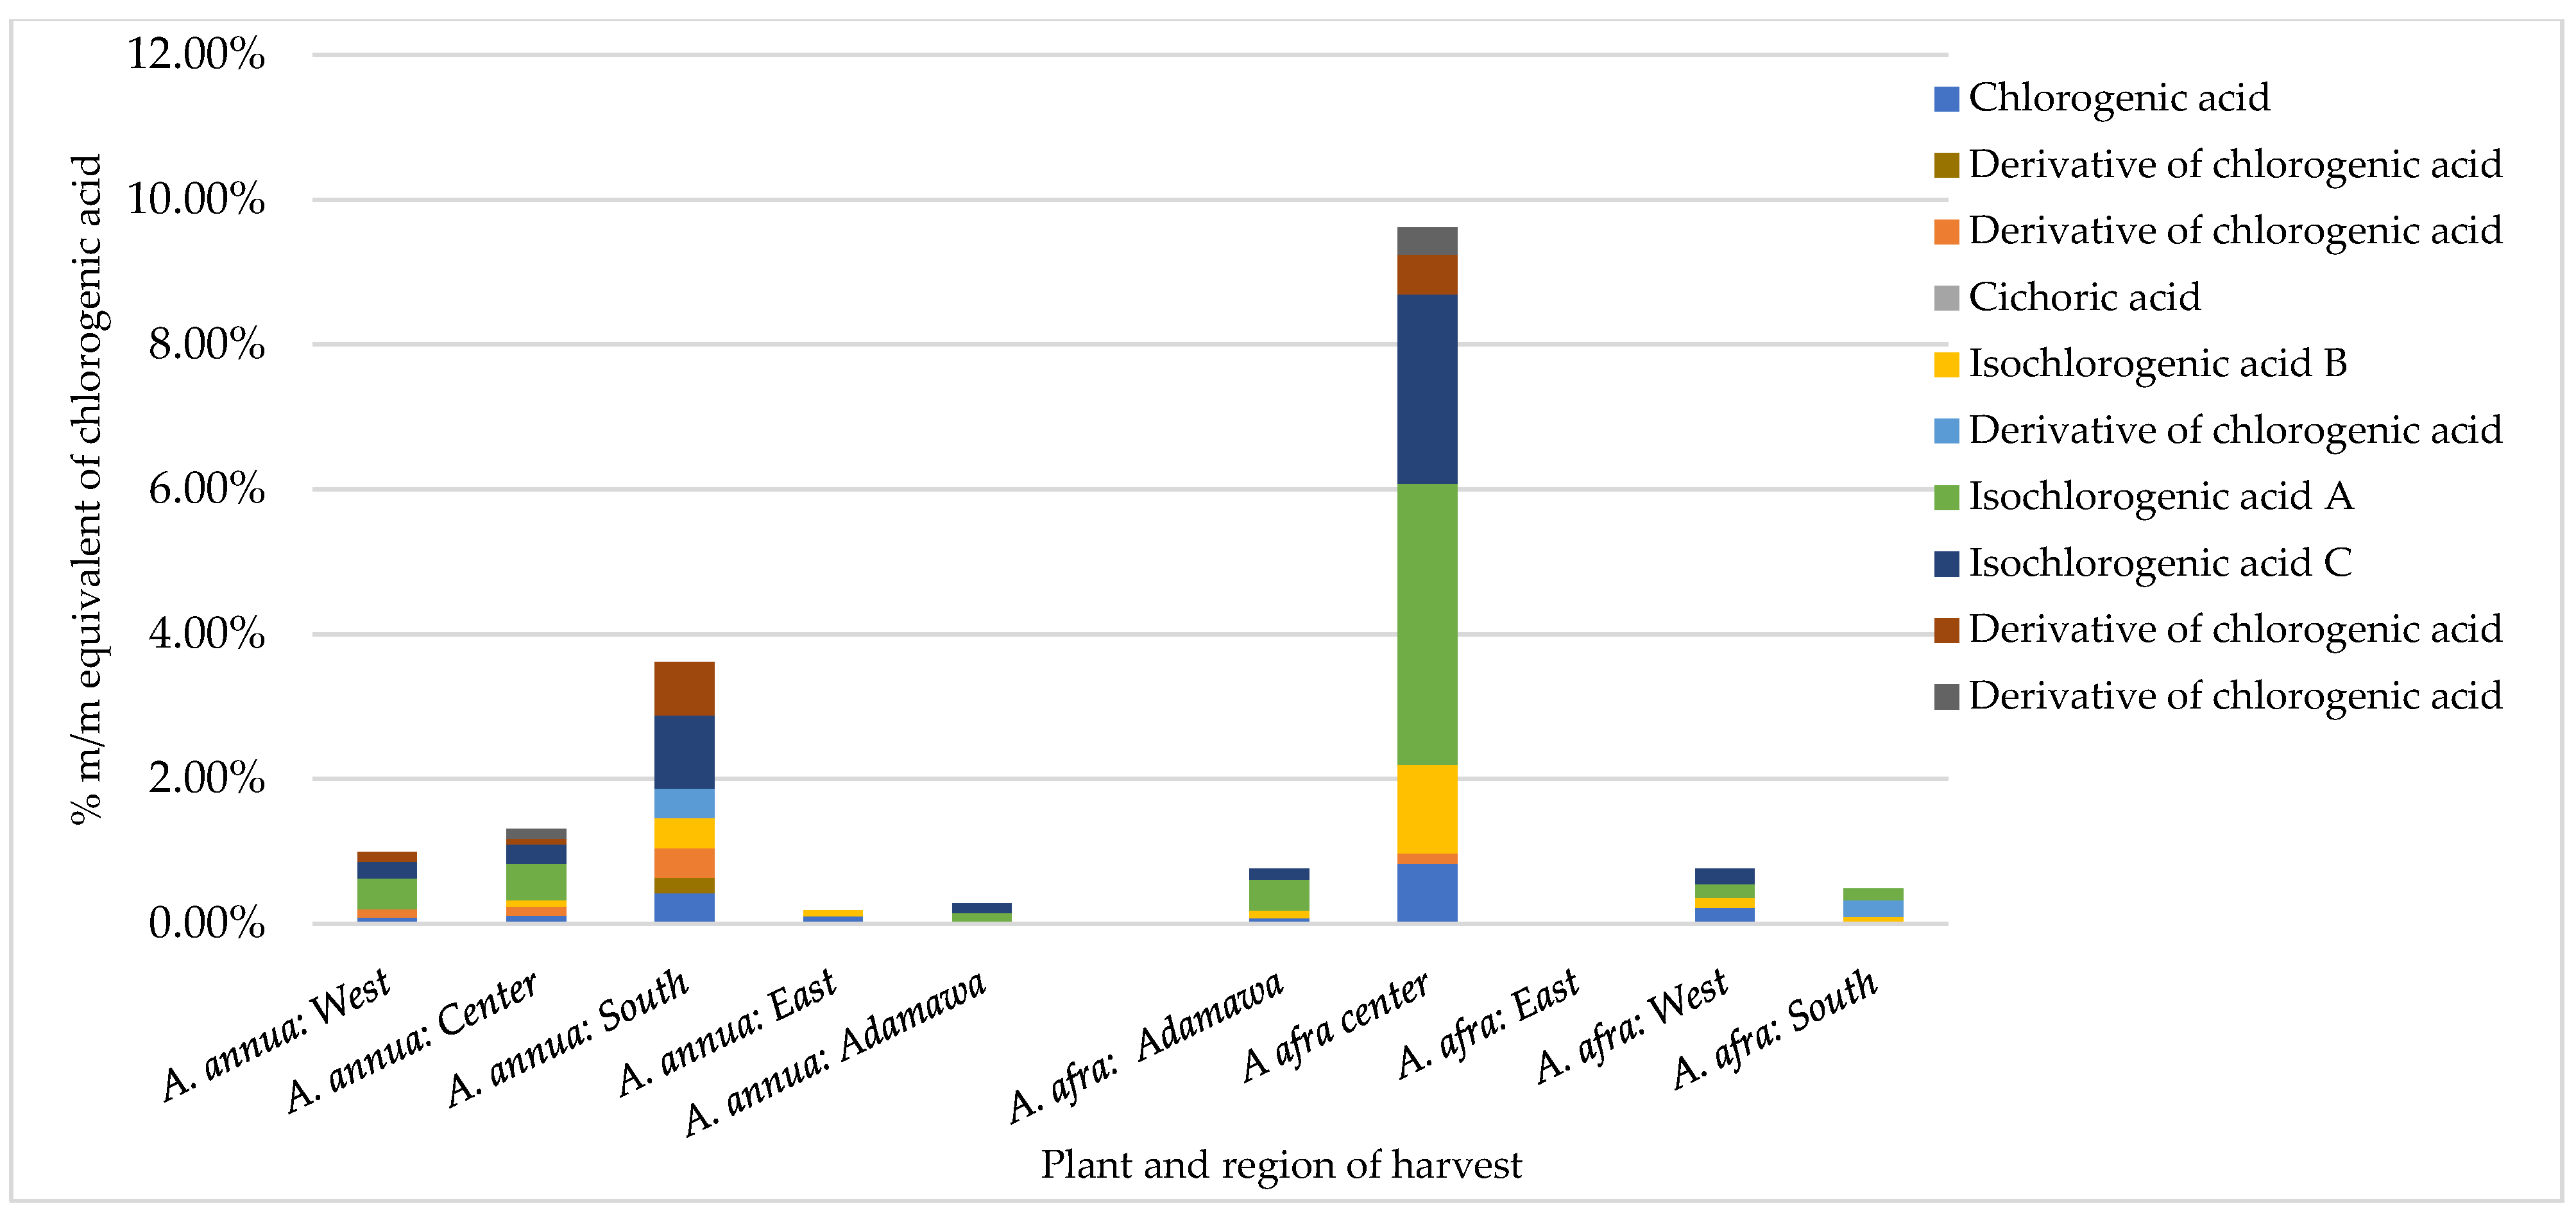
An HPLC analysis of polyphenols was performed on both series of samples harvested in the rainy and dry seasons. A reference calibration curve consisting of chlorogenic acid (0.1, 0.05, 0.025, and 0.0125 mg/mL in methanol) was made, and the polyphenol contents of 20 methanol crude extracts were estimated and expressed as % m/m equivalents of chlorogenic acid. Several polyphenols were identified in both samples through a comparison of the UV spectrum and retention time (Rt) of the analyte with those of standard reference compounds. These included rutin, chlorogenic acid, luteolin, astragalin, and iso-chlorogenic acid A, B, and C. In addition, coumarins (scopoline and scopoletin) were detected. The results obtained show inter- and intra-species variation in the concentration of chlorogenic acid (CA) and its derivatives (Figure 2). For the A. afra samples, the highest concentration of CA and its derivatives was found in the rainy season samples from the Center region (9.61% m/m chlorogenic acid equivalents), with iso-chlorogenic acid A being the major metabolite (3.89% m/m chlorogenic acid equivalents). In the sample from the East region, no detectable amount of CA nor its derivatives was retrieved. Within the A. annua samples, the concentration of CA and its derivatives ranged from 0.18 to 3.61% m/m CA equivalents in the samples from the East and South regions, respectively, indicating the effect of location on the CA contents. Additionally, while iso-chlorogenic acid A, B, and C were present in all samples, cichoric acid was only found in both species obtained from the Center region in the rainy season.
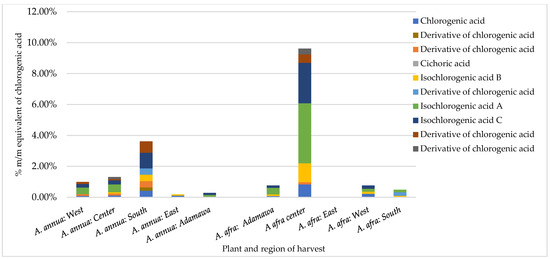
Figure 2.
Contents of chlorogenic acid and its derivatives in Artemisia samples obtained in the rainy season expressed as % m/m equivalents of chlorogenic acid vary between different regions for both plants and inter-plant.
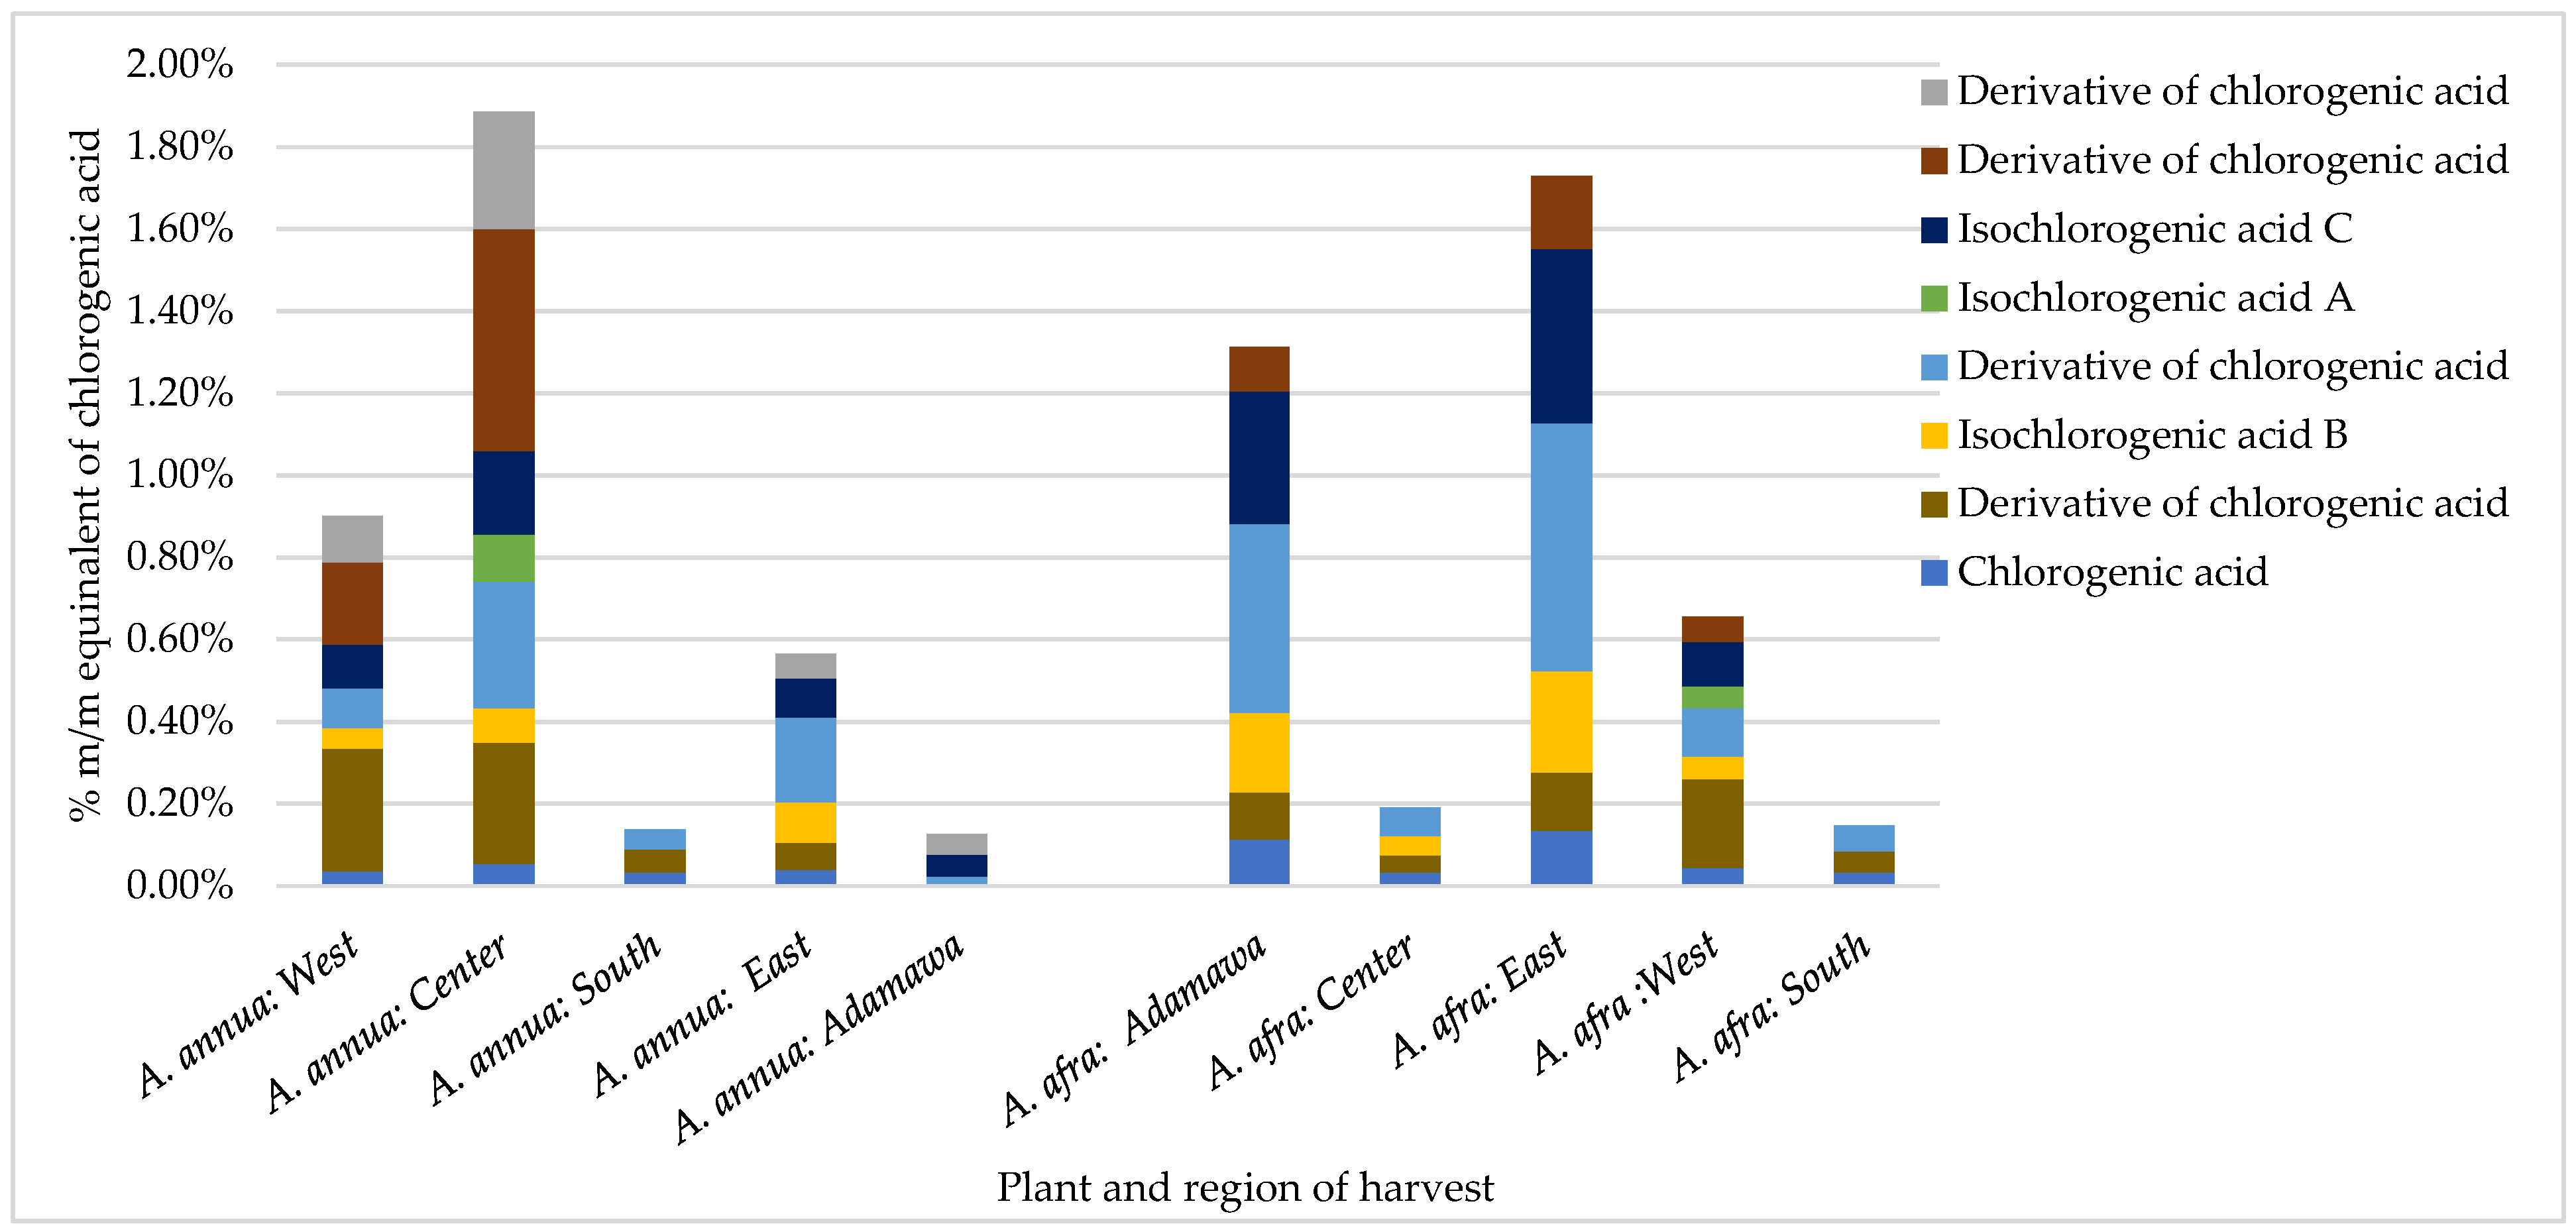
In addition to geographical variations, the results also show seasonal variations in the concentrations of CA and its derivatives. For example, while the A. afra samples obtained in the rainy season from the East region had no detectable amount of CA or its derivatives, the dry season samples presented high concentrations (1.73% m/m CA equivalents), with iso-chlorogenic acid B being one of the major phenolic acids (Figure 3). Except for A. afra from the Center region, generally, higher contents of CA and its derivatives were retrieved in the dry season samples compared to the rainy season samples. No detectable contents of cichoric acid were found in the dry season samples from both species. As for the A. annua samples, generally, higher contents of CA and its derivatives were also observed in the dry season, except from in the samples from the South region.
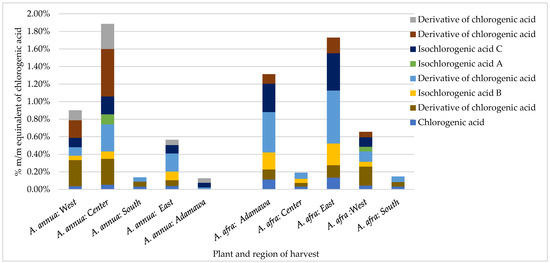
Figure 3.
Effect of geographical location on the contents of chlorogenic acid and its derivatives in Artemisia samples obtained in the dry season expressed as % m/m equivalents of chlorogenic acid.
2.3. Influence of Season and Growing Location on the Natural Abundance of Major Semi-Volatile Components
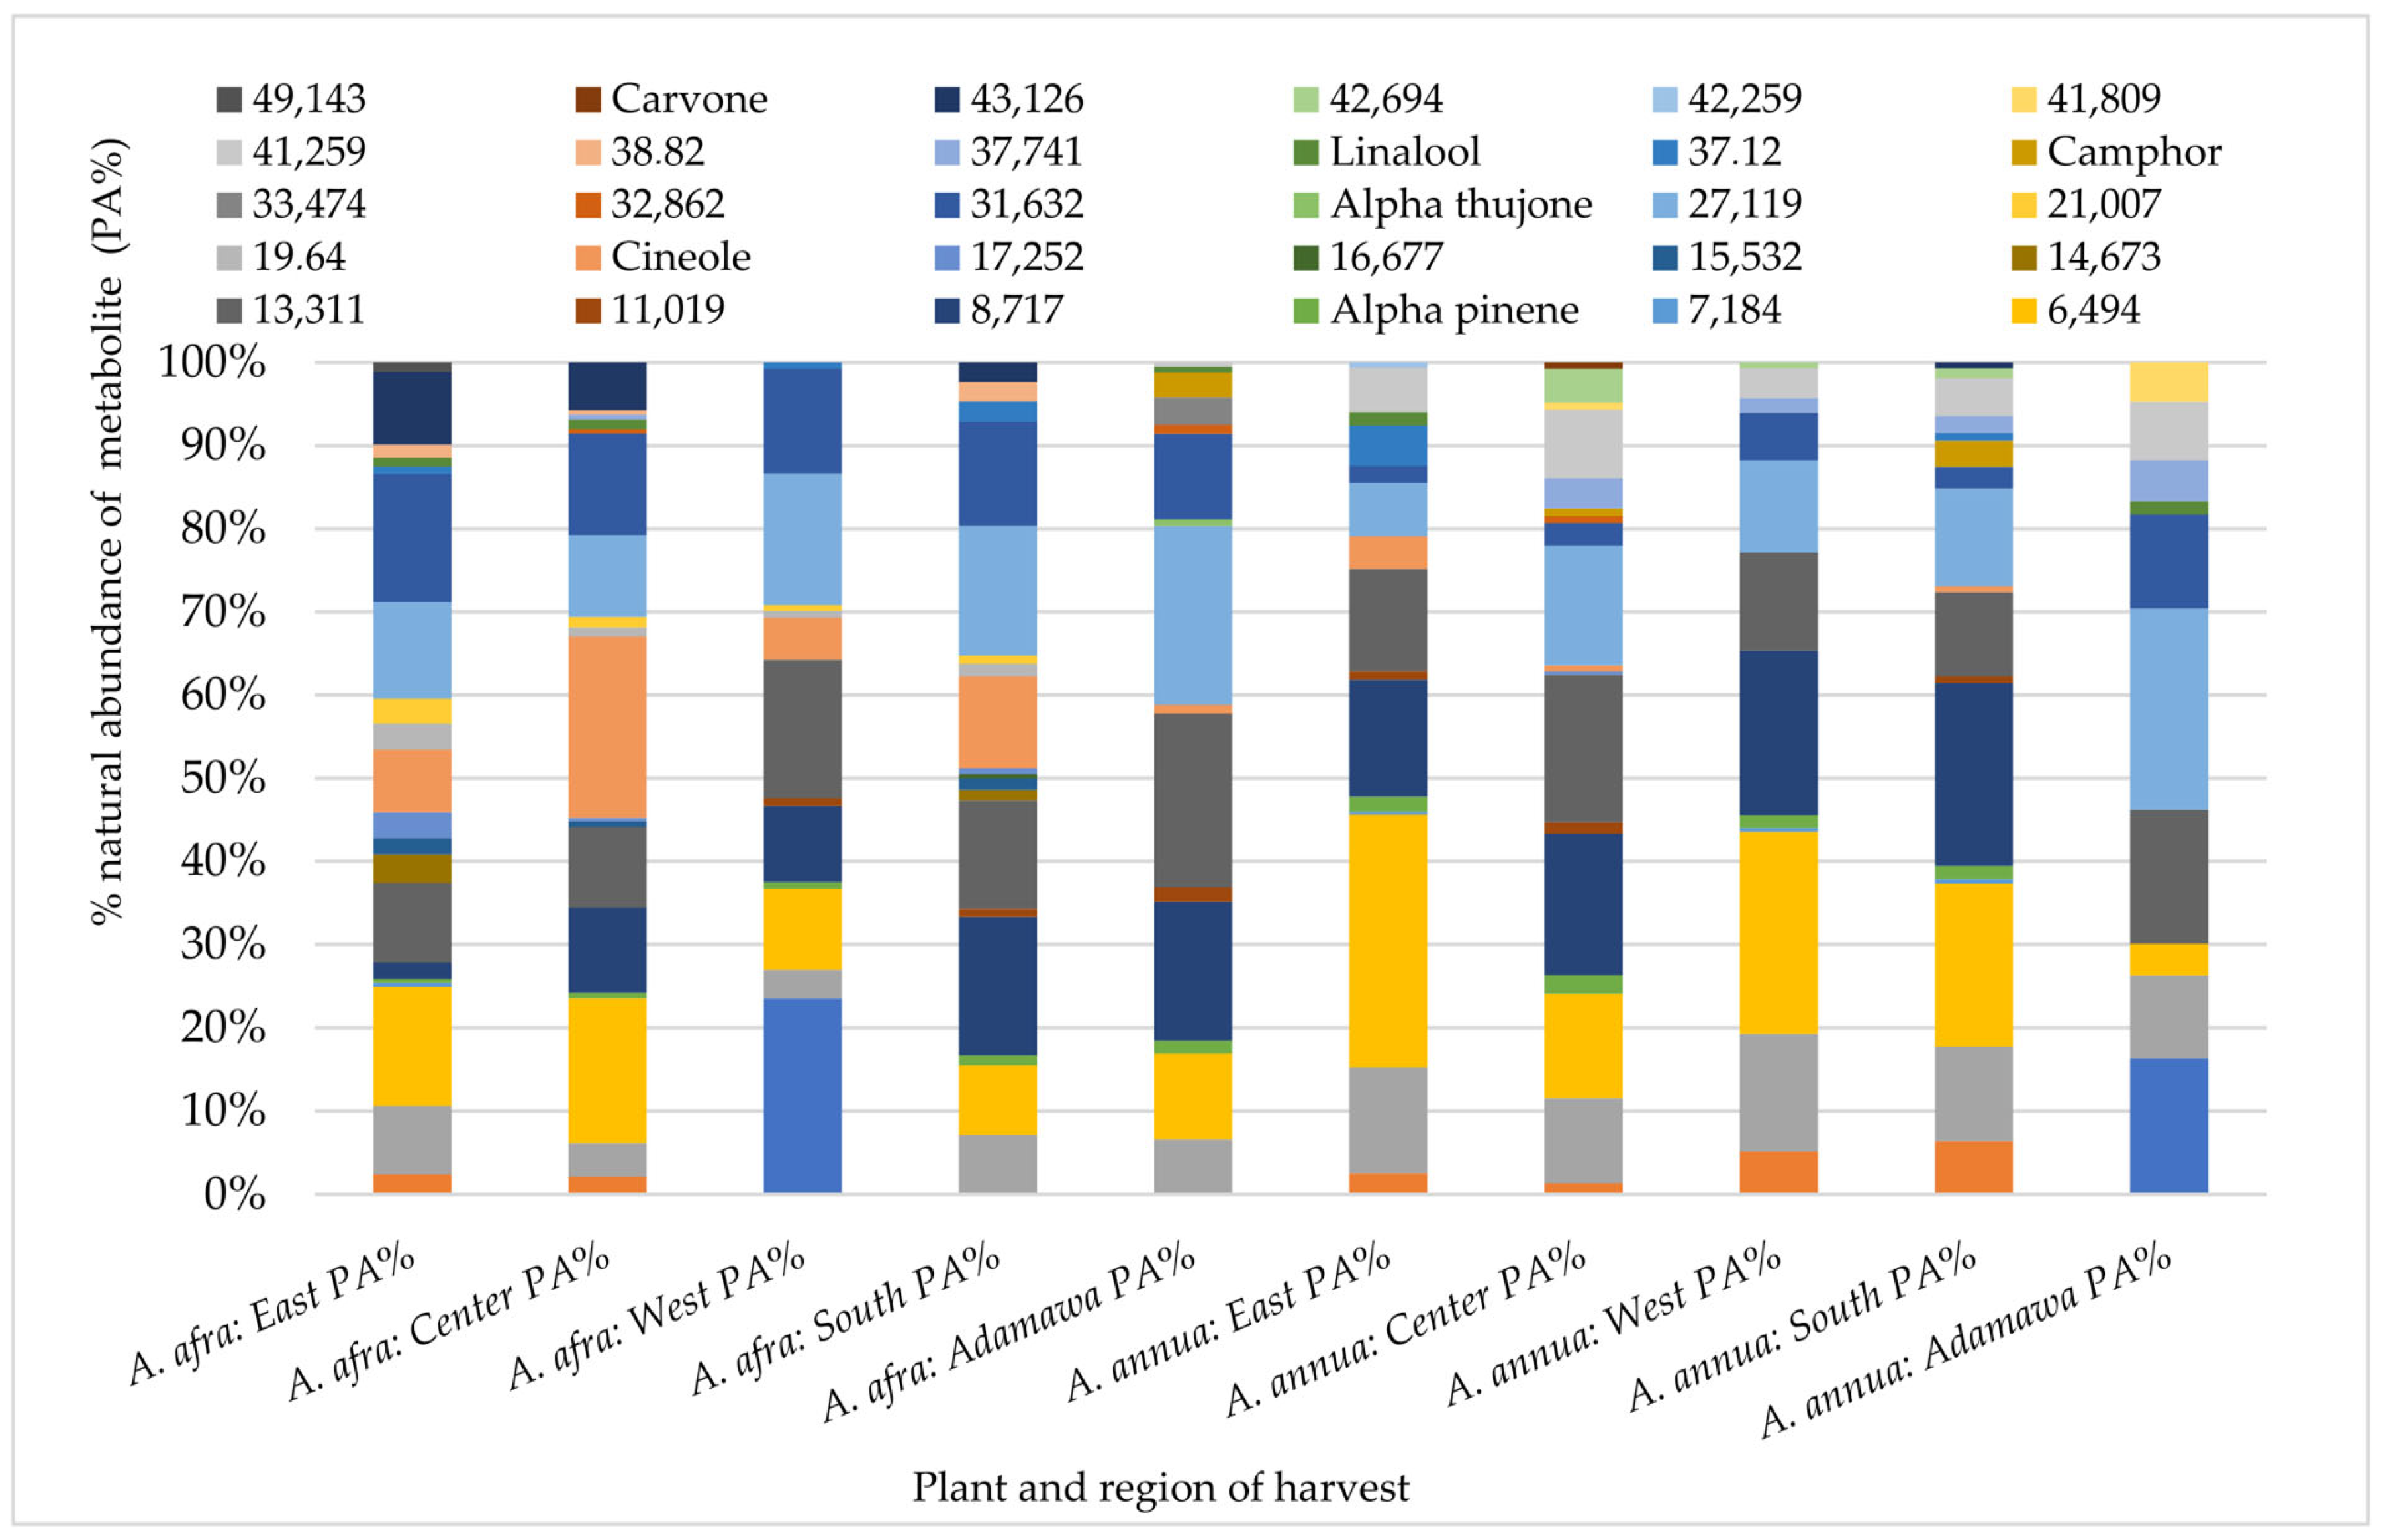
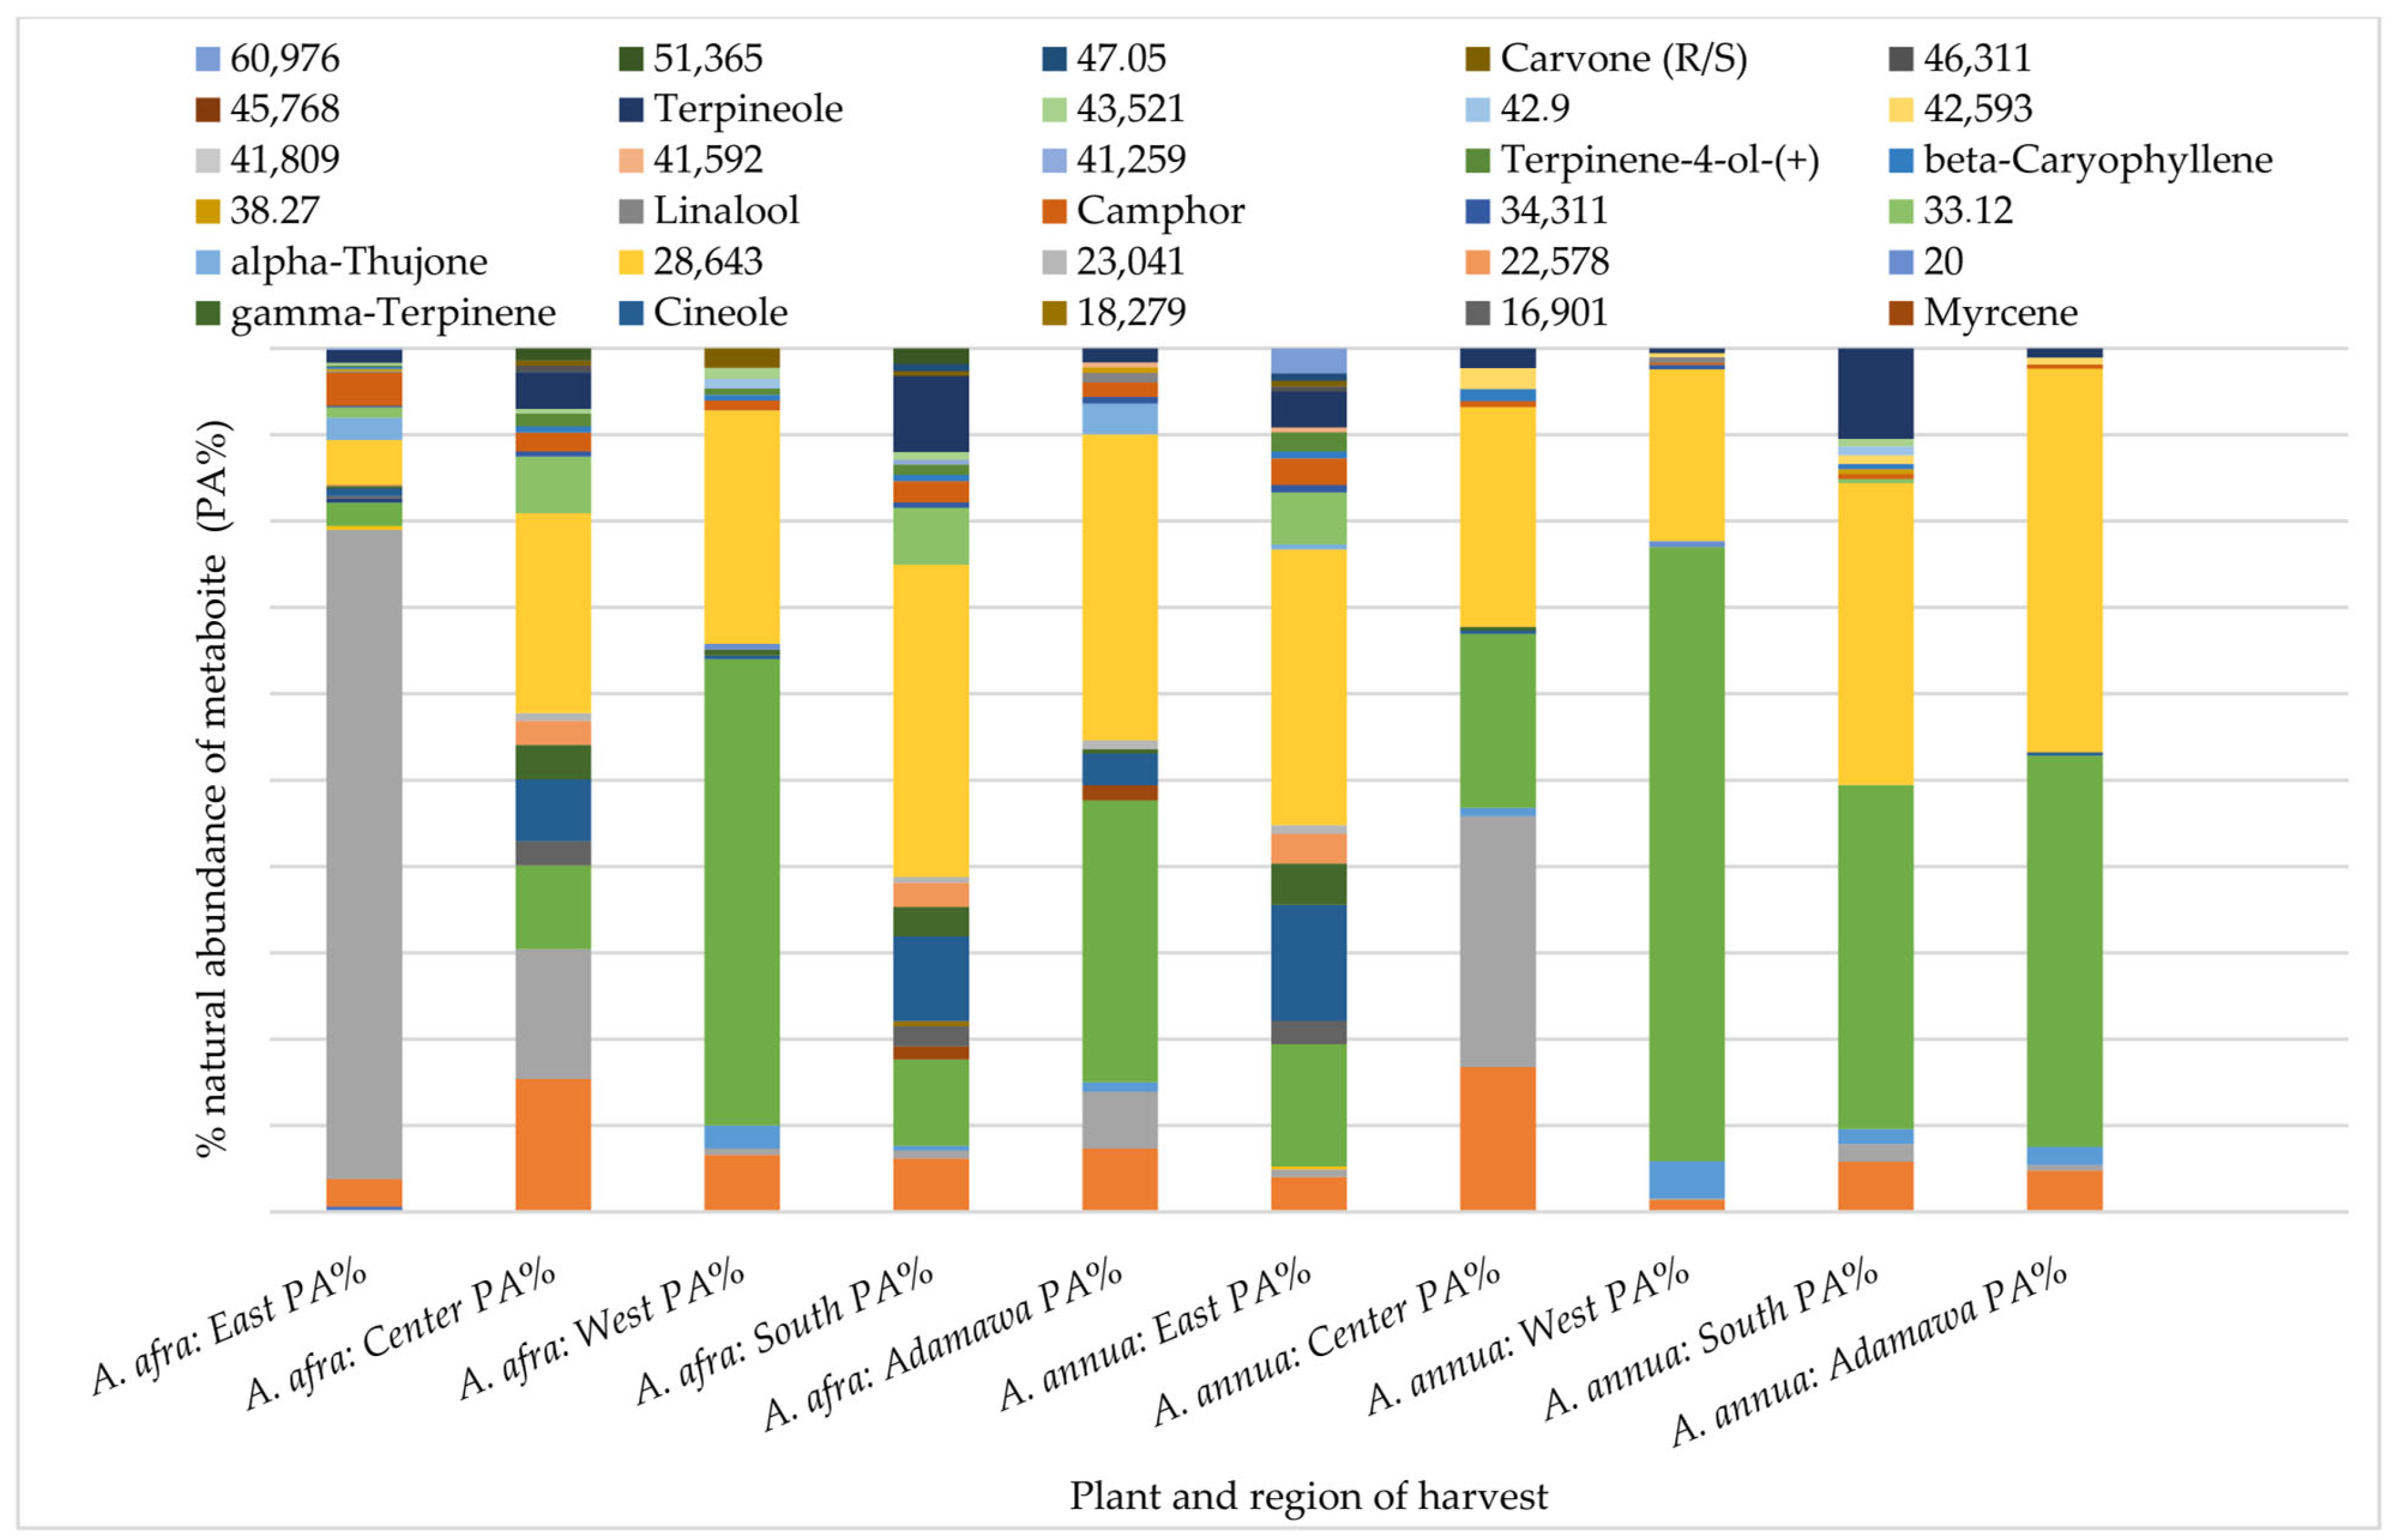
A Gas Chromatography (GC) analysis of semi-volatile components was performed using the acetone extracts of both plants obtained from different locations and seasons. Again, both inter and intra-species variations in the chemical pattern could be observed. Hence, indicating the effect of geographical location on the composition and natural abundances of the semi-volatile components of both species. While α-thujone was only identified in the A. annua samples from the Adamawa region, camphor, α-pinene and linalool were some of the metabolites identified in all rainy season samples with varying relative composition (Figure 4).
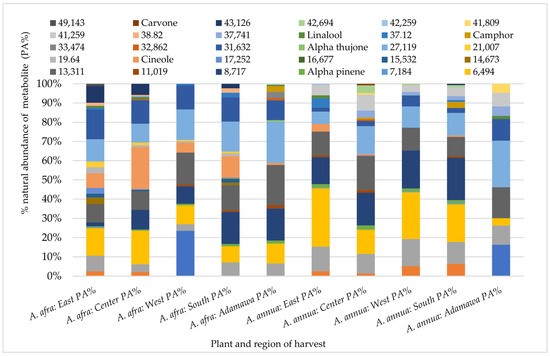
Figure 4.
Influence of geographical location on the GC fingerprint and natural abundances of semi-volatile components in acetone extracts from both plants obtained from different regions in the rainy seasons. Each color indicates a metabolite, and the length gives an estimate of its relative occurrence. The numbers represent the corresponding retention times (RTs); PA% = peak area percent.
As for the samples obtained in the dry season, in addition to the locational variation, the results also show seasonal fluctuations in their composition. Carene-3-(+), terpineol, cineol, β-pinene, and camphor were some of the identified metabolites common to all of the dry season samples from both species but, again, with varying relative compositions (Figure 5).
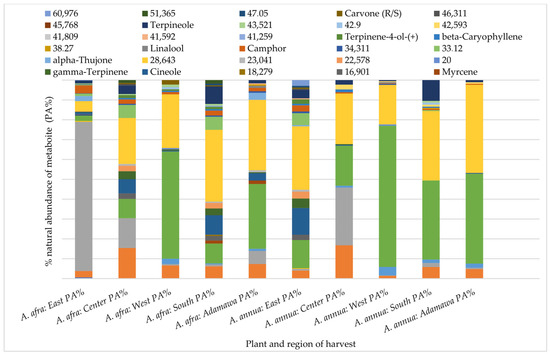
Figure 5.
Variation in the GC fingerprint and natural abundances of semi-volatile components in acetone extracts from both plants obtained from different regions in the dry season. Each color indicates a metabolite, and the length gives an estimate of its relative occurrence. The numbers represent the corresponding retention times (RTs); PA% = peak area percent.
2.4. Influence of Season and Growing Location on Artemisinin Content
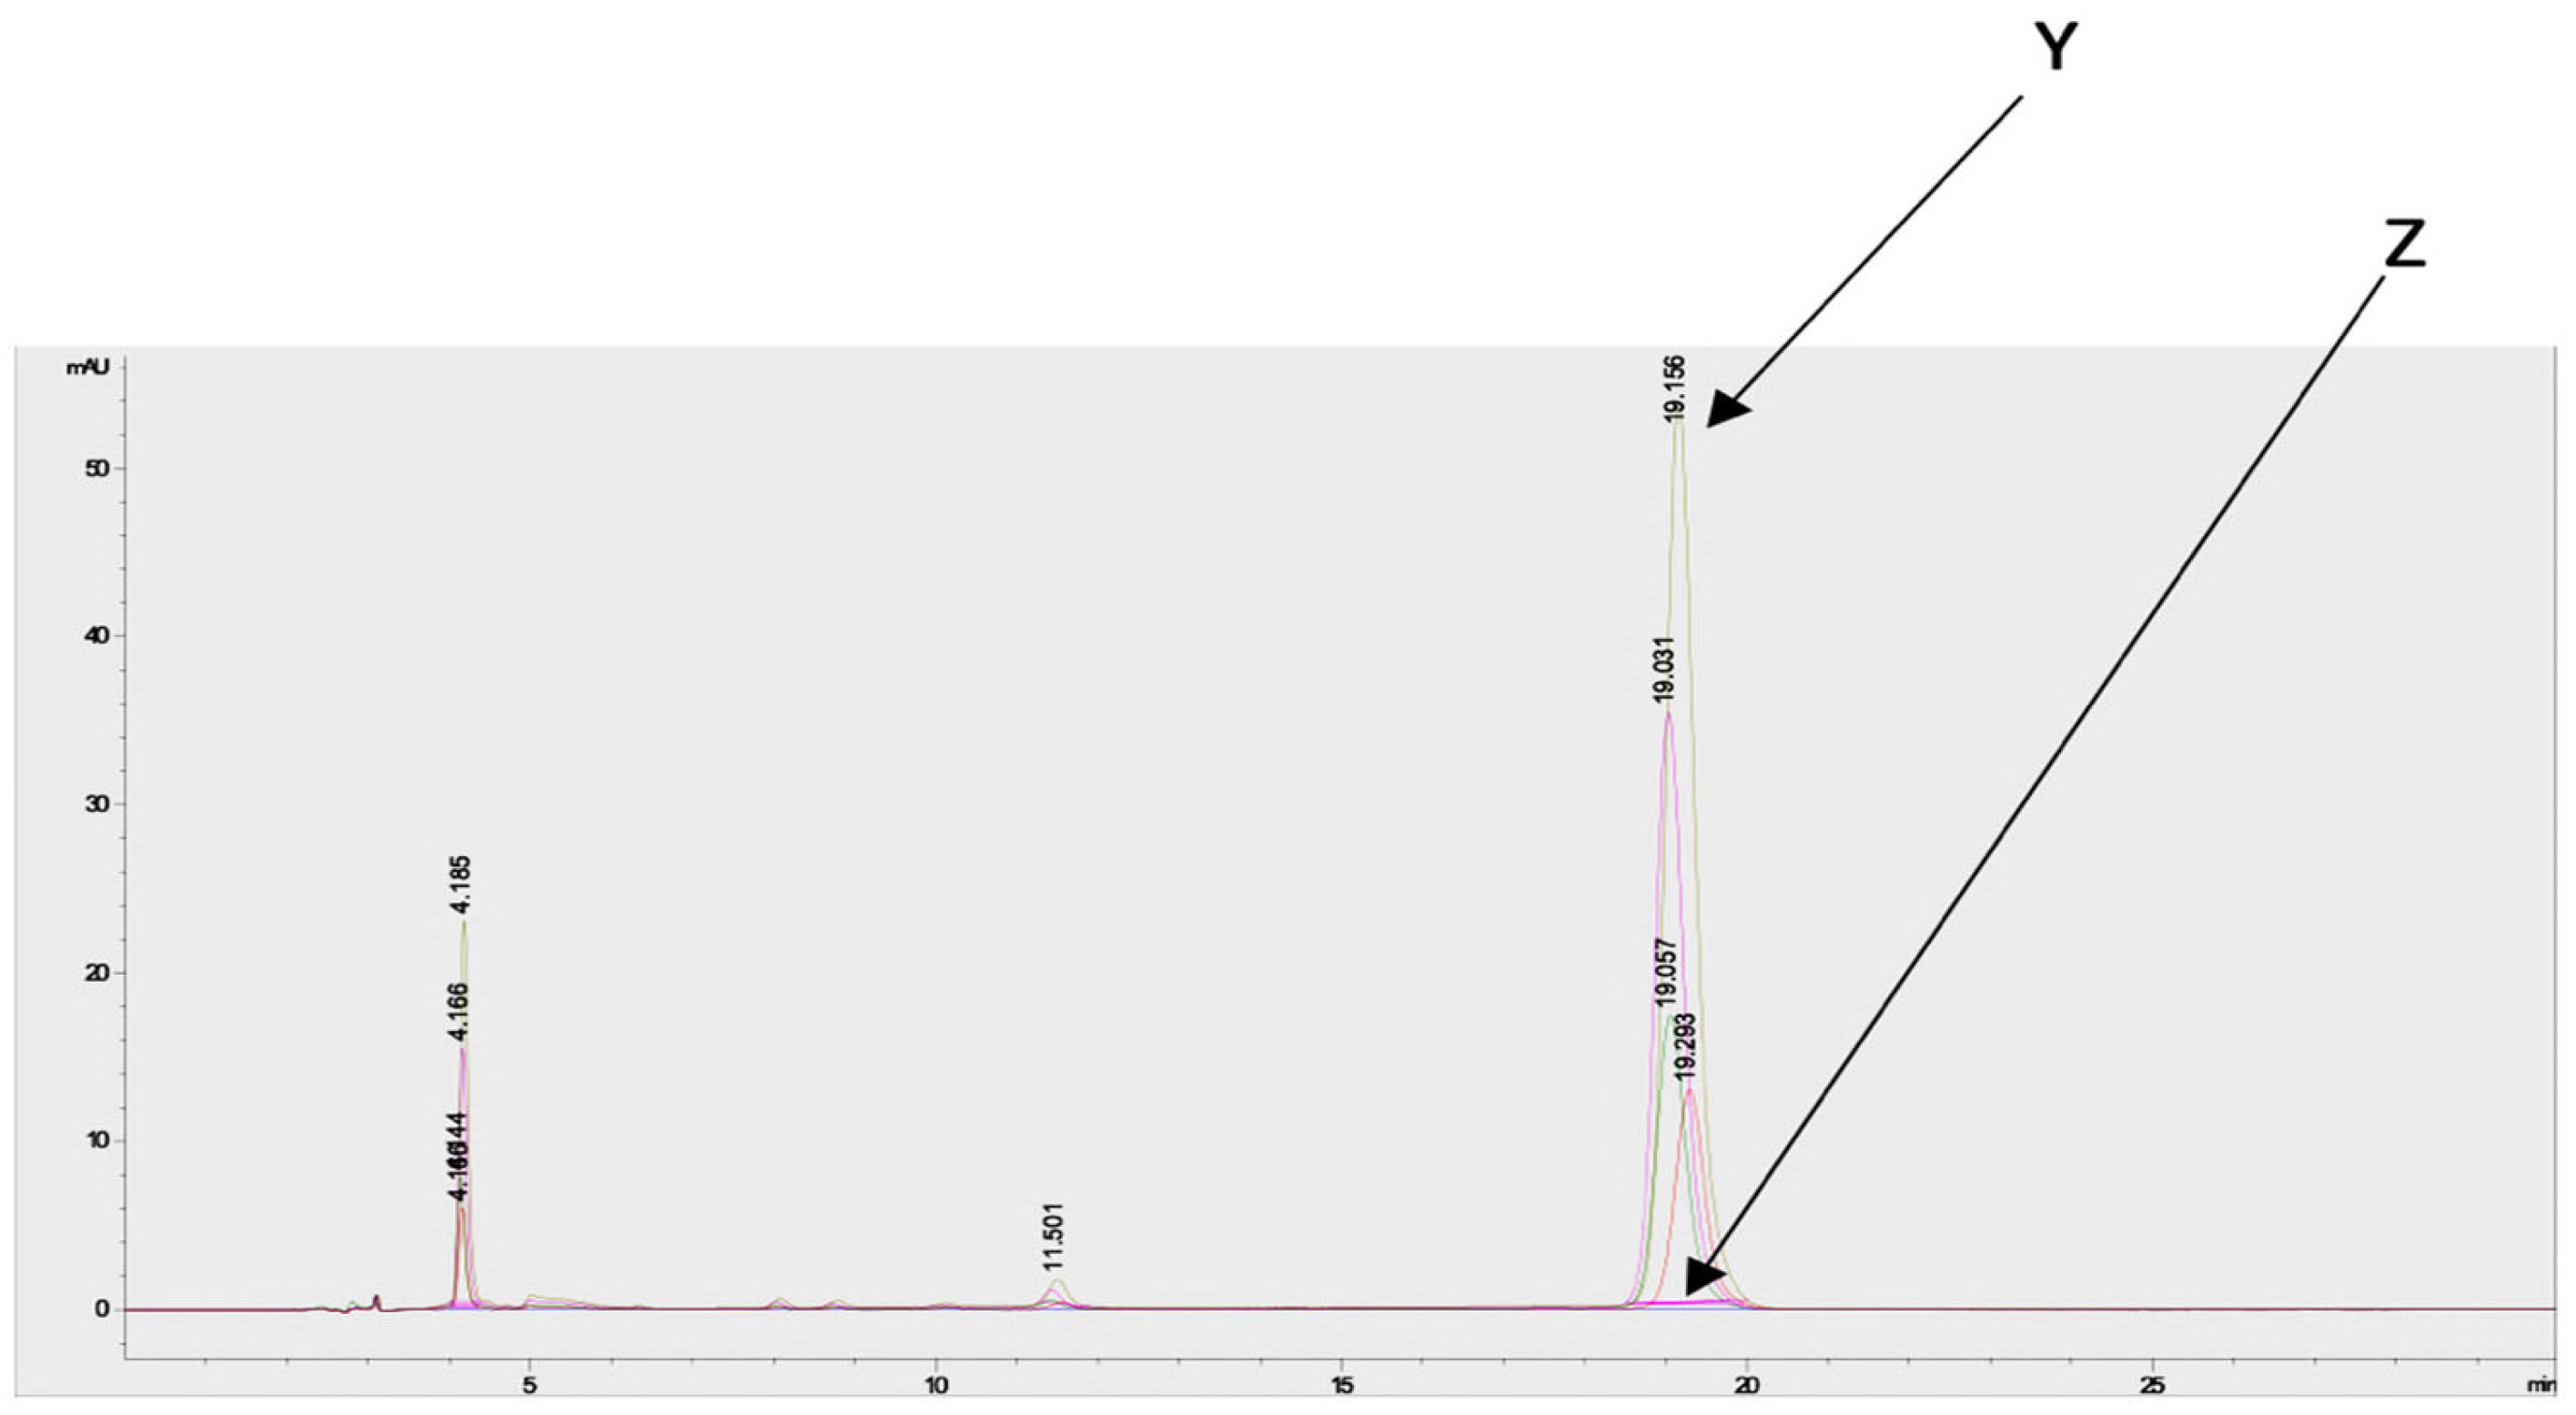
Estimation of the artemisinin contents in the acetone and methanol crude extracts of both species from different regions and seasons indicated a higher concentration in the acetone extracts compared to the methanol extracts (Supplementary Figure S3). Chromatograms of artemisinin (as the standard) and the derivatized and underivatized samples following the HPLC analysis are shown in Figure 6.
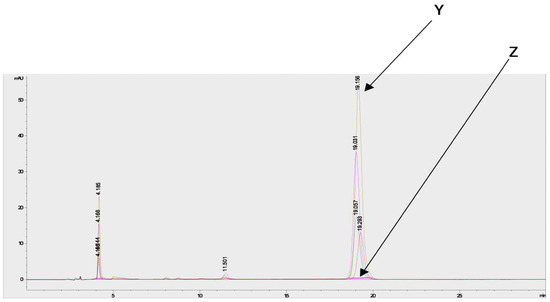
Figure 6.
Chromatograms of artemisinin (standard) and derivatized and underivatized A. annua samples following HPLC analysis shows the presence of artemisinin in the A. annua samples. Y = chromatogram of derivatized samples and artemisinin, and Z = chromatogram of underivatized samples.
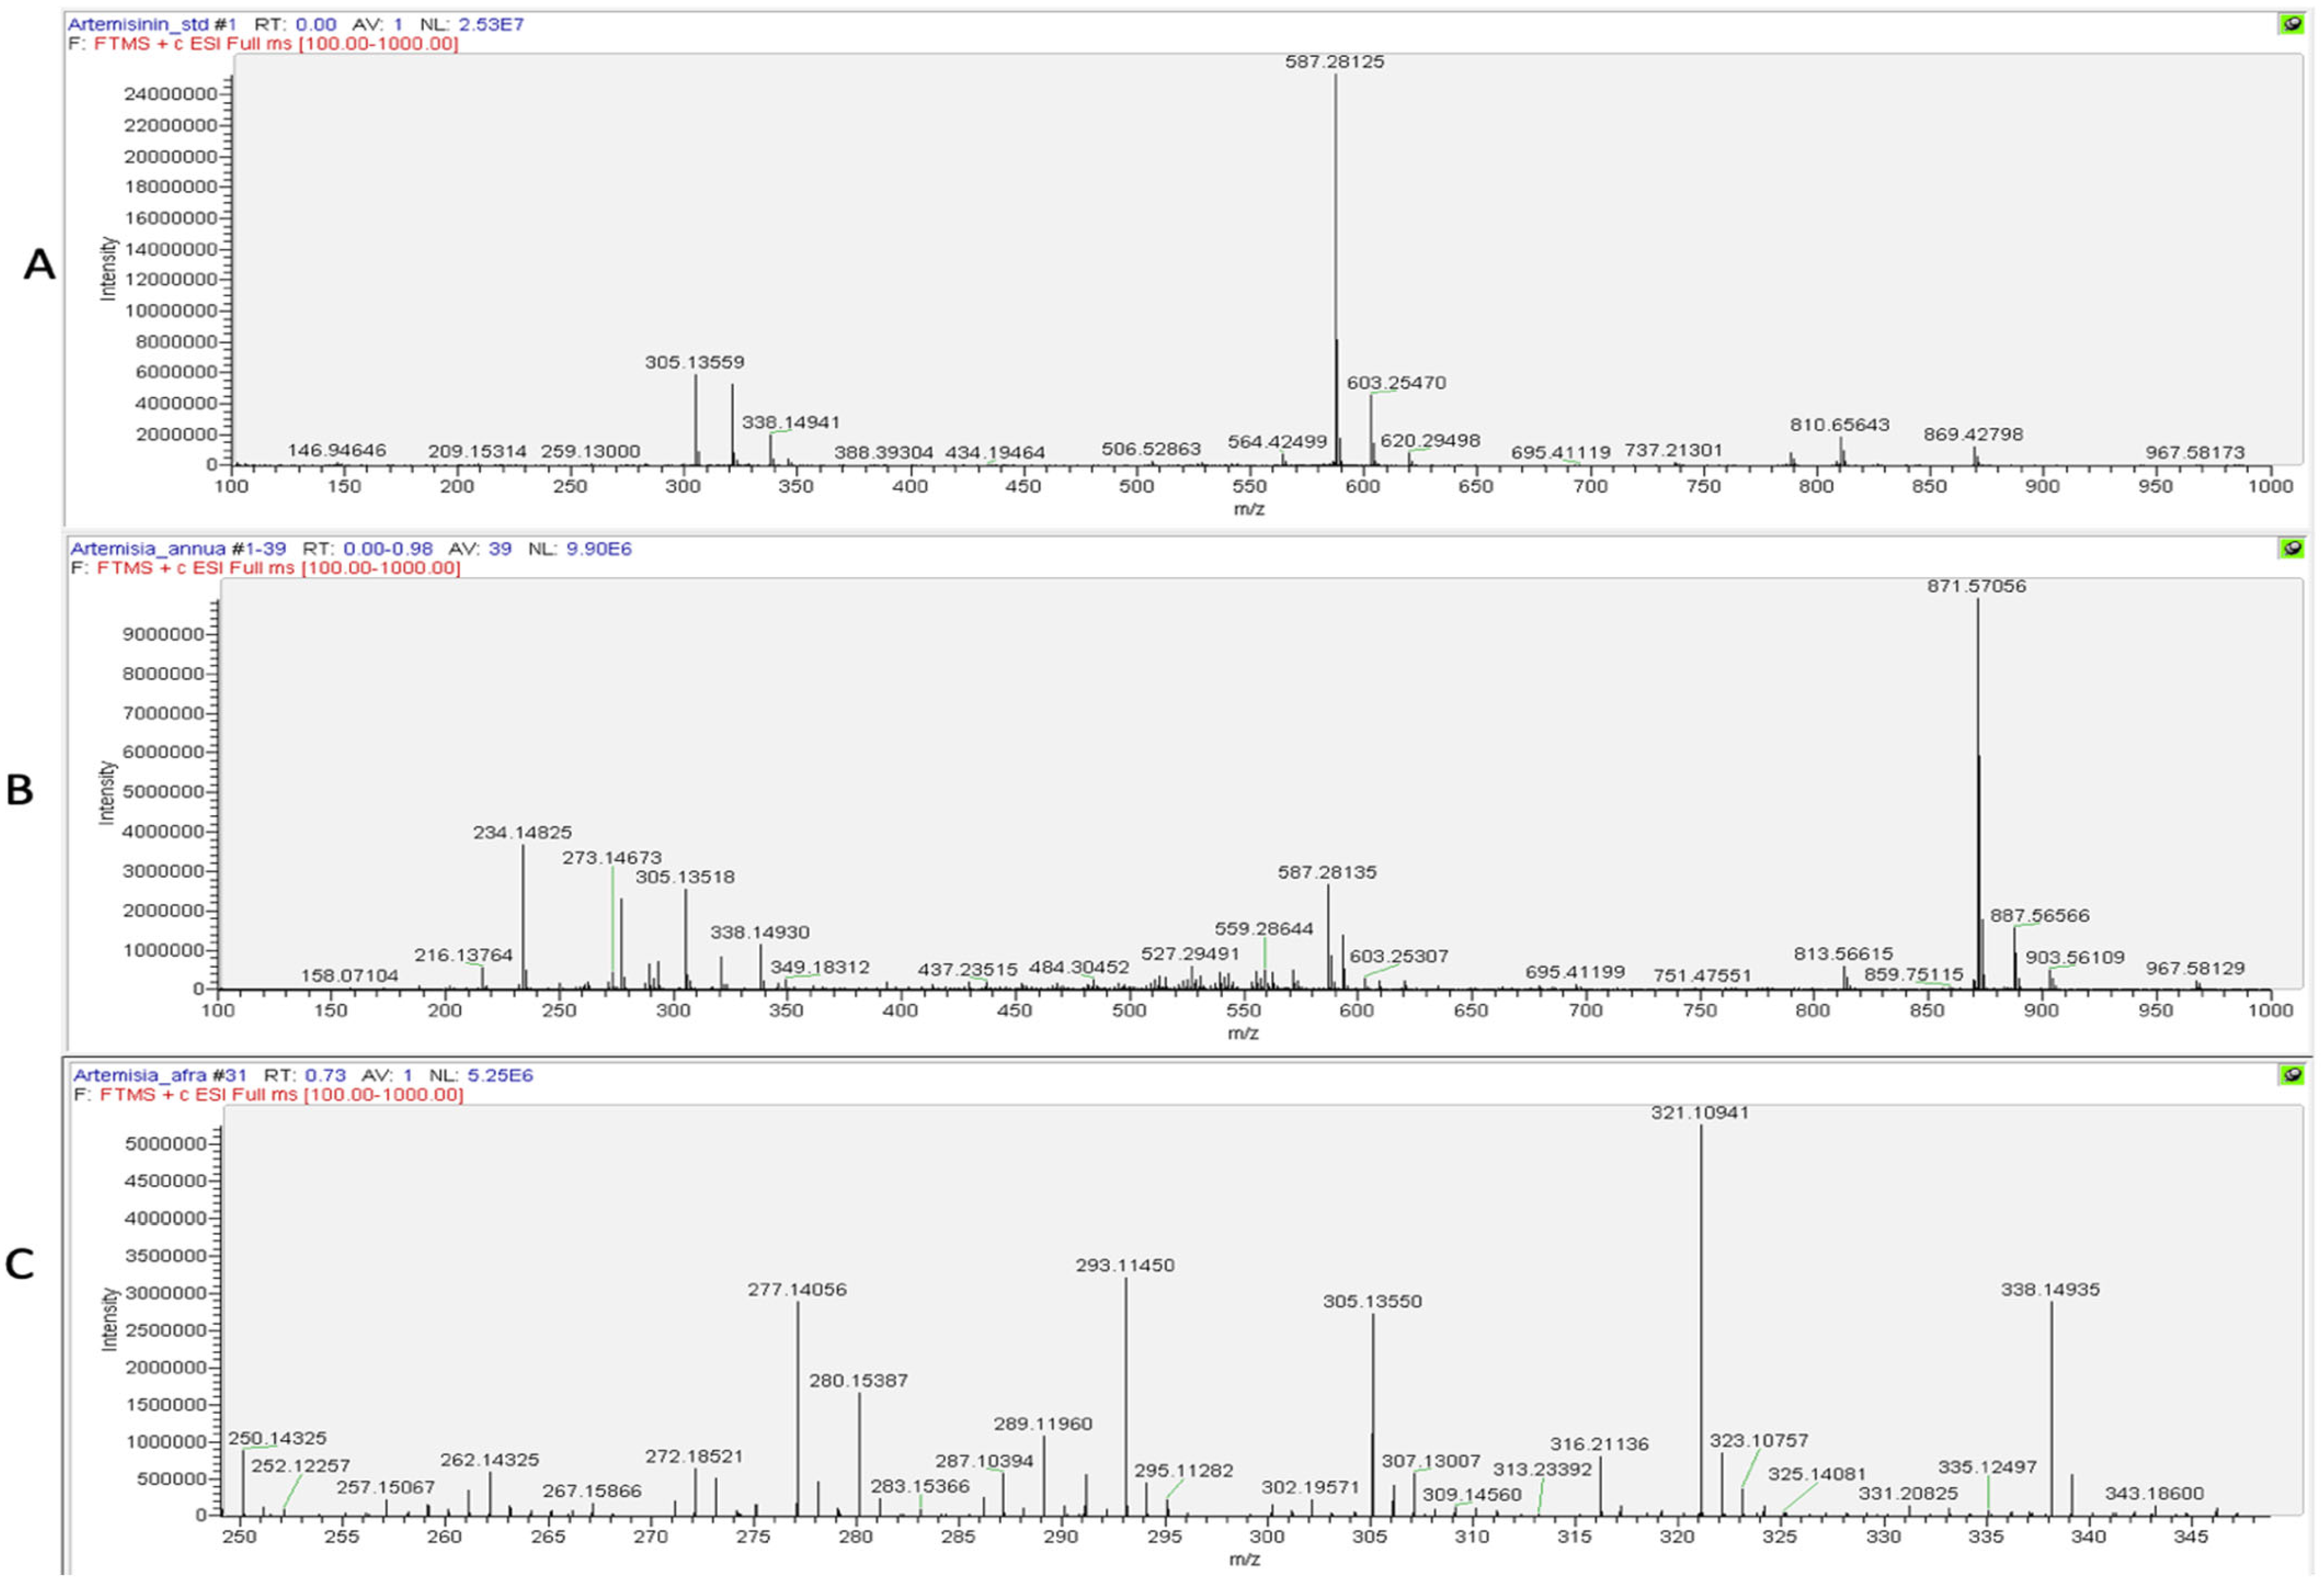
The presence of artemisinin was further confirmed using a Direct Infusion High-Resolution Mass Spectrometry (DI–HRMS) analysis of the dry season samples of A. annua and A. afra, as derivatization can result in the production of artefacts. The spectrum for the artemisinin reference (Figure 7A) indicated the specific ions m/z 305.13550 ([M+Na]+) and m/z 587.28107 ([2M+Na]+), which were detected in the spectra of both the A. annua and A. afra samples using DI–HRMS (Figure 7B and Figure 7C, respectively).
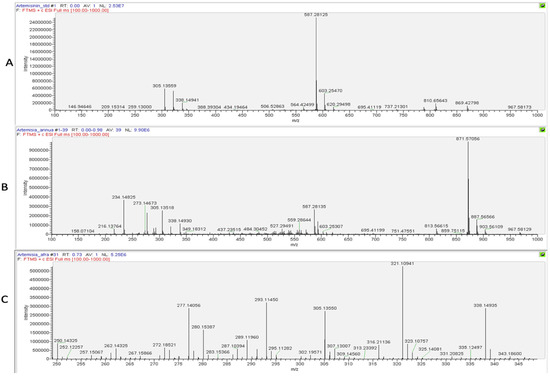
Figure 7.
DI–HRMS spectra of (A) artemisinin, (B) A. annua, and (C) A. afra to visualize artemisinin [M+Na]+ contents.
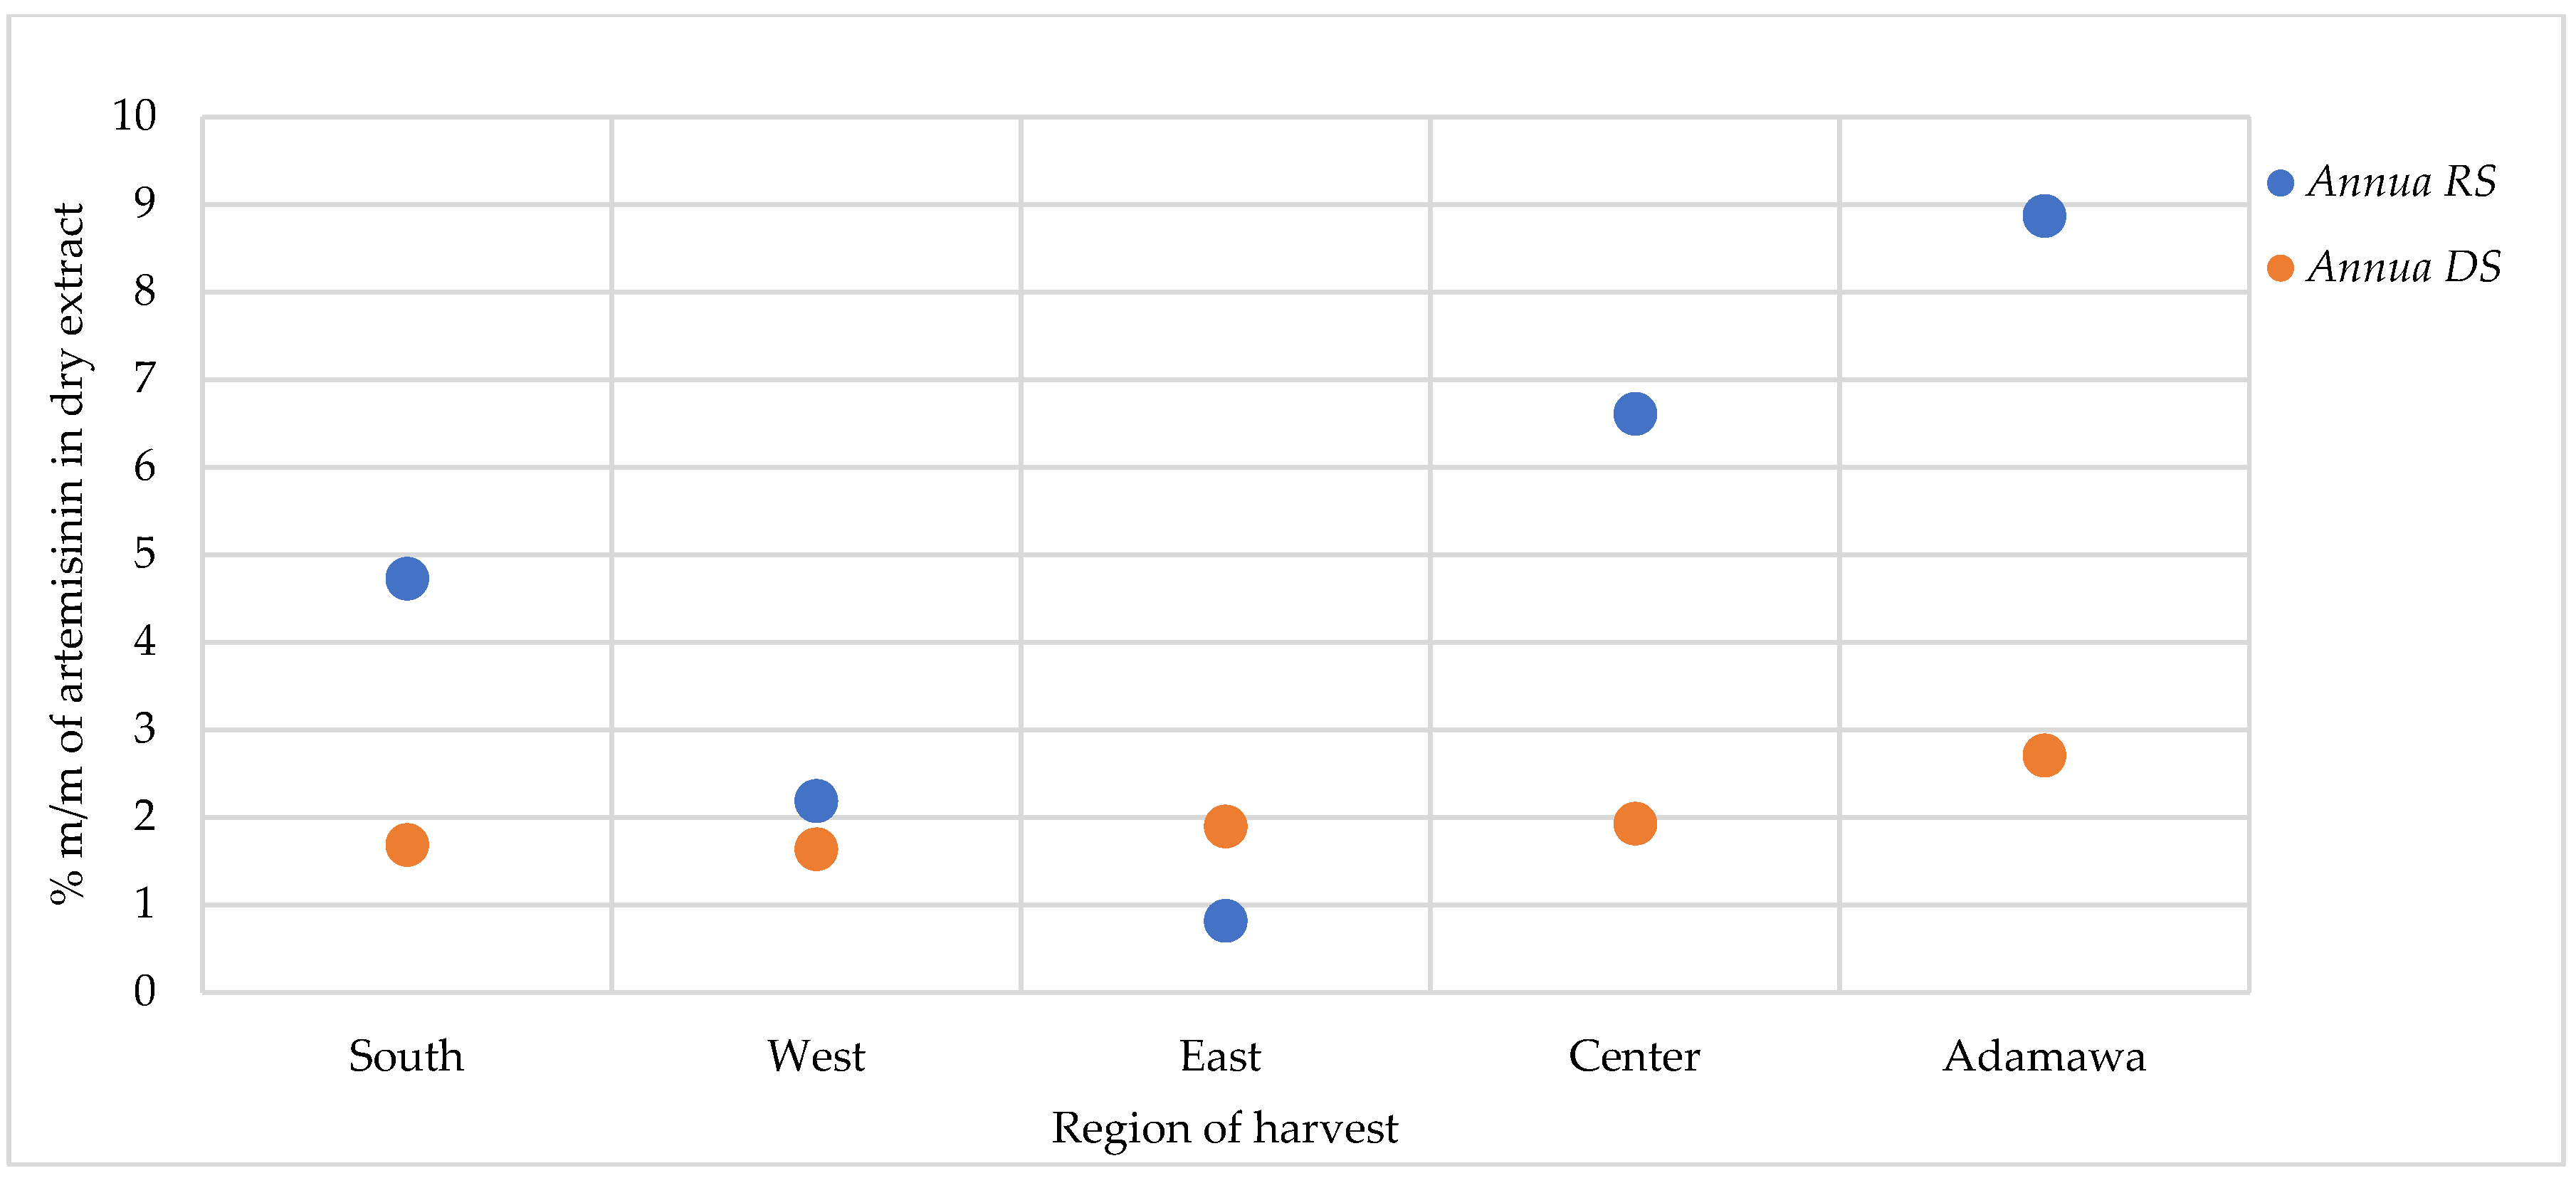
For the A. afra samples, only traces of artemisinin were found in some locations, while in other regions, no detectable amount could be found. As for A. annua, varying artemisinin contents were obtained as influenced by geographical and seasonal origin, with generally the highest contents detected in the rainy season samples (Figure 8). The A. annua samples from the Adamawa region showed the highest artemisinin content (8.88 and 2.71% for the rainy season and dry season samples, respectively), while the lowest contents were found in the samples from the East region.
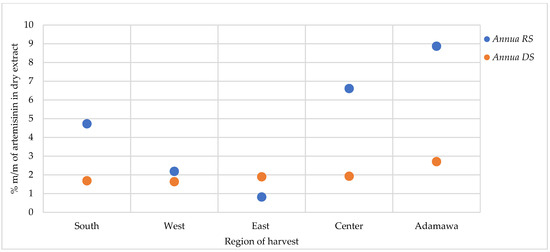
Figure 8.
Effect of seasonal and geographical variation on artemisinin contents in A. annua. RS = rainy season samples, DS = dry season samples.
2.5. Seasonal and Geographical Variation in the Total Polyphenol Contents
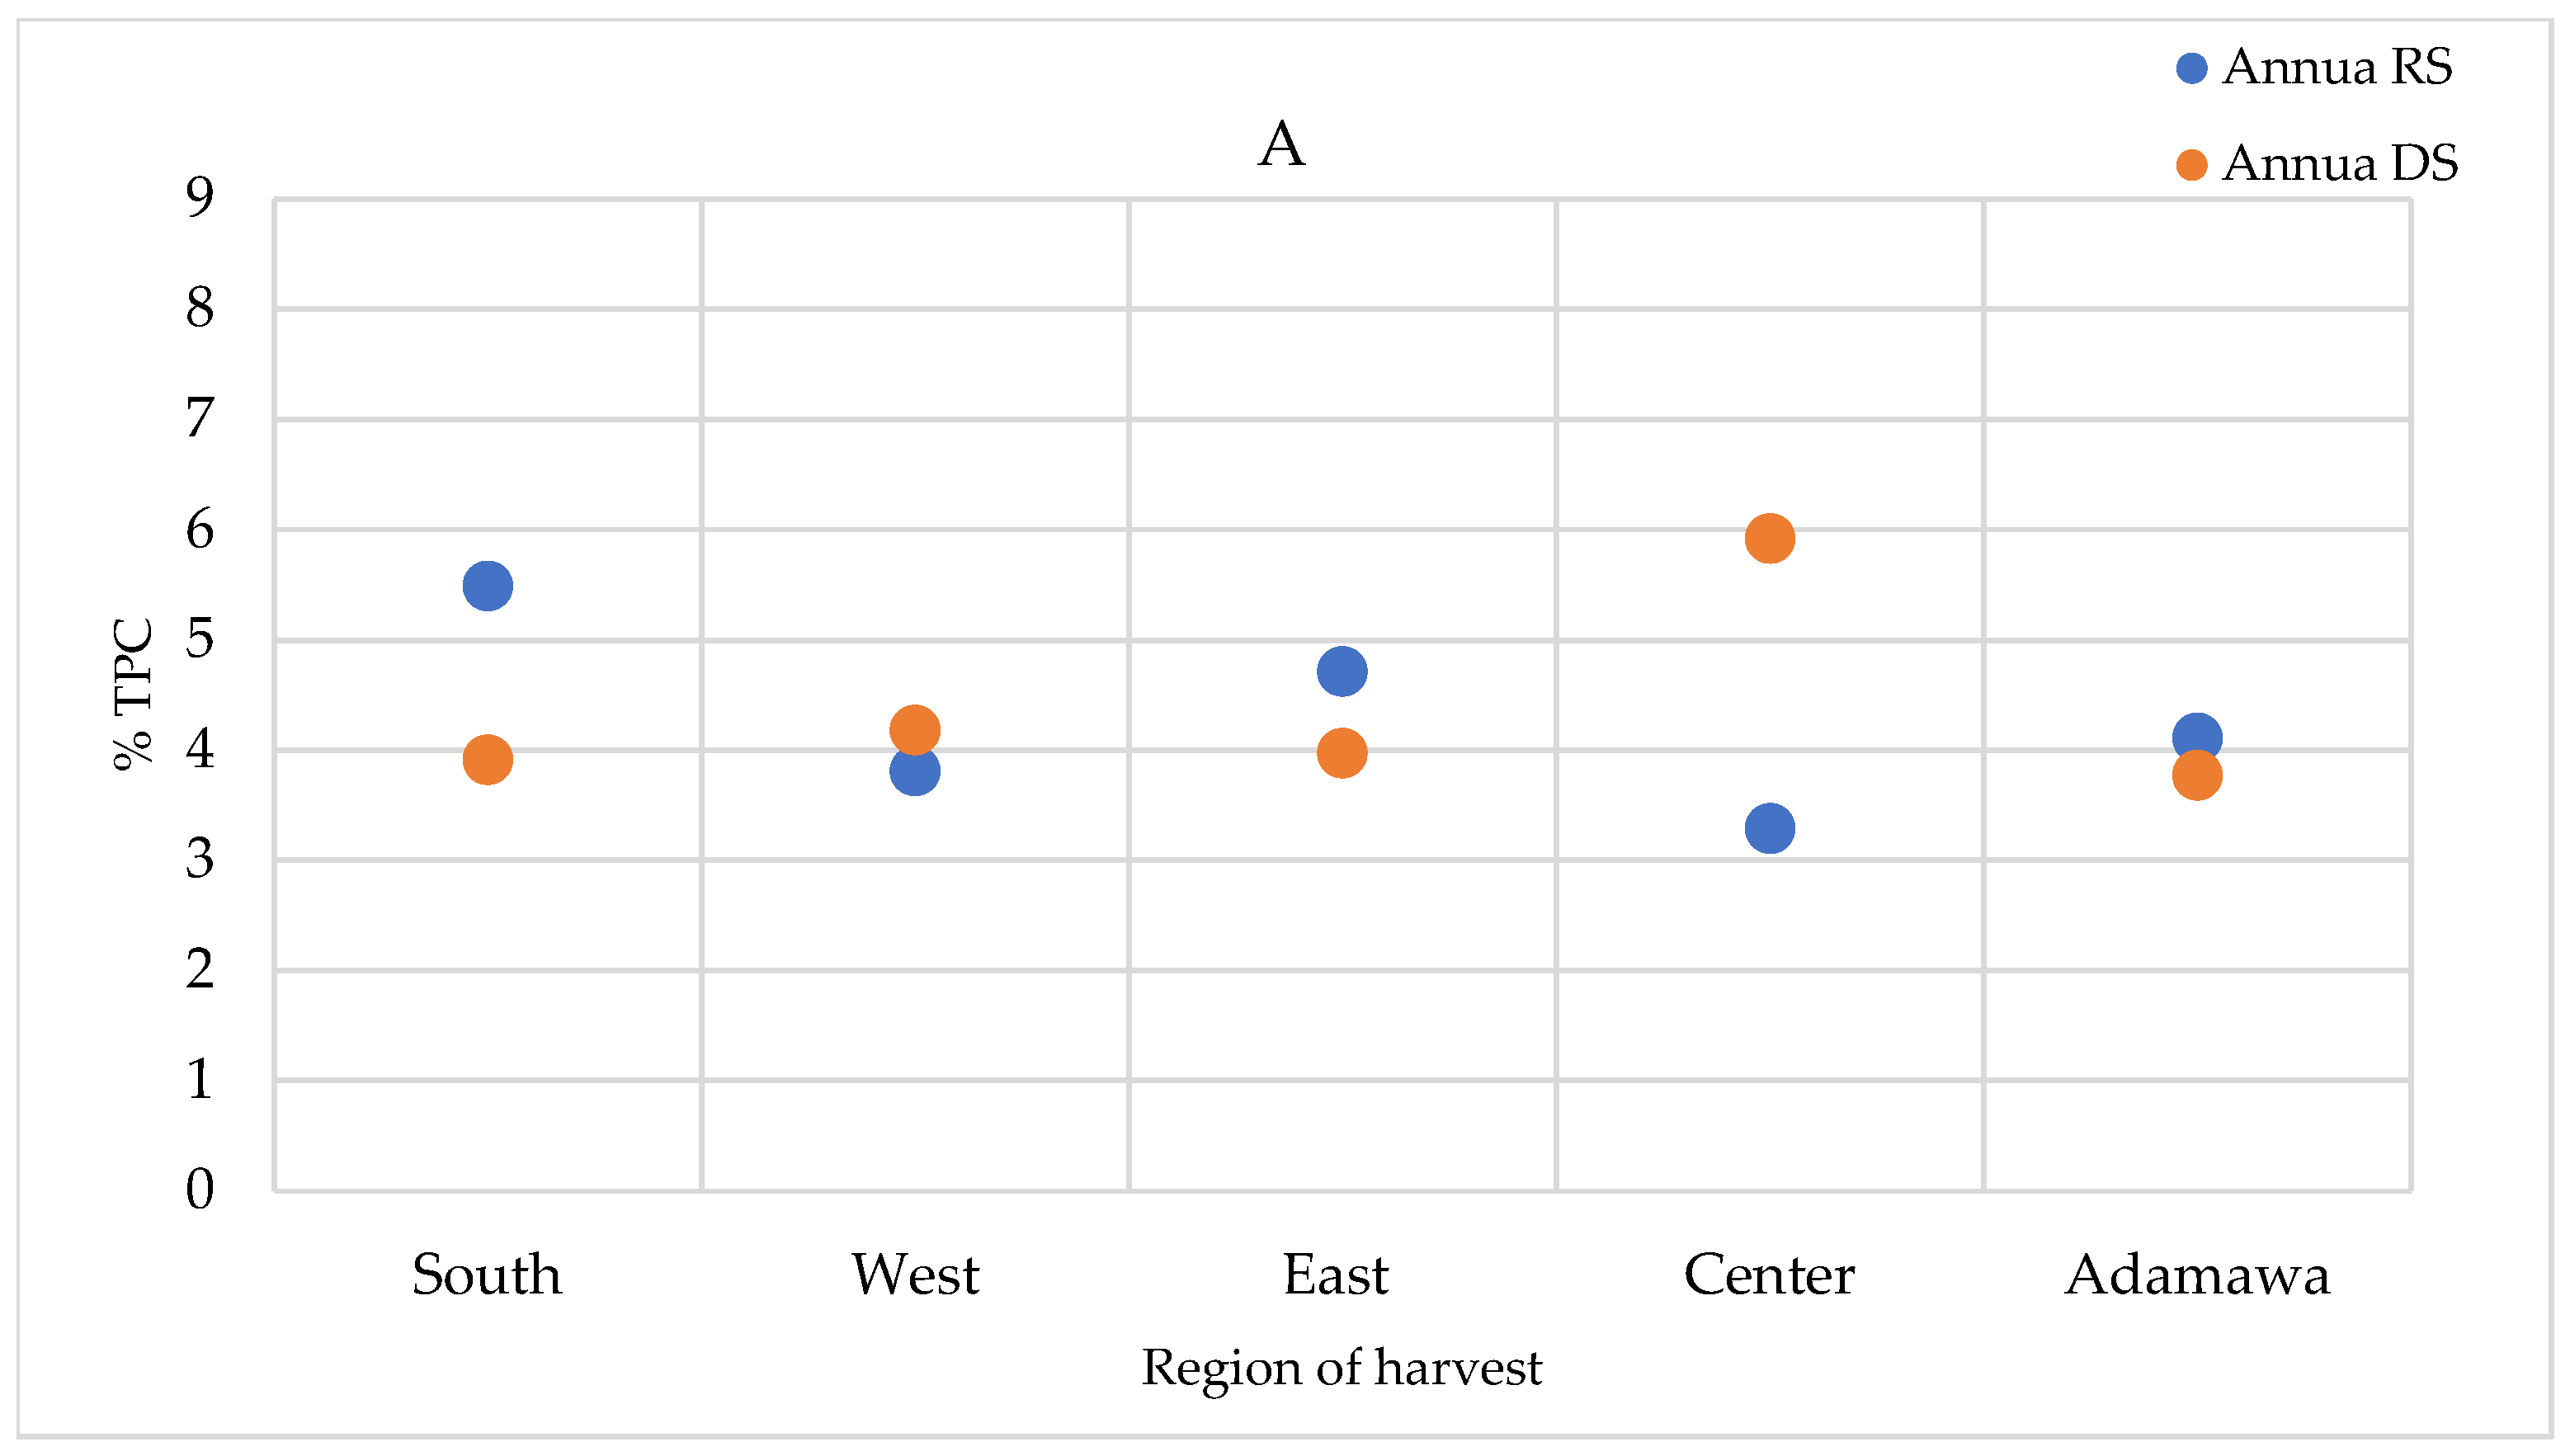
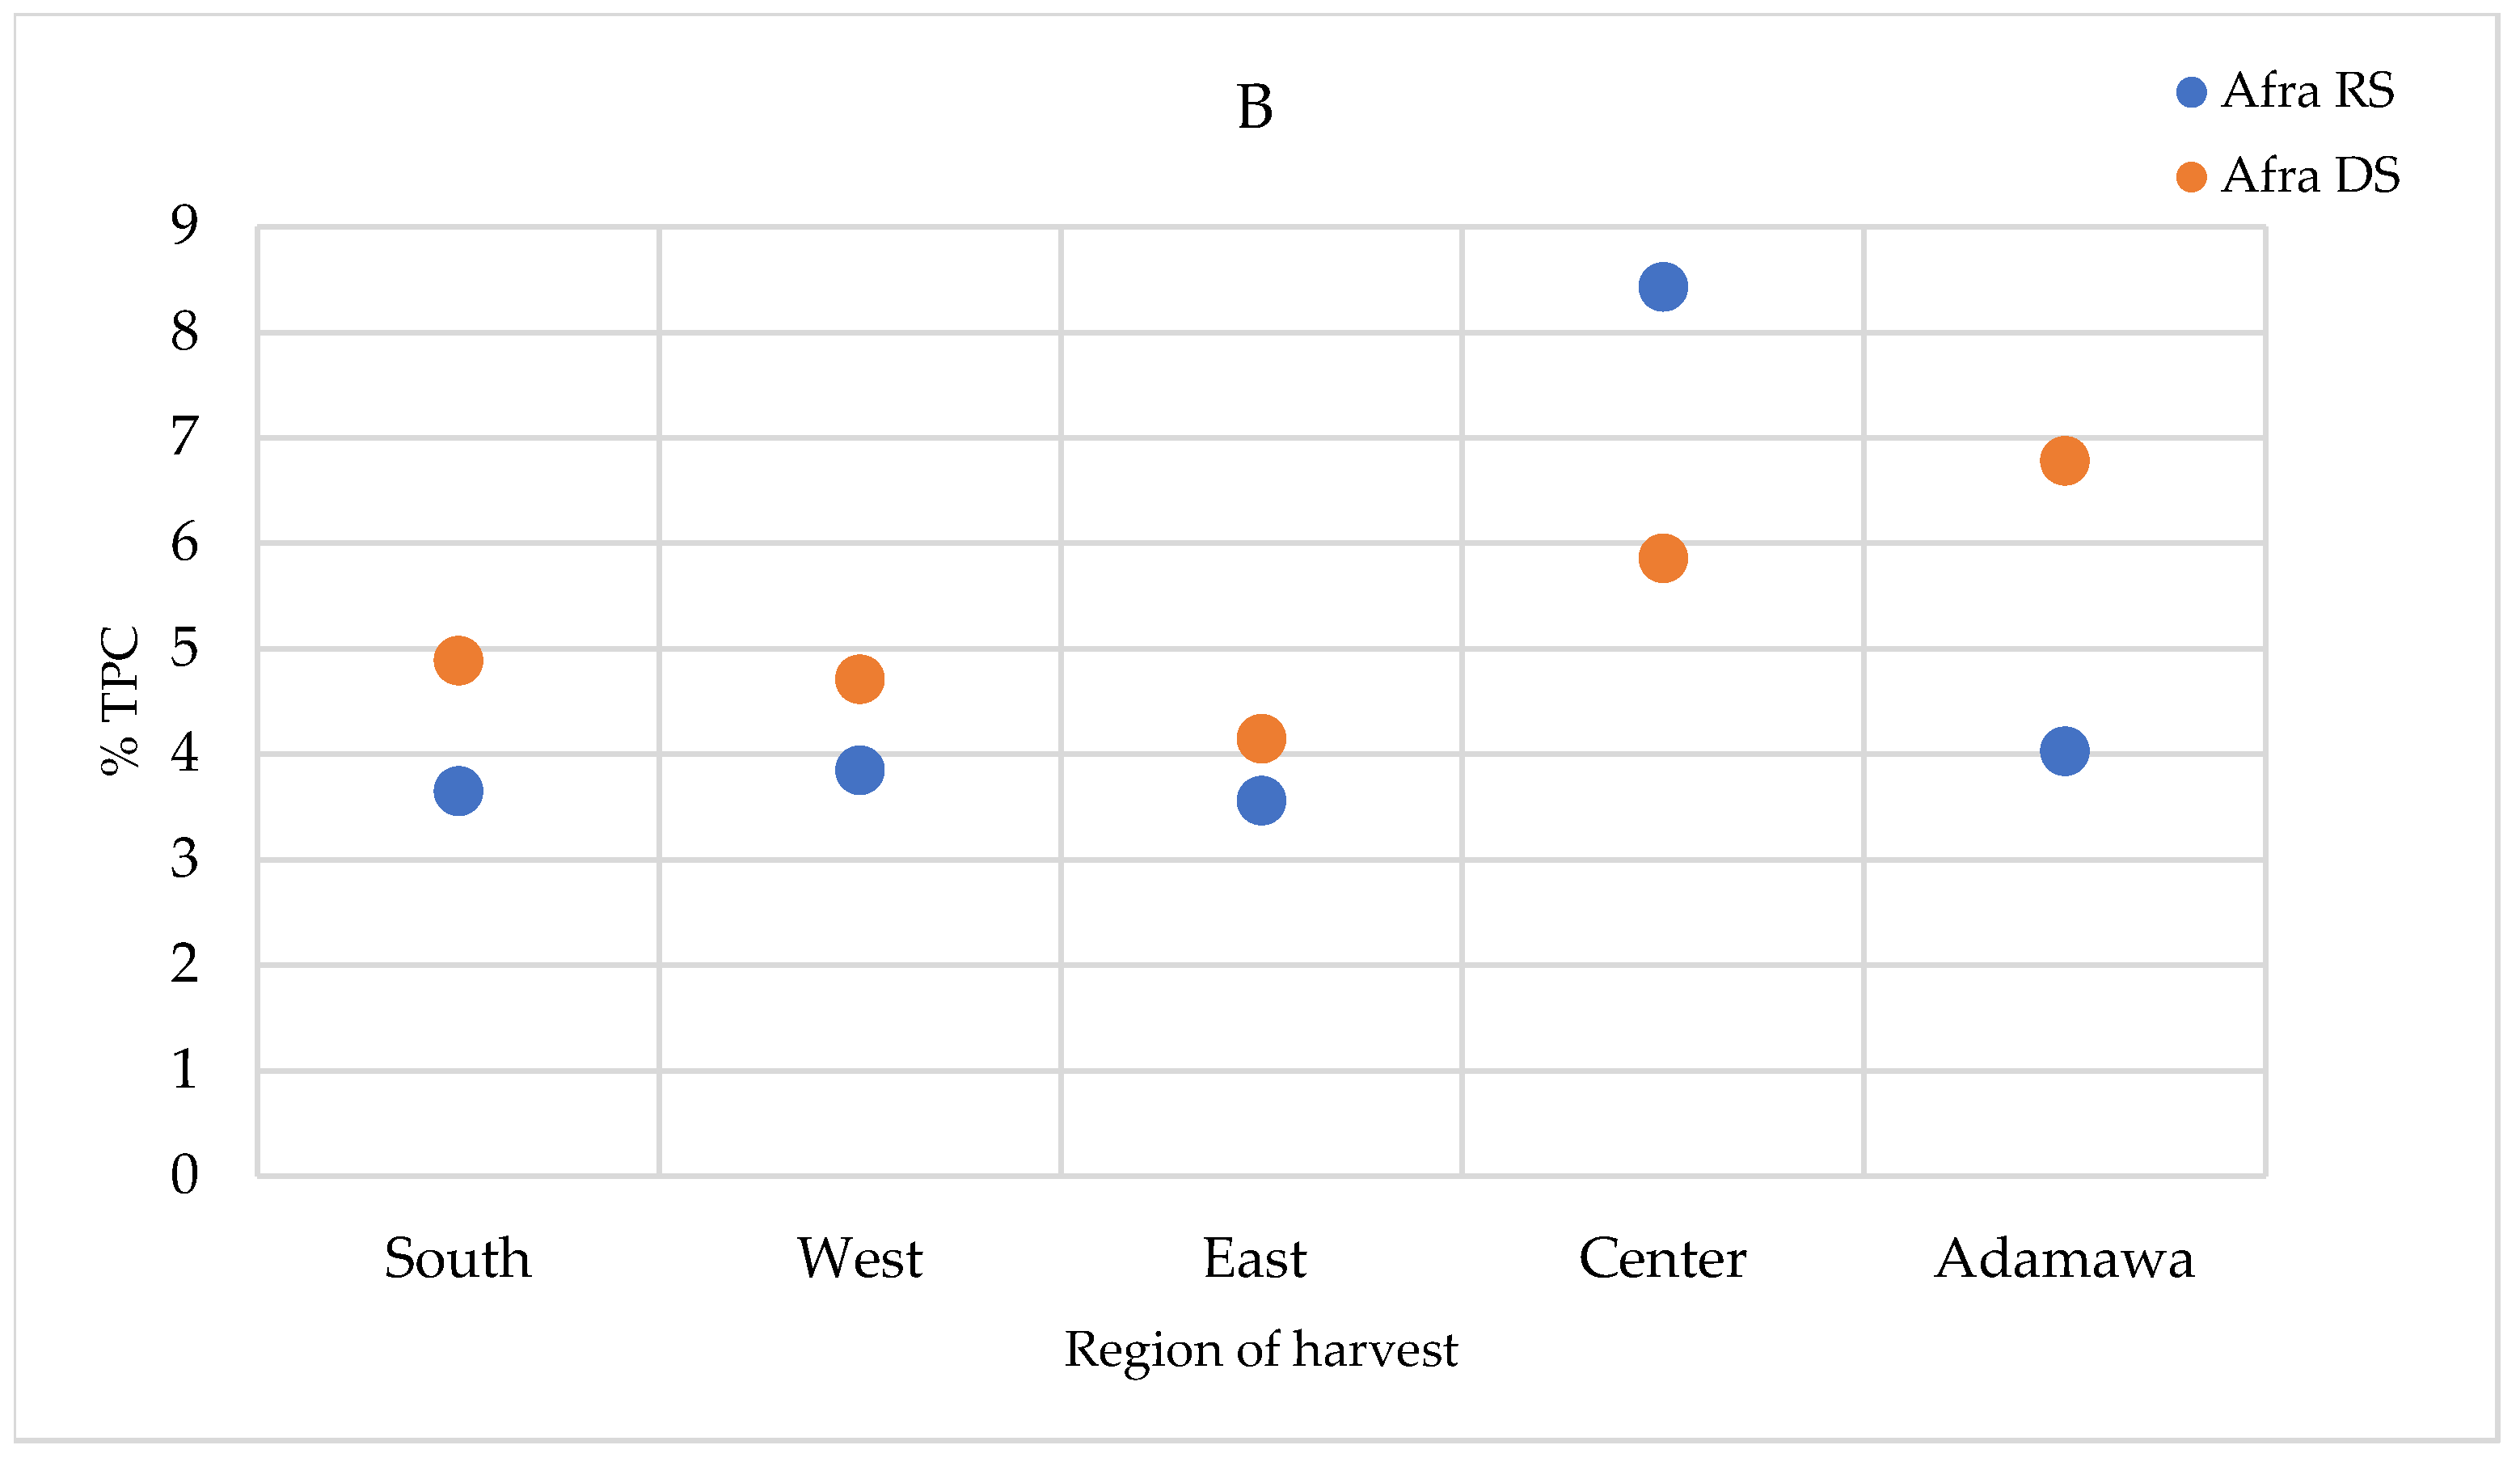
The total polyphenol contents (TPCs) were quantified in the extracts prepared using the infusion method (the traditional preparation), as well as the extracts obtained using the method described in the European Pharmacopoeia (heating and reflux) and in the methanol crude extracts. The TPCs were higher in the methanol crude extracts, followed by those obtained using the heating and reflux method, while infusion showed the lowest contents (Supplementary Figure S4). For the A. annua samples, only a relevant geographical fluctuation was ascertained (Figure 9A). However, for the A. afra samples, a seasonal effect was also observed, with the highest concentrations measured in the dry season samples, except for in the samples obtained from the Center region. The TPCs of A. afra ranged between 3.43 (in rainy season samples from the East region) and 8.43% m/m dry extract (in rainy season samples from the Center region) (Figure 9B). The values found within the A. annua-based extracts ranged between 3.29 and 5.92% m/m dry extract in the samples obtained from the Center region in the rainy and dry seasons, respectively (Figure 9A).
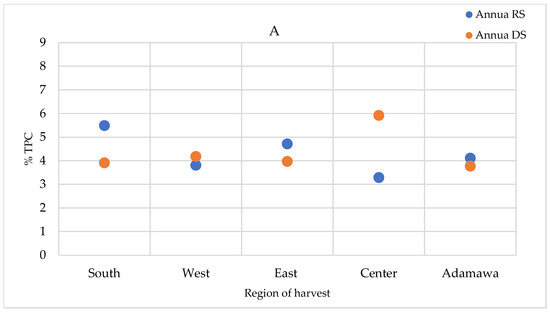
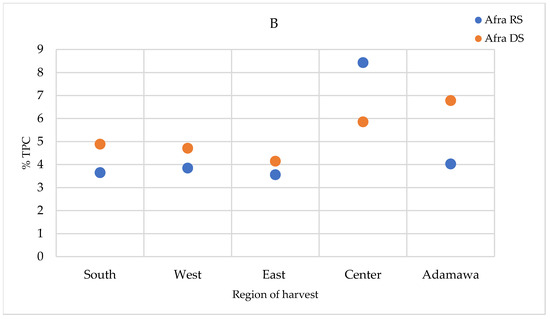
Figure 9.
TPCs expressed as % m/m polyphenol in dry extract in methanol extracts of (A) A. annua and (B) A. afra obtained in the rainy and dry seasons. RS = rainy season samples; DS = dry season samples.
2.6. Anti-Plasmodial Activity of the Extracts and the Correlation with Chemical Patterns
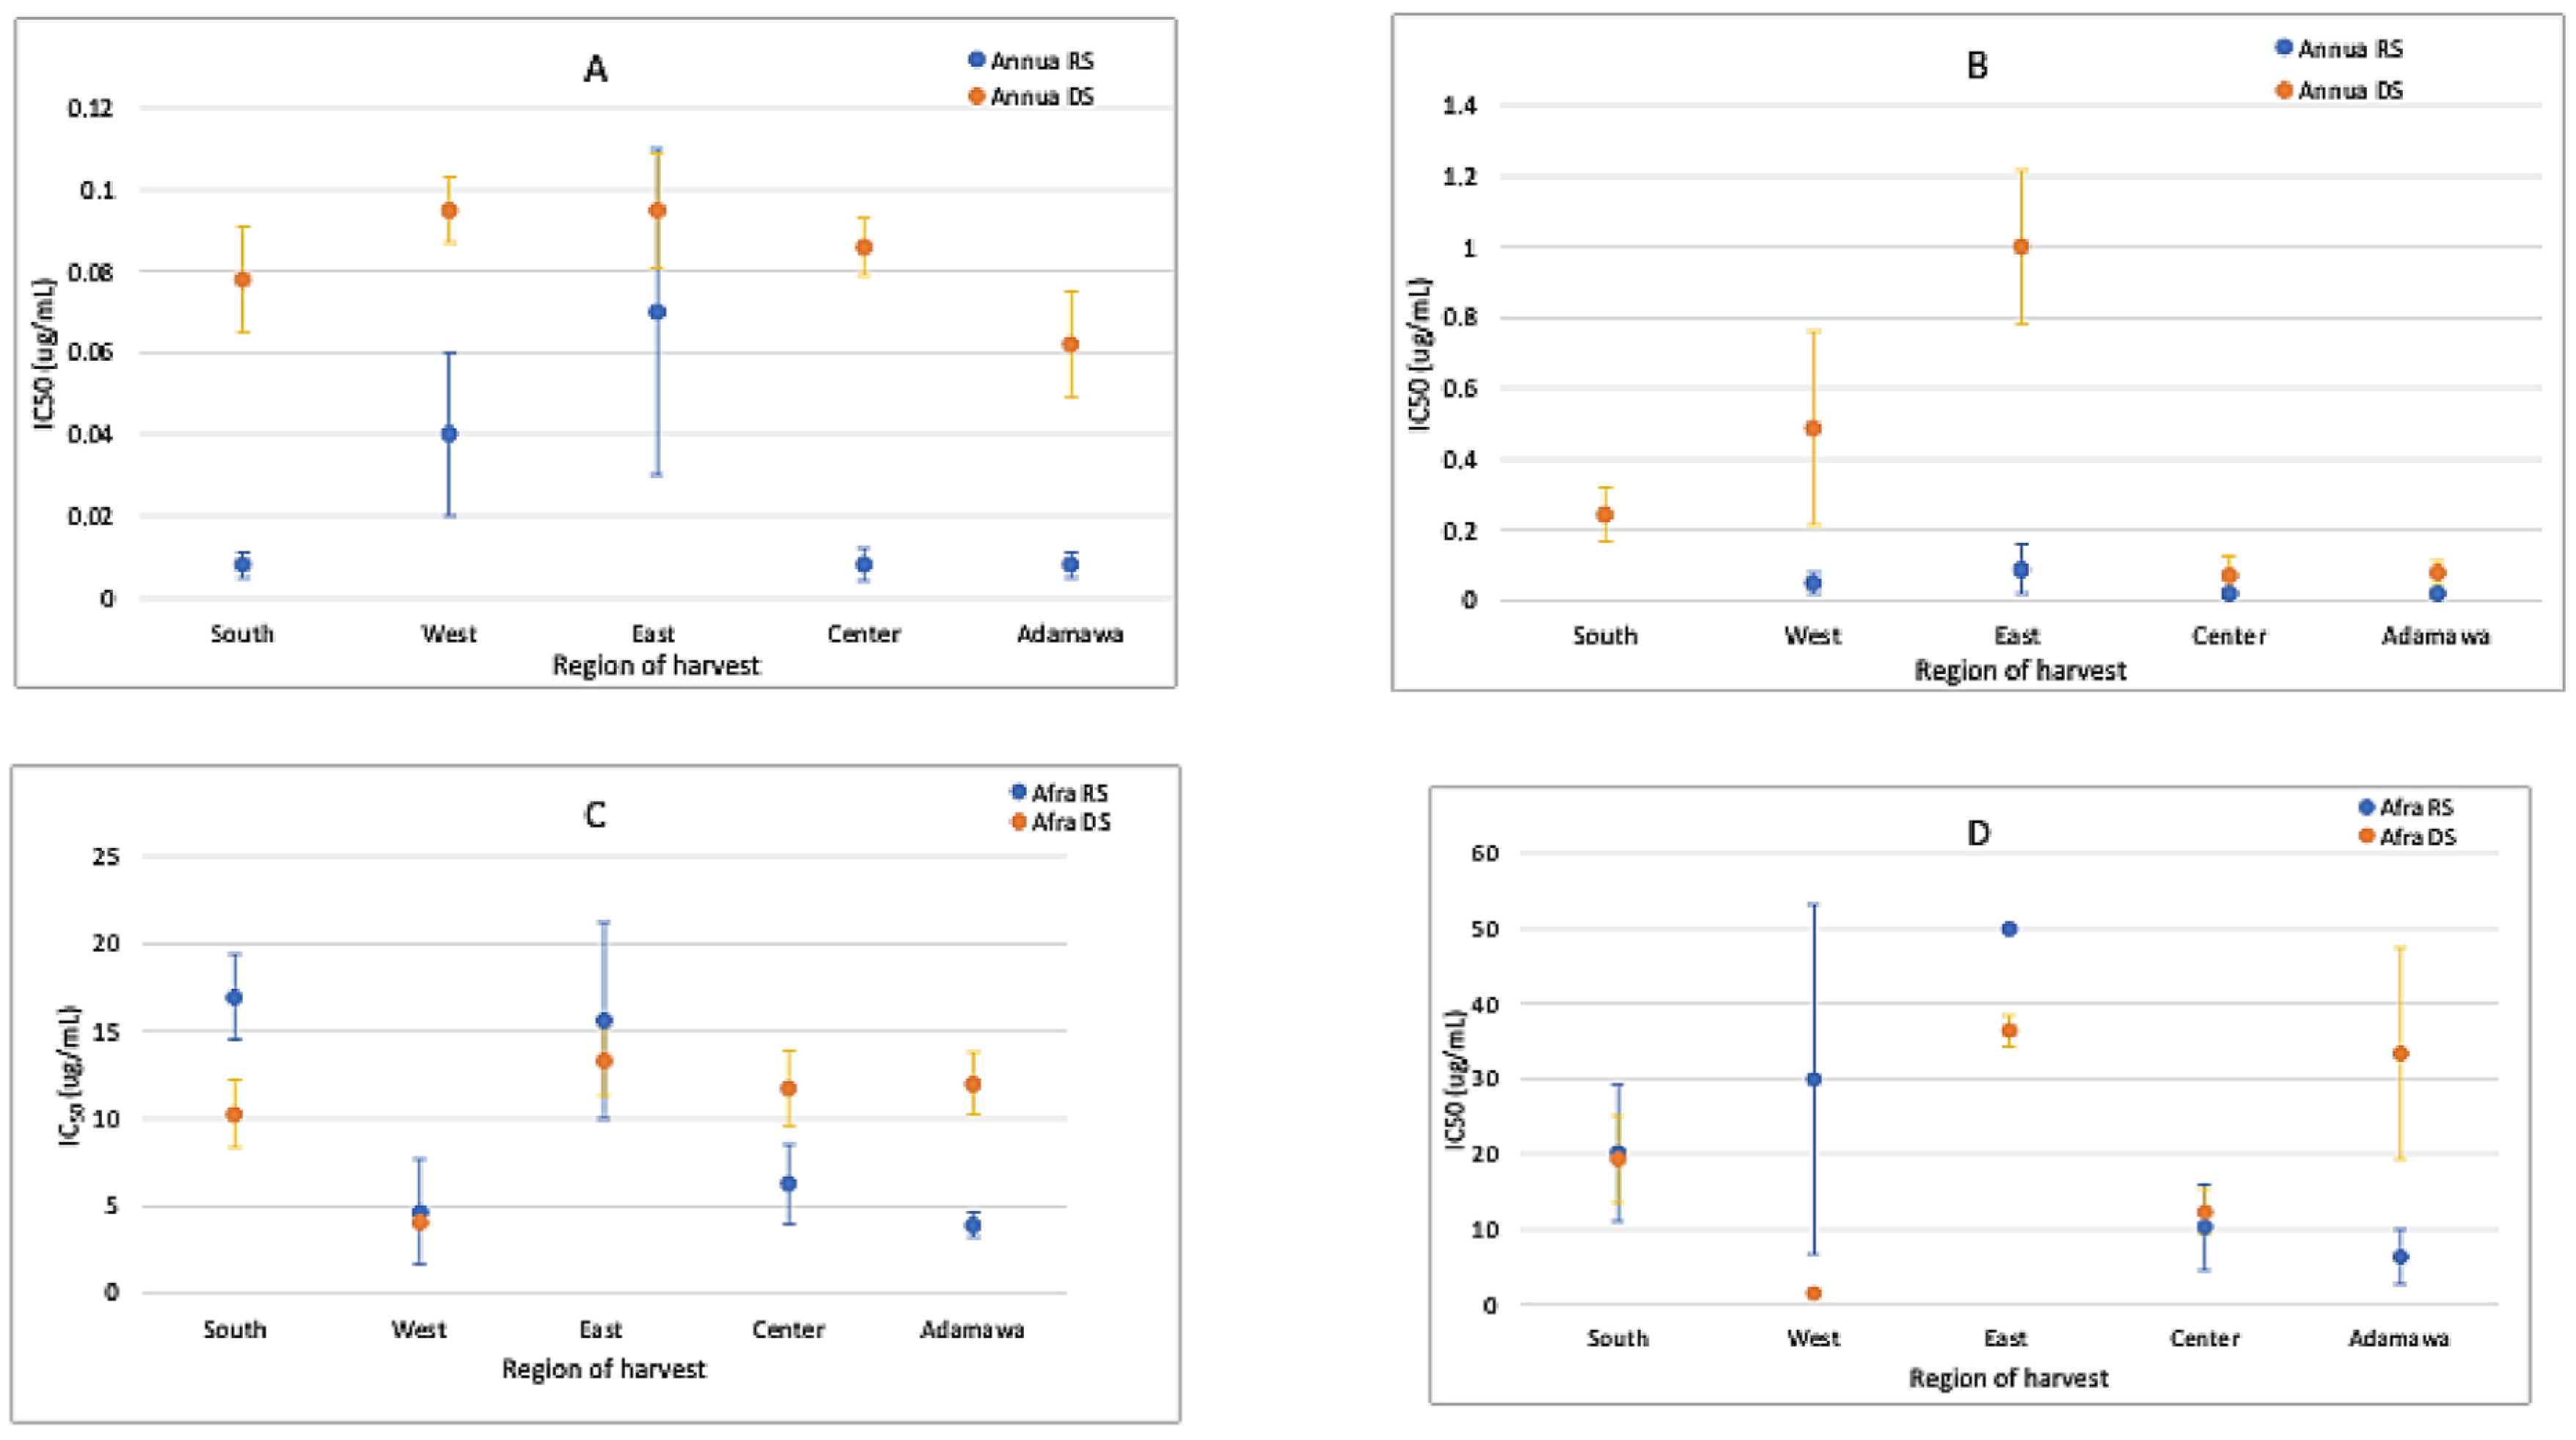
The anti-plasmodial activity of both plants was correlated with their metabolic fingerprints. Generally, the acetone extracts of both plants were more active than the methanol extracts (Figure 10). Both species were active against Plasmodium parasites. However, the A. annua extracts were more active than the A. afra extracts, with the activities fluctuating between samples from different regions and seasons. The rainy season samples of the A. annua extracts were more active than the dry season samples. This activity was artemisinin-dependent and related to the higher contents observed in the rainy season samples. The IC50 of artemisinin (standard drug) was 4.59 ± 1.15 ng/mL.
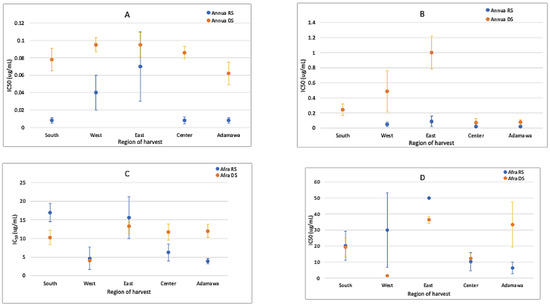
Figure 10.
IC50 values (μg/mL) for (A) acetone extracts of A. annua, (B) methanol extracts of A. annua, (C) acetone extracts of A. afra, and (D) methanol extracts of A. afra from different regions and seasons show that both plants are active, with A. annua being more active (about a thousand-fold) than A. afra. The activity variates between the different seasons and geographical location. RS = rainy season; DS = dry season.
2.7. Correlation Between Environmental Conditions and Anti-Plasmodial Properties
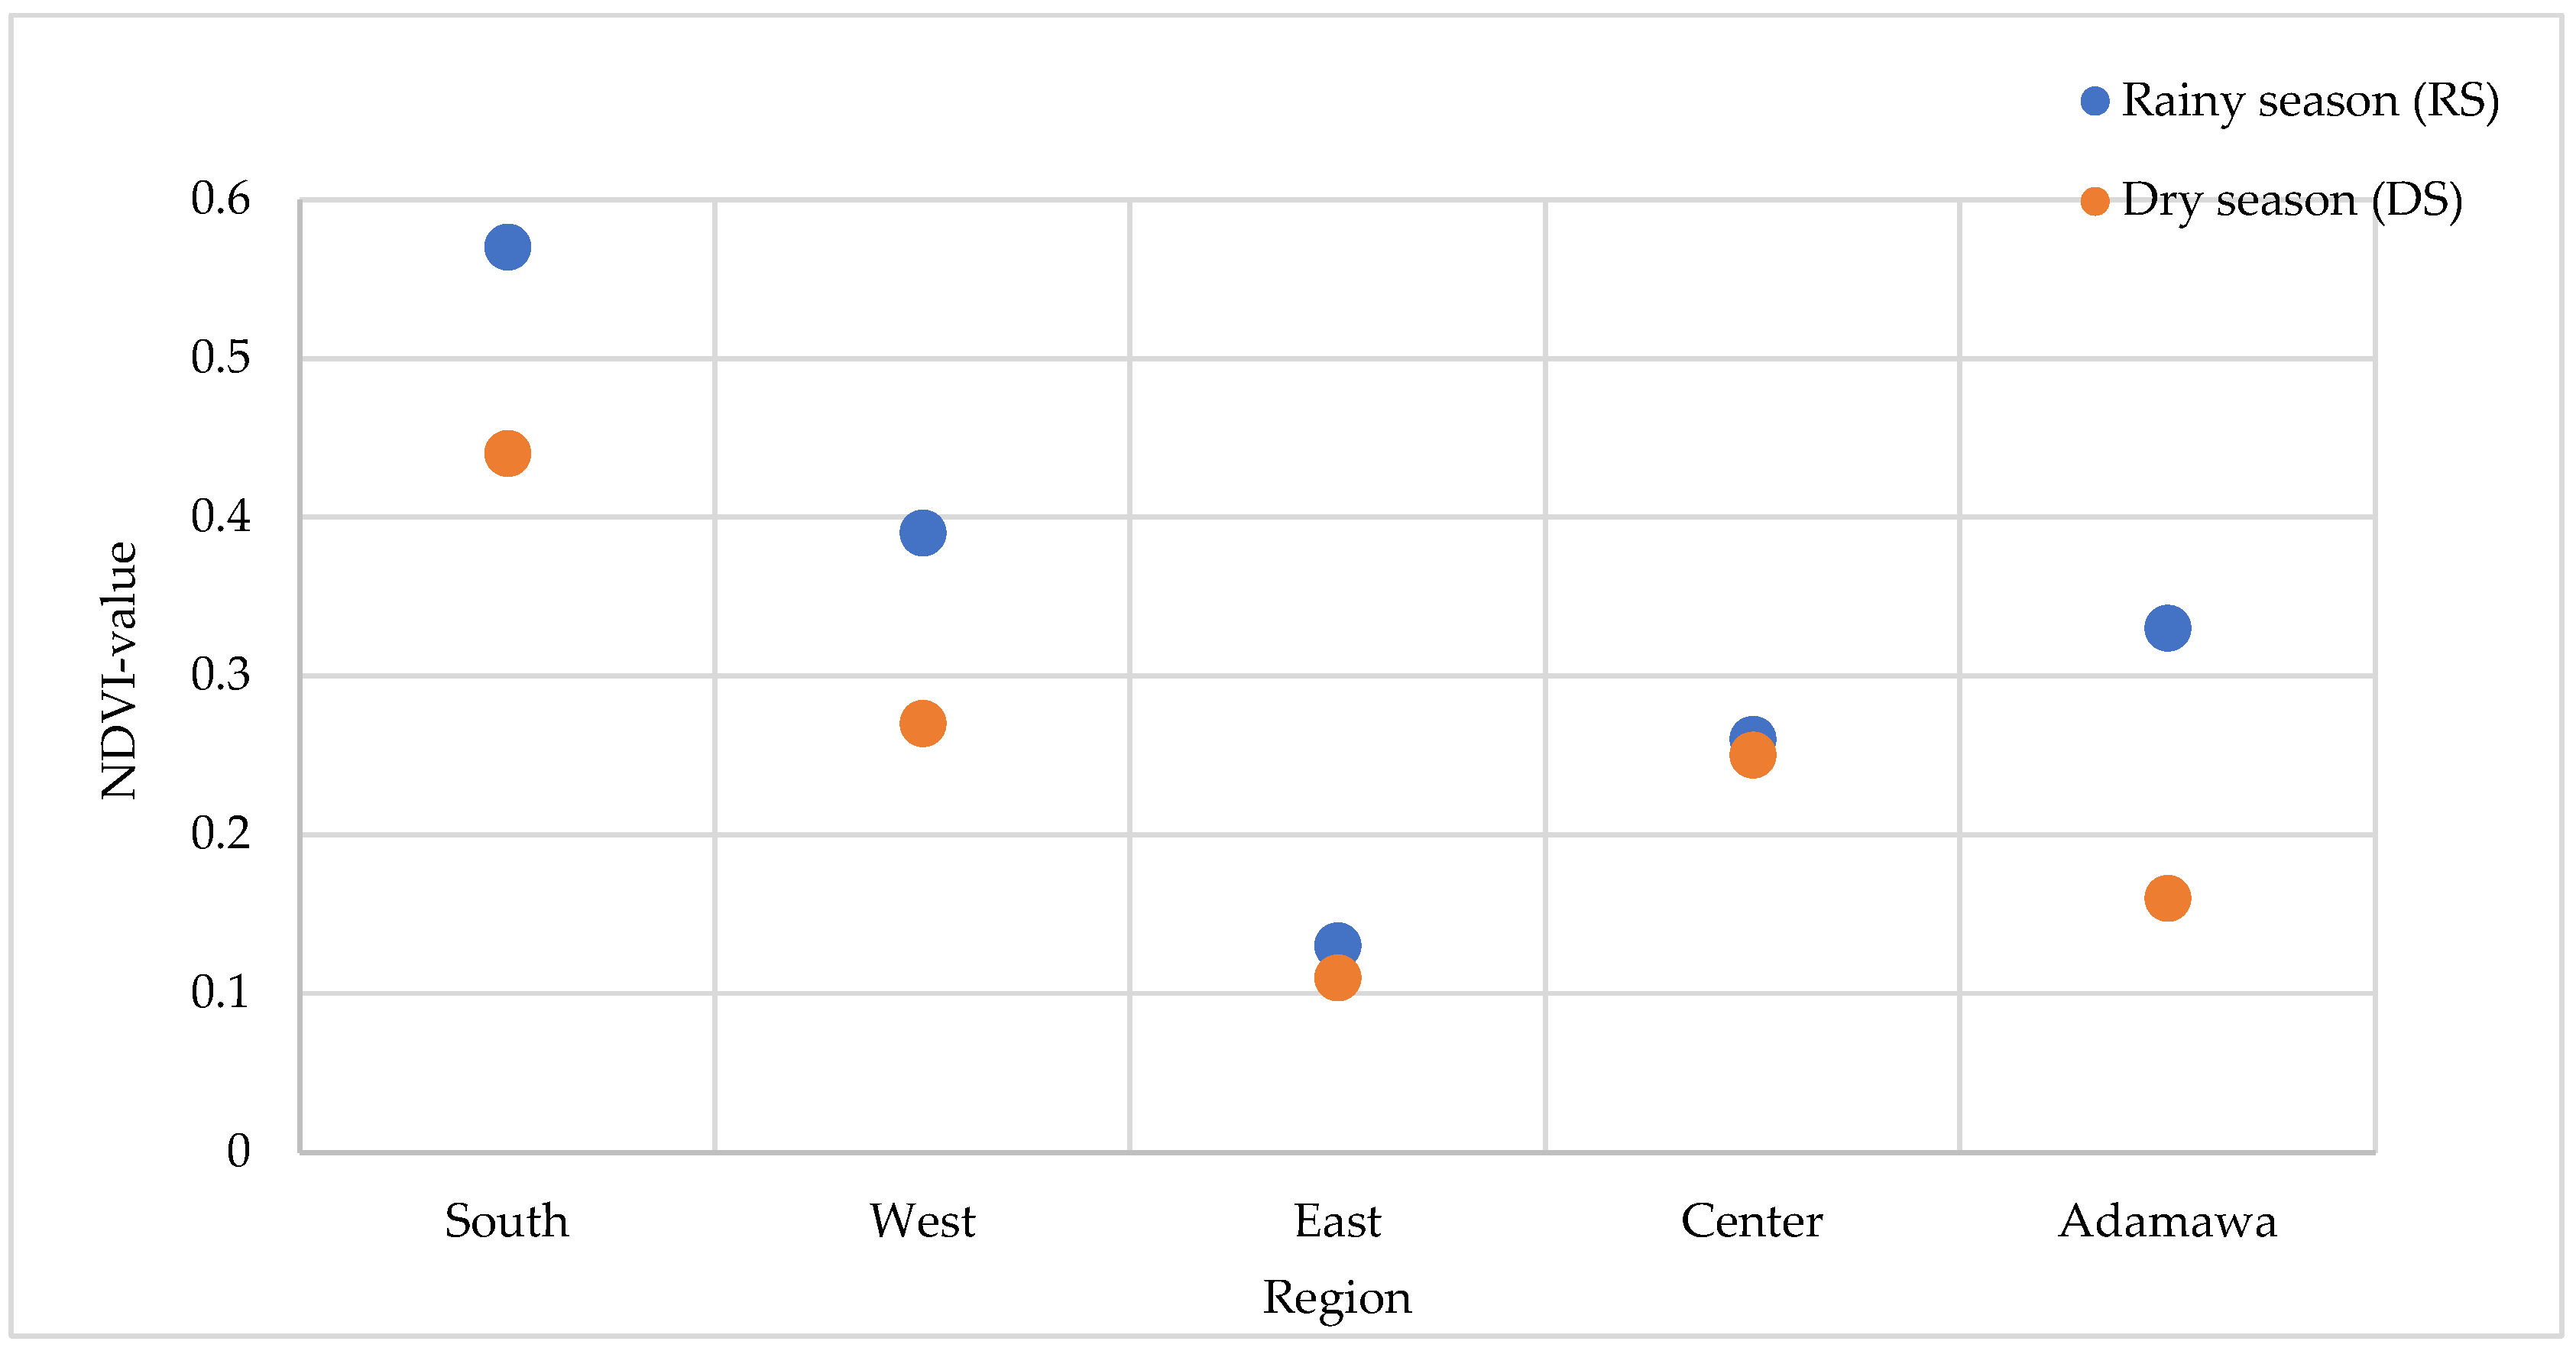
Anti-plasmodial activity was compared for both seasons with the health status of the environment from which the plants were collected. The Normalized Difference Vegetation Index (NDVI) values range from −1 to +1, and values closer to +1 indicate denser and healthier vegetation. For each season, the NDVI values of the collection points were calculated. The results displayed in Figure 11 indicate higher NDVI values during the rainy season regardless of the location of collection. This observation was, however, expected given that vegetation benefits from rainfall. A higher artemisinin content (trend) in the rainy season was associated with the stronger antimalaria activity for A. annua. For A. afra, its activity varied depending on the season and location of collection. The East collection point exhibited the lowest artemisinin content and had the least suitable vegetation environment, regardless of season.
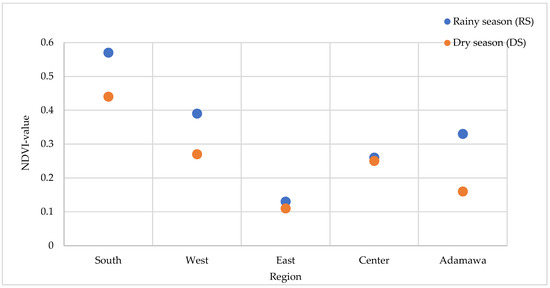
Figure 11.
Variation in the NDVI values at the five collection sites and seasons.
3. Discussion
Plants’ metabolic composition is greatly influenced by geographical location and season, thus directly affecting their potential therapeutic applications [18]. In Cameroon, like in other African countries, A. annua and A. afra are cultivated throughout several regions and formulated as herbal tea for the management of malaria. However, this is without any pharmacological quality control. This problem is further aggravated by the close morphological similarity between the two Artemisia species, making herbal tea’s authenticity problematic. This work focuses its attention on the phytochemical diversity of both species, aiming to discern potential variations in their phytochemical profiles attributable to geographic factors and seasons and correlated with potential pharmacological quality. Several analytical techniques, such as TLC, HPLC, and GC, were employed for the analysis of their metabolic contents, and by using both geographical and multispectral remote sensing data, correlations were made between the observed metabolic fingerprints and anti-plasmodial activity. The results from this study revealed notable variations in the phytochemical compositions of A. annua and A. afra among different geographical locations and seasons in Cameroon. These variations encompassed differences in the abundance of artemisinin and other secondary metabolites.
A. afra and A. annua crude extracts are composed of complex mixtures of secondary metabolites, with varying biological activities. The distinctions in the chemical patterns of the semi-volatile and polyphenol constituents observed using TLC, HPLC, and GC analyses between both species could serve as important tools for the correct identification of these medicinal products. For instance, the presence of rutin, astragalin, and luteolin in A. afra and their absence in A. annua, including the presence of the specific TLC bands in A. afra, could be used as a basis for the development of specific monographs for this plant species. Additionally, the TLC fingerprints show the presence of artemisinin specifically in A. annua. Intra-species variation in terms of the occurrence and relative composition of plant metabolites, especially in the semi-volatile components, result from the influence of different environmental factors, which vary between different regions and seasons.
Artemisinin is a is a well-known antimalaria compound with a sesquiterpene backbone originally isolated from A. annua [14]. Also, traces of artemisinin have been found in some cultivars of A. afra, while other cultivars show no detectable content [9,15]. In this study, traces of artemisinin were detected in some A. afra samples, while others were devoid of this sesquiterpene lactone. The high artemisinin content in the A. annua samples obtained during the rainy season indicates the seasonal influence on the metabolic pathways involved in the synthesis of artemisinin. The rainy season is the growing season during which most of the plant’s secondary metabolites are produced, resulting in alleviated concentrations. Regardless of the season, the artemisinin contents were high in the samples obtained from the Adamawa region, highlighting the effect of both season and geographical location on artemisinin content.
Three different sets of sample preparation were performed for the analysis of the total phenolic contents (TPCs): heating and reflux (using the protocol of the European Pharmacopoeia), methanol crude extracts, and infusion (the traditional preparation). The TPC was greatly influenced by the sample preparation. The highest TPC was retrieved in the methanol extract, followed by the method from the pharmacopoeia, while infusion showed the lowest content. This may be explained by the fact that methanol is a good extraction solvent for most of the polyphenolic components. The higher TPC in the extracts obtained through heating and reflux of the plant powder compared to that in the infusions may have been due to the longer contact time involved in using the former. From this finding, the TPCs, including the contents of CA, tend to be higher in dry season samples of A. afra (with the exception of the samples from the Center region), again indicating the seasonal influence.
The acetone and methanol crude extracts prepared from the plant samples obtained both in the rainy and dry seasons from the five geographical regions were tested against a chloroquine-sensitive 3D7 P. falciparum strain. Three independent experiments were conducted, and the mean IC50 values were calculated and expressed in μg extract/mL. Based on the World Health Organization’s guidelines [8], anti-plasmodial activity levels are classified as follows: highly active (IC50 ≤ 5 μg/mL), good activity (IC50 between 5 μg/mL and 15 μg/mL), moderate activity (IC50 between 15 μg/mL and 30 μg/mL), weak activity (IC50 between 30 μg/mL and 50 μg/mL), and a lack of activity at IC50 ≥ 50 μg/mL. The anti-plasmodial assays demonstrated varying degrees of efficacy in inhibiting Plasmodium parasites, with potential correlations with the distinct phytochemical profiles observed. The acetone extracts were more active than the methanol extracts. This may have been because of the higher artemisinin contents in the acetone extracts than that in the methanol extracts. Certain geographical locations exhibited higher anti-plasmodial activity, indicating a correlation between the phytochemical composition and anti-plasmodial properties. Both samples were active, but the A. annua extracts showed a significantly higher anti-plasmodial activity compared to that of A. afra. This activity was artemisinin-dependent and stronger in the rainy season samples, being associated with a high artemisinin content. Additionally, the samples from the Adamawa region showed the highest artemisinin contents and were, together with the A. annua samples from the South and the East, the most active ones. These three types of samples showed comparable IC50 values, though the latter yielded a lower artemisinin content. This indicates that the other components present in the extract also affect its anti-plasmodial activities. Again, this indicates the importance of geographical location and season when cultivating an Artemisia sp. for use as a preventive or curative therapeutical agent against malaria. However, WHO has cautioned against the use of non-pharmaceutical sources of artemisinin because of the risk of delivering sub-therapeutic doses, which could exacerbate resistance to ACTs [19], emphasizing the importance of species-specific differences. Despite the lack of relevant contents of artemisinin, A. afra showed promising activity against the Plasmodium parasites, suggesting its use without the above-mentioned threat to ACTs in emptying malaria reservoirs observed by WHO. The activity of A. afra was not affected by season or geographical location despite the relatively higher CA contents during the rainy season.
According to the findings of Ferreira et al. [20], the best growing conditions for Artemisia are a humid and subtropical monsoon climate with average temperatures of 17.6–28.4 °C. Despite the different collecting sites being characterized by a similar climate, the retrieved NDVI values indicate significant variations in the environmental conditions between them. As analyzed using both geographical and multispectral remote sensing data, the rainy season presented healthier vegetation, which favored the artemisinin contents responsible for the greater activity in A. annua from this time point than that harvested in the dry season.
4. Materials and Methods
4.1. Chemicals and Equipment
The reference substances used included artemisinin (Gibco, Fisher Scientific, Merelbeke, Belgium), 1, 8- cineole, α-thujone, β-thujone, rutin, chlorogenic acid, luteolin, astragalin, apigenin, caffeic acid, kaempferol, scopoletin, iso-chlorogenic acid, vitexin, fraxin, caftaric acid, 7-hydroxy coumaric acid, esculetin, quercetin, camphor, coumaric acid, and camphene (Merck, Darmstadt, Germany). The solvents applied—acetonitrile, methanol, formic acid, acetone, ethyl acetate, hexane, ethanol, and chloroform (Sigma-Aldrich, Overijse, Belgium)—were all HPLC-grade. Sulfuric acid, polyethylene glycol (PEG), vanillin powder, and diphenyl-borate diamino-ethanol (DPBAE) were obtained from Merck, Darmstadt, Germany.
4.2. Description and Collection of the Plant Material
Morphologically, both plants are similar in appearance, growing up to a height of at least 2 m. A. afra is a woody perennial herb with finely divided leaves that are oval and have an aromatic smell, are alternately arranged, and are silver-grey in the adaxial regions and light green in the axial regions [5]. A. annua is a large, annual, highly aromatic herb with a single stem covered with fine grey-green hairs and alternating aromatic leaves which are deeply dissected. The leaves and twigs of both plants were collected at the flowering stage from five regions (in both the rainy and dry seasons) in Cameroon: Ngaoundere in the Adamawa region (coordinates: 7.328 N, 13.585 E), Bertoua in the East region (coordinates: 4.579 N, 13.677 E), Sangmalema in the South region (coordinates: 2.937 N, 11.986 E), Bafia in the Center region (coordinates: 4.755 N, 11.224 E), and Dschang in the West region (coordinates: 5.446 N, 10.047 E). Voucher specimens were deposited at the Limbe botanical gardens, Cameroon. The samples were authenticated by a botanist and voucher numbers assigned (SCA 7137 and SCA 6340 for A. annua and A. afra, respectively).
4.3. Preparation of the Crude Extracts
Two groups of plant materials were experimented with: rainy and dry season samples comprising acetone and methanolic crude extracts of four groups of 40 plant samples (20 A. afra and 20 A. annua samples obtained from five regions). Extracts were prepared following the protocol described by Mbah et al. [21]. Briefly, each plant sample was oven-dried at 30 °C and ground into a fine powder, and each powder was divided into two equal masses and macerated at room temperature for 3 days using acetone or methanol. The macerated mixture was filtered through a funnel stuffed with Whatman filter paper No.1, and the filtrate was concentrated under a vacuum. Each crude extract was then dried and weighed and the yield calculated (Supplementary Table S2). All extracts were stored at 4 °C for subsequent use.
4.4. Thin-Layer Chromatography (TLC) Analysis
Analytical Thin-Layer Chromatography (TLC) of the extracts was performed on precoated Si gel 60 F254 (Merck, Hohenbrunn, Germany) plates to determine the chemical patterns of the compounds in the extracts. A solvent system comprising n-hexane/ethyl acetate (70:30) was used to separate the semi-volatile compounds in the acetone extracts. After development, the TLC plates were sprayed with sulfuric vanillin and heated for 10 min at 100 °C, and the separated components were visualized in daylight. Separation of the polyphenol fraction in the methanol extracts was achieved using a solvent system comprising ethyl acetate, methanol, water, and formic acid (50:4:4:2.5). After development, the results were visualized through DPBAE/PEG spraying (prepared by dissolving 10 g and 50 g of DPBAE and PEG, respectively, in 1 L of methanol) and 366 nm illumination (UV light). The retention factor (RF) of the separated components was calculated and compared with the reference compounds.
4.5. HPLC Analysis
High-Performance Liquid Chromatography (HPLC) analyses of the polyphenols were performed on an Agilent 1260 Infinity II system using a protocol developed in the laboratory (Pharmacognosy, CIRM, University of Liège, Belgium). Briefly, the extracts were reconstituted at a concentration of 40 mg/10 mL of methanol, sonicated for 2 × 15 min, and filtered through a 0.45 μm HPLC filter. A Luna PFP column (250 × 4.6 mm, 5 μm) was used, and the mobile phase consisted of a mixture of acetonitrile (A) and water/0.1% formic acid (B) in gradient conditions (A/B: 15/85, 18/82, 23/77, 30/70, 40/60, 50/50, 80/20, 100/0, 15/85, and 15/85 v/v). A volume of 10 μL was injected at a flow rate of 1 mL/min, and a run time of 87 min was set. A reference calibration curve consisting of chlorogenic acid (0.1, 0.05, 0.025, and 0.0125 mg/mL in methanol) was made. A Diode Array Detector (DAD) was used and set at 330 nm. The results were expressed as chlorogenic acid equivalents.
4.6. Analysis of Semi-Volatile Components Using GC
A Gas Chromatography (GC) analysis of the semi-volatile components was performed on an Agilent Technologies Intuvo-9000 GC System using a method developed in the laboratory. Briefly, 100 mg of the samples was weighed and injected using the head-space method. The column used was a DB-WAX-UI (60 m × 250 μm × 0.25 μm). The analytical conditions included an oven temperature programmed from 45 °C to 250 °C at a rate of 2.615 °C/min, and the vial and transfer line temperatures were set at 130 °C and 150 °C, respectively. The chromatogram ran for 120 min, and detection was performed using a Flame Ionization Detector (FID) with a detection temperature of 280 °C. Identification of the different constituents was based on a comparison of the retention times with those of the standard samples.
4.7. Quantification of Artemisinin Using the HPLC-UV Method and Derivatization
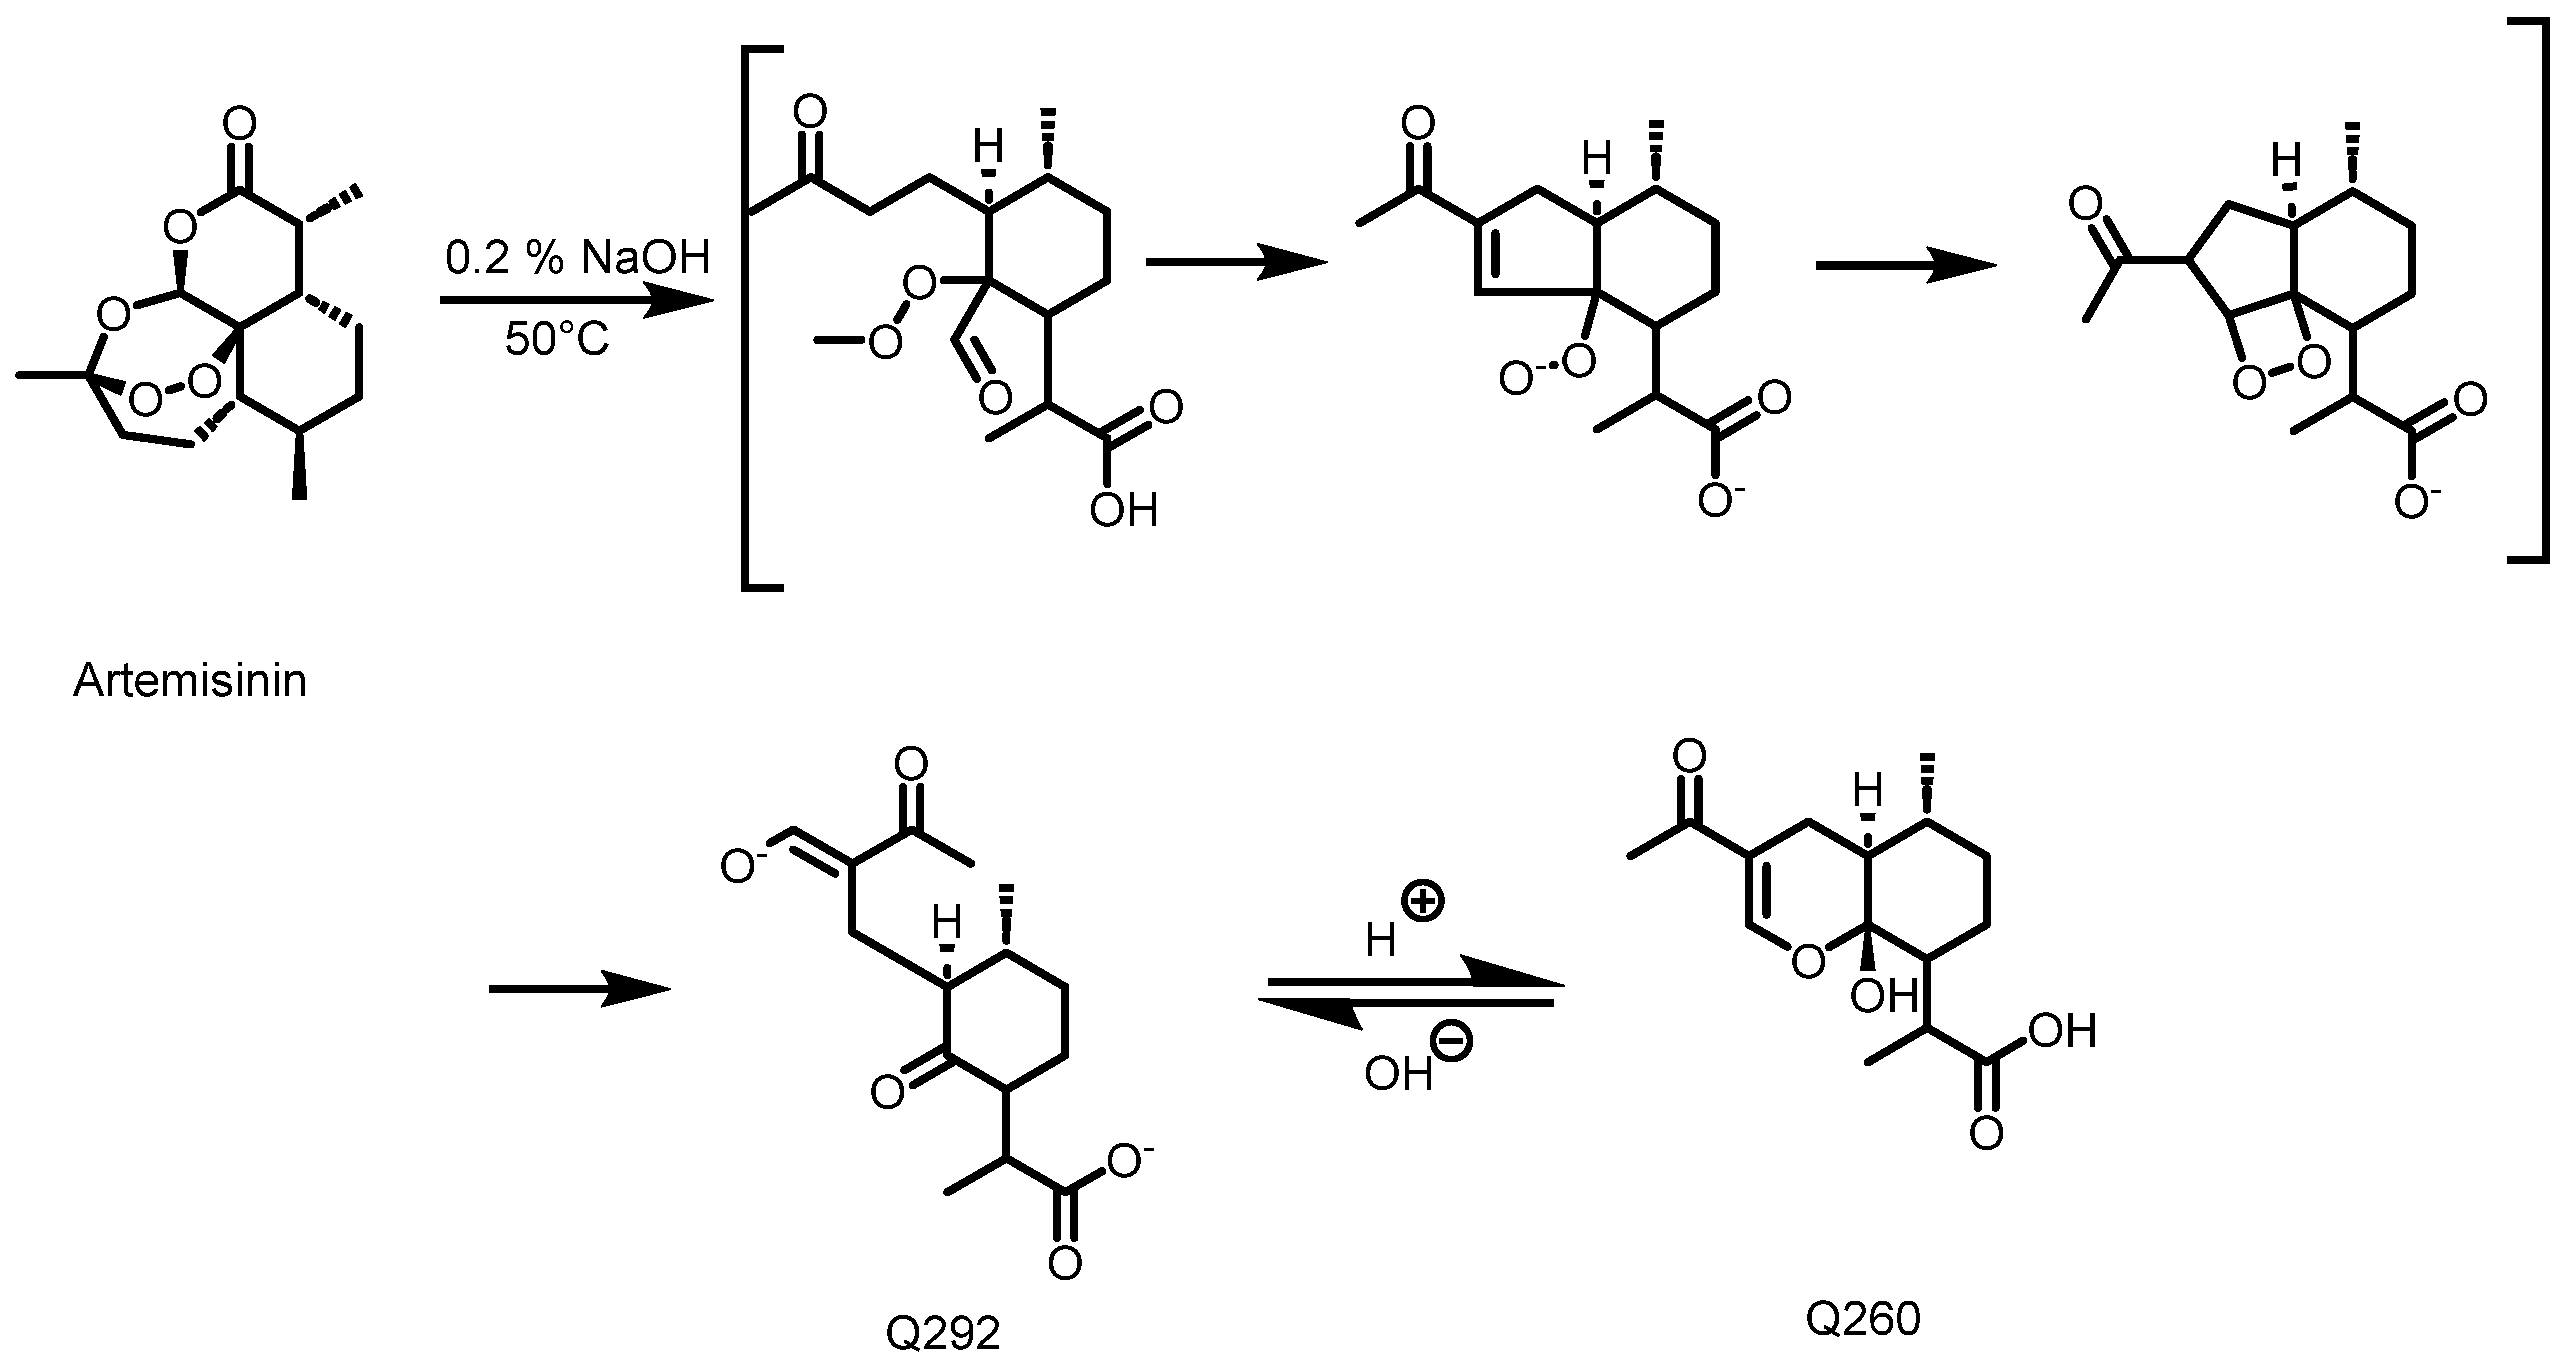
Detection and quantification of the artemisinin in the acetone and methanol crude extracts were performed using an HPLC-UV method after a pre-derivatization step, as described by Diawara et al. [22] and Zeyuan et al. [23]. Before the pre-derivatization step, 50 mg of crude extract was dissolved in 5 mL of ethanol and submitted to 2 × 15 min of ultrasonication. For all of the samples including the standards, 1 mL of solution was transferred into a 10 mL volumetric flask, followed by the addition of 4 mL solution of 0.2% (m/v) NaOH, leading to the formation of Q292 (Figure 12) after 30 min in a water bath at 50 °C. The mixture was cooled for 10 min, 1 mL of ethanol was added, and the flask was topped up to a mark (25 mL) with 0.2 N acetic acid, promoting the conversion of Q292 into Q260. Figure 2 illustrates the derivatization reaction which produces Q260, as detected at 260 nm following the HPLC analysis. All of the samples were filtered using a 0.45 μm HPLC filter, and chromatographic separation was performed in reverse phase mode. A mobile phase consisting of a mixture of methanol and phosphate buffer (5.0 mM; pH: 6.3) (45/55 v/v) was used. The Luna PFP column (250 × 4.6 mm, 5 μm) was maintained at 35 °C. An injection volume of 20 µL and a flow rate of 1 mL/min with a run time of 25 min were set as the chromatographic conditions. A calibration curve consisting of 10, 20, 40, and 60 mg/mL of artemisinin was used to estimate the quantity of artemisinin in each extract.
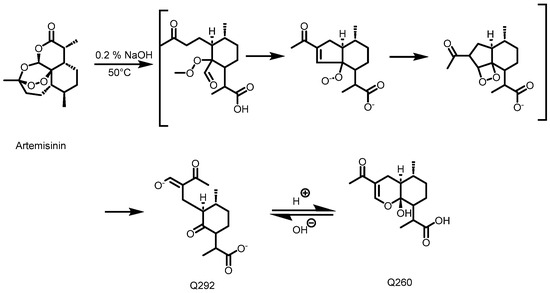
Figure 12.
Schematic diagram of artemisinin’s conversion into Q260 [23].
4.8. Quantification of Polyphenols
The total polyphenol contents (TPCs) in the plant powder, infusions, and plant extracts (methanol extracts) were determined spectrophotometrically using the method described in the European Pharmacopeia [15]. Briefly, 500 mg of plant powder was weighed in a round-bottomed flask, and 100 mL of water R was added. The flask was heated and refluxed for 30 min and then cooled under running water and filtered into a 100 mL volumetric flask. The infusions were prepared by adding 5 g of plant powder into 1 L of water and left to extract for 15 min. Stock solutions of the methanol crude extracts were prepared by dissolving 20 mg of crude extract in 10 mL of methanol and ultrasonicating them for 15 min.
For quantification, 2 mL of each solution was transferred into a 25 mL volumetric flask, and 1 mL of phosphomolybdotungstic reagent and 10 mL of water R were added and adjusted to 25 mL with a solution of sodium carbonate R. After 30 min in the dark, the absorbance was measured at 760 nm using a U-2900 spectrophotometer. Pyrogallol was used as a reference. A stock solution was prepared by dissolving 5.23 mg of pyrogallol in 100 mL of methanol and quantified as described above. The results were expressed as pyrogallol equivalents.
4.9. Anti-Plasmodial Activity
A chloroquine-sensitive 3D7 P. falciparum strain was obtained from the Malaria Research and Reference Reagent Resource Center, MR4, and maintained in vitro as described by Trager and Jensen [24]. The parasites were maintained at 3% hematocrit (human type A- or O-positive red blood cells) in a Complete Culture Medium (CCM) prepared by supplementing RPMI 1640 (Gibco, Fisher Scientific, Merelbeke, Belgium) medium containing NaHCO3 (32 mM), HEPES (25 mM), and L-glutamine with 10% heat-inactivated human plasma, 1.76 g/L of glucose (Sigma-Aldrich, Overijse, Belgium), 44 mg/mL of hypoxanthine (Sigma-Aldrich, Overijse, Belgium), and 100 mg/L of gentamycin (Gibco, Fisher Scientific, Merelbeke, Belgium). All of the cultures were placed in a humidified incubator at 37 °C with a standard gas mixture of 5% O2, 5% CO2, and 90% N2. Parasitemia was verified through microscopy using Giemsa-stained thin films. A stock solution of the crude extracts was prepared by dissolving 5 mg of extract in 1 mL DMSO and diluting it with culture media. The anti-plasmodial test was performed in 96-well microtiter plates at an initial sample concentration of 50 μg/mL which was serially diluted to eight concentrations (50 to 0.391 μg/mL). Each sample was tested in duplicate wells with the parasites at a final volume of 250 μL, making the final DMSO concentration <1%. Wells with parasites only served as the positive control, while the negative control consisted of wells with the culture medium only. A 1 μg/mL stock solution of artemisinin (Gibco, Fisher Scientific, Merelbeke, Belgium) was prepared and serially diluted as above; this was used as the standard. After 48 h of incubation, parasite growth was estimated through determination of the plasmodial lactate dehydrogenase activity, as described by Kenmogne et al. [25], and the IC50 values were calculated through linear regression. All tests were repeated at least twice.
4.10. Multispectral Satellite Imagery Analysis of the Health Status of Vegetation at the Collection Sites
The health status of the vegetation was monitored using Earth observation. The pair of Sentinel-2 satellites from the European Copernicus Programme (ECP) provides free images of the Earth’s entire surface at a spatial resolution from 10 to 60 m. Each Sentinel-2 satellite carries a Multispectral Instrument (MSI) that captures images in 13 spectra bands, covering the visible, near-infrared, and shortwave infrared regions (443–2323 nm). Multispectral remote sensing data are widely used for land and ocean monitoring using spectral indices. To assess the vegetation’s health and density, the Normalized Difference Vegetation Index (NDVI) was derived from the reflectance, i.e., the solar light reflected by the Earth’s surface, in the red and near-infrared (NIR) bands using the following formula:
NDVI = (NIR − Red)/(NIR + Red).
The NDVI values range from −1 to +1. Vegetation absorbs most visible light for photosynthesis (implying a low reflectance in red) and reflects a significant amount of near-infrared light (a high reflectance in NIR), leading to a positive NDVI. Denser and healthier vegetation presents an NDVI closer to +1. For each season, the NDVI values at the collection points were calculated using cloud-free Sentinel-2 images acquired on the dates closest to the collecting dates (Supplementary Table S1). Given the spatial resolution of Sentinel-2 images in the visible wavelengths (10 m), the NDVI was not retrieved at the plant level but at the level of the direct environment in which the plants grew.
5. Conclusions
The results show both intra-species and inter-species variations in the phytochemical constituents which fluctuate considerably with season and geographical region. The artemisinin content was found to be high in the rainy season for Artemisia annua, while the polyphenol contents and chlorogenic acid and its derivatives were high in the dry season for Artemisia afra. The observed variations may have relevant implications for the anti-plasmodial potential of these plants, with specific geographic factors influencing their chemical composition, and highlight the importance of quality control in herbal medicine. The findings suggest that the selection of a suitable Artemisia sample for use as a potential antimalarial treatment must take into consideration its geographical origin, the period of collection, season, and remote sensing data. By understanding the environmental factors that influence the phytochemical composition of Artemisia samples using remote sensing data, this study may provide an insight into how natural products can be more effectively used as a preventative or curative measure against malaria. Further research is warranted to elucidate the major compounds responsible for the observed anti-plasmodial activities in A. afra and the effect of post-harvest handling on its secondary metabolic contents.
Supplementary Materials
The following supporting information can be downloaded at https://www.mdpi.com/article/10.3390/molecules30030596/s1. Figure S1: Field pictures of (a) A. annua and (b) A. afra. Figure S2: TLC fingerprint: (a) Acetone extract of A. afra and A. annua obtained in the rainy season revealing variations in the terpene chemical composition. (b) Acetone extract of A. afra obtained from different regions showing similar chemical parttern of terpene composition, (c) Variation in polyphenol chemical pattern between both species (methanol extract of A. afra and A. annua) obtained in the rainy season, (d) Methanol extract of A. afra and A. annua obtained in the dry season revealing polyphenol chemical pattern. X = scopoletin, Y = artemisinin and Z = apigenin. Figure S3: Contents of ART in acetone and methanol extracts of samples from the Center and Adamawa regions. Figure S4: TPCs in the different methods of extract preparation (heating and reflux method proposed by European pharmacopoeia, tea infusion extract and methanol extracts. Table S1: List of the collected sites indicating the collection dates of the samples for both seasons and the dates of the closest sateniel-2-images used for inferring the NDVI. Table S2: Yield of plant extracts.
Author Contributions
Conceptualization, M.F. and L.M.S.; methodology and data curation, M.F., O.J., L.M.S., N.B., B.P., and E.H.; original draft preparation, L.M.S.; review and editing, O.J., O.B., K.D., L.M., A.R., A.L., S.F.N., B.S.E., B.P., G.E.L., and A.S.N.; grant-seeking and management, S.M.G. and J.S. All authors have read and agreed to the published version of the manuscript.
Funding
This research received funds from Académie de Recherche et d’Enseignement Supérieur (ARES-CCD), Rue Royale 180, 1000 Bruxelles, Belgium. Grant number: PRD-PFS 2020.
Institutional Review Board Statement
Not applicable.
Informed Consent Statement
Not applicable.
Data Availability Statement
Data are contained within the article and Supplementary Materials.
Acknowledgments
We would like to acknowledge Litonga Ndive Elias, the botanist at the Limbe botanical gardens, Cameroon, for authenticating the plant material and the technical assistance of Etienne Delpine at the Laboratory of Pharmacognosy, the Center for Interdisciplinary Research on Medicine (CIRM), the University of Liége, Belgium.
Conflicts of Interest
The authors declare no conflict of interest.
References
- World Health Organization (WHO). World Malaria Report 2022 [Internet]. 2023. Available online: https://www.wipo.int/amc/en/mediation/ (accessed on 13 November 2024).
- Eyong, E.M.; Etutu, S.J.M.; Jerome, F.C.; Nyasa, R.B.; Kwenti, T.E.; Moyeh, M.N. Plasmodium falciparum histidine-rich protein 2 and 3 gene deletion in the Mount Cameroon region (2022). IJID Reg. 2022, 3, 300. [Google Scholar]
- Newman, D.J.; Cragg, G.M. Natural Products as Sources of New Drugs over the Nearly Four Decades from 01/1981 to 09/2019. J. Nat. Prod. 2020, 83, 770–803. [Google Scholar] [CrossRef]
- Barbara, M.; Willem, S.; World Health Organization. The World Medicines Situation 2011: Access to Controlled Medicines; World Health Organization: Geneva, Switzerland, 2011; Available online: https://apps.who.int/iris/handle/10665/78334 (accessed on 10 November 2024).
- Van Wyk, B.E. The potential of South African plants in the development of new medicinal products. South Afr. J. Botany. 2011, 77, 812–829. [Google Scholar] [CrossRef]
- Klayman, D.L. Qinghaosu (Artemisinin): An Antimalarial Drug from China. Science 1985, 228, 1049–1055. [Google Scholar] [CrossRef] [PubMed]
- Ashraf, K.; Tajeri, S.; Arnold, C.-S.; Amanzougaghene, N.; Franetich, J.-F.; Vantaux, A.; Soulard, V.; Bordessoulles, M.; Cazals, G.; Bousema, T.; et al. Artemisinin-independent inhibitory activity of Artemisia sp. infusions against different Plasmodium stages including relapse-causing hypnozoites. Life Sci. Alliance 2022, 5, e202101237. Available online: https://www.life-science-alliance.org/content/5/3/e202101237 (accessed on 4 December 2024). [CrossRef]
- Jansen, O.; Tchinda, A.T.; Loua, J.; Esters, V.; Cieckiewicz, E.; Ledoux, A.; Toukam, P.D.; Angenot, L.; Tits, M.; Balde, A.M.; et al. Antiplasmodial activity of Mezoneuron benthamianum leaves and identification of its active constituents. J. Ethnopharmacol. 2017, 203, 20–26. [Google Scholar] [CrossRef]
- Snider, D.; Weathers, P.J. In vitro reduction of Plasmodium falciparum gametocytes: Artemisia spp. tea infusions vs. artemisinin. J. Ethnopharmacol. 2021, 268, 113638. [Google Scholar] [CrossRef]
- Liu, N.Q.; Van der Kooy, F.; Verpoorte, R. Artemisia afra: A potential flagship for African medicinal plants? South Afr. Bot. 2009, 75, 185–195. [Google Scholar] [CrossRef]
- du Toit, A.; van der Kooy, F. Artemisia afra, a controversial herbal remedy or a treasure trove of new drugs? J. Ethnopharmacol. 2019, 244, 112127. [Google Scholar] [CrossRef]
- Moyo, P.; Kunyane, P.; Selepe, M.A.; Eloff, J.N.; Niemand, J.; Louw, A.I.; Maharaj, V.J.; Birkholtz, L.-M. Bioassay-guided isolation and identification of gametocytocidal compounds from Artemisia afra (Asteraceae). Malar. J. 2019, 18, 65. Available online: https://malariajournal.biomedcentral.com/articles/10.1186/s12936-019-2694-1 (accessed on 9 October 2024). [CrossRef]
- Soni, R.; Shankar, G.; Mukhopadhyay, P.; Gupta, V. A concise review on Artemisia annua L.: A major source of diverse medicinal compounds. Ind. Crops Prod. 2022, 184, 115072. [Google Scholar] [CrossRef]
- Jeremić, D.; Jokić, A.; Behbud, A.; Stefanović, M. A new type of sesqiterpene lactone isolated from Artemisia annua L. arteannuin B. Tetrahedron Lett. 1973, 14, 3039–3042. [Google Scholar] [CrossRef]
- Shinyuy, L.M.; Loe, G.E.; Jansen, O.; Mamede, L.; Ledoux, A.; Noukimi, S.F.; Abenwie, S.N.; Ghogomu, S.M.; Souopgui, J.; Robert, A.; et al. Secondary Metabolites Isolated from Artemisia afra and Artemisia annua and Their Anti-Malarial, Anti-Inflammatory and Immunomodulating Properties—Pharmacokinetics and Pharmacodynamics: A Review. Metabolites 2023, 13, 613. [Google Scholar] [CrossRef] [PubMed]
- Yang, L.; Wen, K.S.; Ruan, X.; Zhao, Y.X.; Wei, F.; Wang, Q. Response of plant secondary metabolites to environmental factors. Molecules 2018, 23, 762. [Google Scholar] [CrossRef]
- Beck, H.E.; Zimmermann, N.E.; McVicar, T.R.; Vergopolan, N.; Berg, A.; Wood, E.F. Present and future Köppen-Geiger climate classification maps at 1-km resolution. Sci. Data 2018, 5, 180214. Available online: https://pubmed.ncbi.nlm.nih.gov/30375988/ (accessed on 6 November 2024). [CrossRef]
- Olivier, D.; van der Kooy, F.; Gerber, M. Geographical and seasonal phytochemical variation of Artemisia afra Jacq. ex Willd. Phytochem. Anal. 2023, 34, 175–185. Available online: https://onlinelibrary.wiley.com/doi/full/10.1002/pca.3191 (accessed on 10 September 2024). [CrossRef]
- WHO. The Use of Non-Pharmaceutical Forms of Artemisia Global Malaria Programme; WHO: Geneva, Switzerland, 2019. [Google Scholar]
- Ferreira, J.F.S.; Janick, J. Production and detection of artemisinin from Artemisia annua. Acta Hortic. 1995, 41–50. [Google Scholar] [CrossRef]
- Mbah, J.A.; Ngemenya, M.N.; Abawah, A.L.; Babiaka, S.B.; Nubed, L.N.; Nyongbela, K.D.; Lemuh, N.D.; Efange, S.M. Bioassay-guided discovery of antibacterial agents: In vitro screening of Peperomia vulcanica, Peperomia fernandopoioana and Scleria striatinux. Ann. Clin. Microbiol. Antimicrob. 2012, 11, 10. [Google Scholar] [CrossRef]
- Diawara, H.Z.; Gbaguidi, F.; Evrard, B.; Leclercq, J.Q.; Moudachirou, M.; Debrus, B.; Hubert, P.; Rozet, E. Validation, transfer and measurement uncertainty estimation of an HPLC-UV method for the quantification of artemisinin in hydro alcoholic extracts of Artemisia annua L. J. Pharm. Biomed. Anal. 2011, 56, 7–15. [Google Scholar] [CrossRef]
- Zeyuan, L.; Yulin, W.; Meiyi, Z. Artemisinin Chemical Research. In Artemisinin-Based and Other Antimalarials: Detailed Account of Studies by Chinese Scientists Who Discovered and Developed Them; Elsevier Inc.: Amsterdam, The Netherlands, 2018; pp. 129–175. [Google Scholar]
- Trager, W.; Jensen, J.B. Human Malaria Parasites in Continuous Culture. Science 1976, 193, 673–675. [Google Scholar] [CrossRef]
- Kenmogne, M.; Prost, E.; Harakat, D.; Jacquier, M.J.; Frédérich, M.; Sondengam, L.B.; Zèches, M.; Waffo-Téguo, P. Five labdane diterpenoids from the seeds of Aframomum zambesiacum. Phytochemistry 2006, 67, 433–438. [Google Scholar] [CrossRef]
Disclaimer/Publisher’s Note: The statements, opinions and data contained in all publications are solely those of the individual author(s) and contributor(s) and not of MDPI and/or the editor(s). MDPI and/or the editor(s) disclaim responsibility for any injury to people or property resulting from any ideas, methods, instructions or products referred to in the content. |
© 2025 by the authors. Licensee MDPI, Basel, Switzerland. This article is an open access article distributed under the terms and conditions of the Creative Commons Attribution (CC BY) license (https://creativecommons.org/licenses/by/4.0/).

