Article

Research on Hydrogen Production from Ammonia Decomposition by Pulsed Plasma Catalysis

1
School of Automobile and Traffic Engineering, Wuhan University of Science and Technology, Wuhan 430081, China
2
School of Automotive Engineering, Hubei University of Automotive Technology, Shiyan 442002, China
3
Key Laboratory of Automotive Power Train and Electronics (Hubei University of Automotive Technology), Shiyan 442002, China
*
Authors to whom correspondence should be addressed.
Molecules 2025, 30(5), 1054; https://doi.org/10.3390/molecules30051054
Submission received: 23 January 2025 / Revised: 21 February 2025 / Accepted: 24 February 2025 / Published: 25 February 2025

Abstract

:
Driven by dual-carbon targets, marine engines are accelerating their transition towards low-carbon and zero-carbon. Ammonium–hydrogen fusion fuel is considered to be one of the most promising fuels for ship decarbonization. Using non-thermal plasma (NTP) catalytic ammonia on-line hydrogen production technology to achieve hydrogen supply is one of the most important means to guarantee the safety and effectiveness of hydrogen energy in the storage and transportation process. However, the efficiency of ammonia catalytic hydrogen production can be influenced to some extent by the presence of several factors, and the reaction mechanism is complex under the conditions of ship engine temperature emissions. This makes it difficult to realize the precise control of plasma catalytic hydrogen production from ammonia technology under temperature emission conditions, thus restricting an improvement in the ammonia conversion rate. In this study, a kinetic model of hydrogen production from ammonia catalyzed by NTP was established. The influencing factors (reaction temperature, pressure, N2/NH3 ratio in the feed gas) and mechanism path of hydrogen production from ammonia decomposition were explored. The results show that the increase in reaction temperature will lead to an increase in the ammonia conversion rate, while the ammonia conversion rate will decrease with the increase in reaction pressure and N2/NH3 ratio. When the reaction temperature is 300 K, the pressure is 1 bar, the feed gas is 98%N2/2%NH3, and the ammonia conversion rate is 16.7%. The reason why the addition of N2 is conducive to the hydrogen production from NH3 decomposition is that the reaction N2(A3) + NH3 => N2 + NH2 + H, triggered by the electron excited-state N2(A3), is the main reaction for NH3 decomposition.

Graphical Abstract

1. Introduction

In recent years, the issue of global climate change has become increasingly severe, and greenhouse gas emissions have become a focal point of international concern. According to a report by the International Maritime Organization (IMO), the shipping industry is one of the significant sources of global carbon emissions, accounting for 6% to 11% of the total emissions in the transportation sector [1]. As the world’s largest shipbuilding and ship-using country, China bears important responsibilities in promoting the green and low-carbon transformation of ships. Hubei Province, situated in the “waist of the Yangtze River”, is the core region of the Yangtze River Economic Belt, boasting a well-developed shipping industry [2]. Based on the Statistical Bulletin of Hubei Province’s National Economic and Social Development, the cargo throughput of ports in the province has been increasing year by year (as shown in Figure 1). In 2023, the total cargo throughput of ports in the province reached 690 million tons, representing a year-on-year increase of 22.8%. The container throughput of ports was 3.298 million twenty-foot equivalent units (TEUs), showing a year-on-year increase of 5.5% [3]. To respond to China’s “dual-carbon” strategy and achieve the carbon emission reduction targets outlined in Hubei Province’s 14th Five-Year Plan, promoting ship decarbonization has become of particular significance. Among various measures, the adoption of clean power fuels is an effective solution.
At present, ammonia (NH3) and hydrogen (H2) are two clean fuels that have drawn significant attention. They are harmless to the environment after complete combustion [4,5,6]. However, the combustion of ammonia presents several challenges, such as slow combustion speed, high auto-ignition temperature, and narrow flammability limits [7,8,9]. Therefore, ammonia is usually used in combination with hydrogen to improve the combustion characteristics of the fuel. For example, Lhuillier et al. [10] found that adding 15% hydrogen to ammonia fuel can significantly shorten the start-up time. The research by Wang et al. [4] also indicated that incorporating hydrogen into ammonia can remarkably enhance the combustion performance of ammonia. These studies have demonstrated the feasibility of ammonia–hydrogen blended fuels in marine engines. There are mainly two ways to supply hydrogen on ships [11]. One is to pre-store hydrogen through hydrogen storage technologies. The other is to adopt on-line ammonia cracking for hydrogen production technology, which means decomposing hydrogen in real time during the operation of the ship. Although hydrogen storage technologies can provide a stable supply of hydrogen, their safety concerns and high transportation costs limit large-scale applications [12]. In contrast, the on-line ammonia cracking for hydrogen production technology can accurately adjust the hydrogen production according to the actual needs of the ship, avoiding the high risks and costs associated with traditional hydrogen storage [13]. This technology not only improves the conversion rate of ammonia but also provides a new solution for the green transformation of ships. At present, the ammonia cracking for hydrogen production technology is developing in a diversified manner, covering various technical routes such as thermal catalysis [14,15,16], electrocatalysis [17], photocatalysis [18], the non-thermal plasma method [19], and the non-thermal plasma catalysis method [20]. Among them, the non-thermal plasma catalysis method, as an emerging technology, has gradually attracted the attention of researchers [21,22,23]. It has the advantages of high efficiency, low cost, and mild operating conditions.
In view of this, the non-thermal plasma catalysis method can realize on-line hydrogen production by NH3 decomposition under mild conditions. However, for marine ammonia engines, there are still some challenges when using the waste heat of their exhaust gas to provide energy for the on-line hydrogen production technology of plasma-catalytic ammonia decomposition. Firstly, the exhaust gas temperature conditions of marine engines fluctuate due to various factors such as the navigation state and load changes, requiring the ammonia decomposition hydrogen production system to have a high degree of temperature adaptability and rapid response ability [24]. How to accurately regulate the reaction conditions (such as reaction temperature and pressure) of ammonia decomposition for hydrogen production to further improve the ammonia conversion rate has become a key bottleneck restricting the wide application of this technology [25,26]. In synergistic ammonia decomposition for hydrogen production by non-thermal plasma and catalyst, the improvement in the ammonia conversion rate directly affects the overall energy efficiency and emission performance of marine ammonia engines [27]. On the other hand, the ratio of different feed gases, especially the ratio of NH3 to other gases (such as N2), directly affects the ammonia conversion efficiency and hydrogen production of the non-thermal plasma catalytic reaction. The composition change in the feed gas may change the characteristics of plasma discharge, thus affecting the reaction mechanism. Therefore, the optimization of its reaction process parameters is a key issue that needs to be solved urgently. In addition, further research should also focus on the in-depth analysis of the reaction mechanism, including sensitivity analysis and reaction path analysis. Sensitivity analysis can reveal the sensitivity of each reaction parameter to the ammonia conversion rate, helping to optimize the reaction conditions and catalyst design. Reaction path analysis helps to clarify the detailed reaction path of ammonia decomposition under non-thermal plasma catalysis, providing a more comprehensive understanding from the initial excitation of the reaction to the final hydrogen generation process, thus guiding the regulation of the reaction system in practical applications.
In summary, this study employed a zero-dimensional plasma modeling approach to establish a numerical model for non-thermal plasma-catalyzed ammonia-to-hydrogen production. Additionally, the influencing factors (reaction temperature, pressure, and the ratio of N2/NH3 in the feed gas) and reaction mechanism pathways of the on-line ammonia-to-hydrogen production reaction in marine engines were analyzed.

2. Plasma Reaction Kinetics Modeling

The interactions between active particles such as energetic electrons, ions, and radicals in nanosecond-pulsed discharge (NPD) plasma and NH3 molecules involve multiple reaction steps and intermediate products. The evolution characteristics of these steps and products over time are difficult to directly observe and measure through experiments [28]. Most importantly, when a catalyst is introduced, the plasma and the catalyst are in the same region of the same reactor, and a synergetic effect will occur between them [28], which further increases the complexity of the reaction. Therefore, a zero-dimensional plasma chemical model was established using the ZDPlasKin solver [29]. (In the model, it is assumed that the gas temperature remains constant throughout the reaction process, with the energy released or absorbed during the reaction being neglected. Unless otherwise specified, the gas temperature is set at 300 K.) Starting from the complex reaction system, this model reveals the chemical process of the NPD plasma-catalyzed ammonia-to-hydrogen reaction and optimizes its process parameters.

2.1. Nanosecond-Pulsed Plasma Model

2.1.1. Chemical Composition

The feed gas input to the model is N2/NH3, and the model includes two types of chemical reactions: gas-phase reactions and surface reactions (see Figure 2). Gas-phase reactions involve inelastic collisions between high-energy electrons and feed gas molecules (NH3, N2) in a nanosecond pulse discharge plasma environment, generating a series of highly reactive species. These reactive species, such as excited-state molecules, free radicals, and other intermediates, undergo further reactions in the gas phase, ultimately producing H2 [28]. Surface reactions involve the adsorption of feed gas molecules (NH3, N2) onto the catalyst surface, where they interact with active sites and subsequently react to form H2 [30]. Therefore, the zero-dimensional plasma dynamics model includes ground-state and excited-state N2 and H2 molecules and N and H atoms, as well as corresponding free radicals, ions, and surface-adsorbed species, as detailed in Table 1.

2.1.2. Reaction Mechanism

If one wants to solve for the time-evolution characteristics of various particles during the ammonia decomposition for hydrogen production through the NPD plasma chemical model composed of the reaction mechanisms of plasma and catalyst, it is necessary to first calculate the reaction rate coefficients involved in its reaction mechanism [31]. Firstly, the reaction rate coefficients for the electron collision reactions are obtained by the Bolsig+ solver [32] according to the Boltzmann equation, combined with the electron collision cross-section data and electron energy; the specific contents are shown in Table 2. In addition to these, the model also takes into account reaction types such as charge exchange, Penning ionization, ion–ion recombination, electron–ion recombination, electron–ion dissociative recombination, wall-collision relaxation, three-body reactions, vibration-translation (V-T) relaxation, vibration-vibration (V-V) energy exchange, surface adsorption, and dissociation [28,31]. Among them, the rate coefficients for V-V and V-T relaxation reactions can be determined using the calculation formulae for kVV and kVT as proposed in reference [33] (for detailed formulae, please refer to reference [33]). The rate coefficients of wall-collision relaxation and surface reactions are obtained by calculating the wall-collision probability and the sticking probability. The specific calculation details can be found in published research [33,34,35]. However, due to the lack of sticking probabilities for each reaction mechanism of gas-phase particles on the catalyst surface [36], the metal Fe catalysts are described in this study without special emphasis. Generally speaking, the plasma-catalyzed reaction mechanism for ammonia-to-hydrogen production is a detailed and complex reaction set, covering up to 47 different species and 490 elementary reactions. These species and reactions together form the core framework of the plasma kinetics mechanism, providing a solid foundation for in-depth exploration and understanding of the plasma-assisted ammonia decomposition process for hydrogen production.

3. Results and Discussion

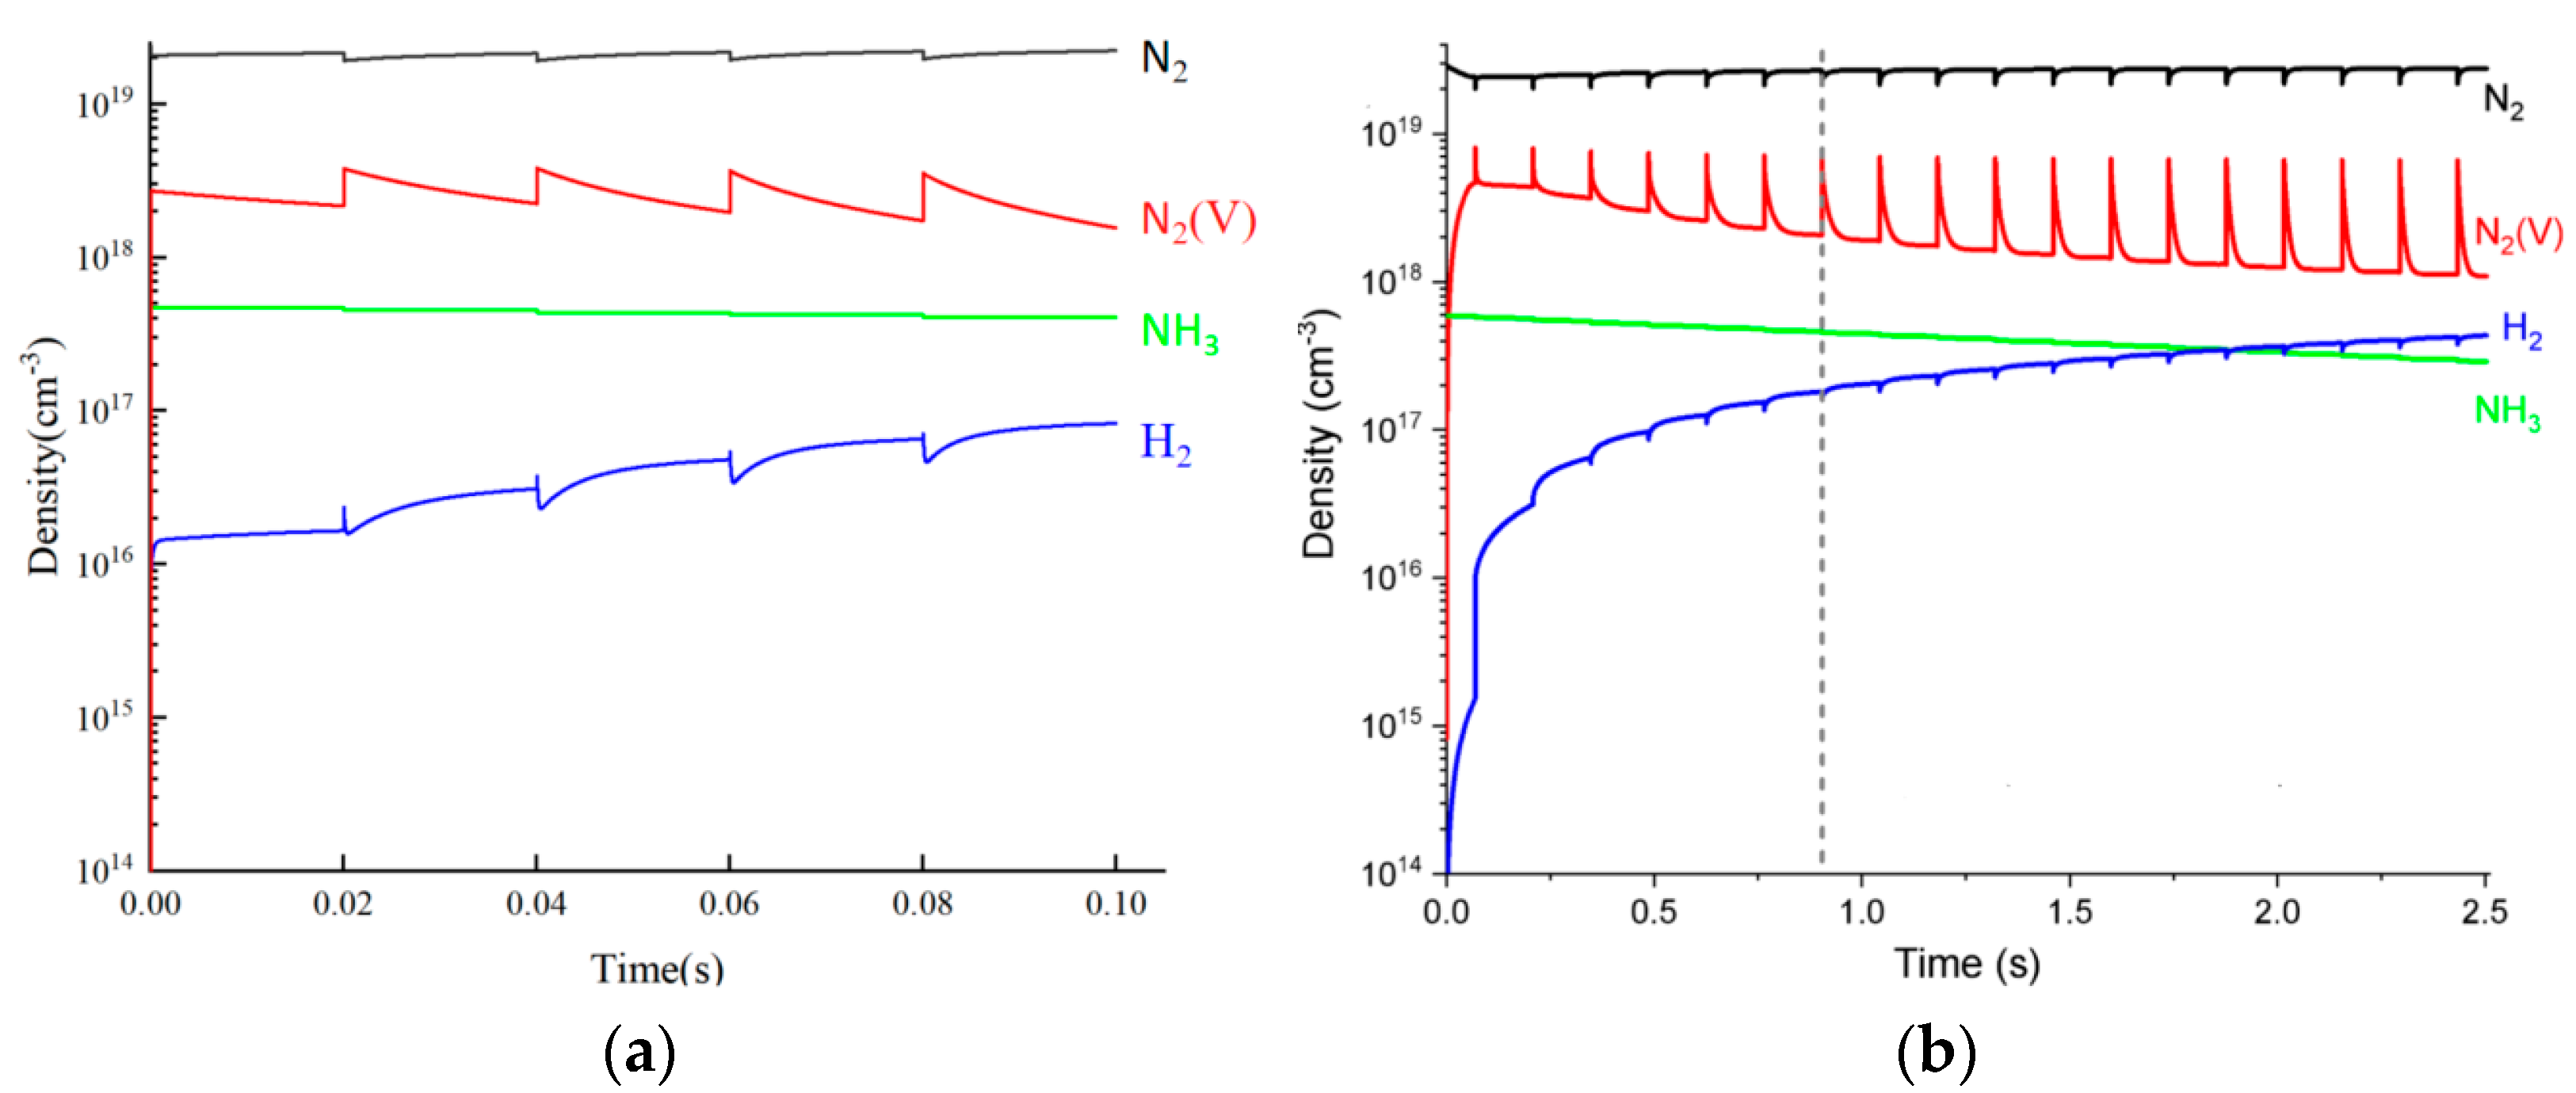
3.1. Model Verification

Ammonia decomposition and ammonia synthesis are reversible reactions. Based on the plasma ammonia synthesis reaction mechanism of Veer et al. [34], and due to the lack of electron collision cross-section data for the reactions e + NH3 => e + NH2 + H and e + NH3 => e + NH + H in the existing database, they were replaced by the electron collision cross-section data of the reactions e + NH3 => e + NH3(e1) and e + NH3 => e + NH3(e2), respectively [31,38]. The purpose of this is to fill in the lack of NH3 electron reaction data in the mechanistic model, thus further refining the mechanistic model. The NPD plasma-catalyzed ammonia decomposition reaction for hydrogen production involves hundreds of reaction steps, and the calculation step size must be very small (≤1 × 10⁻¹⁰ s). Therefore, the calculation time was reduced, and the evolution characteristics of the particle number density within 0.1 s were verified, as shown in Figure 3. Figure 3a,b show the calculation results of the research model and the plasma-catalyzed ammonia decomposition model of Andersen et al. [36], respectively.

3.2. Analysis of Influencing Factors

3.2.1. Reaction Temperature

The reaction process of ammonia synthesis is an exothermic process. As its reverse reaction, ammonia decomposition is an endothermic process. Therefore, as one of the important characterization parameters, the gas temperature plays a crucial regulatory role in NPD plasma-catalyzed ammonia decomposition (Figure 4). It not only affects the activity of the catalyst but also influences the plasma discharge characteristics, thereby changing the efficiency of ammonia-to-hydrogen production, as shown in Figure 4a. More specifically, the conversion rate of NH3 and the density of H2 show an increasing trend with the rise in the reaction temperature. This is because ammonia decomposition is an endothermic reaction, and an increase in temperature is beneficial for the shift in the equilibrium and promotes the production of H2 from NH3. Figure 4b shows the reaction yields of the gas-phase and surface reactions that mainly produce H2. The corresponding reaction equations are shown in Table 3. In the gas-phase reactions, the reaction yields of most reactions increase to varying degrees with the increase in temperature. In the surface reactions, the reaction yield of R-488 doubles in the range of 300–400 K, which means that at high temperatures, the activity of the catalyst is enhanced and H2 is more easily desorbed [39]. However, when the temperature rises from 400 K to 700 K, the reaction yield of R-488 shows a downward trend. This may be because the activity of particles in the ammonia-to-hydrogen reaction continuously increases with the rise in temperature, which leads to an increasing number of other particles competing with H(s) adsorbed on the active sites of the catalyst, thus resulting in a decrease in the reaction yield of R-488. Therefore, appropriately increasing the temperature is beneficial for the progress of the ammonia decomposition reaction.

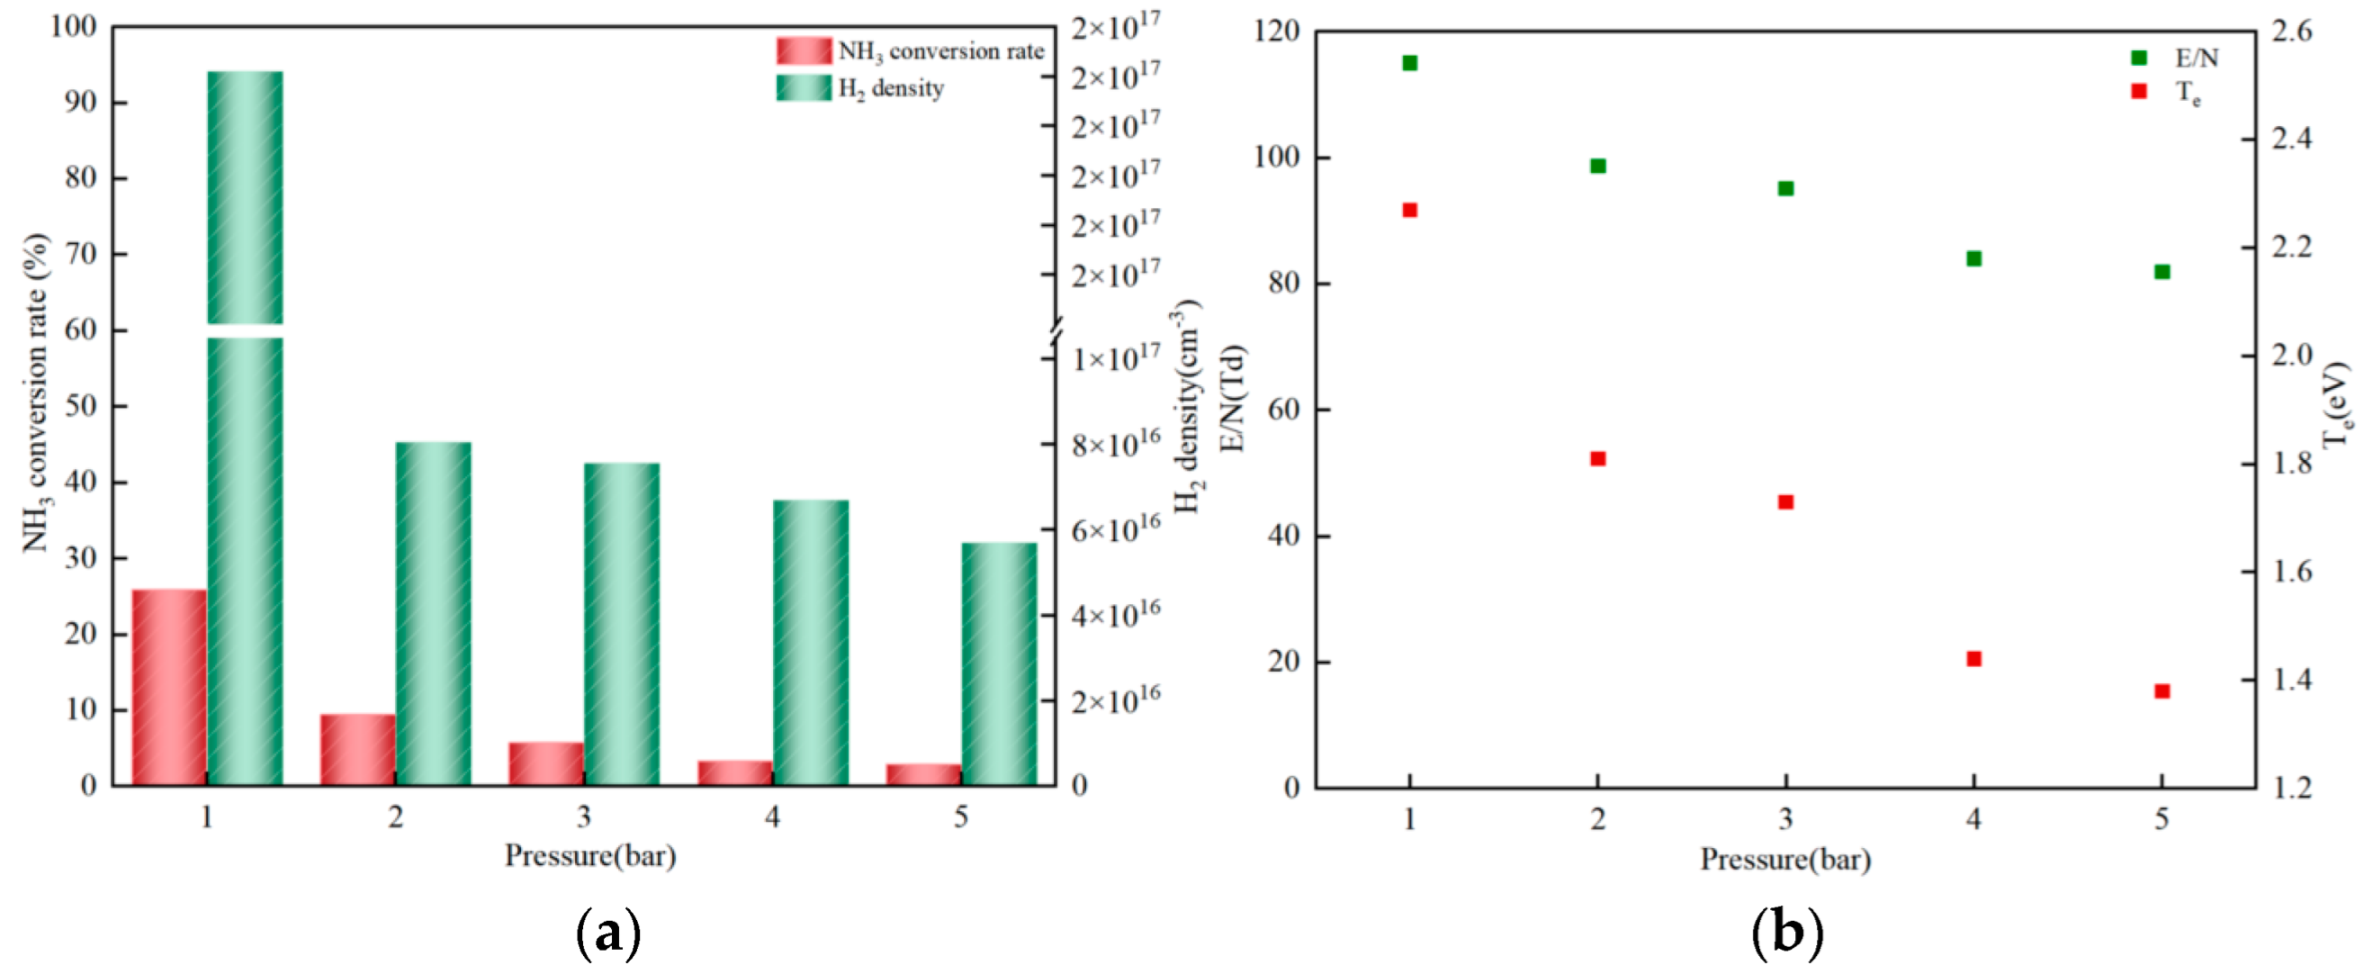
3.2.2. Reaction Pressure

The reaction pressure refers to the force exerted by the gas inside the reactor. As explored in [40], the influence of reaction pressure is significant during the ammonia decomposition process. Therefore, this paper conducts research on the efficiency of hydrogen production from ammonia decomposition under different reaction pressures (Figure 5). Figure 5a shows the efficiency of ammonia decomposition-to-hydrogen production under the coupling of NPD plasma and catalyst as a function of reaction pressure. With the increase in pressure, both the conversion rate of NH3 and the number density of H2 show a downward trend. Specifically, the conversion rate of NH3 drops from 25.88% to 2.92%, and the number density of H2 decreases by nearly three orders of magnitude. However, an increase in reaction pressure can effectively prolong the residence time of the gas in the reactor, enabling the gas to react fully and thus promoting the decomposition of NH3 into H2. In other words, an increase in pressure should theoretically improve the efficiency of ammonia decomposition-to-hydrogen production. So, what causes this decrease in efficiency? Subsequently, the reduced electric field E/N and electron temperature Te during the ammonia decomposition process were investigated. It was found that both E/N and Te decrease with the increase in reaction pressure (as shown in Figure 5b). The decrease in E/N and Te inhibits the dissociation of gas molecules necessary for ammonia decomposition [31]. However, the increase in residence time is not sufficient to compensate for the impact of the decrease in the reduced electric field and electron temperature on ammonia decomposition for hydrogen production. In addition, lower pressure is not conducive to kinetic improvement [41]. Therefore, to maximize hydrogen production, the pressure needs to be optimized.

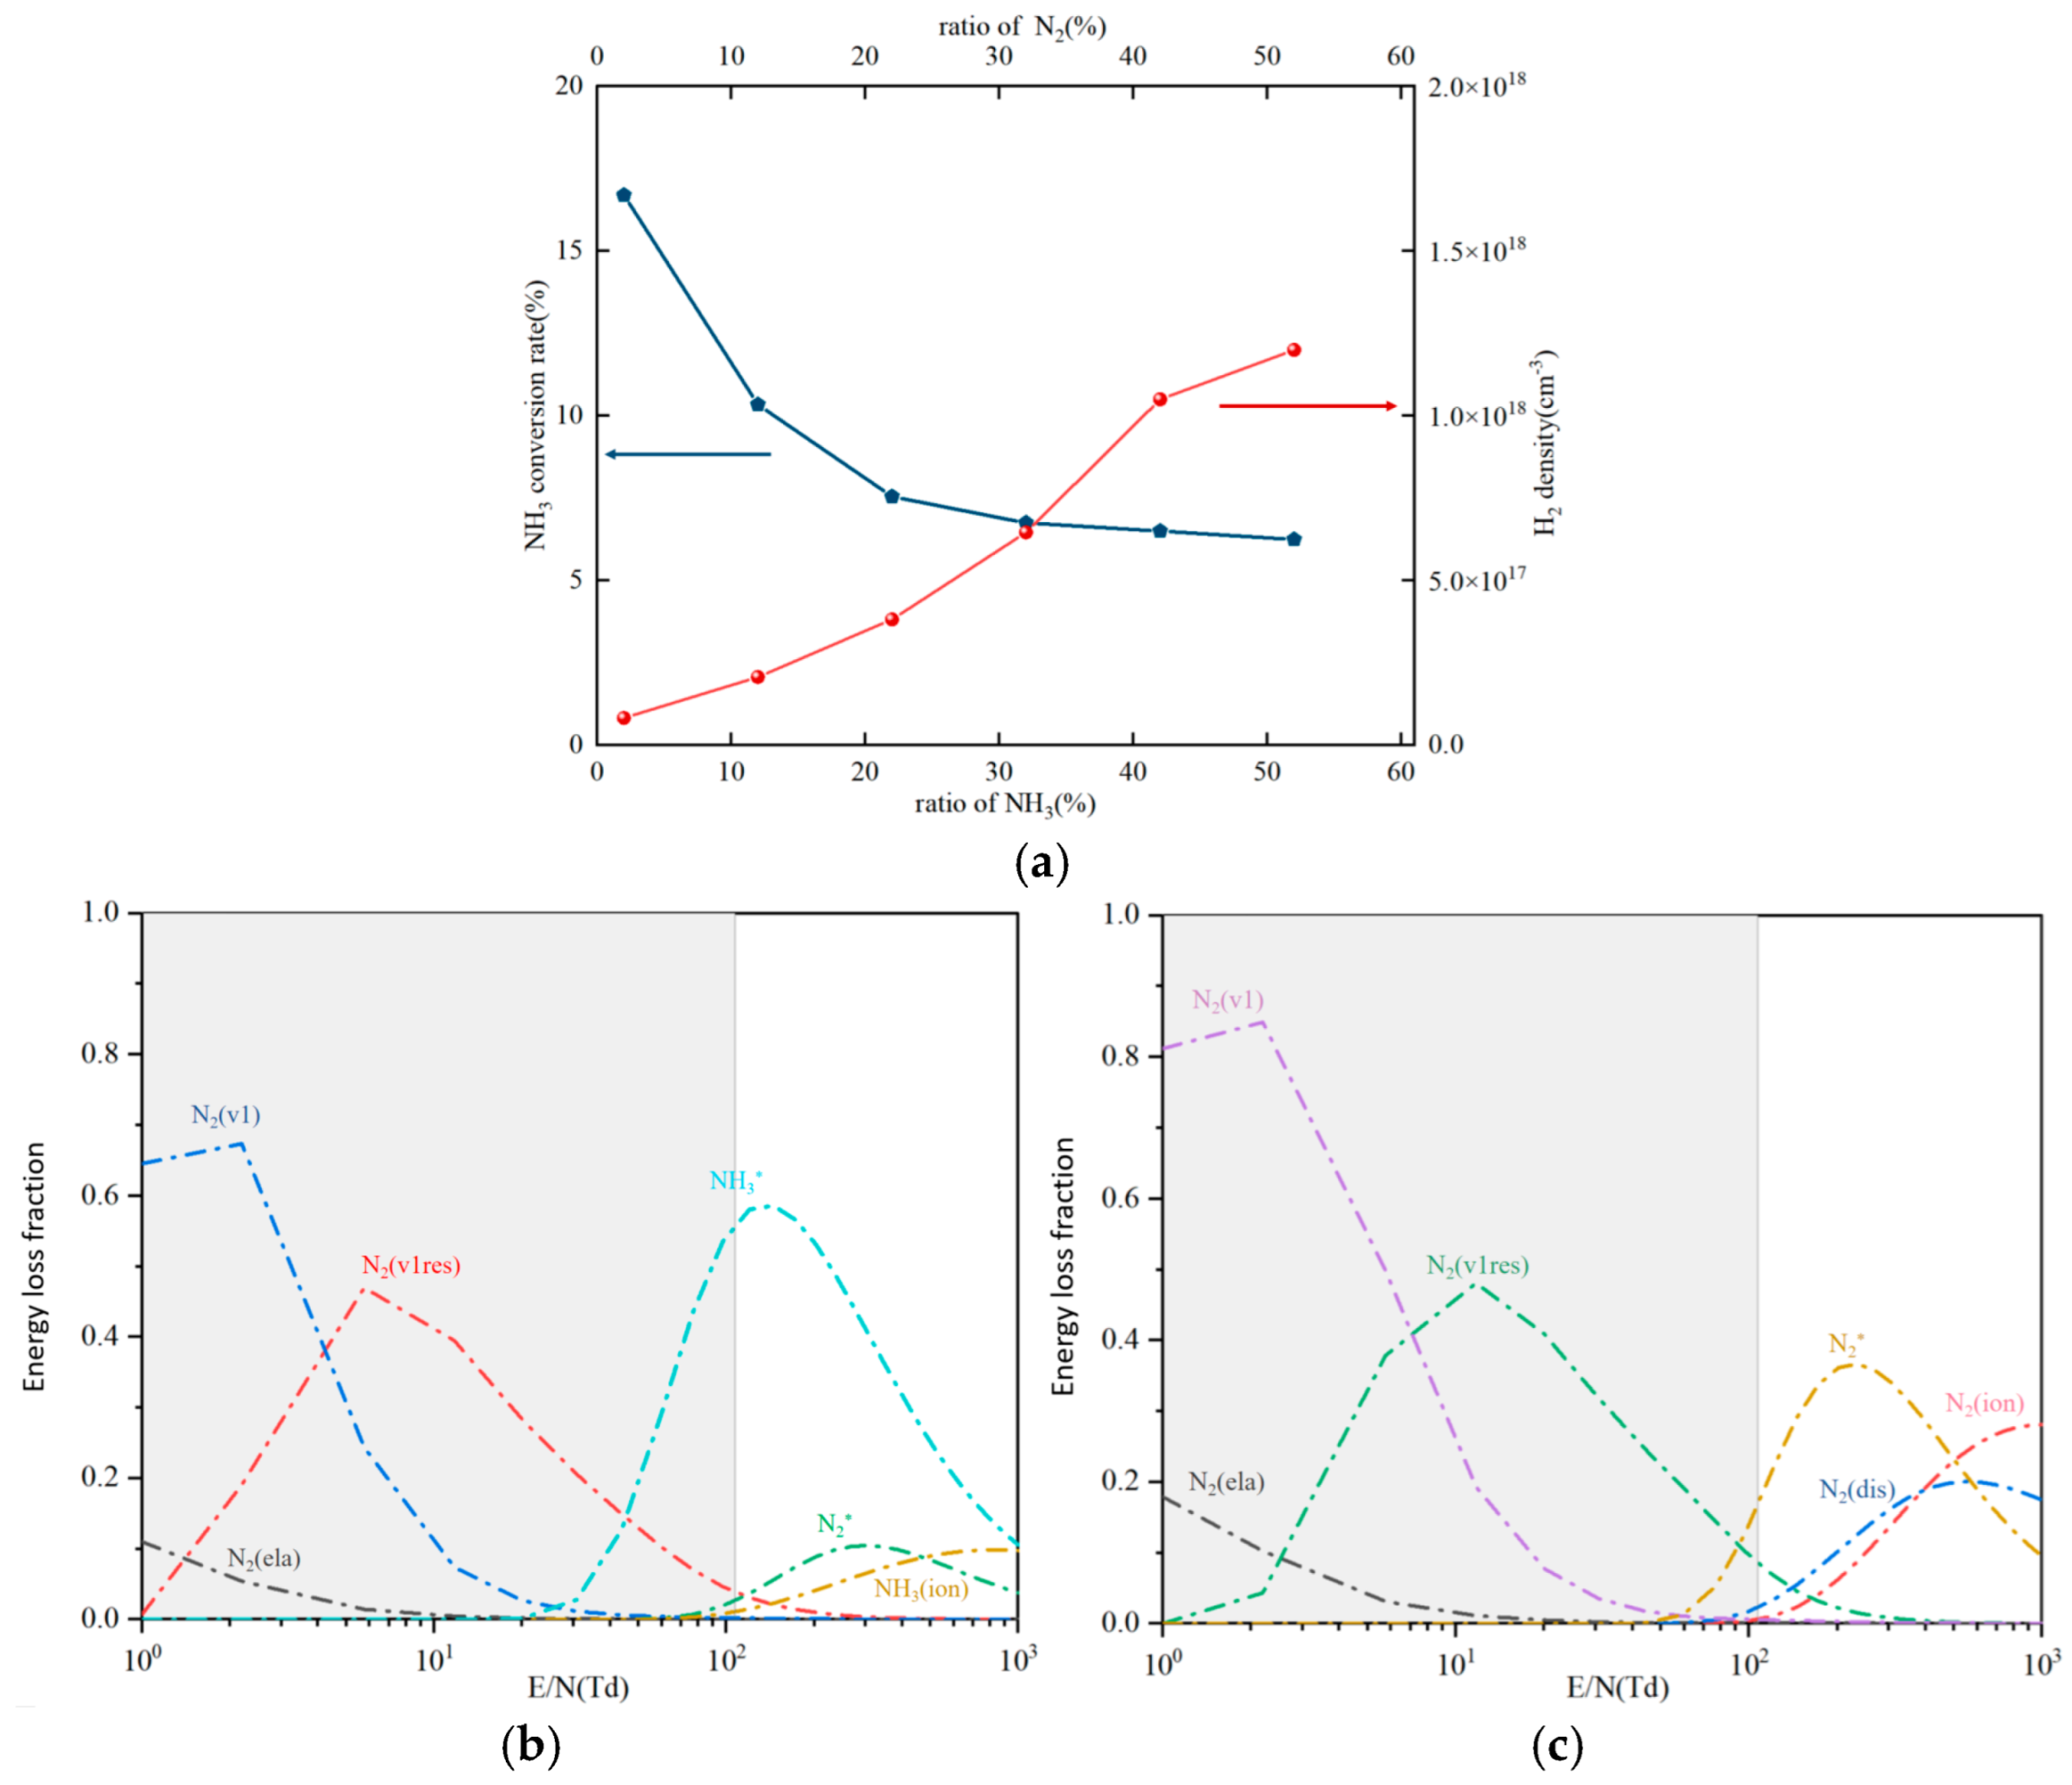
3.2.3. Different Ratios of Feed Gases

Under normal temperature and pressure, the ratio of N2/NH3 was changed to investigate the effect of the feed gas concentration on plasma-catalyzed hydrogen production from NH3. Figure 6 shows the changes in H2 concentration and NH3 conversion rate with the increase in the proportion of NH3 in the feed gas. As can be seen from Figure 6a, the concentration of H2 shows an increasing trend. Although this increase is affected by the increase in the initial proportion of NH3, the relationship is non-linear [42]. However, during the increase in NH3 concentration, the NH3 conversion rate decreased from 16.7% to 6.25%. Since the discharge power in the ammonia decomposition system was not changed, with the increase in the number of reactive gas molecules, the unit energy density would decrease. A lower energy density would not cause more reactive gas molecules to decompose and convert [42]. According to the chemical equilibrium theory, ammonia decomposition and ammonia synthesis are reversible reactions. When the concentration of N2 in the reactor is increased, ammonia decomposition will be inhibited, thereby promoting the occurrence of the ammonia synthesis reaction. However, the results shown in Figure 6a are contrary to this. It can be seen that the plasma environment can, to a certain extent, hinder the occurrence of its reverse reaction. As shown in Figure 6b, in the range of 1–107 Td (1 Td = 10−17 V cm2) in this study, the vibrational excited state of N2 dominates during the plasma discharge process. With the increase in E/N, the electronic excited state of NH3 begins to become gradually important. For the feed gas with a ratio of 98% N2/2% NH3 (Figure 6c), when E/N is in the range less than 43 Td, the energy loss mechanism does not change significantly. However, in the range of 43-107 Td, the main energy loss pathway is the electronic excited state of N2. This transition means that increasing the proportion of N2 in the feed gas is beneficial for promoting the generation of the electronic excited state of N2, thereby promoting the decomposition of NH3 (such as N2(A3) + NH3 => N2 + NH2 + H) [32]. It is worth noting that increasing the proportion of N2 in the mixed gas will increase the energy loss fraction of the vibrational state and elastic collision state of N2 below 43 Td by an order of magnitude, reducing the energy utilization efficiency. Therefore, although the introduction of the diluent gas N2 accelerates the conversion of NH3, it also increases the energy consumption at the same time.

3.3. Reaction Mechanism Analysis

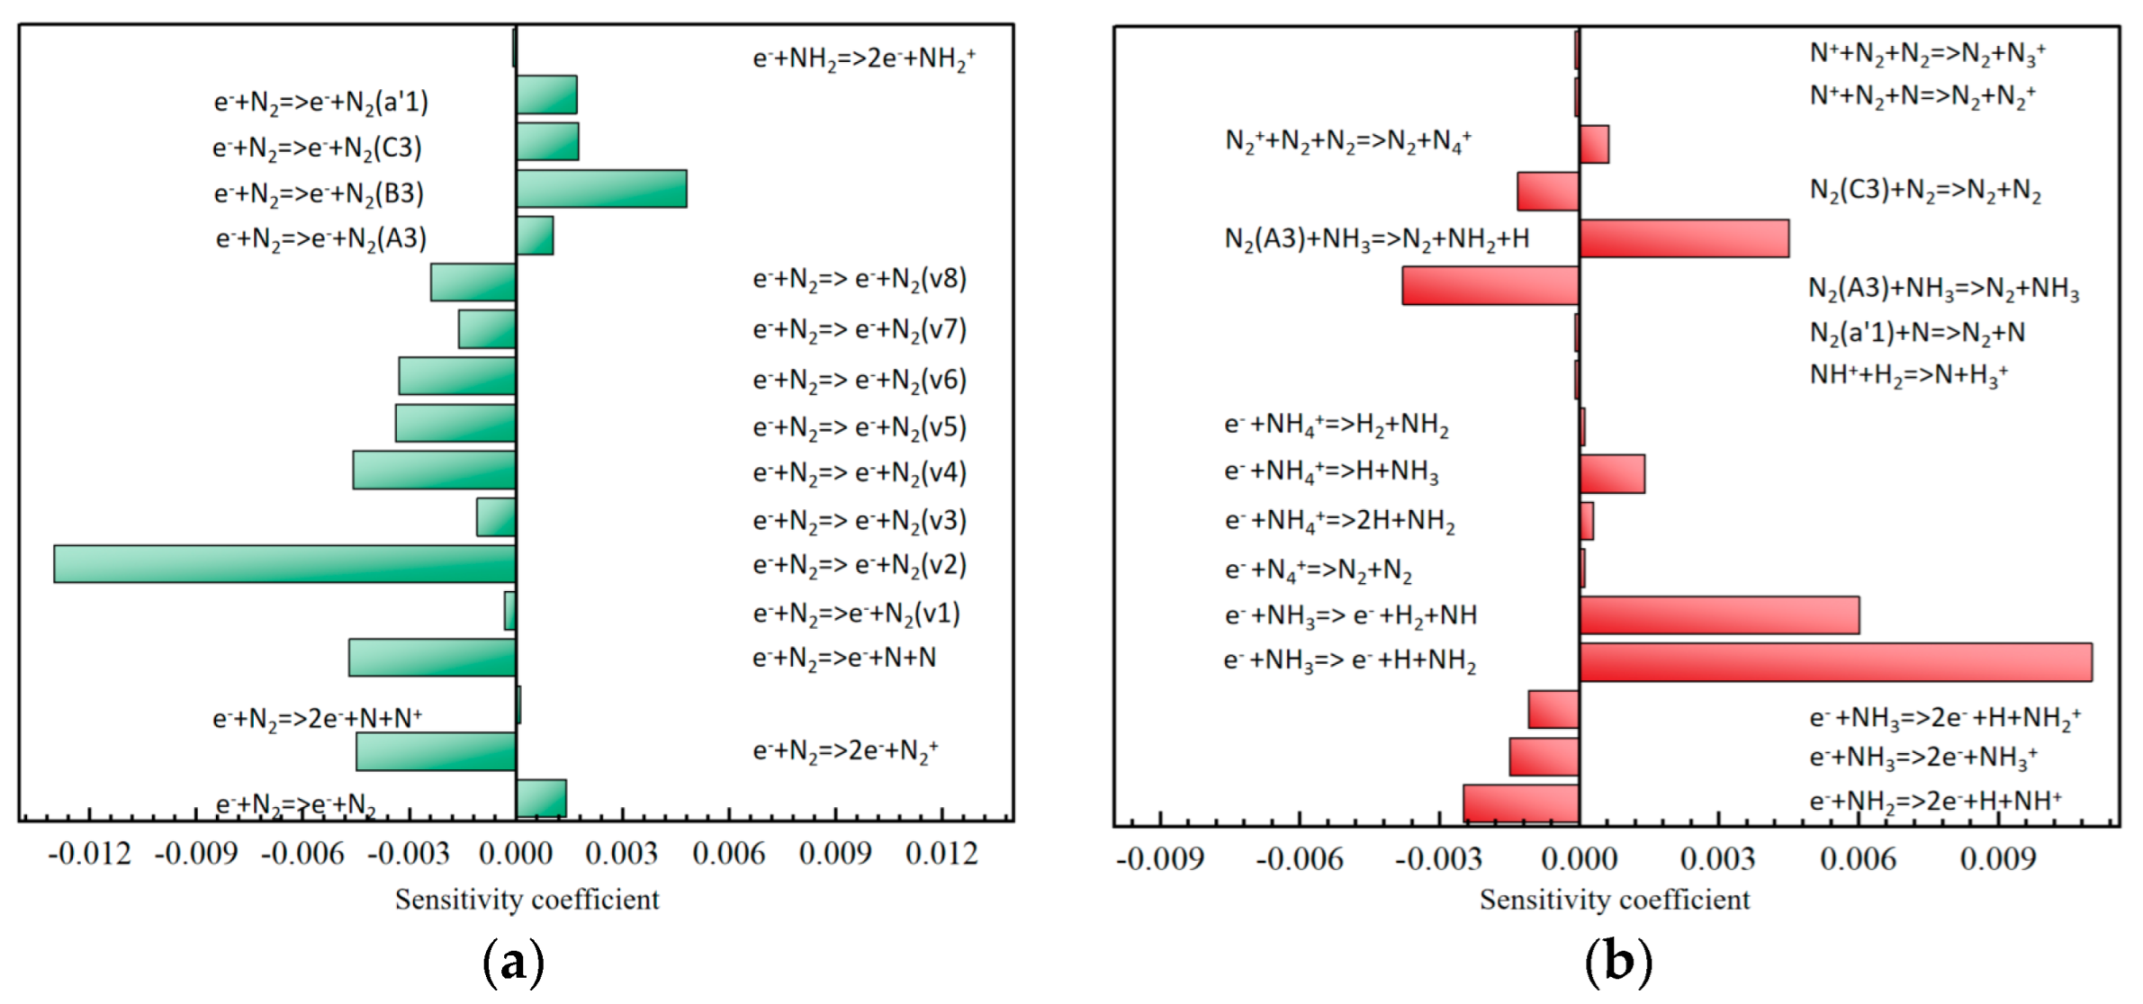
3.3.1. Sensitivity Analysis

Multiple intermediate reaction steps are involved in the plasma-catalytic process of ammonia-to-hydrogen production, and these reaction steps have different impacts on ammonia decomposition for hydrogen production. By calculating the sensitivity coefficients of the selected species, the degree of influence of each reaction step on the decomposition or generation of the species can be quantitatively evaluated, and then the key reaction steps can be identified. To explore the sensitivity of each reaction to NH3 decomposition, the species considered in this study was NH3, and the calculated sensitivity coefficients are presented in Figure 7. To reduce the time cost and improve the clarity, the vibrational energy exchange process was not considered, and only the reactions with S > ±1.0 × 10⁻⁴ were shown. A negative sensitivity coefficient indicates that the corresponding reaction inhibits the decomposition of the species, and vice versa. As can be observed from Figure 7b, within a pulse cycle, although the feed concentration of N2 is much higher than that of NH3, the main reaction promoting NH3 decomposition at room temperature is the dissociation reaction (R1) in which the N-H bond is broken due to the collision between electrons and NH3, rather than the dissociation of NH3 by the electronically excited state N2(A3) of N2 (R2). This indicates that the rate-limiting step of NH3 decomposition is the dissociation reaction of the collision between electrons and NH3(R1). Interestingly, for the plasma-catalytic process of NH3 for hydrogen production, the generation of the vibrational excited state of N2 shows negative sensitivity. Among them, the formation of N2(v2) has a significant inhibitory effect on NH3 decomposition. Since the reaction R3 accounts for 73% of the consumed N2, more N2 is consumed, and the electronically excited-state N2(A3) generated by the reaction R4 will be severely reduced, further inhibiting the decomposition of NH3. However, in Figure 7a, the generation of the electronically excited state of N2 shows positive sensitivity. This is because N2 (A3) promotes the conversion of NH3 through the dissociation reaction (R5), and its contribution rate is 53%. Therefore, an increase in the concentration of N2(a’1) in the reactor will increase the concentrations of N2(B3) and N2(C3) (R6, R7), and an increase in the concentrations of N2(B3) and N2(C3) (R8-14) will in turn increase the concentration of N2(A3), thereby accelerating the decomposition of NH3. This demonstrates the importance of the electronically excited state of N2 for NH3 decomposition to produce hydrogen. In addition, the ionization reactions of the electron collisions with and NH3 and N2, called R15 and R16, are the main sources of electrons. The more electrons generated, the faster the decomposition rate of NH3. However, the sensitivity coefficients shown by the two reactions in Figure 7 are negative. Since the electron collision reactions obtain the concentration C’ by doubling their collision cross-sections, the selection of the electron reaction collision cross-section is very important for NH3 decomposition.
e + NH3 => e + NH2 + H
e + NH3 => e + NH + H2
N2(v2) + N2 => N2(v1) + N2(v1)
e + N2 => e + N2(A3)
N2(A3) + NH3 => N2 + NH2 + H
N2(a’1) + N2 => N2(B3) + N2
N2(a’1) + N2 => N2(C3) + N2
N2(B3) + H2 => N2(A3) + H2
N2(B3) + N2 => N2(A3) + N2
N2(B3) + N => N2(A3) + N
N2(B3) + N2 => N2(A3) + N2(v6)
N2(B3) + N2(v1) => N2(A3) + N2(v7)
N2(B3) + N2(v2) => N2(A3) + N2(v8)
N2(C3) + N2 => N2(B3) + N2(A3)
e + NH3 => 2e+ NH3+
e + N2 => 2e+ N2+
NH2 + H => NH + H2
N + H2(v3) => NH + H
NH + H => H2 + N
e + N2 => e +N + N
N + NH2 => N2 + 2H
H + NH2 => H2 + NH
H + H(s) => H2
H(s)+ H(s) => H2
H2 + N2(a’1) => 2H + N2
H2+ N2(v) => N2(v−1)+ H2(v)
H + N(s) => NH(s)
H(s) + NH(s) => NH2(s)
NH2(s)+ H(s) => NH3
NH => NH(s)
N + H(s) => NH(s)
H + N(s) => NH(s)
NH(s)+ H(s) => NH2(s)
NH2 => NH2(s)

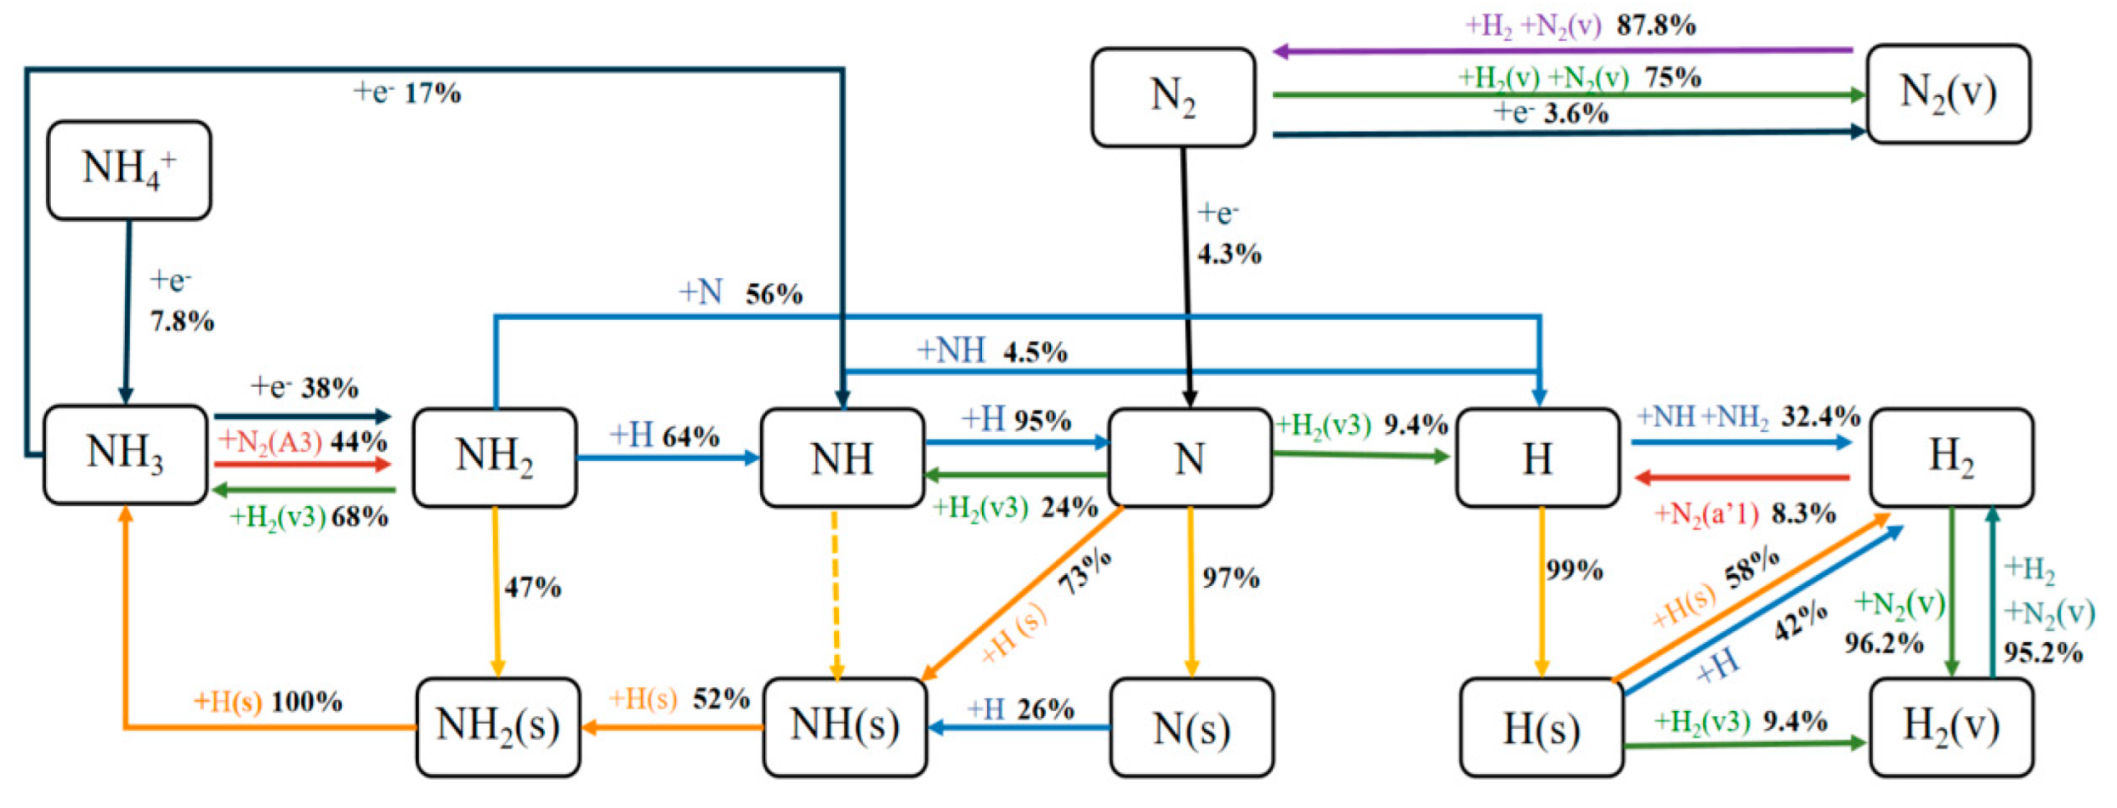
3.3.2. Reaction Path Analysis

Based on the Pumpkin 1.4 software [43], this study simplified the chemical reaction pathways in the NPD plasma-catalytic ammonia-to-hydrogen production model and calculated the generation and consumption ratios of various species. The main reaction pathway diagram is shown in Figure 8. This reaction pathway was analyzed within the total gas residence time, providing insights into the interactions among various particles such as free radicals, molecules, and ions during the ammonia decomposition process for hydrogen production. As one of the feed gas molecules, NH3 is dissociated by electrons to generate NH2 and NH. Most of the NH3 is consumed through R5 to produce the species NH2. Besides R2, the main formation pathways of NH also include R17 and the reaction between molecules and atoms caused by N + H2(v3) => NH + H (R18). Their contribution rates to NH are 64% and 24%, respectively. The reaction R19, which occurs when the species NH collides with H atoms, contributes 95% of N and is the main source of N atoms. In addition, only a small part of N is formed by the collision of another feed gas molecule N2 with electrons (R20). However, most of the loss of N2 occurs through the so-called vibrational-translational (V-T) reaction, i.e., N2 + H2(v)/N2(v) => N2(v) + H2(v − 1)/N2(v − 1) (the reactions are shown in the Supplementary Materials) to form the vibrationally excited-state N2(v). Eventually, nearly 90% of N2(v) decays to N2. Therefore, under the reaction conditions and residence time considered in this study, the vibrationally excited pathway does not promote the dissociation of N2 [44]. The generated NH2, NH, and N species all contribute to the production of H atoms, among which R21 has the largest contribution rate, with a value of 56%. Overall, there are two main consumption pathways for H atoms, both of which are involved in the process of producing H2. One pathway is the reaction of H with free radicals NH and NH2 to form H2 (R19, R22). The other is that H is adsorbed on the catalyst to become adsorbed H(s) and H(s) undergoes a recombination reaction with H(s) and H to produce H2 (R23, R24). Their contribution rates are 58% and 42%, respectively. However, the H2 formed later is consumed by collisions with N2(a’1) and N2(v) undergoing the reactions R25 and R26. The formation of H2(v) quickly returns to the ground-state H2, although the vibrationally excited-state N2(v) consumes a large proportion of H2 (the reactions are shown in the Supplementary Materials) up to 96.2%. This confirms that the vibrationally excited channel does not promote the dissociation of H2 either.
In the plasma-catalytic process of ammonia decomposition, not only gas-phase reactions but also a series of surface reactions occur, initiated by surface species. It is noteworthy that compared with the species H(s), the reactions (R27-29) initiated by surface species such as N(s), NH(s), and NH2(s) have a negative contribution to the decomposition of NH3 to produce H2 and can lead to the synthesis of NH3 [36]. Specifically, as can be seen from Figure 8, most of the adsorbed states of various species on the catalyst surface originate from the direct adsorption of gas-phase species, except for NH(s) and NH2(s). For NH(s), the direct adsorption of NH(R30) contributes very little to its formation, less than 0.1%. Instead, NH(s) mainly comes from R31 and R32. The formed NH(s) will react step by step with H(s) to generate NH2(s) (R33) within the residence time and finally produce NH3 (R29). In this process, for NH2(s), the hydrogenation reaction of NH(s) (R28) contributes 52% to its formation, which is slightly greater than its own direct adsorption (47%) (R34). Overall, the decomposition of NH3 mainly occurs in gas-phase reactions. Moreover, compared with feeding pure NH3, when N2 is incorporated into the feed gas, N2 collides with electrons to produce the reaction e+N2 => e + N2(A3), generating N2(A3). The R3 initiated by N2(A3) is the main reaction for decomposing NH3, and its contribution rate is greater than that of the two dissociation reactions generated by electron collisions (R1, R2). At the same time, the N atoms produced by the collision of N2 with electrons (R20) not only affect the conversion of NH2 but also contribute to the formation of H [36]. Therefore, the addition of an appropriate amount of N2 is beneficial for the decomposition of NH3 to obtain H2.

4. Calculation Method

4.1. Calculation of the Particle Number Density and Reduced Electric Field Strength

4.1.1. Calculation of Particle Number Density

The plasma-catalyzed reaction process of NH3 decomposition is numerically simulated using the solver ZDPlaKin [12]. This solver explores the average behavior of the particle time-evolution by calculating the continuity equation of the number density n of each particle i. The equation is as follows [38]:
d n i d t = j a j , i k j s n s
In the equation, a j , i is the stoichiometric coefficient of a given particle i in reaction j, k j is the reaction rate coefficient ( k j of heavy particle reaction is generally a function related to T g a s ), and s is the species that collides with particle i.

4.1.2. Calculation of the Reduced Electric Field Strength

During the nanosecond-pulsed plasma discharge process, charged particles are accelerated by the electric field intensity E and undergo directed motion to form current density J. As these charged particles move, they collide with neutral particles, transferring the kinetic energy acquired from the electric field to the neutral particles. This increases the thermal motion of the neutral particles, thereby generating heat, specifically Joule heating JE (J = σ∙E [39], where σ is conductivity). Consequently, the formula for the rate at which electrical energy consumed per unit effective volume in the reactor is converted into heat energy can be expressed as follows [31]:
dP d V = J E = σ E 2
In Equation (2), P is the input discharge power and the unit is W.
Given that the discharge power of the input nanosecond-pulsed plasma is a time-dependent function p(t), the corresponding power density can be expressed as p(t) = p(t)/V. Therefore, the expression [30,31,36] for the reduced electric field E/N entered in the ZDPlasKin solver is as follows (where E/N varies with time in the form of a triangular pulse):
E N = 1 N p ( t ) σ
In Formula (3), N represents the number density of all neutral particles, with units of cm−3.

4.2. Calculation of Ammonia Conversion Rate and Sensitivity Coefficient

The activity of the NPD plasma-catalyzed ammonia decomposition reaction for hydrogen production is mainly evaluated using the ammonia conversion rate. The detailed calculation formula is as follows:
X N H 3 = n N H 3 0 n N H 3 n N H 3 0 × 100 %
In the equation, n N H 3 0 is the initial concentration and n N H 3 is the concentration at the reactor outlet.
A study on the sensitivity of ammonia (NH3) decomposition for hydrogen production was carried out to gain a deeper understanding of the role of each reaction in the NPD plasma-catalyzed ammonia-to-hydrogen process. The sensitivity coefficient formula is defined as follows:
S = lg ( C / C ) lg ( k j / k j )
In the equation, S is the sensitivity coefficient, C is the initial concentration of the selected particles, k j is the reaction rate coefficient of the jth reaction, and C′ is the concentration of the species after doubling the reaction rate coefficient ( k j ) of the jth reaction. C′ is calculated by doubling the collision cross-section for electron collision reactions [31].

5. Conclusions

Among the input parameters of this numerical model, both the NH3 conversion rate and the H2 number density show an increasing trend with the increase in the reaction temperature. At 700 K, the NH3 conversion rate and the H2 number density are close to 80% and 2.5 × 1017 cm−3, respectively. The discharge pressure affects the reduced electric field E/N and the electron temperature Te during the ammonia decomposition process for hydrogen production. An increase in the discharge pressure can reduce E/N and Te, thereby inhibiting the dissociation of gas molecules necessary for ammonia decomposition and slowing down the decomposition of NH3 into H2. In addition, changes in the N2/NH3 ratio of the feed gas can alter various sensitivity coefficients and reaction pathways of the ammonia-to-hydrogen reaction. The higher the N2/NH3 ratio, the greater the ammonia conversion rate. This is because increasing the proportion of N2 in the feed gas is conducive to promoting the generation of the electronically excited state of N2, which in turn promotes the decomposition of NH3 (such as N2(A3) + NH3 => N2 + NH2 + H). At the same time, an increase in the proportion of N2 in the mixed gas can increase the energy loss fraction of the vibrational state and elastic collision state of N2 below 43 Td by an order of magnitude, reducing the energy utilization efficiency. Therefore, although the introduction of the diluent gas N2 accelerates the conversion of NH3, it also increases the energy consumption.

Supplementary Materials

The following supporting information can be downloaded at: https://www.mdpi.com/article/10.3390/molecules30051054/s1. The chemical kinetic file of the reaction of plasma-catalyzed ammonia decomposition for hydrogen production.

Author Contributions

Writing—original draft, Y.H.; conceptualization, N.Z.; writing—review and editing, Y.C. All authors have read and agreed to the published version of the manuscript.

Funding

This research was funded by the National Natural Science Foundation of China (no. 52301382), the Natural Science Foundation of Hubei Province (no. 2022CFB730), the Key Laboratory of Automotive Power Train and Electronics (Hubei University of Automotive Technology) (ZDK12024B10), and the Nature Science Foundation of Hubei Province (JCZRLH202500823).

Institutional Review Board Statement

Not applicable.

Informed Consent Statement

Not applicable.

Data Availability Statement

Data are contained within the article.

Acknowledgments

The authors are thankful to College Students’ Innovative Entrepreneurial Training Plan Program (No.202410488028).

Conflicts of Interest

The authors declare no conflicts of interest.

References

  1. Energy saving, carbon reduction and green development of inland waterway transportation system should do so. China Water Transport, 17 February 2022.
  2. Shaping the New Advantages of “Thoroughfare of Nine States”-Survey on Enhancing the Open Hub Function of Hubei Province. Economic Daily, 10 April 2024.
  3. Hubei Province 2023 National Economic and Social Development Statistics Bulletin. Hubei Province Statistics Bureau, 27 March 2024.
  4. Wang, Y.; Zhou, X.H.; Liu, L. Theoretical investigation of the combustion performance of ammonia/hydrogen mixtures on a marine diesel engine. Int. J. Hydrogen Energy 2021, 46, 14805–14812. [Google Scholar] [CrossRef]
  5. Qian, Y.; Sun, Y.; Gong, Z.; Meng, S.; Wei, X.; Tang, B.; Wan, J. Study on the impact mechanism of ammonia energy fraction on in-cylinder combustion and pollutant generation under wide operation conditions of medium-speed diesel engines. Fuel 2024, 360, 130617. [Google Scholar] [CrossRef]
  6. Peng, C.S. Challenges and Path of China’s Shipping Decarbonization. China Marit. Saf. 2023, 6, 24–29. [Google Scholar]
  7. Dimitriou, P.; Javaid, R. A review of ammonia as a compression ignition engine fuel. Int. J. Hydrogen Energy 2020, 45, 7098–7118. [Google Scholar] [CrossRef]
  8. Boretti, A. Novel dual fuel diesel-ammonia combustion system in advanced TDI engines. Int. J. Hydrogen Energy 2017, 42, 7071–7076. [Google Scholar] [CrossRef]
  9. Chen, S.C.; Kao, Y.L.; Yeh, G.T.; Rei, M.H. An onboard hydrogen generator for hydrogen enhanced combustion with internal combustion engine. Int. J. Hydrogen Energy 2017, 42, 21334–21342. [Google Scholar] [CrossRef]
  10. Lhuillier, C.; Brequigny, P.; Contino, F.; Rousselle, C. Combustion characteristics of ammonia in a modern spark-ignition engine. SAE Tech. Pap. 2019, 237, 2019–2024. [Google Scholar]
  11. Liu, J.L.; Liu, Z.T. In-cylinder thermochemical fuel reforming for high efficiency in ammonia spark-ignited engines through hydrogen generation from fuel-rich operations. Int. J. Hydrogen Energy 2024, 54, 837–848. [Google Scholar] [CrossRef]
  12. Yu, Y.; Lu, C.; Ye, S.; Hua, Z.; Gu, C. Optimization on volume ratio of three-stage cascade storage system in hydrogen refueling stations. Int. J. Hydrogen Energy 2022, 47, 13430–13441. [Google Scholar] [CrossRef]
  13. Shuai, S.J.; Wang, Z.; Ma, X.; Xu, H.M.; Xin, H.E.; Wang, J. Low carbon and zero carbon technology paths and key technologies of ICEs under the background of carbon neutrality. Automot. Saf. Energy 2021, 12, 417–439. [Google Scholar]
  14. Sami, A.; Mehrpooya, M.; Noorpoor, A. Investigation of an integrated thermochemical hydrogen production and high temperature solar thermochemical energy storage and CO2 capture process. Appl. Therm. Eng. 2022, 214, 1359–4311. [Google Scholar] [CrossRef]
  15. Thanda, V.K.; Fend, T.; Laaber, D. Experimental investigation of the applicability of a 250kW ceria receiver/reactor for solar thermochemical hydrogen generation. Renew. Energy 2022, 198, 389–398. [Google Scholar] [CrossRef]
  16. Pein, M.; Neumann, N.C.; Venstrom, L.J.; Vieten, J.; Roeb, M.; Sattler, C. Two-step thermochemical electrolysis: An approach for green hydrogen production. Int. J. Hydrogen Energy 2021, 46, 24909–24918. [Google Scholar] [CrossRef]
  17. Wang, Z.H.; Zheng, S.S.; Yao, Y.D.; Chen, R.; Wang, Z. Research progress on electrocatalytic decomposition of ammonia for hydrogen production. CIESC J. 2022, 73, 1008–1021. [Google Scholar]
  18. Yuzawa, H.; Mori, T.; Itoh, H.; Yoshida, H. Reaction mechanism of ammonia decomposition to nitrogen and hydrogen over metal loaded titanium oxide photocatalyst. J. Phys. Chem. C 2012, 116, 4126–4136. [Google Scholar] [CrossRef]
  19. Wang, L. The Research of Ammonia Decomposition via Plasma-Catalysis. Ph.D. Thesis, Dalian University of Technology, Dalian, China, 2006. [Google Scholar]
  20. Ban, J.Y.; Kim, H.I.; Choung, S.J.; Jeong, H.; Kang, M. NH3 removal using the dielectric barrier discharge plasma-V-TiO2 photocatalytic hybrid system. Korean J. Chem. Eng. 2008, 25, 780–786. [Google Scholar] [CrossRef]
  21. Rouwenhorst, K.H.R.; Lefferts, L. Feasibility study of plasma-catalytic ammonia synthesis for energy storage applications. Catalysts 2020, 10, 999. [Google Scholar] [CrossRef]
  22. Bogaerts, A.; Tu, X.; Whitehead, J.C.; Centi, G.; Lefferts, L.; Guaitella, O.; Azzolina-Jury, F.; Kim, H.H.; Murphy, A.B.; Schneider, W.F.; et al. The 2020 plasma catalysis roadmap. Phys. D-Appl. Phys. 2020, 53, 443001. [Google Scholar] [CrossRef]
  23. Bogaerts, A.; Neyts, E.C. Plasma technology: An emerging technology for energy storage. ACS Energy Lett. 2018, 3, 1013–1027. [Google Scholar] [CrossRef]
  24. Zeng, W.W. Performance Analysis of Organic Rankine Cycle for Low Temperature Waste Heat Recovery on Ship. Ph.D. Thesis, Dalian Maritime University, Dalian, China, 2019. [Google Scholar]
  25. Analysis of the development status and technical difficulties of ammonia-hydrogen-powered offshore vessels. China Hydrogen Alliance, 5 December 2023.
  26. Huang, G.C. Design and Optimization of Low Grade Waste Heat Utilization Scheme for Marine Diesel Engine Based on Organic Rankine Cycle. Ph.D. Thesis, Guangxi University, Nanning, China, 2021. [Google Scholar]
  27. Wang, B.; Wang, H.; Duan, B.; Yang, C.; Hu, D.; Wang, Y. Effect of ammonia/hydrogen mixture ratio on engine combustion and emission performance at different inlet temperatures. Energy 2023, 272, 127110. [Google Scholar] [CrossRef]
  28. Bai, C.J.; Li, N.; Du, J.; Zong, L.J.; Chen, T.; Pan, J. Numerical modeling and mechanism of gas phase-surface coupling for plasma catalytic ammonia synthesis. High Volt. Eng. 2022, 48, 1142–1156. [Google Scholar]
  29. Pancheshnyi, S.; Eismann, B.; Hagelaar, G.; Pitchford, L. ZDPlasKin: A new tool for plasma chemical simulations. Bull. Am. Phys. Soc. 2008, 53, 2–15. [Google Scholar]
  30. van’t Veer, K.; Engelmann, Y.; Reniers, F.; Bogaerts, A. Plasma-Catalytic ammonia synthesis in a DBD plasma: Role of micro-discharges and their afterglows. J. Phys. Chem. C 2020, 124, 22871–22883. [Google Scholar] [CrossRef]
  31. Sun, J.T.; Chen, Q.; Zhao, X.T.; Lin, H.; Qin, W. Kinetic investigation of plasma catalytic synthesis of ammonia: Insights into the role of excited states and plasma-enhanced surface chemistry. Plasma Sources Sci. Technol. 2022, 31, 094009. [Google Scholar] [CrossRef]
  32. Hagelaar, G.J.M.; Pitchford, L.C. Solving the Boltzmann equation to obtain electron transport coefficientents and rate coefficientents for fluid models. Plasma Sources Sci. Technol. 2005, 14, 722–733. [Google Scholar] [CrossRef]
  33. Capitelli, M.; Ferreira, C.M.; Gordiets, B.F.; Osipov, A.I. Plasma Kinetics in Atmospheric Gases; Springer: New York, NY, USA, 2000; pp. 101–140. [Google Scholar]
  34. Hong, J.; Pancheshnyi, S.; Tam, E.; Lowke, J.J.; Prawer, S.; Murphy, A.B. Kinetic modelling of NH3 production in N2-H2 non-equilibrium atmospheric-pressure plasma catalysis. J. Phys. D Appl. Phys. 2017, 50, 154005. [Google Scholar] [CrossRef]
  35. van’t Veer, K.; Reniers, F.; Bogaerts, A. Zero-dimensional modelling of unpacked and packed bed dielectric barrier discharges: The role of vibrational kinetics in ammonia synthesis. Plasma Sources Sci. Technol. 2020, 29, 45020. [Google Scholar] [CrossRef]
  36. Andersen, J.A.; van’t Veer, K.; Christensen, J.M.; Østberg, M.; Bogaerts, A.; Jensen, A.D. Ammonia decomposition in a dielectric barrier discharge plasma: Insights from experiments and kinetic modeling. Chem. Eng. Sci. 2023, 271, 118550. [Google Scholar] [CrossRef]
  37. Bang, S.; Snoeckx, R.; Cha, M.S. Kinetic study for plasma assisted cracking of NH3: Approaches and challenges. J. Am. Chem. Soc. 2023, 127, 1271–1282. [Google Scholar] [CrossRef]
  38. Snoeckx, R.; Tennyson, J.; Cha, M.S. Theoretical cross sections for electron collisions relevant for ammonia discharges part 1: NH3, NH2, and NH. Plasma Sources Sci. Technol. 2023, 32, 115020. [Google Scholar] [CrossRef]
  39. Li, N. Numerical Simulations and Deep Neural Network Solutions of Plasma Catalytic Ammonia Syntheses by Nanosecond Pulsed Discharge. Ph.D. Thesis, Shandong Normal University, Jinan, China, 2022. [Google Scholar]
  40. Zou, X.; Su, H.Y.; Sun, X.; Pang, W.; Hao, X.; Xu, Y.; Sun, K. Interplay between surface structure, reaction condition and mechanism for ammonia decomposition on Ru catalyst. Appl. Surf. Sci. 2024, 649, 159175. [Google Scholar] [CrossRef]
  41. Nadiri, S.; Shu, B.; Goldsmith, C.F.; Fernandes, R. Development of comprehensive kinetic models of ammonia/methanol ignition using Reaction Mechanism Generator (RMG). Combust Flame 2023, 251, 112710. [Google Scholar] [CrossRef]
  42. Gao, Y.B.; Zhou, M.; Hu, E.J.; Zhao, Y.; Yin, G.; Huang, Z. Hydrogen generation by dielectric barrier discharge plasma assisted ammonia decomposition. Energy Convers. Manag. 2024, 306, 118271. [Google Scholar] [CrossRef]
  43. Markosyan, A.H.; Luque, A.; Gordillo-Vázquez, F.J.; Ebert, U. PumpKin: A tool to find principal pathways in plasma chemical models. Comput. Phys. Commun. 2014, 185, 2697–2702. [Google Scholar] [CrossRef]
  44. Morais, E.; Delikonstantis, E.; Scapinello, M.; Smith, G.; Stefanidis, G.D.; Bogaerts, A. Methane coupling in nanosecond pulsed plasmas: Correlation between temperature and pressure and effects on product selectivity. Chem. Eng. J. 2023, 462, 142227. [Google Scholar] [CrossRef]
Figure 1. Cargo throughput in Hubei and its growth rate from 2019 to 2023.
Molecules 30 01054 g001
Figure 2. Schematic diagram of plasma-catalyzed ammonia decomposition.
Molecules 30 01054 g002
Figure 3. Comparison of the evolution characteristics of the species number density: (a) the model NPD plasma-catalyzed ammonia decomposition for hydrogen production; (b) the plasma-catalyzed ammonia decomposition model in Ref. [36] (Andersen et al., 2023) under CC-BY license.
Molecules 30 01054 g003
Figure 4. Influence of temperature on ammonia decomposition efficiency and yield. (a) Efficiency of hydrogen production from ammonia at different temperatures. (b) Yield of gas-phase and surface reactions for ammonia decomposition at the same temperature (1 bar).
Molecules 30 01054 g004
Figure 5. Effect of pressure on hydrogen production from ammonia efficiency, maximum E/N, and Te. (a) Efficiency of hydrogen production from ammonia at different pressures. (b) Maximum reduced electric field and electron temperature at different pressures (400 K).
Molecules 30 01054 g005
Figure 6. Effect of feed gas concentration on ammonia to hydrogen production efficiency and energy loss fraction. (a) Effect of NH3 concentration on NH3 conversion and H2 concentration (discharge frequency 3 kHz, pulse width 200 ns); (b) variation in energy loss fraction with E/N for the 48% N2/52% NH3 feed gas; (c) variation in the energy loss fraction with E/N for the 98% N2/2% NH3 feed gas (ela: elastic; dis: dissociation; ion: ionization; *: electronic excited state, 300 K).
Molecules 30 01054 g006
Figure 7. Sensitivity coefficients of NH3 at atmospheric pressure (300 K, 3 kHz frequency). (a) sensitivity coefficients for electron collision reaction; (b) sensitivity coefficients for electron collision reaction and heavy particle reaction.
Molecules 30 01054 g007
Figure 8. Reaction pathways of hydrogen production from ammonia catalyzed by plasma under atmospheric pressure, 300 K and frequency of 3 kHz (blue: reaction with free radicals, green: reaction with vibratory excited states, red: reaction with electron excited states, navy blue: electron collision reaction, yellow: direct adsorption reaction, orange: surface reaction, purple: the total reaction of the vibrational excited state and free radicals; dotted line indicates the resulting contribution <0.1%).
Molecules 30 01054 g008
Table 1. Particle species in the model.
Particle SpeciesChemical Formula
Ground-state moleculeN2, H2, NH3
Atom/radical N, H, NH, NH2, NH3, N2H, N2H2, N2H3, N2H4
Excited-state moleculeN2 (v1), N2 (v2), N2 (v3), N2 (v4), N2 (v5), N2 (v6), N2 (v7), N2 (v8), H2 (v1), H2 (v2), H2 (v3), N2 (a’1), N2 (A3), N2 (B3), N2 (C3), N2 (2D), N2 (2P)
Ion N + , N 2 + , N 3 + , N H + , N H 2 + , N H 3 + , N H 4 + , H + , H 2 + , H 3 + , N 2 H + , e, H
Surface-adsorbed particleN (s), H (s), NH (s), NH2 (s), NH3 (s)
Note: X(s) is the surface adsorption site.
Table 2. Collision cross-section data and reaction rate coefficient sources of particle reaction type.
Particle Reaction TypesSource of Collision Cross-Section Data and Reaction Rate Coefficient a
The dissociation reaction of NH3 colliding with electronsRef. [37]
The elastic collision reaction of NH3 with electronsMorgan database
The ionization reaction of NH3 colliding with electronsMorgan database
The vibrational reaction of N2 colliding with electronsPhelps database
The electron excitation reaction of N2 colliding with electronsPhelps database
The elastic collision reaction of N2 colliding with electronsPhelps database
The ionization reaction of N2 colliding with electronsItikawa database
The dissociation reaction of N2 collision with electronsRef. [37]
The elastic collision reaction of H2 colliding with electronsItikawa database
The vibrational reaction of H2 colliding with electronsPhelps database
The electron excitation reaction of H2 colliding with electronsItikawa database
The dissociation reaction of H2 colliding with electronsItikawa database
The ionization reaction of H2 colliding with electronsItikawa database
The electron excitation reaction of N colliding with electronsRef. [37]
The elastic collision reaction of N colliding with electronsRef. [37]
The ionization reaction of N colliding with electronsRef. [37]
The elastic collision reaction of H colliding with electronsRef. [37]
The ionization reaction of H colliding with electronsRef. [37]
Note: a: the reaction rate coefficient in cm3/s.
Table 3. Main reactions of pulsed plasma-catalyzed hydrogen production from ammonia.
Reaction NumberReaction Equation
R-156N + NH2 => H2 + N2
R-46e + NH3 => e + NH + H2
R-177NH + NH => H2 + N2
R-41e + NH2 => e + N+H2
R-488H(s) + H(s) => H2
Disclaimer/Publisher’s Note: The statements, opinions and data contained in all publications are solely those of the individual author(s) and contributor(s) and not of MDPI and/or the editor(s). MDPI and/or the editor(s) disclaim responsibility for any injury to people or property resulting from any ideas, methods, instructions or products referred to in the content.

