Article

Insights from Femtosecond Transient Absorption Spectroscopy into the Structure–Function Relationship of Glyceline Deep Eutectic Solvents

Department of Chemistry, College of Arts and Sciences, Case Western Reserve University, Cleveland, OH 44106, USA
*
Author to whom correspondence should be addressed.
Molecules 2025, 30(5), 1059; https://doi.org/10.3390/molecules30051059
Submission received: 23 January 2025 / Revised: 19 February 2025 / Accepted: 24 February 2025 / Published: 26 February 2025

Abstract

:
This study aimed to determine the structure–function relationship (SFR) for ChCl–glycerol mixtures, a deep eutectic solvent (DES), by investigating their microscopic solvation dynamics and how it relates to their macroscopic properties across varying concentrations of ChCl. Femtosecond transient absorption (fs-TA) spectroscopy revealed two distinct solvation dynamics time constants: τ1, governed by glycerol–glycerol interactions, and τ2, dominated by the choline response. The τ2 minimum at 25–30 mol % ChCl closely aligned with the eutectic composition (~33.33 mol % ChCl), where the glycerol network was the most organized and the choline ions exhibited the fastest relaxation. The viscosity decreased sharply up to ~25 mol % ChCl and then plateaued, while the conductivity increased monotonically with ChCl concentration, reflecting enhanced ionic mobility. The density decreased with both increasing ChCl concentration and temperature, indicating disrupted hydrogen bonding and reduced molecular packing. The polarity, measured using betaine-30 (B30) and the ET(30) polarity scale, increased steeply up to approximately 25 mol % ChCl before reaching a plateau. These findings identified the eutectic composition as the optimal concentration range for balancing stability, fluidity, conductivity, and enhanced dynamics within the glycerol system.

1. Introduction

Globally, the demand for energy is on the rise as the human population increases, resulting in an increased necessity to industrialize. This often entails the utilization of fossil fuels to match the energy demands. To ensure a sustainable future, developing and adopting renewable energy solutions is crucial. Renewable sources like wind, water, and solar are excellent alternatives to fossil fuels but are limited by intermittent and unpredictable availability. Reliable energy storage and efficient transport systems are essential to addressing these challenges. Rechargeable batteries, such as lithium-ion batteries, have revolutionized energy storage and transport but may not suffice for the large-scale electricity demands of the future. A robust and reliable large-scale battery system is necessary to support renewable energy integration and ensure sustainable energy distribution [1]. To sustain more grid-scale operations, redox flow batteries (RFBs) can contribute. Depending on their electrolyte composition, they can have high scalability, longevity, safety, biodegradability, and cost-effectiveness. They provide flexible, long-lasting discharge times, making them ideal for supporting long-term renewable energy storage [2,3,4].
Despite their promise, current RFBs face key challenges that limit their widespread use. Conventional aqueous RFB electrolyte solutions suffer from a narrow electrochemical window, restricting energy density [5]. A potential solution to this issue is to derive RFBs using electrolyte solvents, such as deep eutectic solvents (DESs). A DES is a type of liquid mixture formed by combining two or more components in varying proportions, typically involving a hydrogen bond acceptor (HBA) and a hydrogen bond donor (HBD), which interact through hydrogen bonding to create a eutectic mixture. This interaction significantly lowers the melting point of the mixture compared to the individual components, often resulting in a liquid at room temperature. They were discovered by Abbott et al. in 2004, who found that mixtures consisting of choline chloride (ChCl) as the HBA and urea as the HBD resulted in mixtures with lower melting points than their individual components [6,7]. DESs are considered environmentally friendly alternatives to conventional solvents due to their low toxicity, biodegradability, and ease of preparation. They can be chemically and thermally stable, enabling operation under diverse environmental conditions [8,9]. Their physical and chemical properties are tunable by varying the HBA, HBD, and/or their mixing proportions, making them useful electrolytes in RFBs [1,2,10,11,12,13].
In the past two decades, numerous DES systems have been explored, including reline (1 mol ChCl + 2 mol urea), ethaline (1 mol ChCl + 2 mol ethylene glycol), and glyceline (1 mol ChCl + 2 mol glycerol) [7,11,14,15,16,17,18,19,20,21], to name a few. Some other interesting parameters that have been explored are the effects of co-solvent/water addition [22,23,24,25,26,27,28,29,30,31,32], HBA variation [27,30,33,34,35,36,37], and HBD variation [38,39,40,41,42]. The properties of DESs, are primarily dependent on hydrogen bonding. The complex hydrogen bonding network in DESs significantly impacts their physical and chemical properties, including viscosity, melting point, density, dynamics, and charge transport [18,22,38,43,44,45]. Glycerol-based DESs are of particular interest due to their high hydrogen-bonding capability and the ability to module their viscosity by varying the ChCl content [15]. Although there has been extensive research into DESs, fundamental uncertainties persist regarding the connection between their microscopic solvation dynamics and macroscopic transport properties.
To address these knowledge gaps, we investigated the solvation dynamics of ChCl–glycerol mixtures with varying mol % ChCl concentrations. The goal was to study the solvation dynamics of glycerol-based DESs to ascertain if there is a structure–function relationship (SFR) between their microscopic solvation and their properties such as viscosity, ionic conductivity, and density [26,27,38,46]. The solvation dynamics were investigated by probing the solvent relaxation response to a photoexcited probe molecule, Reichardt’s dye betaine-30 (B30), developed by Christian Reichardt in 1963 [47], which was dissolved in the DES systems. Upon photoexcitation, B30 undergoes an essentially instantaneous [48,49] intramolecular charge transfer (CT), where the electron density shifts from the phenolate group to the pyridinium ring, resulting in a significant change in B30’s dipole moment [50,51,52]. The observed back-electron transfer kinetics are governed by the solvent reorganization response and not by the probe molecule itself. The solvent reorganization process is the slower, rate-limiting step in this mechanism, and the dynamics vary depending on the surrounding solvent environment and not on the probe itself [48,49]. As such, B30 serves as a probe molecule, with its response providing a direct measure of solvent reorganization in DES systems, making it a valuable tool for investigating solvation dynamics in ChCl–glycerol mixtures. In addition to dynamics, polarity was measured using the ET(30) polarity scale, a method that was established by Reichardt [45,47,53,54,55]. This polarity measurement takes advantage of the strong negative solvatochromism of B30. In a more polar system, the UV-Vis absorption band corresponding to the CT process will be further blue-shifted. This is due to the difference in dipole moment of B30’s zwitterionic ground state (+15 Debye) and excited radical state (−6 Debye) [56] (see Scheme 1). The ground state of B30 is more dipolar than its excited state, which makes it more effectively stabilized in polar solvents. As a result, in more polar solvent environments, B30 requires higher-energy light for photoexcitation. This leads to the observed blueshift in its CT absorption band, as described in a recent article on the history and functionality of B30 [45].
Recently, B30 has been employed as a solvatochromic probe to investigate solvation dynamics in various DES mixtures using femtosecond transient absorption (fs-TA) spectroscopy. In ChCl–ethylene glycol systems, Spittle et al. observed that the solvation dynamics were fastest near the eutectic composition (~20 mol % ChCl), a trend that also correlated with enhancements in ionic conductivity [46]. Similarly, Pandian et al. reported that in ChCl–propanediol systems, faster solvation dynamics coincided with increased ionic conductivity [38]. Beyond composition-dependent trends, solvation dynamics have also been explored in relation to other key factors, such as the impact of water addition in ethaline [26] and the effects of halide variation [27,30,33], both of which significantly influence conductivity and other crucial transport properties. While these studies have provided valuable insights into solvation dynamics in DESs, glycerol-based systems remain less explored despite their distinct hydrogen-bonding capabilities and widespread applicability.
In this study, we investigated glycerol-based DESs with varying molar percentages of choline chloride (ChCl). Unlike other HBDs such as ethylene glycol and other diols, glycerol is a triol. The presence of three -OH groups in glycerol means that it has the capability of forming a highly extended hydrogen-bonding network, which significantly impacts some of its properties [57]. As a pure solvent, glycerol molecules can form many hydrogen bonds, with intermolecular hydrogen-bonding being more prevalent than intramolecular ones. Molecular dynamics simulations by Root et al. estimated that in a cluster of 32 glycerol molecules, there would be 99 intermolecular and 5 intramolecular hydrogen bonds, which translates to approximately 3.09 intermolecular and 0.16 intramolecular hydrogen bonds per glycerol molecule [58]. A later study by Zhuang et al. found, through ab initio methods, that each glycerol molecule donates 5.7 intermolecular and 0.8 intramolecular hydrogen bonds [59]. This is in good agreement with the findings of Padró et al., who reported 5.7 hydrogen bonds per glycerol molecule through molecular dynamics simulations, and also noted that ethylene glycol (a diol) forms 3.9 hydrogen bonds per molecule, while mono-alcohols like methanol and ethanol form 1.9 hydrogen bonds per molecule [60]. More recently, Towey et al., combining neutron diffraction with isotopic substitution and empirical potential structure refinement modeling, found that each glycerol molecule donates 5.68 ± 1.51 intermolecular hydrogen bonds, with no evidence of the presence of intramolecular hydrogen bonds [61]. Together, these studies confirm that the hydrogen-bonding network in glycerol is extensive.
The introduction of ChCl into glycerol’s extended hydrogen-bonding network is expected to strongly influence the solvation dynamics, viscosity, ionic conductivity, and density. When ChCl is added, glycerol exhibits stronger hydrogen-bonding interactions with chloride compared to choline. However, despite the increased hydrogen bonding with chloride, intermolecular glycerol–glycerol hydrogen bonding interactions are still dominant, even in as much as 33.33 mol % ChCl [57,62]. While previous studies have highlighted the role of hydrogen bonding in shaping DES properties, the direct link between microscopic solvation dynamics and bulk transport properties remains underexplored in glycerol-based DESs. Using fs-TA spectroscopy, we aimed to better understand how ChCl incorporation affects glycerol’s solvation environment and impacts its functional properties. Establishing these correlations will not only improve our understanding of glycerol-based DESs but also define a clear SFR between solvation dynamics and macroscopic transport properties, offering valuable insight into glycerol-based DESs’ viability as next-generation electrolytes for energy-storage applications. We focused our measurements on 0–33.33 mol % ChCl because our primary focus was to correlate solvation dynamics around the eutectic composition, measuring the trends in conductivity and viscosity in this range of concentrations. Simulating ChCl–glycerol mixtures presents significant challenges due to the complex hydrogen-bonding network between choline, chloride, and glycerol molecules. Therefore, this study focused solely on experimental results to provide insights into the system’s structural and dynamic properties.

2. Results

2.1. Solvent Relaxation Dynamics

Fs-TA measurements were used to investigate the solvent relaxation dynamics following laser-induced CT. The time constants for each system were determined by biexponentially fitting the experimentally obtained kinetic decay traces using Equation (1).
TA(t, λ) = A1 exp(−t/τ1) + A2 exp(−t/τ2)
The fitting parameters included the amplitudes (A1 and A2) and time constants (τ1 and τ2), with R2 values exceeding 0.99. The response of solvent molecules to the electronic rearrangement of B30 follows a biexponential pattern, where the faster time constant, τ1, corresponds to the local solvent response on the picosecond timescale, while the slower component, τ2, captures the complex interactions within the DES hydrogen-bond network [63]. While B30 undergoes a CT upon excitation, the presented analysis focuses on the resulting relaxation dynamics of the ChCl–glycerol system. In the case of these glycerol-based mixtures, τ1 is likely driven by dynamics dominated by the glycerol–glycerol hydrogen bonding network. τ2 is primarily due to choline because in choline halide-based DESs, self-diffusion measurements have revealed that choline is the slowest component in the mixture [11,27,64].
Sample transient spectra are shown in Figure 1a,b at 15 and 22 mol % ChCl, respectively. The negative signal was due to the spectral feature of ground-state bleaching, which is most negative right after photoexcitation. The subsequent recovery of the ground state is depicted by the transient bleaching signal becoming less negative as a function of increasing delay time [65]. From the transient spectra, a kinetic decay trace can be derived, which is shown in Figure 1c,d. Equation (1) was used to biexponentially fit the traces to determine the time constants.
The parameters τ1 and τ2 are dependent on the composition of the mixtures and are portrayed in Figure 2. Regarding the faster component τ1, the dynamics were fastest at lower salt concentrations, reaching a minimum of 28.3 ps at 5 mol % ChCl. Following this, the τ1 dynamics slowed down/increased in value, reaching a plateau at ~20–25 mol % ChCl and it hovered around ~55 ps. For the slower component τ2, there appeared to be two minima: a slower one at ~10 mol % ChCl (~700 ps) and another faster one at 25–30 mol % ChCl (~450 ps).

2.2. Viscosity, Ionic Conductivity, and Density Measurements

The viscosity (η), ionic conductivity (σ), and density (ρ) of the ChCl–glycerol solvent systems with varying mol % ChCl concentrations were measured. The left y-axis of Figure 3 shows the viscosity of the mixture as a function of increasing mol % ChCl, which was monoexponential in nature. As ChCl was added, the viscosity decreased sharply until ~25 mol % ChCl, after which, the viscosity plateaued at ~450 mPa s for the remaining concentrations. The ionic conductivity, represented on the right y-axis of Figure 3, increased monotonically with rising salt concentrations. The density of the mixtures decreased as a function of increasing mol % ChCl, as depicted in Figure 4. When the density was represented as a function of temperature (Figure S1), it decreased as a function of increasing temperature. The viscosity, conductivity, and density results reported in this work are in good agreement with values documented in the literature for ChCl–glycerol systems [15,16,66,67].

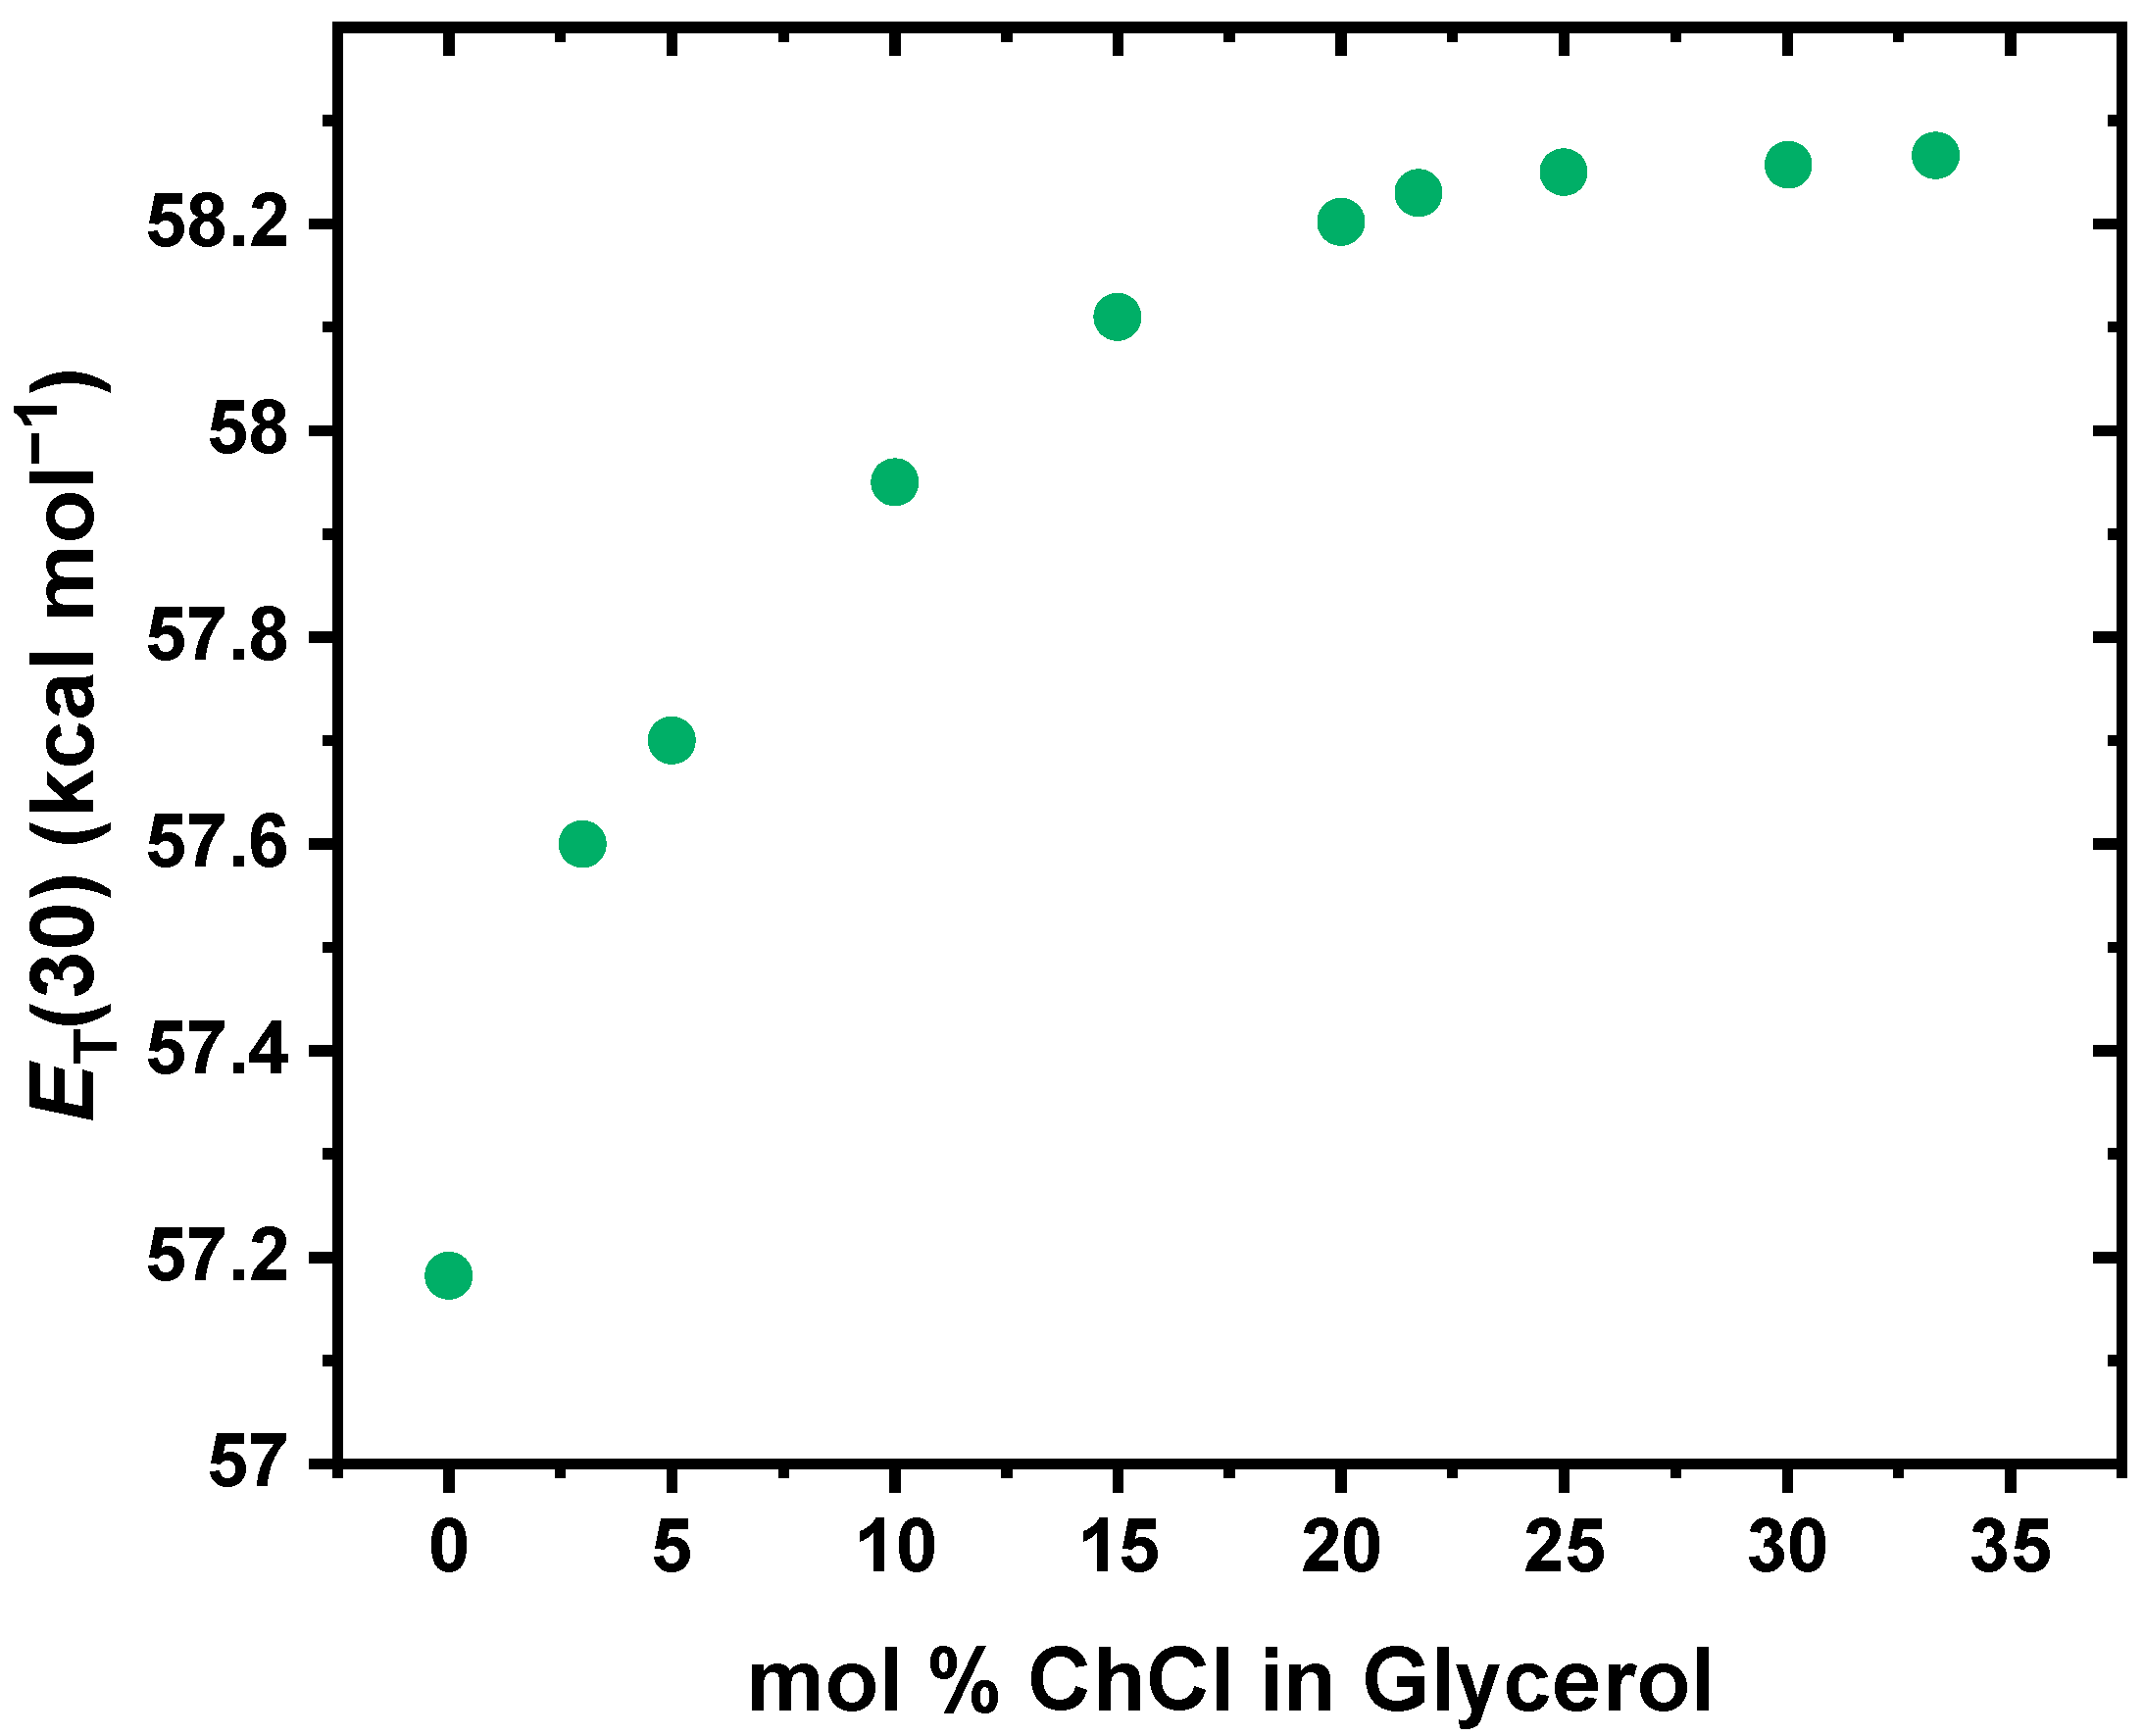
2.3. Solvent Polarity

To determine the solvent polarity, the ET(30) polarity scale, as established by Reichardt, was used. Determination of ET(30) was performed using Equation (2) [45,51,55].
ET(30) (kcal mol−1) = h c NA νmax = 28591/λmax
In this equation, h represents the Planck constant, c is the speed of light, NA is Avogadro’s number, and νmax and λmax correspond to the wavenumber and wavelength, respectively, at the absorption maximum of B30 for its longest-wavelength CT transition (Scheme 1). B30 is negatively solvatochromic, exhibiting a blueshift in the UV-Vis absorbance of the CT band as the solvent system’s polarity increases [26,65,68]. Using Equation (2), a blueshift in the λmax corresponds to higher ET(30) values; thus, a greater ET(30) denotes a solvent system that is more polar. From Figure 5, the ET(30) polarity increased monotonously as the salt concentration increased. As small quantities of ChCl were added (0–10 mol % ChCl), the polarity rose sharply, but then reached a plateau when the ChCl concentrations exceed 25 mol %. This increase in polarity is in good agreement with recent work on similar systems [38].

3. Discussion

The dominance of the glycerol hydrogen-bonding network in glyceline (33.33 mol % ChCl in glycerol) is particularly evident at the eutectic composition, which is at ~33.33 mol % ChCl, according to the work from Abbott et al. [15]. The glycerol hydrogen-bonding network forms a structured framework, similar to that of pure glycerol, where each glycerol molecule forms an average of about 5.7 hydrogen bonds [60,61]. This extensive hydrogen-bonding network remains largely intact at low ChCl concentrations, where glycerol’s network continues to dominate the solvent’s structure [57,62]. The H-bond network serves as the structural framework of the solvent, while choline cations act as a loosely bound species occupying interstitial voids with minimal direct interactions with the glycerol hydrogen-bonding network [62,69]. Upon the addition of ChCl, glycerol–glycerol hydrogen bonds are disrupted as chloride ions compete for hydrogen bonding sites. This results in increased chloride ion coordination with glycerol, integrating chloride into the hydrogen-bonding network [57,69]. The solvation dynamics of ChCl–glycerol mixtures provide valuable insights into the interplay between structural and dynamic behaviors, particularly regarding the role of choline ions. The Fs-TA spectroscopy measurements (sample spectra and kinetics illustrated in Figure 1) reveal two distinct time constants derived from biexponential fitting of the kinetic decay curves (Figure 2). We associated these time constants as follows: τ1 (the faster component) was associated with local solvation dynamics dominated by glycerol–glycerol hydrogen bonding, while τ2 (the slower component) was linked to the bulk solvent dynamics primarily governed by the response of choline ions. The assignment of τ1 to the glycerol hydrogen-bonding network is supported by prior studies on solvation dynamics in DESs. Wagle et al. demonstrated through quasielastic neutron scattering that in 1:2 ChCl–glycerol mixtures, glycerol forms stronger hydrogen bonds with chloride than with choline, leading to an extended hydrogen-bonding network [70]. This may suggest that the solvation dynamics are predominantly governed by glycerol–glycerol and glycerol–chloride interactions, with choline playing a more limited role. While both glycerol–glycerol and glycerol–chloride interactions contribute to solvation dynamics, the glycerol–glycerol interactions are still the most dominant ones, even in as much as 33.33 mol % ChCl, as shown by Turner et al. [57]. Additional support for this assignment comes from self-diffusion measurements of glyceline. D’Agostino et al. reported that at 298 K, glycerol diffuses faster (0.52 × 10¹¹ m2 s−1) than choline (0.38 × 10¹¹ m2 s−1) [64]. Given that τ1 corresponds to the faster relaxation component, it is reasonable to attribute it to solvent reorganization dominated by the glycerol hydrogen-bonding network. Conversely, τ2 is attributed to the slower choline-associated response. This interpretation is consistent with what is measured in the similar ChCl–ethylene glycol-based systems, where τ1 occurs on the order of tens of picoseconds, while τ2 is on the order of hundreds of picoseconds [26,46].
Notably, τ1 initially reached a minimum at 5 mol % ChCl, thereafter steadily increasing and plateauing at 20–25 mol % ChCl. This upward trend suggests that glycerol hydrogen-bonding re-establishes a more organized network as the solvent approaches the eutectic composition. For τ2, two minima were observed: a slower one at ~10 mol % ChCl and a faster one at 25–30 mol % ChCl. The presence of two minima in τ2 seems to be unique to the ChCl–glycerol system, as this was not present in studies performed on diols [38,46]. This may be due to the highly extended hydrogen-bonding network of glycerol [57] or the heterogeneous nature of these mixtures [17]. The faster of the two minima in τ2 between 25 and 30 mol % ChCl closely aligns with the eutectic composition of glyceline (~33.33 mol % ChCl) [15,17]. This τ2 minimum indicates that choline ions attain their fastest relaxation dynamics in this concentration range where choline is most effectively integrated into the glycerol network. Based on the literature [62], we concluded that this integration minimizes the constraints on choline mobility, enabling its faster τ2 relaxation. The interplay between solvent structure and dynamics highlights a novel form of a structure–function relationship, wherein glycerol predominates in the structural organization of the solvent, providing robustness and stability, while the choline ions that are integrated into the glycerol network retain sufficient mobility to enhance the system’s fluidity and conductivity at higher salt concentrations.
Regarding viscosity (Figure 3, left y-axis), there was a marked decrease until 20–25 mol % ChCl, after which, the viscosity decrease became less pronounced to the point where it plateaued at around the eutectic composition. This phenomenon may be elucidated by the τ1 dynamics. As previously mentioned, τ1 decreased initially from 3 to 5 mol %, and then increased steadily until plateauing at 20–25 mol % ChCl. Similarly, the viscosity decreased steadily until it reached a plateau at a similar ChCl concentration. The initial decrease in τ1 reflects localized disruption of the glycerol–glycerol hydrogen-bonding network as chloride anions begin to coordinate with glycerol molecules [16]. However, this disruption was not extensive, as the bulk hydrogen-bonding framework remained intact [62]. As the ChCl concentration increased beyond 5 mol %, the glycerol network may have reorganized to incorporate ionic species more effectively, leading to a steady rise in τ1 and its eventual stabilization at 20 mol %. Despite the reorganization of the glycerol hydrogen-bonding network becoming more efficient with increasing ChCl concentrations, there was still the chloride disrupting a small number of glycerol–glycerol interactions, resulting in the decrease in viscosity that was measured. In terms of conductivity (Figure 3, right y-axis), the conductivity increased almost linearly as a function of increasing mol % ChCl. This increase may be attributed to the augmentation in the number of charged species present in the mixtures concomitant with the addition of ChCl [16]. The observed enhancement in conductivity with increasing ChCl concentration suggests that chloride anions remain relatively free and are not significantly restricted by interactions with glycerol [57]. The solvation dynamics, particularly the τ2 data, revealed a correlation between the fastest relaxation dynamics and the eutectic composition. This solvent structure–function relationship directly aligns with the enhancements in viscosity and conductivity, reflecting optimized structural and dynamic properties near the eutectic composition. Similar trends have recently been reported for ethaline [38,46].
The density (Figure 4) of the ChCl–glycerol system decreased with both increasing ChCl concentration and rising temperature. The nearly linear decline in density with ChCl concentration reflects the progressive disruption of glycerol’s dense hydrogen-bonding network due to the addition of ChCl. While the majority of the extended glycerol–glycerol hydrogen bond network remains intact upon ChCl addition, a small number of those interactions are disrupted as glycerol coordinates with chloride. The incorporation of chloride into this network results in a less compact structure, thus lowering density as the mol % of ChCl increases [37,71]. Similarly, the density decreases with increasing temperature due to thermal expansion and the formation of larger intermolecular voids, which also reduces molecular packing [72].
To assess polarity (Figure 5), the ET(30) polarity scale was employed, wherein higher values correspond to more polar solvent environments [45,54,73]. The polarity increased with rising ChCl concentrations, which aligns with the trends from other solvent systems [38]. This indicates that the polarity and structure of the solvent system is indeed sensitive to ChCl addition, but only to a certain point. Up to 20–25 mol % ChCl, the increase in polarity was steep, which also coincided with a steep decrease in viscosity and density. This phenomenon may be attributed to the initial disruption of the glycerol–glycerol network with small quantities of ChCl (5 mol % ChCl), leading to the formation of some glycerol–chloride hydrogen bonding. As the amount of ChCl increases, the system becomes more ionic in character, enhancing its capacity to stabilize the charge transfer (CT) state of B30. At the higher mol % ChCl region (>25 mol % ChCl), the glycerol hydrogen-bonding network is re-established resulting in the plateauing of ET(30) polarity at approximately the eutectic composition. Additionally, this plateau reflects the saturation of ionic contributions to polarity, as the glyceline system contains sufficient ions to saturate and maximize polarity.

4. Materials and Methods

4.1. Materials

Choline chloride (ChCl) (≥98%), glycerol (≥99.5%), and Reichardt’s dye betaine-30 (B30) were all purchased from Sigma-Aldrich (St. Louis, MO, USA). Scheme 1 depicts the chemicals used in this work.

4.2. Preparation of Solvent Mixtures

The ChCl was dried under a vacuum at 120 °C for 72 h and then stored in a glove box under an argon atmosphere. The glycerol was dried using molecular sieves. For sample preparation, ChCl was weighed in the glove box using an analytical balance (±0.0001 g precision), which was securely sealed to prevent moisture absorption, and then removed from the glove box. A pre-measured quantity of the dried glycerol was added to the ChCl, and the resulting mixture was sonicated with heating for several hours to yield a stock mixture containing 33.33 mol % ChCl in glycerol. From this stock, dilutions were then prepared by mixing calculated amounts of the stock solution with pure glycerol to obtain mixtures with varying mol % ChCl concentrations. For the 0% ChCl sample, only pure glycerol was used without the addition of ChCl. Prior to conducting the measurements, the utmost care was taken to ensure that the samples were sonicated to minimize any heterogeneity. In our experience, sample preparation must be performed in a consistent manner to ensure consistency in the measurements.

4.3. Measurements of Relaxation Dynamics and Solvent Polarity

To measure relaxation dynamics and polarity, a small amount of B30 dye was dissolved into each mixture until an optical density of 0.5 per 0.2 cm optical path length was achieved. A Varian (Santa Clara, CA, USA) Cary 50 UV-Vis spectrophotometer was used to collect steady-state absorption spectra of these B30-enriched mixtures, which had a maximum error of ±1 nm. The position of the CT absorption band maximum was solvatochromic, varying with the solvent. Solvent polarity was assessed using the ET(30) scale, as developed by Reichardt, which capitalizes on the strong solvatochromism of B30 [51,55,68,73,74]. To measure the solvent relaxation and kinetics, femtosecond transient absorption (fs-TA) spectroscopy was performed using B30, as established by Barbara in the 1990s [48,75]. The fs-TA experiment was conducted in triplicate using a Clark MXR (Dexter, MI, USA) CPA-2010 laser system (Ti:Sapphire regenerative amplifier, 780 nm fundamental beam, 130 fs pulse duration, 1 kHz repetition rate, and 850 mW output). The laser beam was split into two pathways: one was frequency-doubled to 390 nm with a β-barium borate crystal for the pump beam, while the other generated a broadband white-light supercontinuum (450–800 nm) with a sapphire crystal for the probe beam. A computer-controlled optical delay stage was employed to introduce delays for measuring the differential absorption spectra. Both steady-state and fs-TA measurements were performed in a 2 mm glass cuvette at room temperature and ambient pressure conditions. Steady-state absorption spectra, collected before and after the fs-TA experiment, confirmed that no photodegradation of B30 occurred. Optical chirp correction was performed using Surface Xplorer software (version 4.3.0), and biexponential fitting and data analysis were carried out using Microcal Origin (version 9.7.5.184); all the errors were less than ± 10%.

4.4. Measurements of Viscosity and Density

The viscosity (η) of the mixtures was determined by introducing approximately 100 µL of the sample into a Rheosense (San Ramon, CA, USA) microVISC viscometer in a temperature-controlled environment at 298 K. The resulting viscosity measurements reported in this work were collected in triplicate and averaged, with the uncertainties provided. The density (ρ) was measured using an Anton-Paar (Graz, Styria, Austria) DMA-5000 density meter at 5 K increments ranging from 298.15 to 323.15 K with a standard deviation ≤ ±0.5 K. The density meter was calibrated using degassed deionized water. The maximum density deviation at 293 K was determined to be 5 × 10⁻⁵ g mL−1.

4.5. Measurements of Ionic Conductivity

The ionic conductivity (σ) was measured using a Thermo Scientific (Waltham, MA, USA) Orion Star A222 conductivity meter with a 2-electrode conductivity cell that has a measurement range of 10 to 2000 mS cm−1 in a temperature-controlled environment at 298 K. Three standard sodium chloride solutions with conductivities of 0.100, 1.413, and 12.9 mS cm−1 were used to calibrate the instrument. The resulting conductivity measurements reported in this work were collected in triplicate, and the results were averaged, with the uncertainties provided.

5. Conclusions

This study explores the structure–function relationship between solvent composition and solvent dynamics in mixtures of ChCl and glycerol by examining their time-resolved solvation dynamics at the molecular level and how these relate to macroscopic transport properties such as viscosity, conductivity, and density. The eutectic composition of glyceline (~33.33 mol % ChCl) represents an optimal balance between structure and dynamics. Near this composition, the hydrogen-bonding network is highly organized, choline ions exhibit their fastest relaxation dynamics (τ2 minimum), and the viscosity stabilizes due to the effective incorporation of ions into the glycerol–glycerol network. The conductivity increases monotonically with ChCl concentration, attributed to the high chloride mobility, while the density decreases with ChCl addition and temperature, reflecting disrupted molecular packing. The polarity, as indicated by ET(30), reaches a plateau near the eutectic composition as the solvent system becomes optimized. These findings highlight the eutectic composition as a critical concentration for achieving an optimal balance of stability, fluidity, conductivity, and, in general, enhanced dynamic solvent properties in eutectic electrolyte systems.

Supplementary Materials

The following supporting information can be downloaded at: https://www.mdpi.com/article/10.3390/molecules30051059/s1, Figure S1: Density as a function of temperature (295.15–323.15 K), with legend representing varying mol % ChCl concentrations in glycerol solutions; Table S1: Maximum CT band absorption wavelength (λmaxabs), ET(30) polarity, and dynamics (τ1, fast; τ2, slow; τavg, average of the two) measurements for ChCl–glycerol systems with various mol % ChCl at 298 K; Table S2: Numerical values of viscosity (η) and ionic conductivity (σ) of ChCl–glycerol mixtures with varying mol % ChCl concentrations at 298 K; Table S3: Densities (ρ) of ChCl–glycerol mixtures with varying mol % ChCl concentrations at different temperatures.

Author Contributions

Conceptualization, R.P.; methodology, R.P.; validation, R.P.; formal analysis, R.P.; investigation, R.P.; writing—original draft preparation, R.P.; writing—review and editing, R.P. and C.B.; visualization, R.P. and C.B.; supervision, C.B.; project administration, C.B.; funding acquisition, C.B. All authors have read and agreed to the published version of the manuscript.

Funding

This research was funded by the Breakthrough Electrolytes for Energy Storage Energy Frontier Research Center (BEES EFRC), supported by the Basic Energy Sciences program, U.S. Department of Energy, Office of Science (Award # DE-SC0019409). C.B. expresses gratitude to CWRU for supporting the Center for Chemical Dynamics and Nanomaterials Research.

Institutional Review Board Statement

Not applicable.

Informed Consent Statement

Not applicable.

Data Availability Statement

The original contributions presented in this study are included in the article/Supplementary Materials. Further inquiries can be directed to the corresponding author.

Conflicts of Interest

The authors declare no conflicts of interest.

References

  1. Pigłowska, M.; Kurc, B.; Galiński, M.; Fuć, P.; Kamińska, M.; Szymlet, N.; Daszkiewicz, P. Challenges for safe electrolytes applied in lithium-ion cells—A review. Materials 2021, 14, 6783. [Google Scholar] [CrossRef] [PubMed]
  2. Weber, A.Z.; Mench, M.M.; Meyers, J.P.; Ross, P.N.; Gostick, J.T.; Liu, Q. Redox flow batteries: A review. J. Appl. Electrochem. 2011, 41, 1137–1164. [Google Scholar] [CrossRef]
  3. Alotto, P.; Guarnieri, M.; Moro, F. Redox flow batteries for the storage of renewable energy: A review. Renew. Sustain. Energy Rev. 2014, 29, 325–335. [Google Scholar] [CrossRef]
  4. Mohamed, M.R.; Sharkh, S.M.; Walsh, F.C. Redox flow batteries for hybrid electric vehicles: Progress and challenges. In Proceedings of the 2009 IEEE Vehicle Power and Propulsion Conference, Dearborn, MI, USA, 7–11 September 2009; pp. 551–557. [Google Scholar] [CrossRef]
  5. Tang, L.; Leung, P.; Xu, Q.; Mohamed, M.R.; Dai, S.; Zhu, X.; Flox, C.; Shah, A.A. Future perspective on redox flow batteries: Aqueous versus nonaqueous electrolytes. Curr. Opin. Chem. Eng. 2022, 37, 100833. [Google Scholar] [CrossRef]
  6. Abbott, A.P.; Boothby, D.; Capper, G.; Davies, D.L.; Rasheed, R.K. Deep Eutectic Solvents formed between choline chloride and carboxylic acids: Versatile alternatives to ionic liquids. J. Am. Chem. Soc. 2004, 126, 9142–9147. [Google Scholar] [CrossRef] [PubMed]
  7. Abbott, A.P.; Capper, G.; Davies, D.L.; Rasheed, R.K.; Tambyrajah, V. Novel solvent properties of choline chloride/urea mixtures. Chem. Commun. 2003, 70–71. [Google Scholar] [CrossRef] [PubMed]
  8. García, G.; Aparicio, S.; Ullah, R.; Atilhan, M. Deep eutectic solvents: Physicochemical properties and gas separation applications. Energy Fuels 2015, 29, 2616–2644. [Google Scholar] [CrossRef]
  9. Zhang, Q.; De Oliveira Vigier, K.; Royer, S.; Jérôme, F. Deep eutectic solvents: Syntheses, properties and applications. Chem. Soc. Rev. 2012, 41, 7108–7146. [Google Scholar] [CrossRef] [PubMed]
  10. Wu, J.; Liang, Q.; Yu, X.; Qiu-Feng, L.; Ma, L.; Qin, X.; Chen, G.; Li, B. Deep Eutectic Solvents for Boosting Electrochemical Energy Storage and Conversion: A Review and Perspective. Adv. Funct. Mater. 2021, 31, 2011102. [Google Scholar] [CrossRef]
  11. Hansen, B.B.; Spittle, S.; Chen, B.; Poe, D.; Zhang, Y.; Klein, J.M.; Horton, A.; Adhikari, L.; Zelovich, T.; Doherty, B.W.; et al. Deep Eutectic Solvents: A Review of Fundamentals and Applications. Chem. Rev. 2021, 121, 1232–1285. [Google Scholar] [CrossRef]
  12. Ijardar, S.P.; Singh, V.; Gardas, R.L. Revisiting the Physicochemical Properties and Applications of Deep Eutectic Solvents. Molecules 2022, 27, 1368. [Google Scholar] [CrossRef] [PubMed]
  13. Miller, M.A.; Wainright, J.S.; Savinell, R.F. Communication—Iron Ionic Liquid Electrolytes for Redox Flow Battery Applications. J. Electrochem. Soc. 2016, 163, A578–A579. [Google Scholar] [CrossRef]
  14. Smith, E.L.; Abbott, A.P.; Ryder, K.S. Deep Eutectic Solvents (DESs) and Their Applications. Chem. Rev. 2014, 114, 11060–11082. [Google Scholar] [CrossRef]
  15. Abbott, A.P.; Cullis, P.M.; Gibson, M.J.; Harris, R.C.; Raven, E. Extraction of glycerol from biodiesel into a eutectic based ionic liquid. Green Chem. 2007, 9, 868–872. [Google Scholar] [CrossRef]
  16. Abbott, A.P.; Harris, R.C.; Ryder, K.S.; D’Agostino, C.; Gladden, L.F.; Mantle, M.D. Glycerol eutectics as sustainable solvent systems. Green Chem. 2011, 13, 82–90. [Google Scholar] [CrossRef]
  17. Spittle, S.; Poe, D.; Doherty, B.; Kolodziej, C.; Heroux, L.; Haque, M.A.; Squire, H.; Cosby, T.; Zhang, Y.; Fraenza, C.; et al. Evolution of microscopic heterogeneity and dynamics in choline chloride-based deep eutectic solvents. Nat. Commun. 2022, 13, 219. [Google Scholar] [CrossRef] [PubMed]
  18. Zhang, Y.; Poe, D.; Heroux, L.; Squire, H.; Doherty, B.W.; Long, Z.; Dadmun, M.; Gurkan, B.; Tuckerman, M.E.; Maginn, E.J. Liquid Structure and Transport Properties of the Deep Eutectic Solvent Ethaline. J. Phys. Chem. B 2020, 124, 5251–5264. [Google Scholar] [CrossRef] [PubMed]
  19. Kalhor, P.; Xu, J.; Ashraf, H.; Cao, B.; Yu, Z.-W. Structural Properties and Hydrogen-Bonding Interactions in Binary Mixtures Containing a Deep-Eutectic Solvent and Acetonitrile. J. Phys. Chem. B 2020, 124, 1229–1239. [Google Scholar] [CrossRef]
  20. Kumari, P.; Shobhna; Kaur, S.; Kashyap, H.K. Influence of Hydration on the Structure of Reline Deep Eutectic Solvent: A Molecular Dynamics Study. ACS Omega 2018, 3, 15246–15255. [Google Scholar] [CrossRef]
  21. Azmi, S.; Koudahi, M.F.; Frackowiak, E. Reline deep eutectic solvent as a green electrolyte for electrochemical energy storage applications. Energy Environ. Sci. 2022, 15, 1156–1171. [Google Scholar] [CrossRef]
  22. Yadav, A.; Kar, J.R.; Verma, M.; Naqvi, S.; Pandey, S. Densities of aqueous mixtures of (choline chloride + ethylene glycol) and (choline chloride + malonic acid) deep eutectic solvents in temperature range 283.15–363.15 K. Thermochim. Acta 2015, 600, 95–101. [Google Scholar] [CrossRef]
  23. Celebi, A.T.; Vlugt, T.J.H.; Moultos, O.A. Structural, Thermodynamic, and Transport Properties of Aqueous Reline and Ethaline Solutions from Molecular Dynamics Simulations. J. Phys. Chem. B 2019, 123, 11014–11025. [Google Scholar] [CrossRef]
  24. LaRocca, M.M.; Baker, G.A.; Heitz, M.P. Assessing rotation and solvation dynamics in ethaline deep eutectic solvent and its solutions with methanol. J. Chem. Phys. 2021, 155, 034505. [Google Scholar] [CrossRef] [PubMed]
  25. Wang, Y.; Ma, C.; Liu, C.; Lu, X.; Feng, X.; Ji, X. Thermodynamic Study of Choline Chloride-Based Deep Eutectic Solvents with Water and Methanol. J. Chem. Eng. Data 2020, 65, 2446–2457. [Google Scholar] [CrossRef]
  26. Alfurayj, I.; Fraenza, C.C.; Zhang, Y.; Pandian, R.; Spittle, S.; Hansen, B.; Dean, W.; Gurkan, B.; Savinell, R.; Greenbaum, S.; et al. Solvation Dynamics of Wet Ethaline: Water is the Magic Component. J. Phys. Chem. B 2021, 125, 8888–8901. [Google Scholar] [CrossRef] [PubMed]
  27. Alfurayj, I.; Fraenza, C.C.; Pandian, R.; Greenbaum, S.; Burda, C. Solvation dynamics of choline fluoride in ethylene glycol—Water mixtures. J. Mol. Liq. 2023, 392, 123448. [Google Scholar] [CrossRef]
  28. Baz, J.; Held, C.; Pleiss, J.; Hansen, N. Thermophysical properties of glyceline–water mixtures investigated by molecular modelling. Phys. Chem. Chem. Phys. 2019, 21, 6467–6476. [Google Scholar] [CrossRef] [PubMed]
  29. Prado, D.M.; Shen, X.; Savinell, R.; Burda, C. Hydrodynamic voltammetry of Fe2+/3+ in aqueous deep eutectic solvents towards redox flow batteries. Electrochim. Acta 2023, 467, 143082. [Google Scholar] [CrossRef]
  30. Alfurayj, I.; Prado, D.M.; Prado, R.C.; Samia, A.C.; Burda, C. Unusual Hydration Properties of Choline Fluoride-Based Deep Eutectic Solvents. J. Phys. Chem. B 2024, 128, 2762–2772. [Google Scholar] [CrossRef] [PubMed]
  31. Aravena, P.; Cea-Klapp, E.; Gajardo-Parra, N.F.; Held, C.; Garrido, J.M.; Canales, R.I. Effect of water and hydrogen bond acceptor on the density and viscosity of glycol-based eutectic solvents. J. Mol. Liq. 2023, 389, 122856. [Google Scholar] [CrossRef]
  32. Gajardo-Parra, N.F.; Lubben, M.J.; Winnert, J.M.; Leiva, Á.; Brennecke, J.F.; Canales, R.I. Physicochemical properties of choline chloride-based deep eutectic solvents and excess properties of their pseudo-binary mixtures with 1-butanol. J. Chem. Thermodyn. 2019, 133, 272–284. [Google Scholar] [CrossRef]
  33. Alfurayj, I.; Pandian, R.; Springer, S.; Burda, C. Choline Fluoride-Ethylene glycol deep eutectic solvent mixture—Synthesis and physicochemical properties. J. Mol. Liq. 2023, 386, 122454. [Google Scholar] [CrossRef]
  34. Migliorati, V.; D’Angelo, P. Deep eutectic solvents: A structural point of view on the role of the anion. Chem. Phys. Lett. 2021, 777, 138702. [Google Scholar] [CrossRef]
  35. Hossain, S.S.; Sneha, P.; Samanta, A. Complete Solvation Dynamics of Coumarin 153 in Tetraalkylammonium Bromide-Based Deep Eutectic Solvents. J. Phys. Chem. B 2020, 124, 2473–2481. [Google Scholar] [CrossRef]
  36. Rahman, M.B.A.; Jumbri, K.; Basri, M.; Abdulmalek, E.; Sirat, K.; Salleh, A.B. Synthesis and physico-chemical properties of new tetraethylammonium-based amino acid chiral ionic liquids. Molecules 2010, 15, 2388–2397. [Google Scholar] [CrossRef] [PubMed]
  37. Yusof, R.; Abdulmalek, E.; Sirat, K.; Rahman, M.B.A. Tetrabutylammonium bromide (TBABr)-Based deep eutectic solvents (DESs) and their physical properties. Molecules 2014, 19, 8011–8026. [Google Scholar] [CrossRef]
  38. Pandian, R.; Kim, D.; Zhang, Y.; Alfurayj, I.; Prado, D.M.; Maginn, E.; Burda, C. Chain length and OH-spacing effects on diol-based deep eutectic solvents. J. Mol. Liq. 2024, 393, 123534. [Google Scholar] [CrossRef]
  39. Xu, L.H.; Wu, D.; Zhong, M.; Wang, G.B.; Chen, X.Y.; Zhang, Z.J. The construction of a new deep eutectic solvents system based on choline chloride and butanediol: The influence of the hydroxyl position of butanediol on the structure of deep eutectic solvent and supercapacitor performance. J. Power Sources 2021, 490, 229365. [Google Scholar] [CrossRef]
  40. Bachrach, S.M. Microsolvation of 1,4-butanediol: The competition between intra- and intermolecular hydrogen bonding. J. Phys. Chem. A 2014, 118, 1123–1131. [Google Scholar] [CrossRef]
  41. Cerar, J.; Jamnik, A.; Tomšič, M. Supra-molecular structure and rheological aspects of liquid terminal 1,n-diols from ethylene glycol, 1,3-propandiol, 1,4-butanediol to 1,5-pentanediol. J. Mol. Liq. 2019, 276, 307–317. [Google Scholar] [CrossRef]
  42. Gajardo-Parra, N.F.; Cotroneo-Figueroa, V.P.; Aravena, P.; Vesovic, V.; Canales, R.I. Viscosity of Choline Chloride-Based Deep Eutectic Solvents: Experiments and Modeling. J. Chem. Eng. Data 2020, 65, 5581–5592. [Google Scholar] [CrossRef]
  43. Wagle, D.V.; Deakyne, C.A.; Baker, G.A. Quantum Chemical Insight into the Interactions and Thermodynamics Present in Choline Chloride Based Deep Eutectic Solvents. J. Phys. Chem. B 2016, 120, 6739–6746. [Google Scholar] [CrossRef] [PubMed]
  44. Mjalli, F.S.; Ahmed, O.U. Physical properties and intermolecular interaction of eutectic solvents binary mixtures: Reline and ethaline. Asia-Pac. J. Chem. Eng. 2016, 11, 549–557. [Google Scholar] [CrossRef]
  45. Pandian, R.; Burda, H.; Alfurayj, I.; Reichardt, C.; Burda, C. 60 Years of Betaine 30—From Solvatochromic Discovery to Future Frontiers. J. Phys. Chem. B 2024, 128, 6990–7001. [Google Scholar] [CrossRef] [PubMed]
  46. Spittle, S.; Alfurajy, I.; Hansen, B.B.; Glynn, K.; Brackett, W.; Pandian, R.; Burda, C.; Sangoro, J. Enhanced Dynamics and Charge Transport at the Eutectic Point: A New Paradigm for the Use of Deep Eutectic Solvent Systems. JACS Au 2023, 3, 3024–3030. [Google Scholar] [CrossRef] [PubMed]
  47. Dimroth, K.; Reichardt, C.; Siepmann, T.; Bohlmann, F. Über Pyridinium-N-phenol-betaine und ihre Verwendung zur Charakterisierung der Polarität von Lösungsmitteln. Justus Liebigs Ann. Chem. 1963, 661, 1–37. [Google Scholar] [CrossRef]
  48. Reid, P.J.; Barbara, P.F. Dynamic Solvent Effect on Betaine-30 Electron-Transfer Kinetics in Alcohols. J. Phys. Chem. 1995, 99, 3554–3565. [Google Scholar] [CrossRef]
  49. Mente, S.R.; Maroncelli, M. Computer simulations of the solvatochromism of betaine-30. J. Phys. Chem. B 1999, 103, 7704–7719. [Google Scholar] [CrossRef]
  50. Lobaugh, J.; Rossky, P.J. Solvent and intramolecular effects on the absorption spectrum of betaine-30. J. Phys. Chem. A 2000, 104, 899–907. [Google Scholar] [CrossRef]
  51. Reichardt, C. Polarity of ionic liquids determined empirically by means of solvatochromic pyridinium N-phenolate betaine dyes. Green Chem. 2005, 7, 339–351. [Google Scholar] [CrossRef]
  52. Budzák, Š.; Jaunet-Lahary, T.; Laurent, A.D.; Laurence, C.; Medved, M.; Jacquemin, D. Exploring the Solvatochromism of Betaine 30 with Ab Initio Tools: From Accurate Gas-Phase Calculations to Implicit and Explicit Solvation Models. Chem. Eur. J. 2017, 23, 4108–4119. [Google Scholar] [CrossRef]
  53. Burda, H.; Hsieh, I.; Burda, C.; Parson, W.W. Entropy-Enthalpy Compensation in Electron-Transfer Processes. J. Phys. Chem. Lett. 2024, 15, 3946–3952. [Google Scholar] [CrossRef]
  54. Reichardt, C. Solvation Effects in Organic Chemistry: A Short Historical Overview. J. Org. Chem. 2022, 87, 1616–1629. [Google Scholar] [CrossRef] [PubMed]
  55. Reichardt, C. Solvatochromic Dyes as Solvent Polarity Indicators. Chem. Rev. 1994, 94, 2319–2358. [Google Scholar] [CrossRef]
  56. Beard, M.C.; Turner, G.M.; Schmuttenmaer, C.A. Measuring Intramolecular Charge Transfer via Coherent Generation of THz Radiation. J. Phys. Chem. A 2002, 106, 878–883. [Google Scholar] [CrossRef]
  57. Turner, A.H.; Holbrey, J.D. Investigation of glycerol hydrogen-bonding networks in choline chloride/glycerol eutectic-forming liquids using neutron diffraction. Phys. Chem. Chem. Phys. 2019, 21, 21782–21789. [Google Scholar] [CrossRef] [PubMed]
  58. Root, L.J.; Stillinger, F.H. Short-range order in glycerol. A molecular dynamics study. J. Chem. Phys. 1989, 90, 1200–1208. [Google Scholar] [CrossRef]
  59. Zhuang, W.; Dellago, C. Dissociation of Hydrogen Chloride and Proton Transfer in Liquid Glycerol: An Ab Initio Molecular Dynamics Study. J. Phys. Chem. B 2004, 108, 19647–19656. [Google Scholar] [CrossRef]
  60. Padró, J.A.; Saiz, L.; Guàrdia, E. Hydrogen bonding in liquid alcohols: A computer simulation study. J. Mol. Struct. 1997, 416, 243–248. [Google Scholar] [CrossRef]
  61. Towey, J.J.; Soper, A.K.; Dougan, L. The structure of glycerol in the liquid state: A neutron diffraction study. Phys. Chem. Chem. Phys. 2011, 13, 9397–9406. [Google Scholar] [CrossRef] [PubMed]
  62. Faraone, A.; Wagle, D.V.; Baker, G.A.; Novak, E.C.; Ohl, M.; Reuter, D.; Lunkenheimer, P.; Loidl, A.; Mamontov, E. Glycerol Hydrogen-Bonding Network Dominates Structure and Collective Dynamics in a Deep Eutectic Solvent. J. Phys. Chem. B 2018, 122, 1261–1267. [Google Scholar] [CrossRef] [PubMed]
  63. Jimenez, R.; Fleming, G.R.; Kumar, P.V.; Maroncelli, M. Femtosecond solvation dynamics of water. Nature 1994, 369, 471–473. [Google Scholar] [CrossRef]
  64. D’Agostino, C.; Harris, R.C.; Abbott, A.P.; Gladden, L.F.; Mantle, M.D. Molecular motion and ion diffusion in choline chloride based deep eutectic solvents studied by 1H pulsed field gradient NMR spectroscopy. Phys. Chem. Chem. Phys. 2011, 13, 21383–21391. [Google Scholar] [CrossRef] [PubMed]
  65. Kovalenko, S.A.; Eilers-König, N.; Senyushkina, T.A.; Ernsting, N.P. Charge transfer and solvation of betaine-30 in polar solvents—A femtosecond broadband transient absorption study. J. Phys. Chem. A 2001, 105, 4834–4843. [Google Scholar] [CrossRef]
  66. Alomar, M.K.; Hayyan, M.; Alsaadi, M.A.; Akib, S.; Hayyan, A.; Hashim, M.A. Glycerol-based deep eutectic solvents: Physical properties. J. Mol. Liq. 2016, 215, 98–103. [Google Scholar] [CrossRef]
  67. Abbott, A.P. Application of hole theory to the viscosity of ionic and molecular liquids. ChemPhysChem 2004, 5, 1242–1246. [Google Scholar] [CrossRef]
  68. Reichardt, C. Pyridinium N-phenolate betaine dyes as empirical indicators of solvent polarity: Some new findings. Pure Appl. Chem. 2004, 76, 1903–1919. [Google Scholar] [CrossRef]
  69. Fraenza, C.C.; Elgammal, R.A.; Garaga, M.N.; Bhattacharyya, S.; Zawodzinski, T.A.; Greenbaum, S.G. Dynamics of Glyceline and Interactions of Constituents: A Multitechnique NMR Study. J. Phys. Chem. B 2022, 126, 890–905. [Google Scholar] [CrossRef] [PubMed]
  70. Wagle, D.V.; Baker, G.A.; Mamontov, E. Differential Microscopic Mobility of Components within a Deep Eutectic Solvent. J. Phys. Chem. Lett. 2015, 6, 2924–2928. [Google Scholar] [CrossRef]
  71. Sazali, A.L.; AlMasoud, N.; Amran, S.K.; Alomar, T.S.; Pa’ee, K.F.; El-Bahy, Z.M.; Yong, T.-L.K.; Dailin, D.J.; Chuah, L.F. Physicochemical and thermal characteristics of choline chloride-based deep eutectic solvents. Chemosphere 2023, 338, 139485. [Google Scholar] [CrossRef] [PubMed]
  72. Nowosielski, B.; Jamrógiewicz, M.; Łuczak, J.; Śmiechowski, M.; Warmińska, D. Experimental and predicted physicochemical properties of monopropanolamine-based deep eutectic solvents. J. Mol. Liq. 2020, 309, 113110. [Google Scholar] [CrossRef]
  73. Reichardt, C. Empirical Parameters of the Polarity of Solvents. Angew. Chem. Int. Ed. Engl. 1965, 4, 29–40. [Google Scholar] [CrossRef]
  74. Reichardt, C. Empirische Parameter der Lösungsmittelpolarität. Angew. Chem. 1965, 77, 30–40. [Google Scholar] [CrossRef]
  75. Åkesson, E.; Walker, G.C.; Barbara, P.F. Dynamic solvent effects on electron transfer rates in the inverted regime: Ultrafast studies on the betaines. J. Chem. Phys. 1991, 95, 4188–4194. [Google Scholar] [CrossRef]
Scheme 1. Representative molecular structures for the laser pulse-induced intramolecular charge transfer process that occurs in B30 upon its photoexcitation from its Zwitterionic ground state to its radicalized excited state, depicted from left to right. The structures of ChCl and glycerol are also shown.
Molecules 30 01059 sch001
Figure 1. Sample fs-TA spectra of B30 dissolved in (a) 15 mol % and (b) 22 mol % ChCl in glycerol. The negative signal primarily corresponds to ground-state bleaching. As the delay time increases, the signal becomes less negative, which shows the recovery of the ground state. The corresponding biexponential kinetic decay traces are shown in panels (c,d), respectively. Fitting was performed in the spectral range of λfitted = 500–600 nm. T = 298 K.
Molecules 30 01059 g001
Figure 2. Fast (τ1; blue y-axis on left) and slow (τ2; red y-axis on right) solvent relaxation components for the ChCl–glycerol mixture as a function of mol % ChCl. There is a clear minimum in τ1 at ~5 mol % ChCl, followed by an increase and plateauing after ~20–25 mol % ChCl. For τ2, there are two distinct minima, with the slower one at ~10 mol % ChCl and the faster one at ~25–30 mol % ChCl. The kinetics data were acquired from fitting the transient absorption spectra at λfitted = 500–600 nm. See Table S1 for numerical values. T = 298 K.
Molecules 30 01059 g002
Figure 3. Viscosity (left y-axis) and ionic conductivity (right y-axis) as a function of mol % ChCl in glycerol. Viscosity decreases as ChCl is added, until it plateaus after ~25 mol ChCl. Conductivity increases monotonically throughout the entire composition range. See Table S2 for numerical values and standard deviations. N = 3, T = 298 K.
Molecules 30 01059 g003
Figure 4. Density of glyceline as a function of mol % ChCl in glycerol. The legend depicts the data points representing the various temperatures from 298.15 to 323.15 K in 5 K increments. See Table S3 for numerical values and standard deviations. See Figure S1 for density represented as a function of temperature. N = 3.
Molecules 30 01059 g004
Figure 5. ET(30) polarity versus mol % ChCl in glycerol. The increase in polarity plateaus at >25 mol % ChCl. See Table S1 for numerical values. T = 298 K.
Molecules 30 01059 g005
Disclaimer/Publisher’s Note: The statements, opinions and data contained in all publications are solely those of the individual author(s) and contributor(s) and not of MDPI and/or the editor(s). MDPI and/or the editor(s) disclaim responsibility for any injury to people or property resulting from any ideas, methods, instructions or products referred to in the content.

