

Honey: Inorganic Composition as Possible Marker for Botanical and Geological Assignment

 ,
,  ,
,  and
and 
Abstract
:1. Introduction
1.1. Honey
1.2. Adulteration and Directive
1.3. Analytical Techniques Commonly Used for Honey Origin Determination
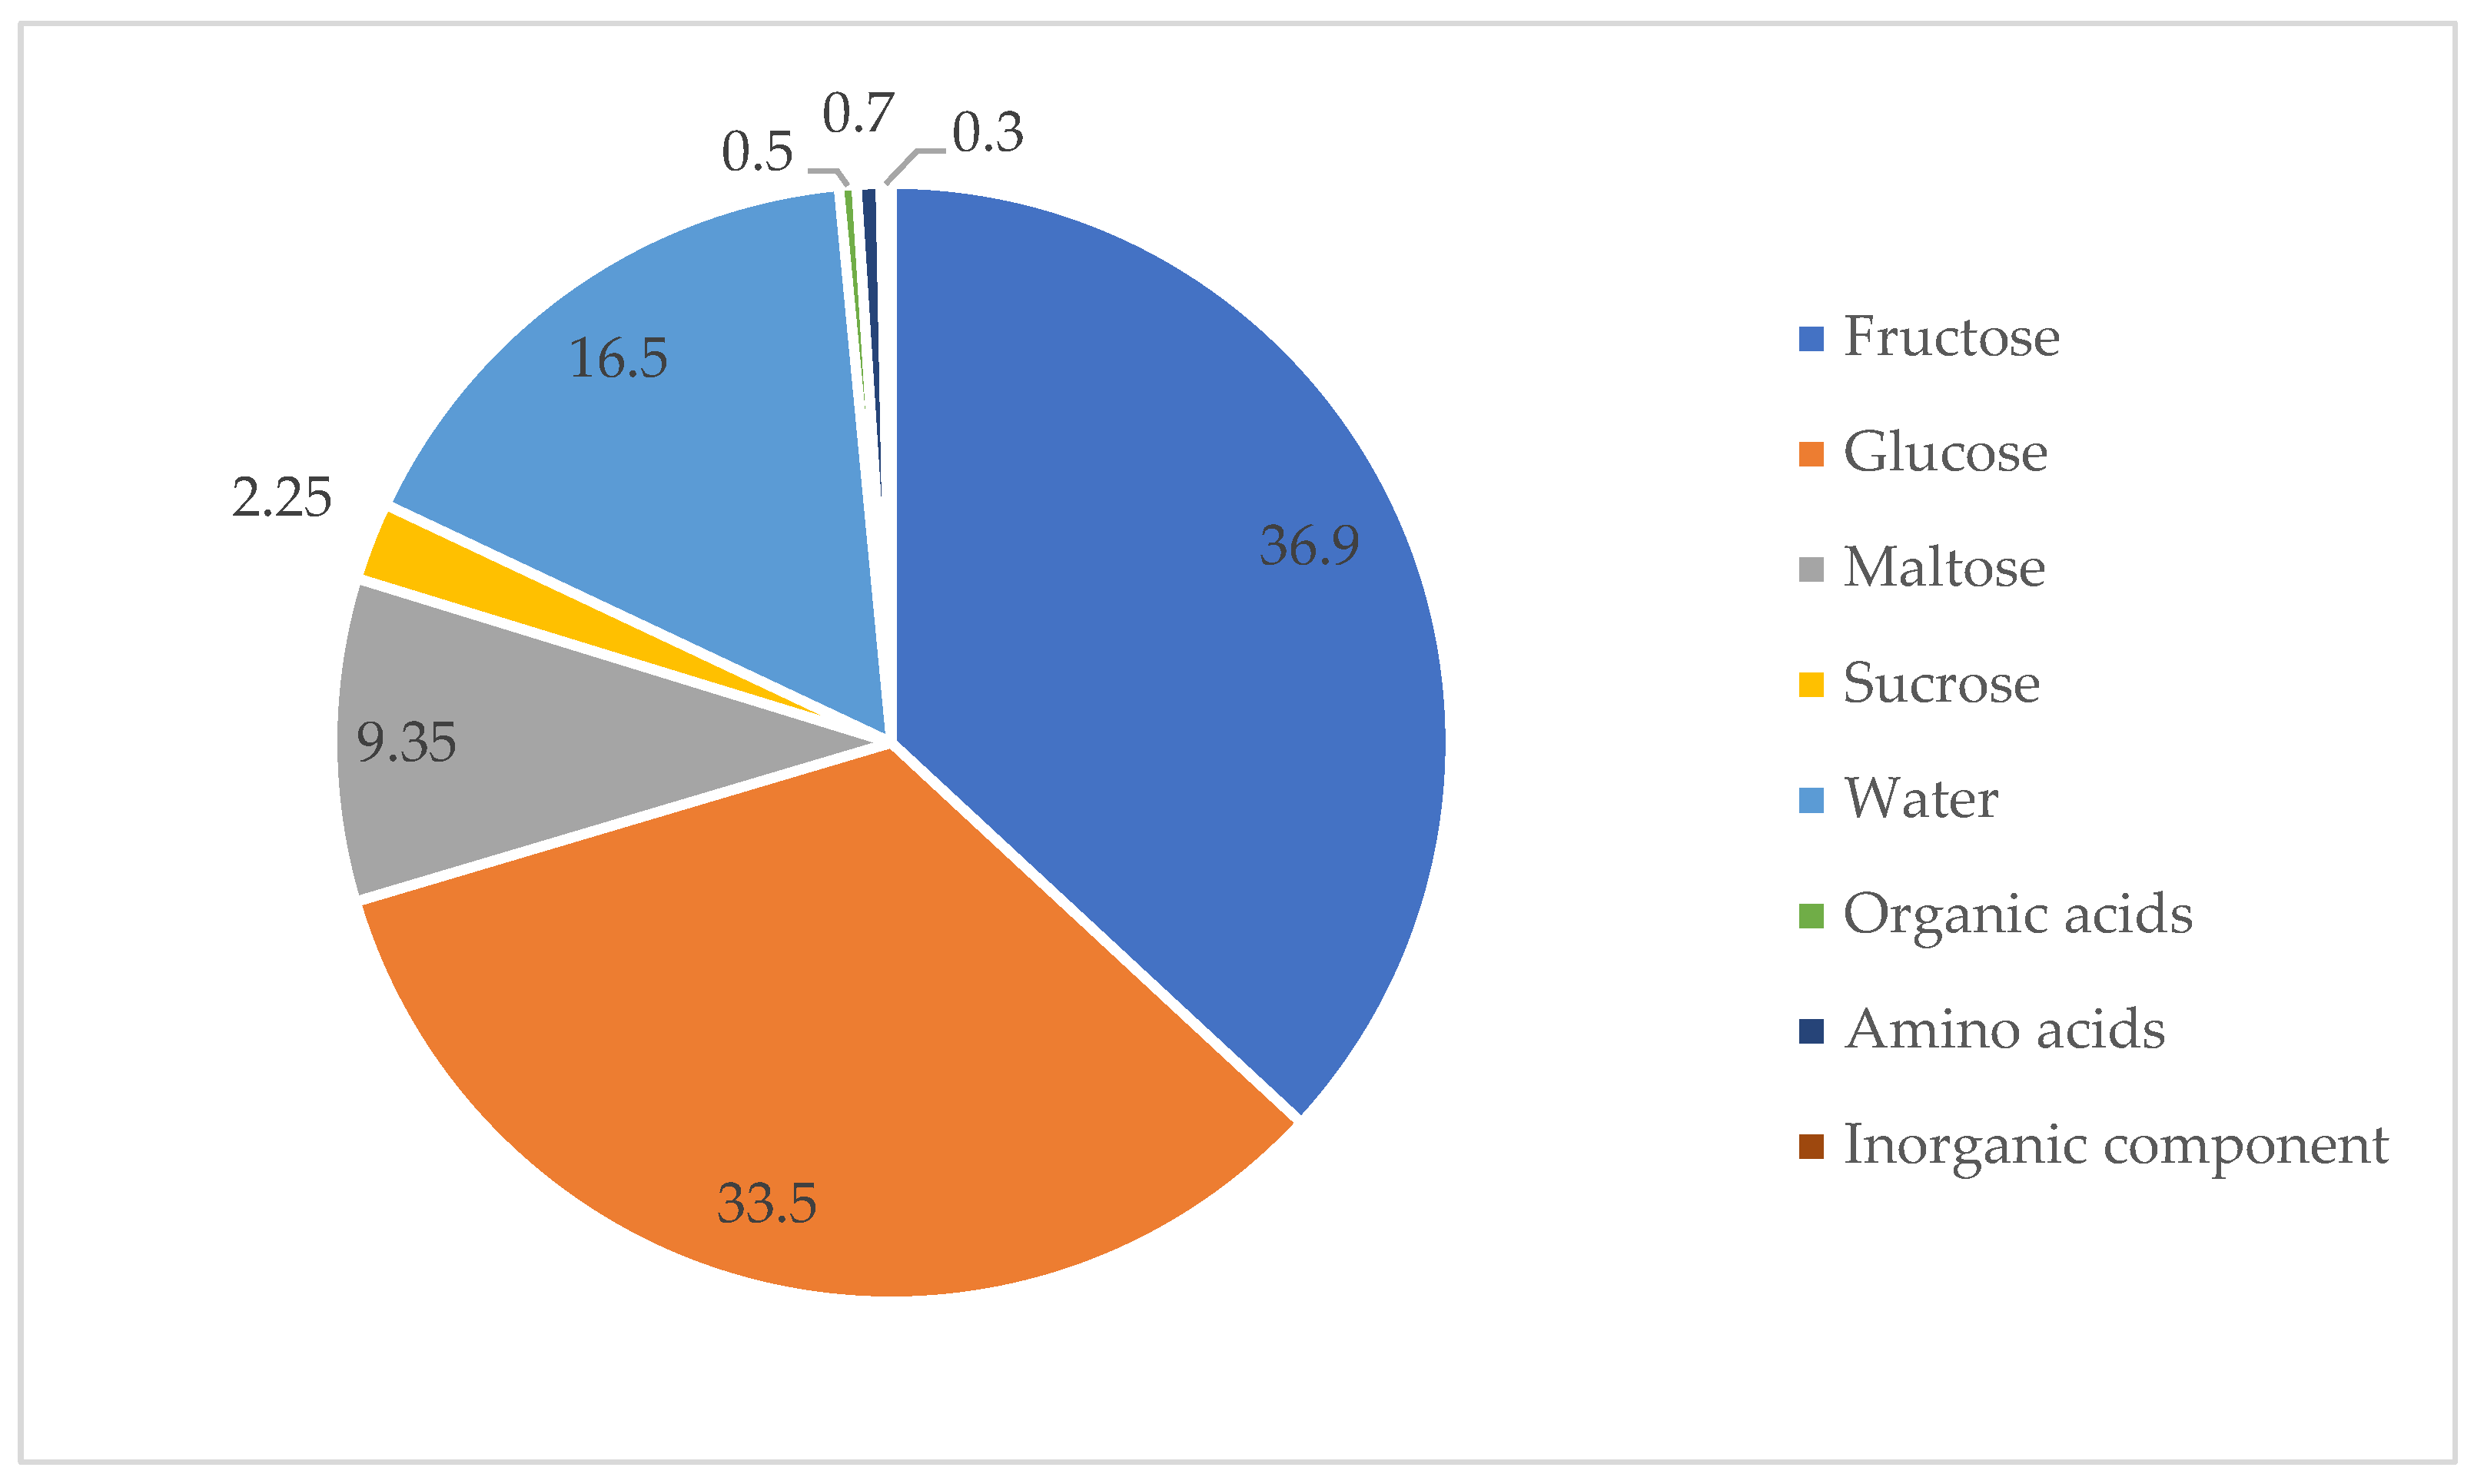
1.4. Chemical Composition
2. Chemical–Physical Properties
2.1. Free Acidity and pH
2.2. Optical Activity
2.3. Color
2.4. Ash Content
2.5. Electrical Conductivity
2.6. Density
2.7. Viscosity
2.8. Melting Point
2.9. Humidity
2.10. The Inorganic Component
2.11. Items of Interest for Honey Characterization
2.12. Inorganic Component in Honey
- Major elements (Na, K, Ca, Mg, P, S, and Cl), required in humans in concentrations greater than 50 mg/g;
- Trace elements (Fe, I, F, Zn, Cu, Mn, Co, and Ni), required in concentrations lower than 50 mg/g;
- Ultra-trace elements (Al, As, B, Bo, Sn, and Pb) present in quantities ranging from 50 ng/g to 1 µg/g [51].
3. Procedures for Metal Characterization
3.1. Pretreatment
3.2. Sample Decomposition
3.3. Incineration
3.4. Acid Mineralization

| Sample Weight (g) | Description | References |
|---|---|---|
| 0.5 | Amounts of 4 mL of HNO3 and 2 mL of H2O2 are added to the sample. Microwave oven mineralization (4 min, 500 W; 5 min, 1000 W; 10 min, 1400 W) is applied. After cooling, the solution obtained is diluted to 50 mL with High Purity Water (HPW). | [81] |
| 0.5 | Amounts of 5 mL of HNO3, 4 mL of HPW, and 1 mL of yttrium are added to the sample. After cooling, the solution obtained is diluted to 13 mL. | [82] |
| 0.7–0.8 | Amounts of 8 mL of HNO3 and 2 mL of H2O2 are added to the sample. Microwave oven mineralization (20 min, 600 W) is applied. After cooling, the solution obtained is diluted to 50 mL with HPW. | [85] |
| 0.8 | Amounts of 3.5 mL of HNO3 and 1.5 mL of H2O2 are added to the sample. Microwave oven mineralization (15 min, 120 °C; 15 min, 120 °C; 15 min, 200 °C; 15 min, 200 °C) is applied. After cooling, the solution obtained is diluted to 15 mL with HPW. | [44] |
| 0.4 | Pretreatment at 40 °C after adding 7 mL of HNO3 and 1 mL of H2O2. Microwave oven mineralization (30 min, 200 °C) is applied. After cooling, the solution obtained is diluted to 25 mL with HPW. | [74] |
| 0.5 | A total of 7 mL of HNO3 is added to the sample. After 1 h, 2 mL of H2O2 are added. Microwave oven mineralization (20 min, 0–200 °C; 15 mL, 40 °C) is applied. After cooling, the solution obtained is diluted to 25 mL with HPW. | [83] |
| 5 | Amounts of 25 mL of HNO3 and 10 mL of HClO4 are added. The acidified sample is placed on a heating plate until completely dehydrated. After cooling, it is diluted to 50 mL with HPW. | [50] |
| 1 | Amounts of 7 mL of HNO3 and 1 mL of H2O2 are added to the sample. After 12 h, microwave oven mineralization (25 min, 200 °C) is applied. After cooling, the solution obtained is diluted to 50 mL with HPW. | [86] |
| 5 | The sample is incinerated at 600 °C. The ashes are added to 2 mL of HNO3 and 2 mL of H2O2. The mixture is stirred and then heated on a hotplate to almost complete dryness. The solution obtained is diluted to 25 mL with HPW. | [78] |
| 15 | The sample is incinerated at 550 °C. The ashes are added to HNO3 and HCl (1:1). The solution obtained is diluted to 100 mL with HPW. | [79] |
| 5 | The sample is incinerated. The ashes are added to 5 mL of HNO3 and 1 mL of H2O2. The mixture is stirred and then heated on a hotplate to almost complete dryness. The solution obtained is diluted to 10 mL with HPW. | [73] |
| 0.5 | A total of 5 mL of HNO3 is added to the sample. After 24 h, 2 mL of H2O2 are added. Microwave oven mineralization is applied. The solution obtained is diluted to 50 mL with HPW. | [87] |
| 1 | The sample is pretreated at 40 °C and sonicated. Amounts of 4 mL of HNO3 and 1 mL of H2O2 are added. Microwave oven mineralization is applied | [84] |
| 1–1.5 | Amounts of 7 mL of HNO3 and 1.50 mL of H2O2 are added to the sample. Microwave oven mineralization is applied. The solution obtained is diluted to 50 mL with HPW. | [7] |
3.5. Direct Analysis
3.6. Analytical Techniques
3.7. Analysis of Botanical Provenance
3.8. Investigation of Geographical Origin
4. Chemometric Treatment
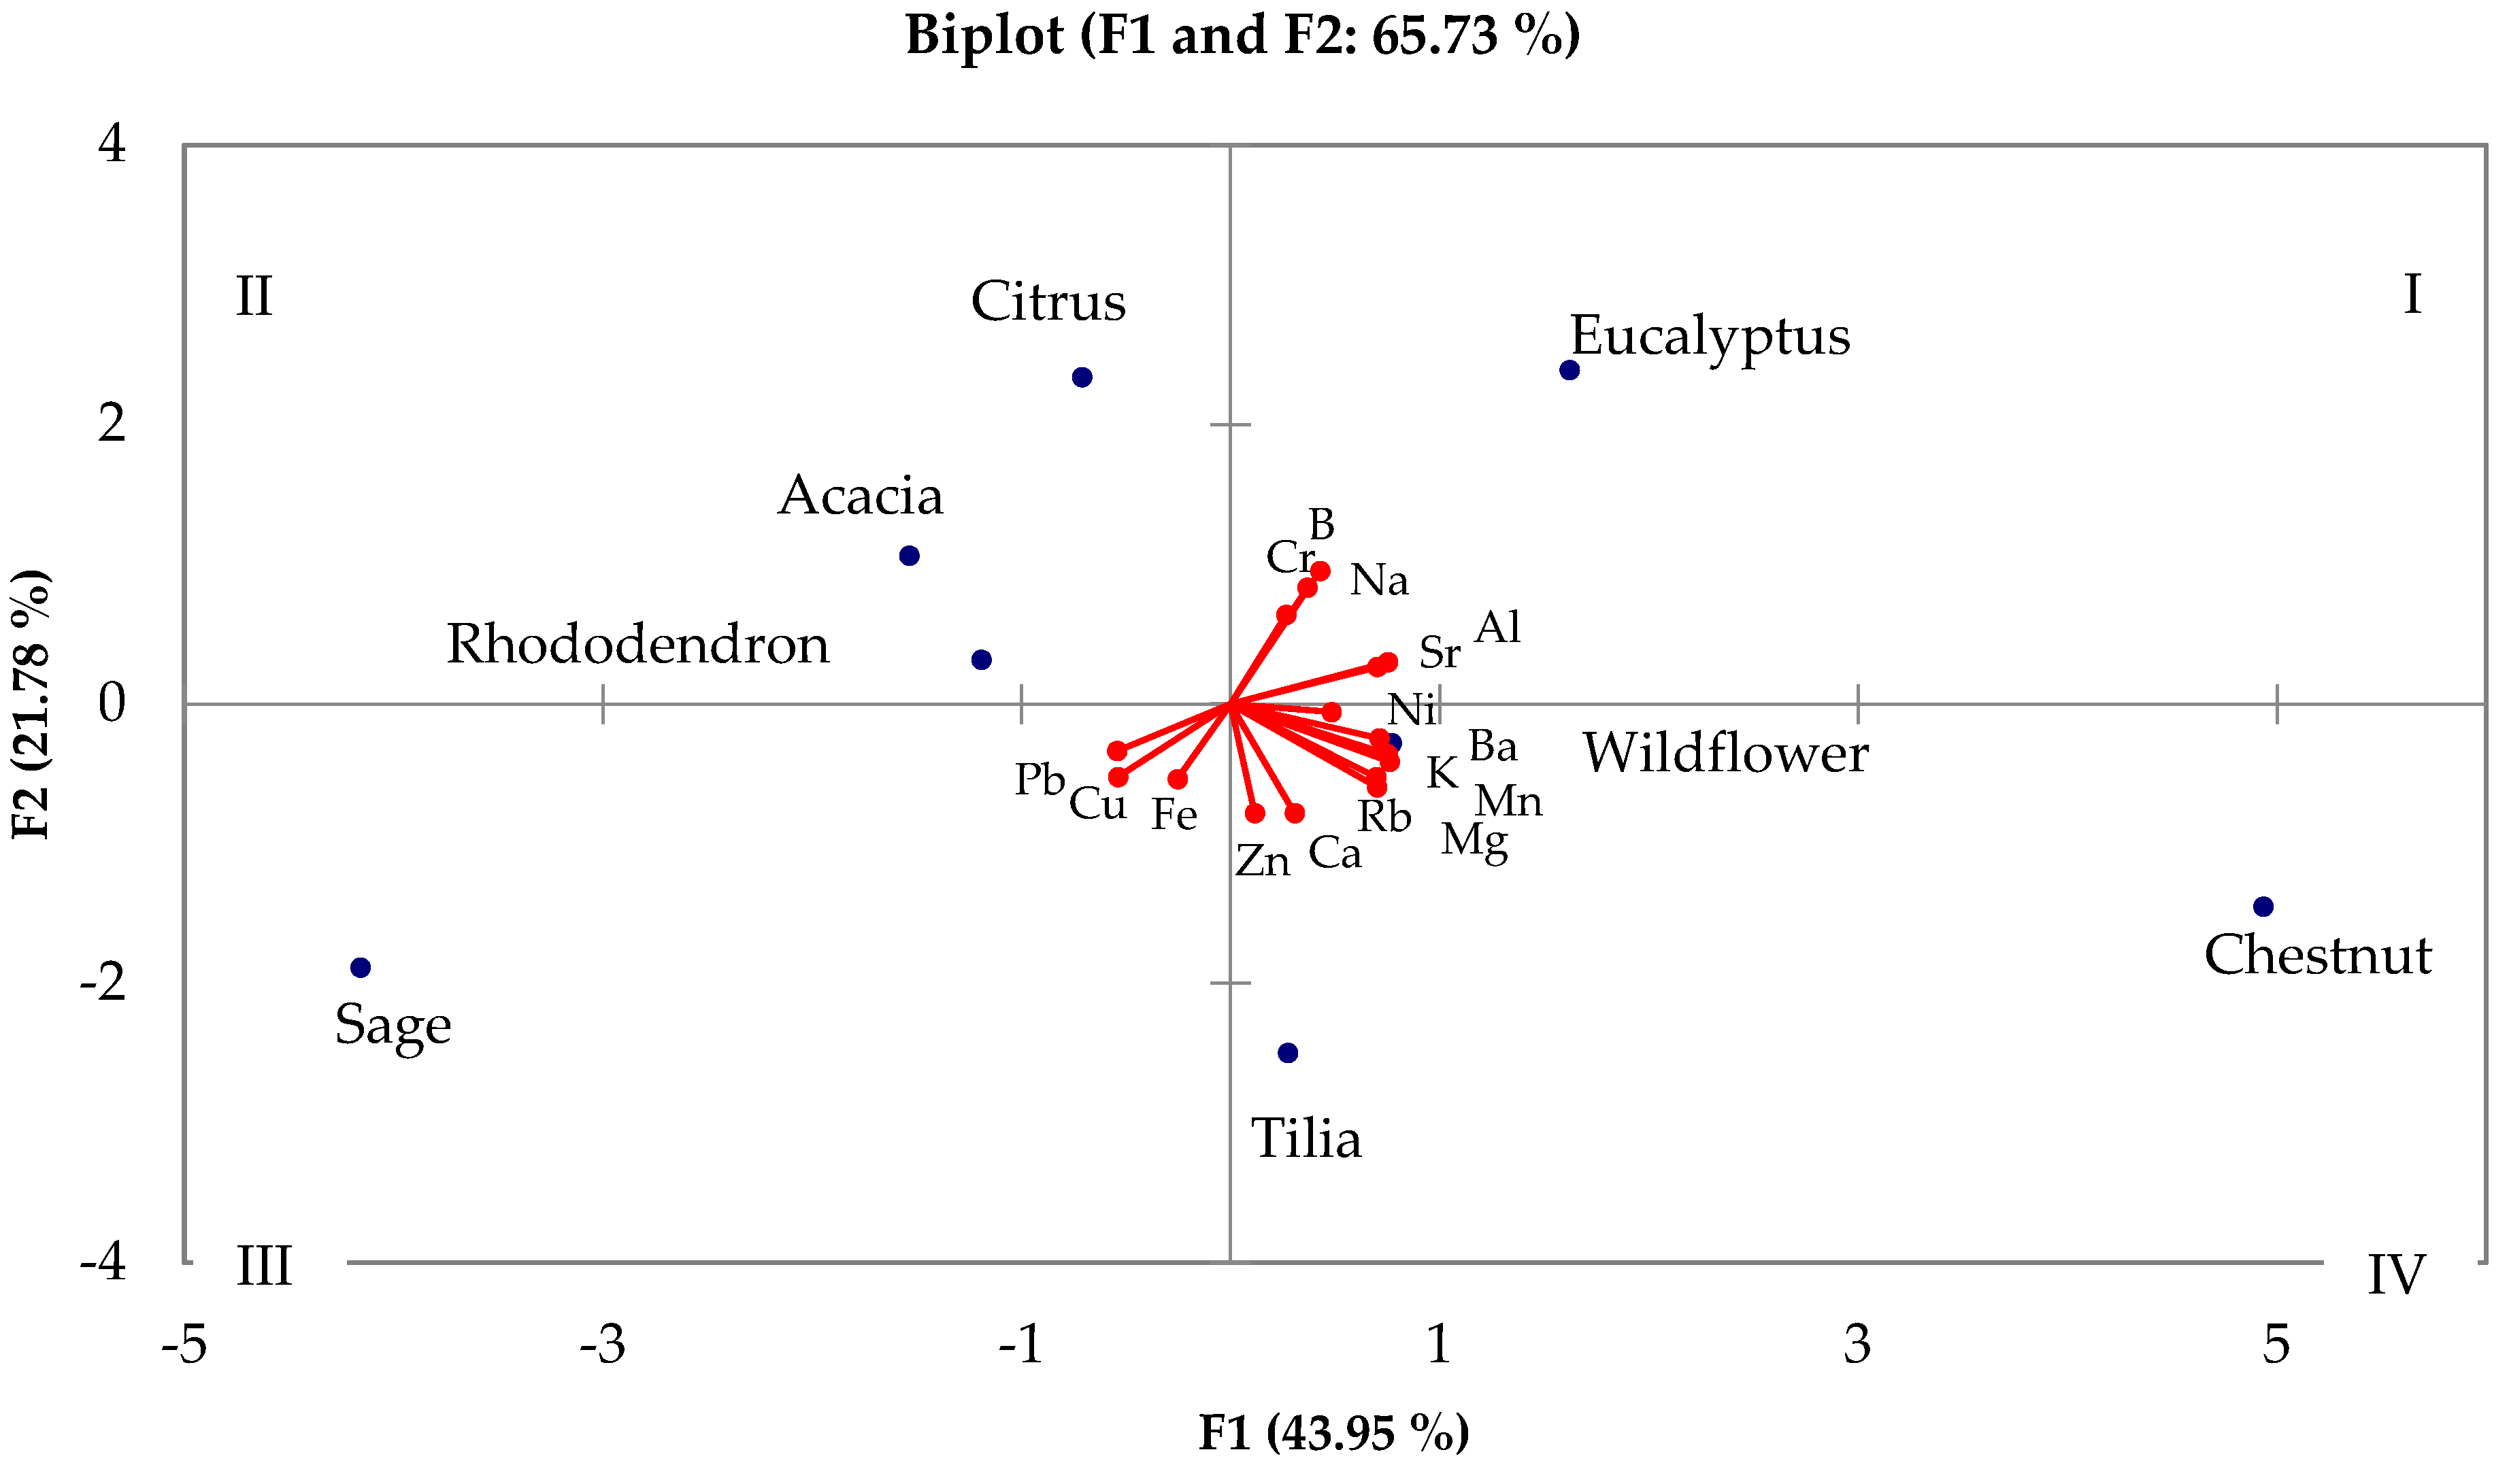
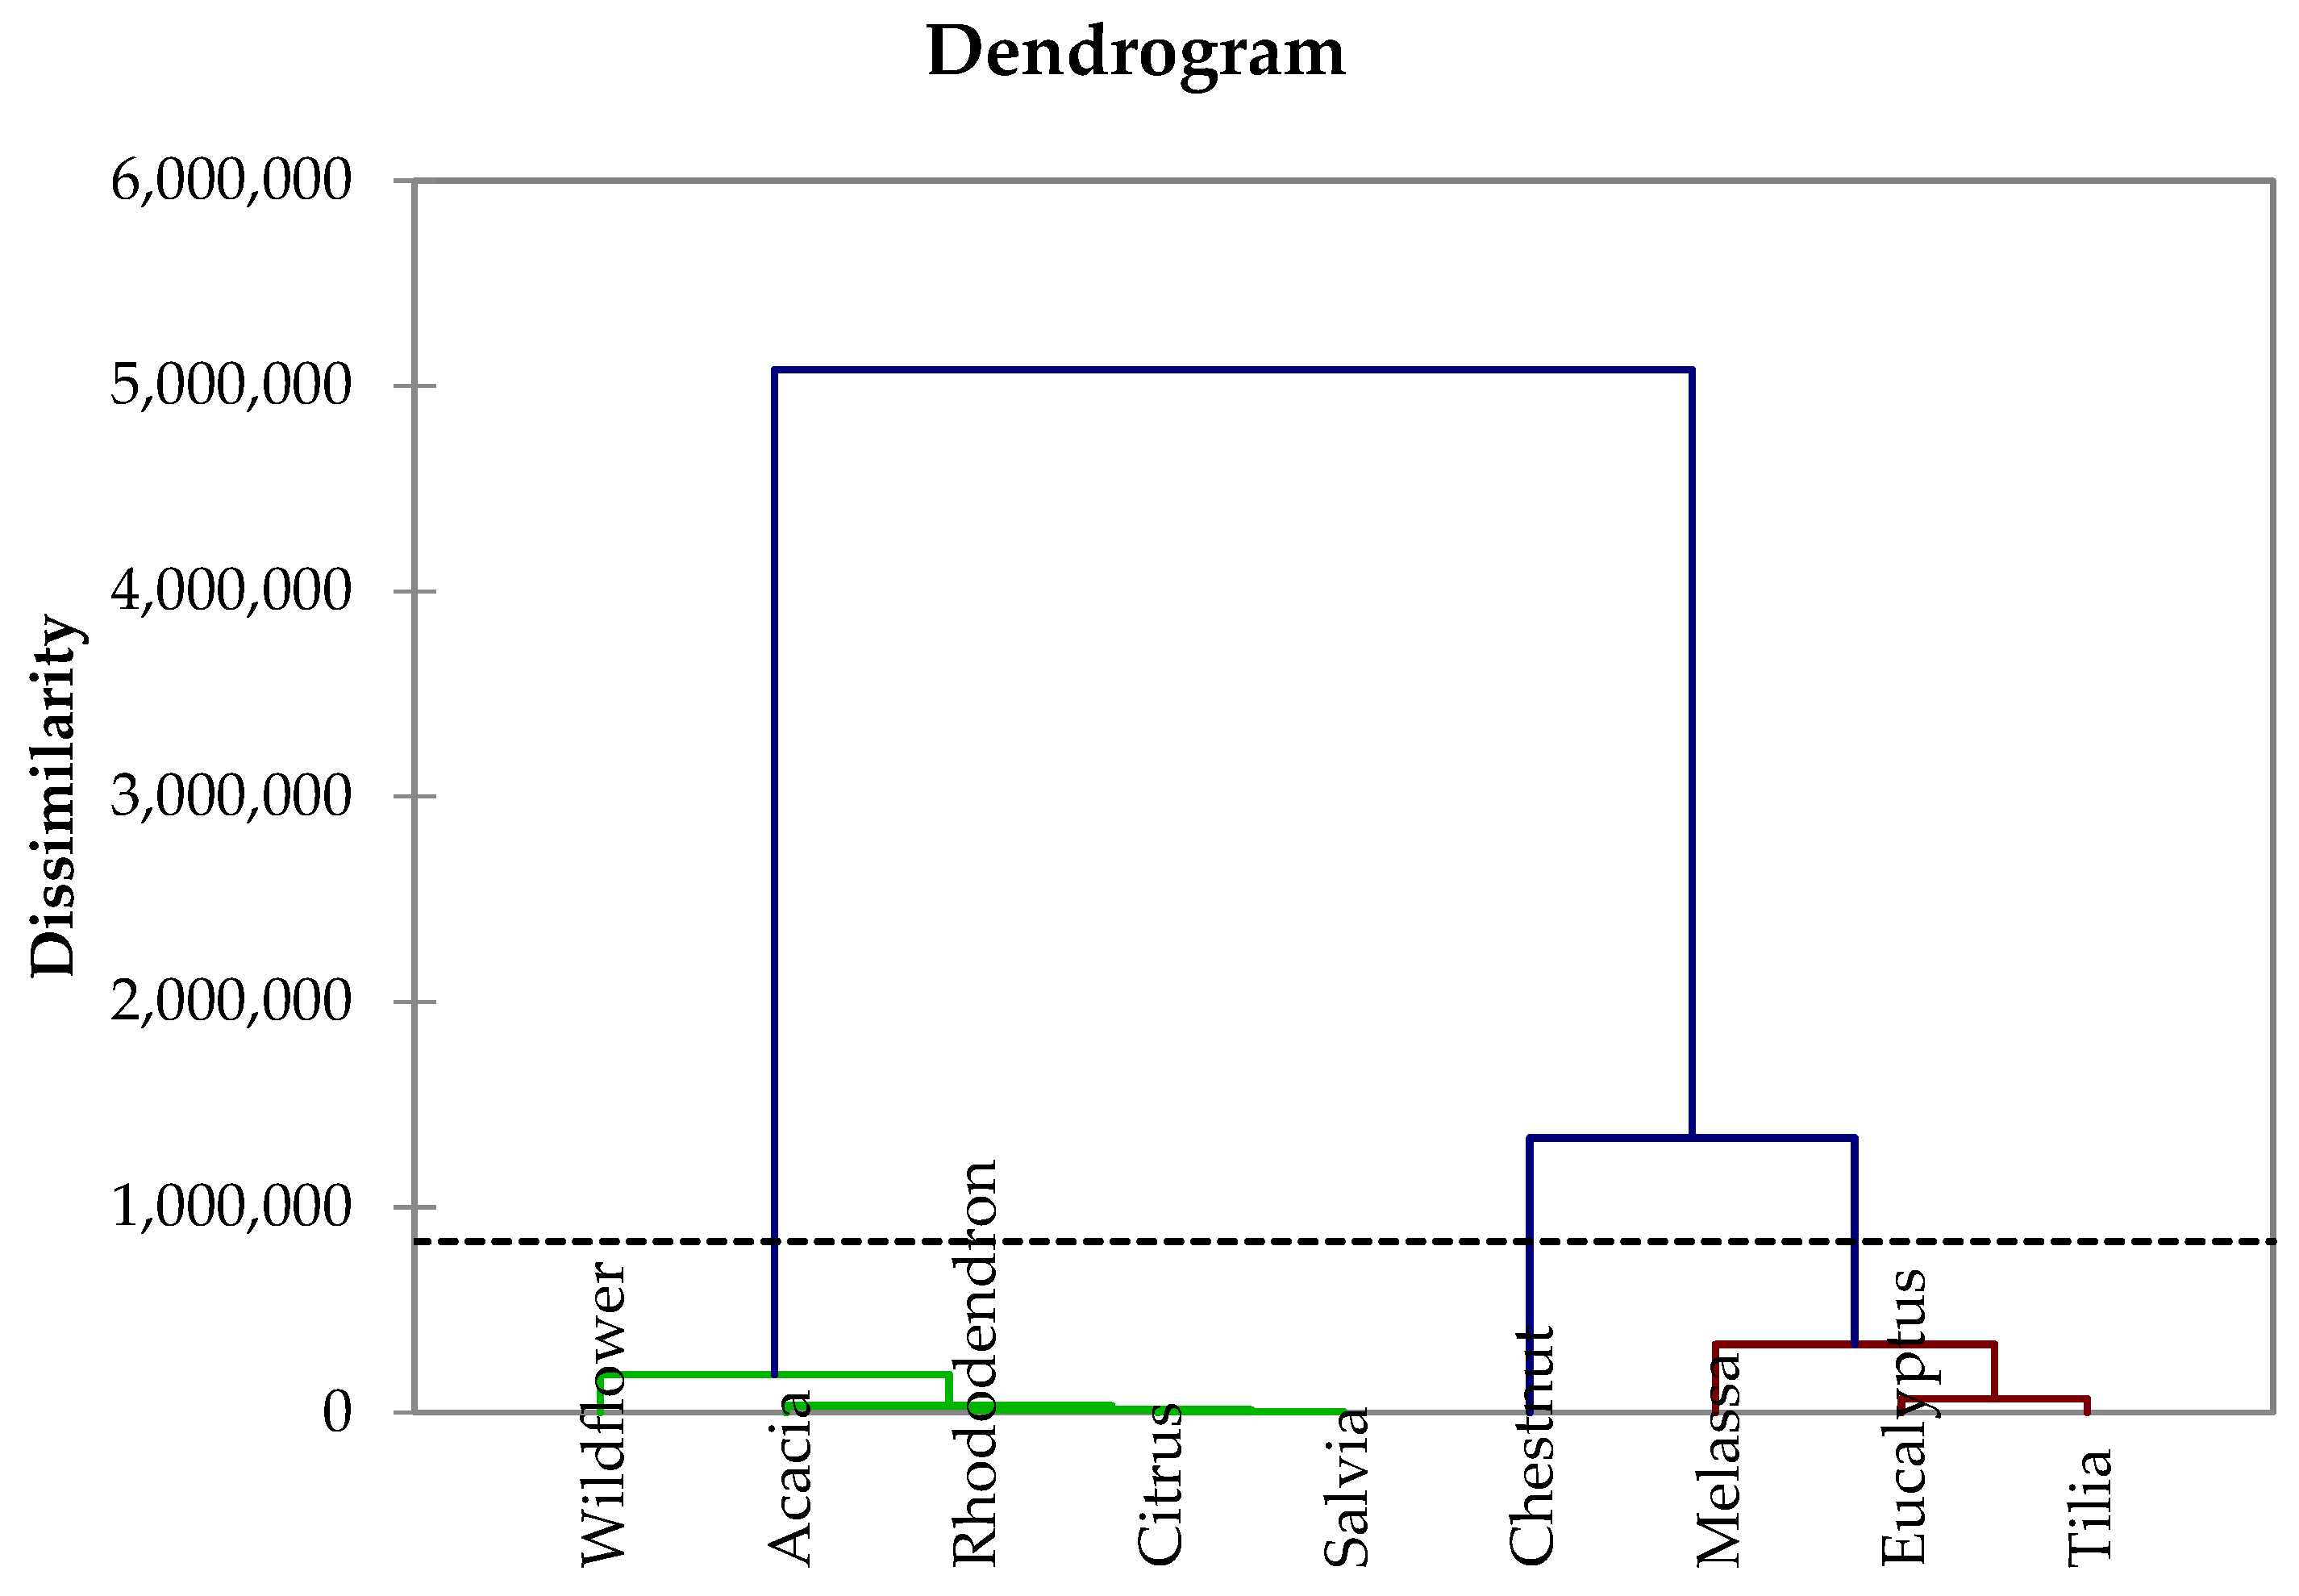
4.1. Analysis of Botanical Provenance
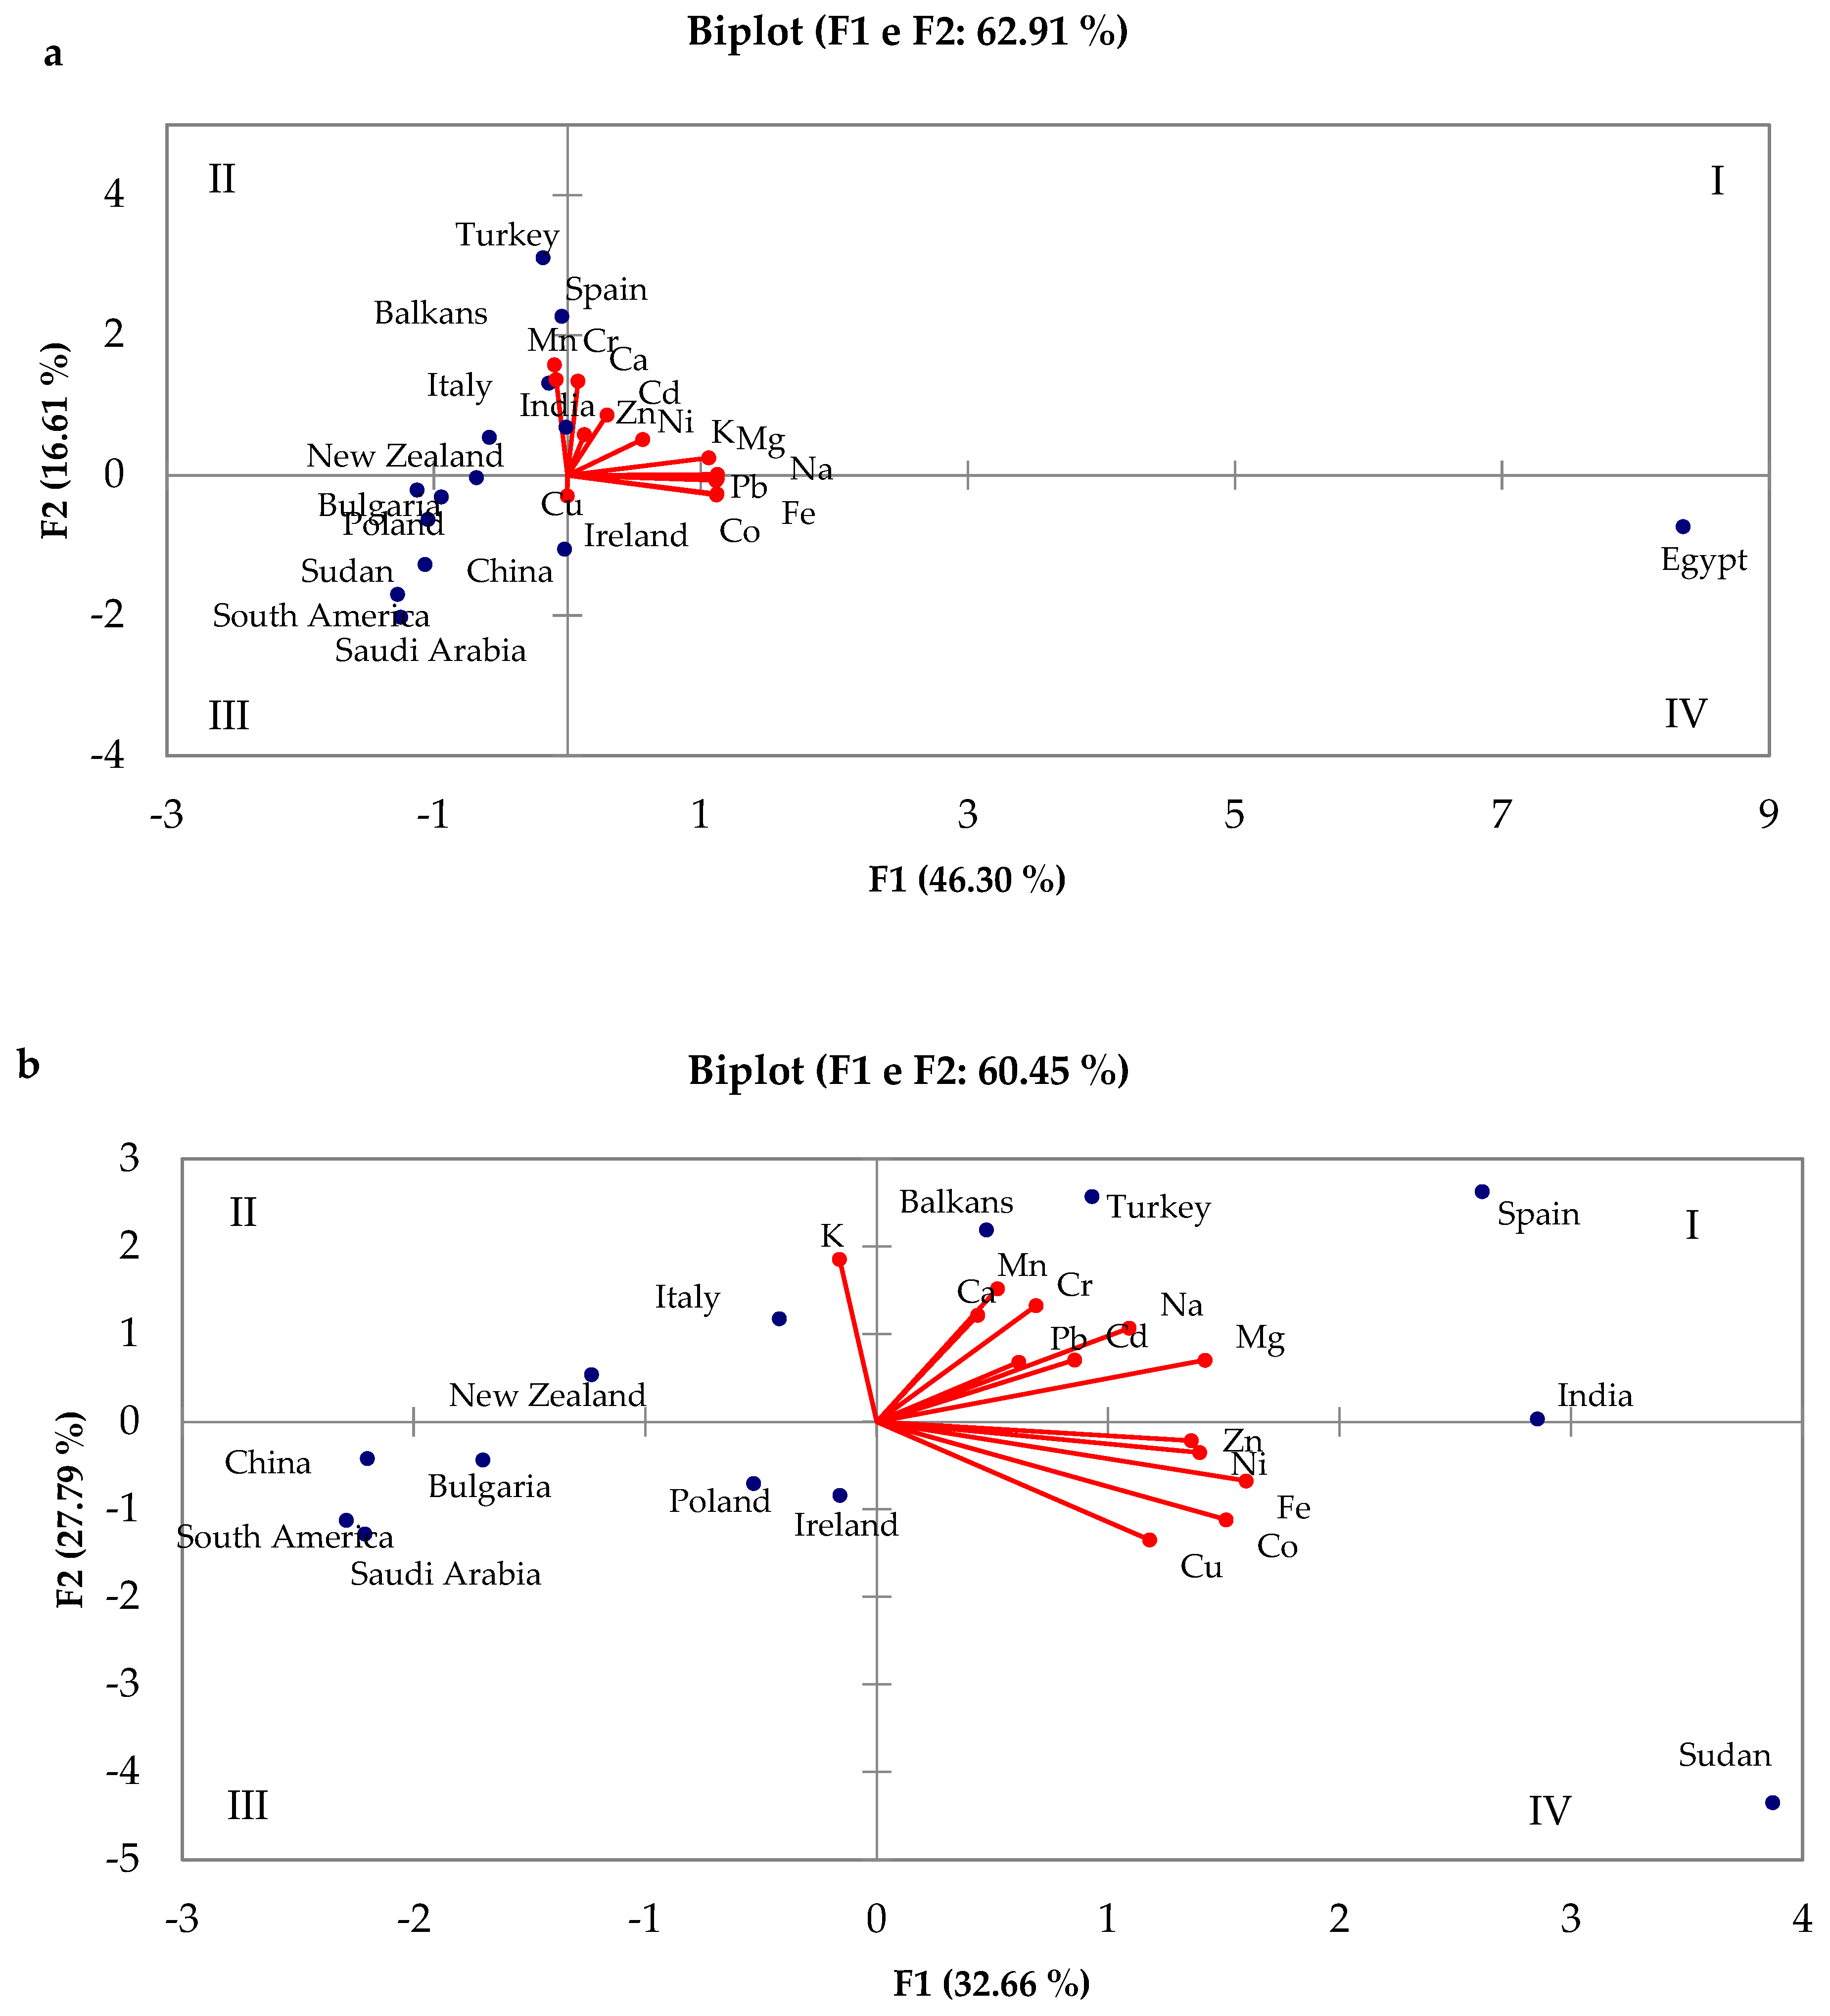
4.2. Analysis of Geographical Provenance
5. Conclusions
Author Contributions
Funding
Data Availability Statement
Conflicts of Interest
References
- Shakoori, Z.; Mehrabian, A.; Minai, D.; Salmanpour, F.; Khajoei Nasab, F. Assessing the Quality of Bee Honey on the Basis of Melissopalynology as Well as Chemical Analysis. PLoS ONE 2023, 18, e0289702. [Google Scholar] [CrossRef]
- Jiang, L.; Zheng, H.; Lu, H. Application of UV Spectrometry and Chemometric Models for Detecting Olive Oil-Vegetable Oil Blends Adulteration. J. Food Sci. Technol. 2015, 52, 479–485. [Google Scholar] [CrossRef]
- Leoni, V.; Panseri, S.; Giupponi, L.; Pavlovic, R.; Gianoncelli, C.; Sala, S.; Zeni, V.; Benelli, G.; Giorgi, A. Formal Analyses Are Fundamental for the Definition of Honey, a Product Representing Specific Territories and Their Changes: The Case of North Tyrrhenian Dunes (Italy). Sci. Rep. 2023, 13, 17542. [Google Scholar] [CrossRef]
- Tsagkaris, A.S.; Koulis, G.A.; Danezis, G.P.; Martakos, I.; Dasenaki, M.; Georgiou, C.A.; Thomaidis, N.S. Honey Authenticity: Analytical Techniques, State of the Art and Challenges. RSC Adv. 2021, 11, 11273–11294. [Google Scholar] [CrossRef]
- Inaudi, P.; Giacomino, A.; Malandrino, M.; La Gioia, C.; Conca, E.; Karak, T.; Abollino, O. The Inorganic Component as a Possible Marker for Quality and for Authentication of the Hazelnut’s Origin. Int. J. Environ. Res. Public Health 2020, 17, 447. [Google Scholar] [CrossRef]
- Giacomino, A.; Inaudi, P.; Silletta, G.; Diana, A.; Bertinetti, S.; Gaggero, E.; Malandrino, M.; Stilo, F.; Abollino, O. Analytical Methods for the Characterization of Vegetable Oils. Molecules 2022, 28, 153. [Google Scholar] [CrossRef]
- Squadrone, S.; Brizio, P.; Stella, C.; Mantia, M.; Pederiva, S.; Brusa, F.; Mogliotti, P.; Garrone, A.; Abete, M.C. Trace Elements and Rare Earth Elements in Honeys from the Balkans, Kazakhstan, Italy, South America, and Tanzania. Environ. Sci. Pollut. Res. 2020, 27, 12646–12657. [Google Scholar] [CrossRef]
- The Council of the European Union. EU Council Council Directive 2001/110/EC of 20 December 2001 Relating to Honey. Off. J. Eur. Commun. 2002, L10, 47–52. [Google Scholar]
- Seeley, T.D. Honey Bee Colonies Are Group-Level Adaptive Units. Am. Nat. 1997, 150, S22–S41. [Google Scholar] [CrossRef]
- Squadrone, S.; Brizio, P.; Stella, C.; Pederiva, S.; Brusa, F.; Mogliotti, P.; Garrone, A.; Abete, M.C. Trace and Rare Earth Elements in Monofloral and Multifloral Honeys from Northwestern Italy; A First Attempt of Characterization by a Multi-Elemental Profile. J. Trace Elem. Med. Biol. 2020, 61, 126556. [Google Scholar] [CrossRef]
- Feketéné Ferenczi, A.; Szűcs, I.; Bauerné Gáthy, A. Economic Sustainability Assessment of a Beekeeping Farm in Hungary. Agriculture 2023, 13, 1262. [Google Scholar] [CrossRef]
- Pawłowska-Tyszko, J.; Jarka, S.; Olech, I. Food Self-Sufficiency in the Honey Market in Poland. Sustainability 2024, 16, 9373. [Google Scholar] [CrossRef]
- Mara, A.; Deidda, S.; Caredda, M.; Ciulu, M.; Deroma, M.; Farinini, E.; Floris, I.; Langasco, I.; Leardi, R.; Pilo, M.I.; et al. Multi-Elemental Analysis as a Tool to Ascertain the Safety and the Origin of Beehive Products: Development, Validation, and Application of an ICP-MS Method on Four Unifloral Honeys Produced in Sardinia, Italy. Molecules 2022, 27, 2009. [Google Scholar] [CrossRef] [PubMed]
- Directorate-General for Health and Food Safety. Available online: https://food.ec.europa.eu/food-safety/eu-agri-food-fraud-network_en (accessed on 18 October 2024).
- Mara, A.; Mainente, F.; Soursou, V.; Picó, Y.; Perales, I.; Ghorab, A.; Sanna, G.; Borrás-Linares, I.; Zoccatelli, G.; Ciulu, M. New Insights on Quality, Safety, Nutritional, and Nutraceutical Properties of Honeydew Honeys from Italy. Molecules 2025, 30, 410. [Google Scholar] [CrossRef]
- Aykas, D.P. Determination of Possible Adulteration and Quality Assessment in Commercial Honey. Foods 2023, 12, 523. [Google Scholar] [CrossRef]
- Paiano, V.; Breidbach, A.; Lörchner, C.; Ždiniaková, T.; De Rudder, O.; Maquet, A.; Alvarellos, L.; Ulberth, F. Detection of Honey Adulteration by Liquid Chromatography—High-Resolution Mass Spectrometry: Results from an EU Coordinated Action. Separations 2025, 12, 47. [Google Scholar] [CrossRef]
- Gulino, F.; Calà, E.; Cozzani, C.; Vaccari, L.; Oddone, M.; Aceto, M. On the Traceability of Honey by Means of Lanthanide Distribution. Foods 2023, 12, 1803. [Google Scholar] [CrossRef]
- Mureșan, C.I.; Cornea-Cipcigan, M.; Suharoschi, R.; Erler, S.; Mărgăoan, R. Honey Botanical Origin and Honey-Specific Protein Pattern: Characterization of Some European Honeys. LWT 2022, 154, 112883. [Google Scholar] [CrossRef]
- Fakhlaei, R.; Selamat, J.; Khatib, A.; Razis, A.F.A.; Sukor, R.; Ahmad, S.; Babadi, A.A. The Toxic Impact of Honey Adulteration: A Review. Foods 2020, 9, 1538. [Google Scholar] [CrossRef]
- Mendes, E.; Brojo Proença, E.; Ferreira, I.M.P.L.V.O.; Ferreira, M.A. Quality Evaluation of Portuguese Honey. Carbohydr. Polym. 1998, 37, 219–223. [Google Scholar] [CrossRef]
- Gerginova, D.; Kurteva, V.; Simova, S. Optical Rotation—A Reliable Parameter for Authentication of Honey? Molecules 2022, 27, 8916. [Google Scholar] [CrossRef]
- Özbalci, B.; Boyaci, İ.H.; Topcu, A.; Kadılar, C.; Tamer, U. Rapid Analysis of Sugars in Honey by Processing Raman Spectrum Using Chemometric Methods and Artificial Neural Networks. Food Chem. 2013, 136, 1444–1452. [Google Scholar] [CrossRef]
- Devillers, J.; Morlot, M.; Pham-Delègue, M.H.; Doré, J.C. Classification of Monofloral Honeys Based on Their Quality Control Data. Food Chem. 2004, 86, 305–312. [Google Scholar] [CrossRef]
- Taylor, S.L.; Ebrary Inc. (Eds.) Advances in Food and Nutrition Research: Volume 62. In Advances in Food and Nutrition Research, 1st ed.; Academic Press: Amsterdam, The Netherlands, 2011; ISBN 978-0-12-385989-1. [Google Scholar]
- Terrab, A.; Vega-Pérez, J.M.; Díez, M.J.; Heredia, F.J. Characterisation of Northwest Moroccan Honeys by Gas Chromatographic–Mass Spectrometric Analysis of Their Sugar Components. J. Sci. Food Agric. 2002, 82, 179–185. [Google Scholar] [CrossRef]
- Cotte, J.F.; Casabianca, H.; Giroud, B.; Albert, M.; Lheritier, J.; Grenier-Loustalot, M.F. Characterization of Honey Amino Acid Profiles Using High-Pressure Liquid Chromatography to Control Authenticity. Anal. Bioanal. Chem. 2004, 378, 1342–1350. [Google Scholar] [CrossRef]
- Yao, L.; Jiang, Y.; Singanusong, R.; Datta, N.; Raymont, K. Phenolic Acids and Abscisic Acid in Australian Eucalyptus Honeys and Their Potential for Floral Authentication. Food Chem. 2004, 86, 169–177. [Google Scholar] [CrossRef]
- Radovic, B.S.; Careri, M.; Mangia, A.; Musci, M.; Gerboles, M.; Anklam, E. Contribution of Dynamic Headspace GC–MS Analysis of Aroma Compounds to Authenticity Testing of Honey. Food Chem. 2001, 72, 511–520. [Google Scholar] [CrossRef]
- Davies, A.M.C.; Radovic, B.; Fearn, T.; Anklam, E. A Preliminary Study on the Characterisation of Honey by near Infrared Spectroscopy. J. Infrared Spectrosc. 2002, 10, 121–135. [Google Scholar] [CrossRef]
- Ruoff, K.; Luginbühl, W.; Künzli, R.; Iglesias, M.T.; Bogdanov, S.; Bosset, J.O.; Von Der Ohe, K.; Von Der Ohe, W.; Amadò, R. Authentication of the Botanical and Geographical Origin of Honey by Mid-Infrared Spectroscopy. J. Agric. Food Chem. 2006, 54, 6873–6880. [Google Scholar] [CrossRef]
- Ruoff, K.; Luginbühl, W.; Künzli, R.; Bogdanov, S.; Bosset, J.O.; Von Der Ohe, K.; Von Der Ohe, W.; Amadò, R. Authentication of the Botanical and Geographical Origin of Honey by Front-Face Fluorescence Spectroscopy. J. Agric. Food Chem. 2006, 54, 6858–6866. [Google Scholar] [CrossRef]
- Donarski, J.A.; Jones, S.A.; Charlton, A.J. Application of Cryoprobe1 H Nuclear Magnetic Resonance Spectroscopy and Multivariate Analysis for the Verification of Corsican Honey. J. Agric. Food Chem. 2008, 56, 5451–5456. [Google Scholar] [CrossRef]
- Beretta, G.; Caneva, E.; Regazzoni, L.; Bakhtyari, N.G.; Maffei Facino, R. A Solid-Phase Extraction Procedure Coupled to 1H NMR, with Chemometric Analysis, to Seek Reliable Markers of the Botanical Origin of Honey. Anal. Chim. Acta 2008, 620, 176–182. [Google Scholar] [CrossRef]
- Tomás-Barberán, F.A.; Martos, I.; Ferreres, F.; Radovic, B.S.; Anklam, E. HPLC Flavonoid Profiles as Markers for the Botanical Origin of European Unifloral Honeys. J. Sci. Food Agric. 2001, 81, 485–496. [Google Scholar] [CrossRef]
- Rebane, R.; Herodes, K. Evaluation of the Botanical Origin of Estonian Uni- and Polyfloral Honeys by Amino Acid Content. J. Agric. Food Chem. 2008, 56, 10716–10720. [Google Scholar] [CrossRef]
- Seisonen, S.; Kivima, E.; Vene, K. Characterisation of the Aroma Profiles of Different Honeys and Corresponding Flowers Using Solid-Phase Microextraction and Gas Chromatography-Mass Spectrometry/Olfactometry. Food Chem. 2015, 169, 34–40. [Google Scholar] [CrossRef]
- Daher, S.; Gülaçar, F.O. Analysis of Phenolic and Other Aromatic Compounds in Honeys by Solid-Phase Microextraction Followed by Gas Chromatography-Mass Spectrometry. J. Agric. Food Chem. 2008, 56, 5775–5780. [Google Scholar] [CrossRef]
- Pohl, P. Determination of Metal Content in Honey by Atomic Absorption and Emission Spectrometries. TrAC Trends Anal. Chem. 2009, 28, 117–128. [Google Scholar] [CrossRef]
- White, J.W. Composition of Honey. In Honey: A Comprehensive Survey; Crane, E., Ed.; Heinemann: London, UK, 1975; pp. 157–206. [Google Scholar]
- Girelli, C.R.; Schiavone, R.; Vilella, S.; Fanizzi, F.P. Salento Honey (Apulia, South-East Italy): A Preliminary Characterization by 1H-NMR Metabolomic Fingerprinting. Sustainability 2020, 12, 5009. [Google Scholar] [CrossRef]
- Perseitol. Available online: https://pubchem.ncbi.nlm.nih.gov/compound/Perseitol (accessed on 22 November 2024).
- Kaczmarek, A.; Muzolf-Panek, M.; Tomaszewska-Gras, J.; Konieczny, P. Predicting the Botanical Origin of Honeys with Chemometric Analysis According to Their Antioxidant and Physicochemical Properties. Pol. J. Food Nutr. Sci. 2019, 69, 191–201. [Google Scholar] [CrossRef]
- Conti, M.E.; Finoia, M.G.; Fontana, L.; Mele, G.; Botrè, F.; Iavicoli, I. Characterization of Argentine Honeys on the Basis of Their Mineral Content and Some Typical Quality Parameters. Chem. Cent. J. 2014, 8, 44. [Google Scholar] [CrossRef]
- Iglesias, M.T.; De Lorenzo, C.; Polo, M.D.C.; Martín-Álvarez, P.J.; Pueyo, E. Usefulness of Amino Acid Composition To Discriminate between Honeydew and Floral Honeys. Application to Honeys from a Small Geographic Area. J. Agric. Food Chem. 2004, 52, 84–89. [Google Scholar] [CrossRef]
- Patrignani, M.; Fagúndez, G.A.; Tananaki, C.; Thrasyvoulou, A.; Lupano, C.E. Volatile Compounds of Argentinean Honeys: Correlation with Floral and Geographical Origin. Food Chem. 2018, 246, 32–40. [Google Scholar] [CrossRef]
- Tananaki, C.; Zotou, A.; Thrasyvoulou, A. Determination of 1,2-Dibromoethane, 1,4-Dichlorobenzene and Naphthalene Residues in Honey by Gas Chromatography–Mass Spectrometry Using Purge and Trap Thermal Desorption Extraction. J. Chromatogr. A 2005, 1083, 146–152. [Google Scholar] [CrossRef]
- Dlgs 179/04. Available online: https://www.parlamento.it/parlam/leggi/deleghe/04179dl.htm (accessed on 4 April 2024).
- Cavia, M.M.; Fernández-Muiño, M.A.; Alonso-Torre, S.R.; Huidobro, J.F.; Sancho, M.T. Evolution of Acidity of Honeys from Continental Climates: Influence of Induced Granulation. Food Chem. 2007, 100, 1728–1733. [Google Scholar] [CrossRef]
- Melaku, M.; Tefera, W. Physicochemical Properties, Mineral and Heavy Metal Contents of Honey in Eastern Amhara Region, Ethiopia. J. Food Compos. Anal. 2022, 114, 104829. [Google Scholar] [CrossRef]
- Solayman, M.; Islam, M.A.; Paul, S.; Ali, Y.; Khalil, M.I.; Alam, N.; Gan, S.H. Physicochemical Properties, Minerals, Trace Elements, and Heavy Metals in Honey of Different Origins: A Comprehensive Review. Compr. Rev. Food Sci. Food Saf. 2016, 15, 219–233. [Google Scholar] [CrossRef]
- Brudzynski, K.; Miotto, D. Honey Melanoidins: Analysis of the Compositions of the High Molecular Weight Melanoidins Exhibiting Radical-Scavenging Activity. Food Chem. 2011, 127, 1023–1030. [Google Scholar] [CrossRef]
- Pontis, J.A.; Costa, L.A.M.A.D.; Silva, S.J.R.D.; Flach, A. Color, Phenolic and Flavonoid Content, and Antioxidant Activity of Honey from Roraima, Brazil. Food Sci. Technol. 2014, 34, 69–73. [Google Scholar] [CrossRef]
- Bodor, Z.; Benedek, C.; Urbin, Á.; Szabó, D.; Sipos, L. Colour of Honey: Can We Trust the Pfund Scale?—An Alternative Graphical Tool Covering the Whole Visible Spectra. LWT 2021, 149, 111859. [Google Scholar] [CrossRef]
- Felsner, M.L.; Cano, C.B.; Bruns, R.E.; Watanabe, H.M.; Almeida-Muradian, L.B.; Matos, J.R. Characterization of Monofloral Honeys by Ash Contents through a Hierarchical Design. J. Food Compos. Anal. 2004, 17, 737–747. [Google Scholar] [CrossRef]
- Codex Alimentarius; Codex Stan 12-1981, Rev.1 (1987), Rev.2 (2001). Available online: https://www.fao.org/fao-who-codexalimentarius/codex-texts/list-standards/en/ (accessed on 5 December 2024).
- Rysha, A.; Kastrati, G.; Biber, L.; Sadiku, V.; Rysha, A.; Zogaj, F.; Kabashi-Kastrati, E. Evaluating the Physicochemical Properties of Some Kosovo’s and Imported Honey Samples. Appl. Sci. 2022, 12, 629. [Google Scholar] [CrossRef]
- Tomasik, P. (Ed.) Chemical and Functional Properties of Food Saccharides. In Chemical and Functional Properties of Food Components Series; CRC Press: Boca Raton, FL, USA, 2004; ISBN 978-0-8493-1486-5. [Google Scholar]
- Yanniotis, S.; Skaltsi, S.; Karaburnioti, S. Effect of Moisture Content on the Viscosity of Honey at Different Temperatures. J. Food Eng. 2006, 72, 372–377. [Google Scholar] [CrossRef]
- A.I. Root Company. The ABC and XYZ of Bee Culture; A.I. Root Company: Medina, OH, USA, 1974. [Google Scholar]
- Prica, N.; Živkov Baloš, M.; Jakšić, S.; Mihaljev, Ž.; Kartalović, B.; Babić, J.; Savić, S. Moisture and acidity as indicators of the quality of honey originating from vojvodina region. Arch. Vet. Med. 2015, 7, 99–109. [Google Scholar] [CrossRef]
- de Villiers, M.; Nienaber, S.G. The Differential Impact of CO2 Penalties, CO2 Incentives and Information Policies on Consumer Behaviour When Purchasing a New Motor Vehicle. eJTR 2019, 17, 35. [Google Scholar]
- Renu, K.; Chakraborty, R.; Myakala, H.; Koti, R.; Famurewa, A.C.; Madhyastha, H.; Vellingiri, B.; George, A.; Valsala Gopalakrishnan, A. Molecular Mechanism of Heavy Metals (Lead, Chromium, Arsenic, Mercury, Nickel and Cadmium)—Induced Hepatotoxicity—A Review. Chemosphere 2021, 271, 129735. [Google Scholar] [CrossRef]
- Mutter, J.; Yeter, D. Kawasakis Disease, Acrodynia, and Mercury. Curr. Med. Chem. 2008, 15, 3000–3010. [Google Scholar] [CrossRef]
- Gidlow, D.A. Lead Toxicity. Occup. Med. 2015, 65, 348–356. [Google Scholar] [CrossRef]
- Osemwota, I.O.; Omueti, J.A.I.; Ogboghodo, A.I. Effect of Calcium/Magnesium Ratio in Soil on Magnesium Availability, Yield, and Yield Components of Maize. Commun. Soil Sci. Plant Anal. 2007, 38, 2849–2860. [Google Scholar] [CrossRef]
- Chen, Z.; Zhang, Z.; Chi, R. Leaching Process of Weathered Crust Elution-Deposited Rare Earth Ore with Formate Salts. Front. Chem. 2020, 8, 598752. [Google Scholar] [CrossRef]
- Berthon, G. Aluminium Speciation in Relation to Aluminium Bioavailability, Metabolism and Toxicity. Coord. Chem. Rev. 2002, 228, 319–341. [Google Scholar] [CrossRef]
- Anjos, V.A.; Da Silva-Júnior, F.M.R.; Souza, M.M. Cell Damage Induced by Copper: An Explant Model to Study Anemone Cells. Toxicol. Vitr. 2014, 28, 365–372. [Google Scholar] [CrossRef]
- Plum, L.M.; Rink, L.; Haase, H. The Essential Toxin: Impact of Zinc on Human Health. Int. J. Environ. Res. Public Health 2010, 7, 1342–1365. [Google Scholar] [CrossRef]
- Bogdanov, S. Chemical Composition. Bee Prod. Sci. 2011, 5, 1–10. [Google Scholar]
- Taha, E.-K.A.; Manosur, H.M.; Shawer, M.B. The Relationship between Comb Age and the Amounts of Mineral Elements in Honey and Wax. J. Apic. Res. 2010, 49, 202–207. [Google Scholar] [CrossRef]
- Perna, A.; Simonetti, A.; Intaglietta, I.; Sofo, A.; Gambacorta, E. Metal Content of Southern Italy Honey of Different Botanical Origins and Its Correlation with Polyphenol Content and Antioxidant Activity. Int. J. Food Sci. Technol. 2012, 47, 1909–1917. [Google Scholar] [CrossRef]
- Di Bella, G.; Lo Turco, V.; Potortì, A.G.; Bua, G.D.; Fede, M.R.; Dugo, G. Geographical Discrimination of Italian Honey by Multi-Element Analysis with a Chemometric Approach. J. Food Compos. Anal. 2015, 44, 25–35. [Google Scholar] [CrossRef]
- Caroli, S.; Forte, G.; Alessandrelli, M.; Cresti, R.; Spagnoli, M.; D’Ilio, S.; Pauwels, J.; Kramer, G.N. A Pilot Study for the Production of a Certified Reference Material for Trace Elements in Honey. Microchem. J. 2000, 67, 227–233. [Google Scholar] [CrossRef]
- Hoenig, M. Sample dissolution for elemental analysis|Dry Ashing. In Encyclopedia of Analytical Science; Elsevier: Amsterdam, The Netherlands, 2005; pp. 131–136. ISBN 978-0-12-369397-6. [Google Scholar]
- Miller-Ihli, N.J. Chromium. In Techniques and Instrumentation in Analytical Chemistry; Elsevier: Amsterdam, The Netherlands, 1992; Volume 12, pp. 373–404. ISBN 978-0-444-89078-8. [Google Scholar]
- Oroian, M.; Prisacaru, A.; Hretcanu, E.C.; Stroe, S.-G.; Leahu, A.; Buculei, A. Heavy Metals Profile in Honey as a Potential Indicator of Botanical and Geographical Origin. Int. J. Food Prop. 2016, 19, 1825–1836. [Google Scholar] [CrossRef]
- Gonzalez Paramas, A.M.; Gòmez Bàrez, J.A.; Garcia-Villanova, R.J.; Rivas Palà, T.; Ardanuy Albajar, R.; Sànchez Sànchez, J. Geographical Discrimination of Honeys by Using Mineral Composition and Common Chemical Quality Parameters. J. Sci. Food Agric. 2000, 80, 157–165. [Google Scholar] [CrossRef]
- CNR-IRSA. APAT Metodi Analitici per Le Acque; CNR-IRSA: Montelibretti, Italy, 2003; ISBN 88-448-0083-7. [Google Scholar]
- Bilandžić, N.; Gačić, M.; Đokić, M.; Sedak, M.; Šipušić, Đ.I.; Končurat, A.; Gajger, I.T. Major and Trace Elements Levels in Multifloral and Unifloral Honeys in Croatia. J. Food Compos. Anal. 2014, 33, 132–138. [Google Scholar] [CrossRef]
- Bontempo, L.; Camin, F.; Ziller, L.; Perini, M.; Nicolini, G.; Larcher, R. Isotopic and Elemental Composition of Selected Types of Italian Honey. Measurement 2017, 98, 283–289. [Google Scholar] [CrossRef]
- Drivelos, S.A.; Danezis, G.P.; Halagarda, M.; Popek, S.; Georgiou, C.A. Geographical Origin and Botanical Type Honey Authentication through Elemental Metabolomics via Chemometrics. Food Chem. 2021, 338, 127936. [Google Scholar] [CrossRef]
- Pisani, A.; Protano, G.; Riccobono, F. Minor and Trace Elements in Different Honey Types Produced in Siena County (Italy). Food Chem. 2008, 107, 1553–1560. [Google Scholar] [CrossRef]
- Conti, M.E.; Stripeikis, J.; Campanella, L.; Cucina, D.; Tudino, M.B. Characterization of Italian Honeys (Marche Region) on the Basis of Their Mineral Content and Some Typical Quality Parameters. Chem. Cent. J. 2007, 1, 14. [Google Scholar] [CrossRef]
- De Oliveira, F.A.; De Abreu, A.T.; De Oliveira Nascimento, N.; Froes-Silva, R.E.S.; Antonini, Y.; Nalini, H.A.; De Lena, J.C. Evaluation of Matrix Effect on the Determination of Rare Earth Elements and As, Bi, Cd, Pb, Se and In in Honey and Pollen of Native Brazilian Bees (Tetragonisca Angustula—Jataí) by Q-ICP-MS. Talanta 2017, 162, 488–494. [Google Scholar] [CrossRef]
- Wu, F.; Zhao, H.; Sun, J.; Guo, J.; Wu, L.; Xue, X.; Cao, W. ICP-MS-Based Ionomics Method for Discriminating the Geographical Origin of Honey of Apis cerana Fabricius. Food Chem. 2021, 354, 129568. [Google Scholar] [CrossRef]
- Soares, S.; Amaral, J.S.; Oliveira, M.B.P.P.; Mafra, I. A Comprehensive Review on the Main Honey Authentication Issues: Production and Origin. Compr. Rev. Food Sci. Food Saf. 2017, 16, 1072–1100. [Google Scholar] [CrossRef]
- The Commission of the European Communities. Commission Regulation (EC) No 1881/2006. Off. J. Eur. Union 2006, 364, 5. [Google Scholar]
- European Commission. European Commission Regulation (EU) No 2015/1005 Amending Regulation (EC) No 1881/2006 as Regards Maximum Levels of Lead in Certain Foodstuffs. Off. J. Eur. Union 2015, 161, 9. [Google Scholar]
- Pita-Calvo, C.; Vázquez, M. Differences between Honeydew and Blossom Honeys: A Review. Trends Food Sci. Technol. 2017, 59, 79–87. [Google Scholar] [CrossRef]
- Bogdanov, S. Minerals in Honey: Environmental, Geographical and Botanical Aspects. J. Apic. Res. 2007, 46, 269–275. [Google Scholar] [CrossRef]
- Rashed, M.N.; Soltan, M.E. Major and Trace Elements in Different Types of Egyptian Mono-Floral and Non-Floral Bee Honeys. J. Food Compos. Anal. 2004, 17, 725–735. [Google Scholar] [CrossRef]
- Anwar, W.A. Environmental Health in Egypt. Int. J. Hyg. Environ. Health 2003, 206, 339–350. [Google Scholar] [CrossRef] [PubMed]
- Osman, K.A.; Al-Doghairi, M.A.; Al-Rehiayani, S.; Helal, M.I.D. Mineral Contents and Physicochemical Properties of Natural Honey Produced in Al-Qassim Region, Saudi Arabia. J. Food Agric. Environ. 2007, 5, 142. [Google Scholar]
- Al-Khalifa, A.S.; Al-Arify, I.A. Physicochemical Characteristics and Pollen Spectrum of Some Saudi Honeys. Food Chem. 1999, 67, 21–25. [Google Scholar] [CrossRef]
- Angelova, V.R.; Ivanova, R.V.; Todorov, G.M.; Ivanov, K.I. Potential of Salvia sclarea L. for Phytoremediation of Soils Contaminated with Heavy Metals. Int. J. Agric. Biosyst. Eng. 2016, 10, 780–790. [Google Scholar]
| Method | Elements | References |
|---|---|---|
| FAAS | Ca, Fe, K, Mg, Na, Zn | [81] |
| FAAS | Ca, Fe, K, Mg, Na | [85] |
| GFAAS | As, Cu, Cd, Pb, Se | [81] |
| GFAAS | Cu, Mn | [85] |
| ICP-MS | As, Cd, Cr, Cu, Fe, Mn, Ni, Pb, Zn | [75] |
| ICP-MS | As, Be, Ca, Cd, Co, Cr, Cu, Fe, K, Mg, Mn, Na, Ni, Pb, Se, Tl, U, V, Zn | [44] |
| ICP-MS | As, Cd, Cr, Cu, Mn, Ni, Pb, Se | [74] |
| ICP-MS | Ba, Ce, Co, Cu, Dy, Er, Eu, Gd, Ho, La, Li, Lu, Mg, Mn, Na, Ni, Pb, Pr, Sm, Sr, Tb, Y, Yb | [83] |
| ICP-MS | As, Bi, Cd, Ce, Dy, Er, Eu, Gd, Ho, In, La, Lu, Nd, Pb, Pr, Sc, Se, Sm, Tm, Y, Yb | [86] |
| ICP-MS | As, Cd, Cr, Cu, Hg, Fe, Mn, Ni, Pb, Zn | [78] |
| ICP-MS | As, Ba, Cd, Co, Cu, Ni, Pb, Sb, Th, U | [84] |
| ICP-MS | Ag, Al, As, Be, Bi, Ce, Cd, Co, Cr, Cu, Dy, Er, Eu, Fe, Ga, Gd, Ho, In, La, Lu, Mn, Mo, Nd, Ni, Pb, Rb, Sb, Sc, Sm, Sn, Tb, Tl, Tm, U, V, Y, Yb, Zn | [10] |
| ICP-MS | Al, B, Ca, Cd, Co, Cr, Cu, Fe, K, Mg, Mn, Mo, Na, Ni, Pb, Ti, V, Zn | [87] |
| ICP-OES | Al, B, Ba, Ca, Cr, Cr, Cu, Fe, K, Mg, Mn, Na, Ni, Pb, Rb, Sr, Zn | [82] |
| ICP-OES | Cu, Fe, Mn, Zn | [75] |
| ICP-OES | Al, Ca, Fe, K, Mg, Ni, Pb, Se | [74] |
| ICP-OES | Cu, Fe, P, Pb, S, Zn | [50] |
| ICP-OES | As, Cd, Co, Cr, Fe, Mo, Pb, Zn | [73] |
| ICP-OES | Ca, Fe, K, Mg, Mn, Na, Sr, Zn | [84] |
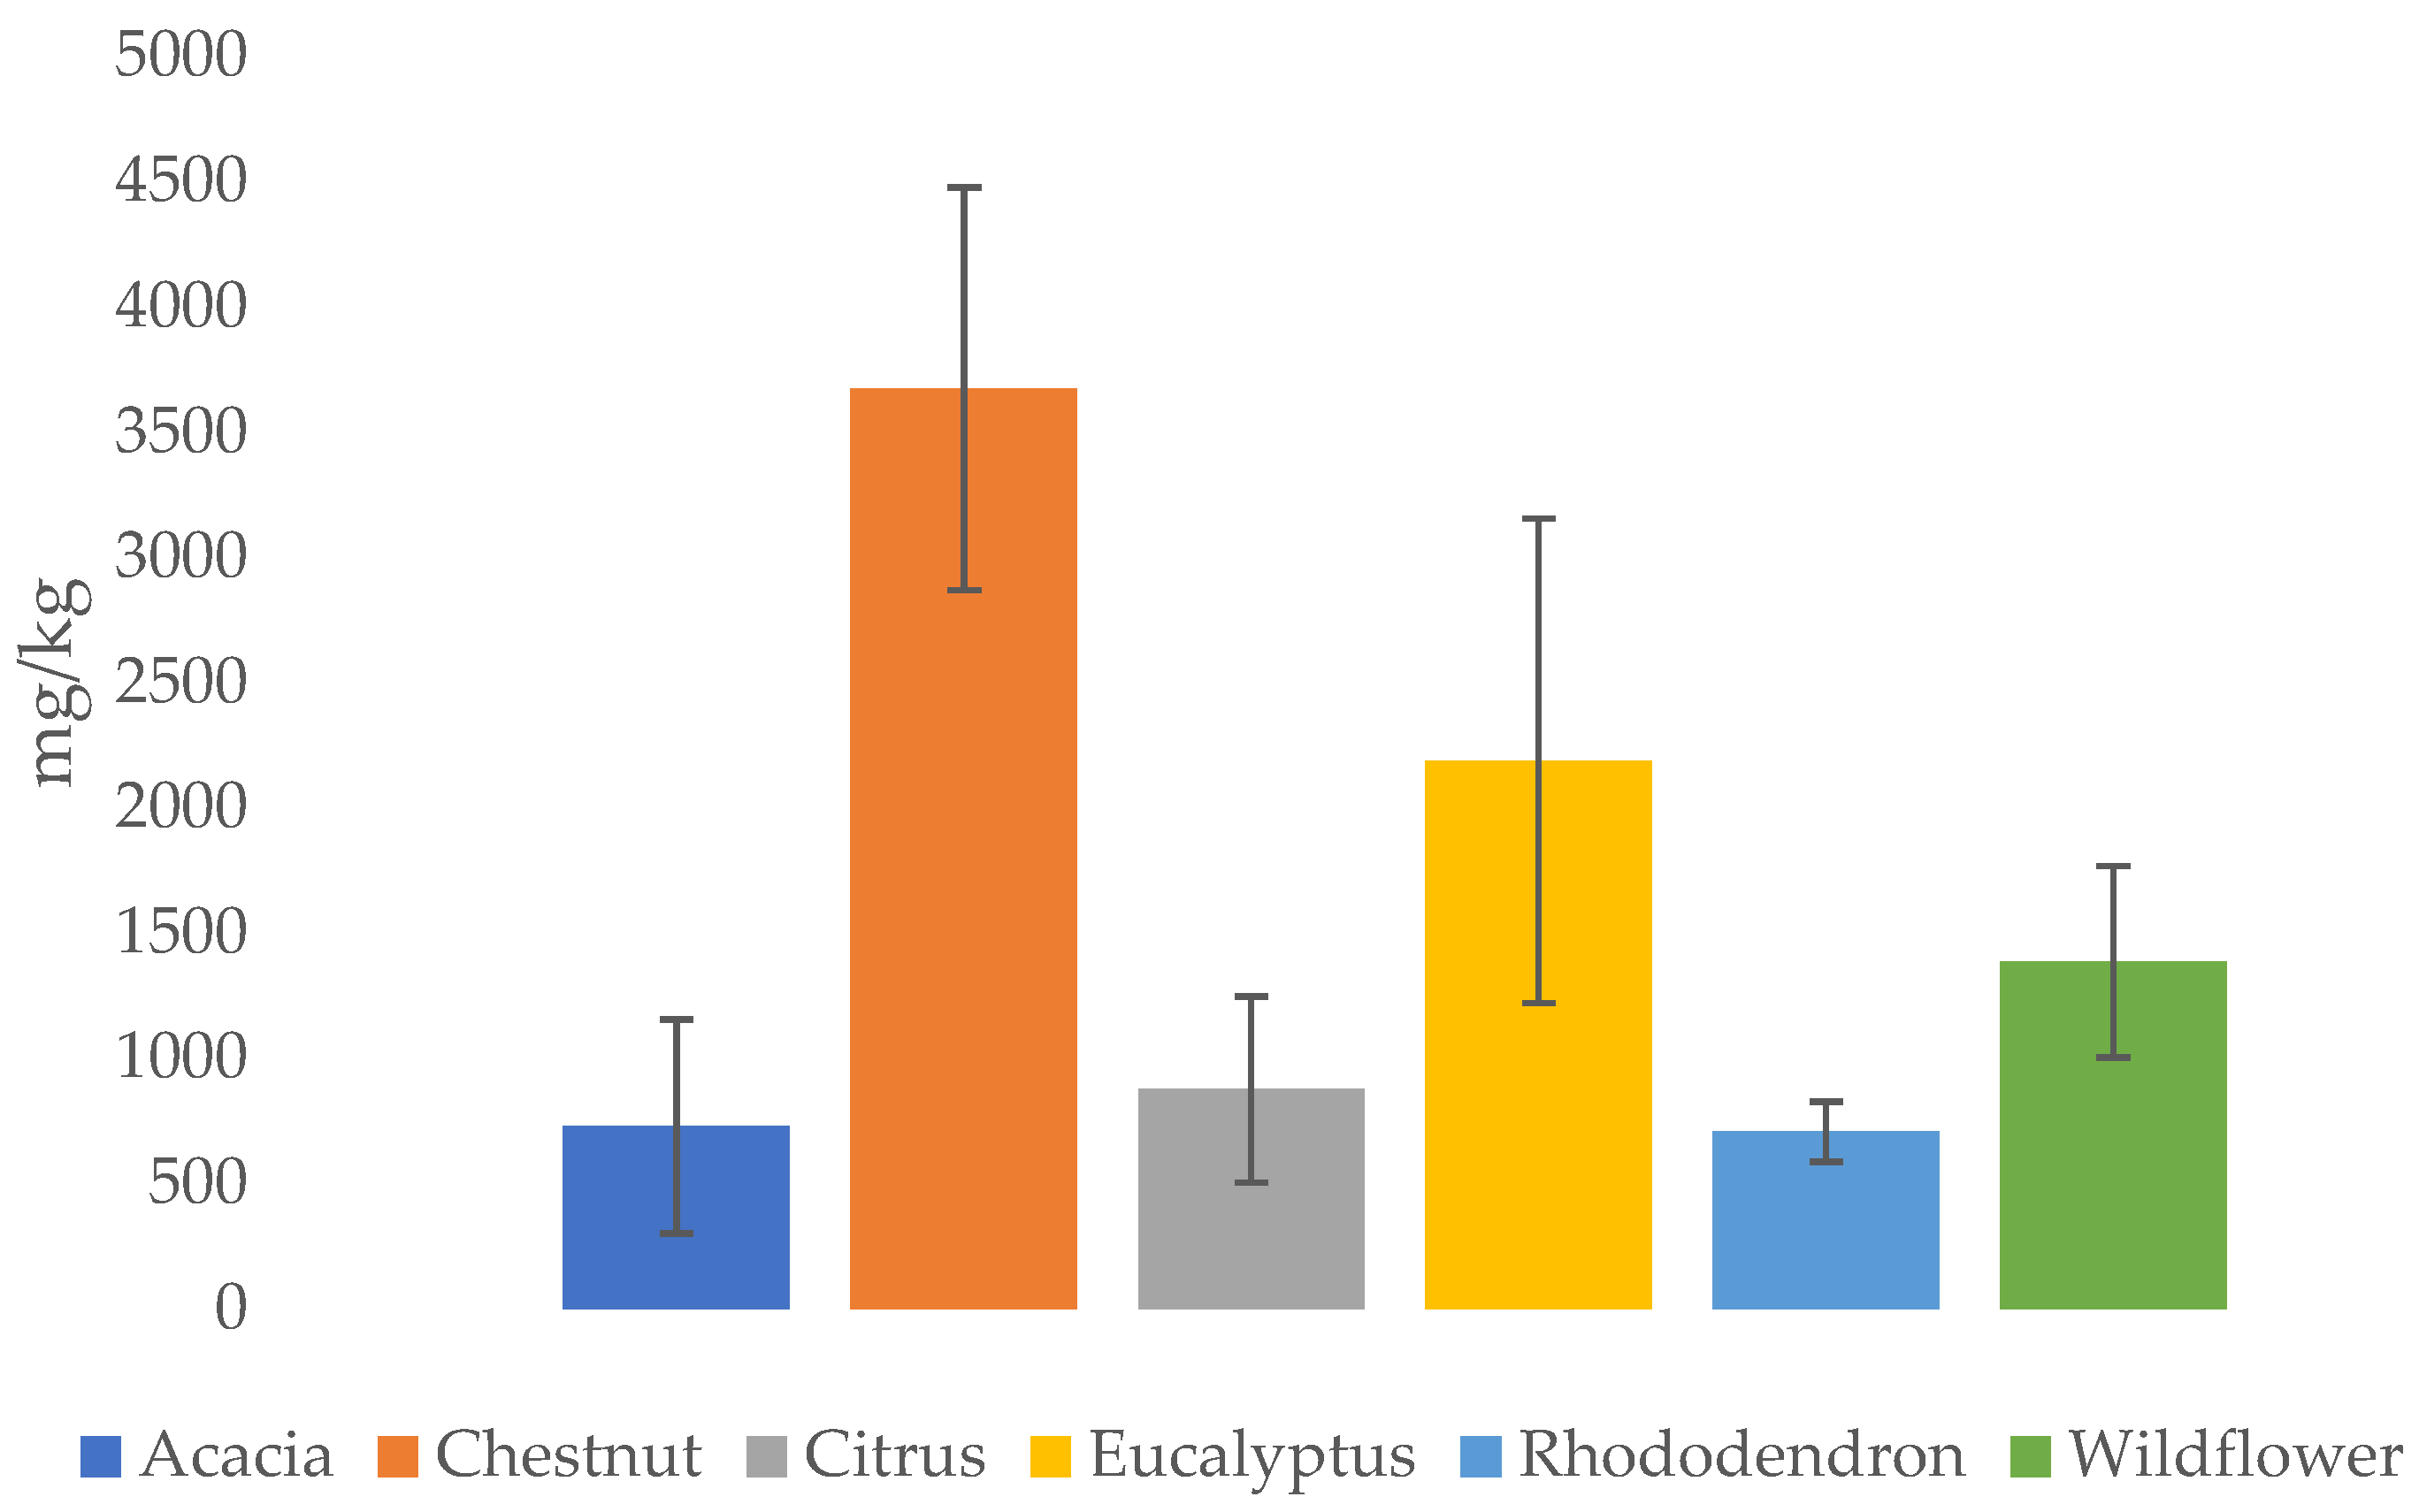
| Honey Type | Al | B | Ba | Ca | Cr | Cu | Fe | K | Mg | Mn | Na | Ni | Pb | Rb | Sr | Zn | References |
|---|---|---|---|---|---|---|---|---|---|---|---|---|---|---|---|---|---|
| Acacia | 0.52 0.60 | 3.70 | <LoD | 15 349 | <LoD 0.94 | 0.12 0.30 | 0.50 2.81 | 305 1150 | 5 8 | 0.20 1.71 | 4.1 33.9 | 0.19 | <LoD 0.06 | 0.8 1 | n.d. | 0.21 2.42 | [10,74,78,81,82,92] |
| Chestnut | 2.25 11.5 | 4.50 | 0.70 | 23 487 | <LoD 0.83 | 0.07 0.81 | 0.60 7.16 | 2824 5300 | 49 59 | 1.50 8.30 | 11.9 35.8 | 0.04 0.21 | 0.01 0.49 | 23 43 | 0.50 | 0.66 5.11 | [7,73,74,78,81,82,92] |
| Citrus | 0.70 8.50 | 6.20 | <LoD | 36 289 | <LoD 0.76 | 0.06 0.20 | 0.90 3.94 | 186 3110 | 6.0 | 0.2 0.81 | 17.1 | 0.08 0.1 | <LoD 0.37 | 1.0 | 0.20 | 0.5 3.94 | [73,74,82] |
| Eucalyptus | 2.0 9.28 | 6.40 | 0.20 | 112 372 | <LoD 0.53 | 0.17 0.98 | 1.67 3.53 | 1240 4940 | 18 | 1.65 1.80 | 112.4 | 0.1 0.21 | <LoD 0.11 | 2.0 | 0.4 | 0.8 9.51 | [73,74,82] |
| Molasses | 3.80 | 5.80 | 0.10 | 51.0 | <LoD | 1.20 | 1.50 | 2375 | 79.0 | 2.30 | 11.8 | 0.20 | 0.10 | 11.0 | 0.10 | 1.50 | [82] |
| Linden | 1.80 | n.d. | n.d. | 388 | 0.03 0.07 | 0.34 0.76 | 0.65 4.02 | 1574 | 25.5 | 1.29 3.20 | 31.9 | 0.04 0.32 | 0.01 0.08 | 8.6 | n.d. | 1.0 6.78 | [74,78,81,82] |
| Rhododendron | 1.20 2.10 | 2.00 | 0.10 | 17.0 | <LoD 0.09 | 0.20 0.96 | 0.57 1.10 | 659 | 15.0 | 1.40 2.20 | 3.70 | 0.1 0.15 | 0.02 0.10 | 4.2 5 | <LoD | 0.97 1 | [10,82,92] |
| Sage | n.d. | n.d. | n.d. | 173.9 | <LoD | <LoD | 4.17 | 769 | 11.6 | n.d. | 31.80 | n.d. | 0.51 | n.d. | n.d. | 0.94 | [81] |
| Wildflavour | 1.80 7.86 | 5.00 | 0.20 | 59 387 | <LoD 0.52 | 0.18 0.95 | 1.54 3.63 | 270 2460 | 27 40 | 0.55 2.30 | 10.2 36.1 | 0.10 0.22 | 0.03 0.17 | 5.9 8 | 0.10 | 1.02 6.82 | [10,73,74,78,81,82] |
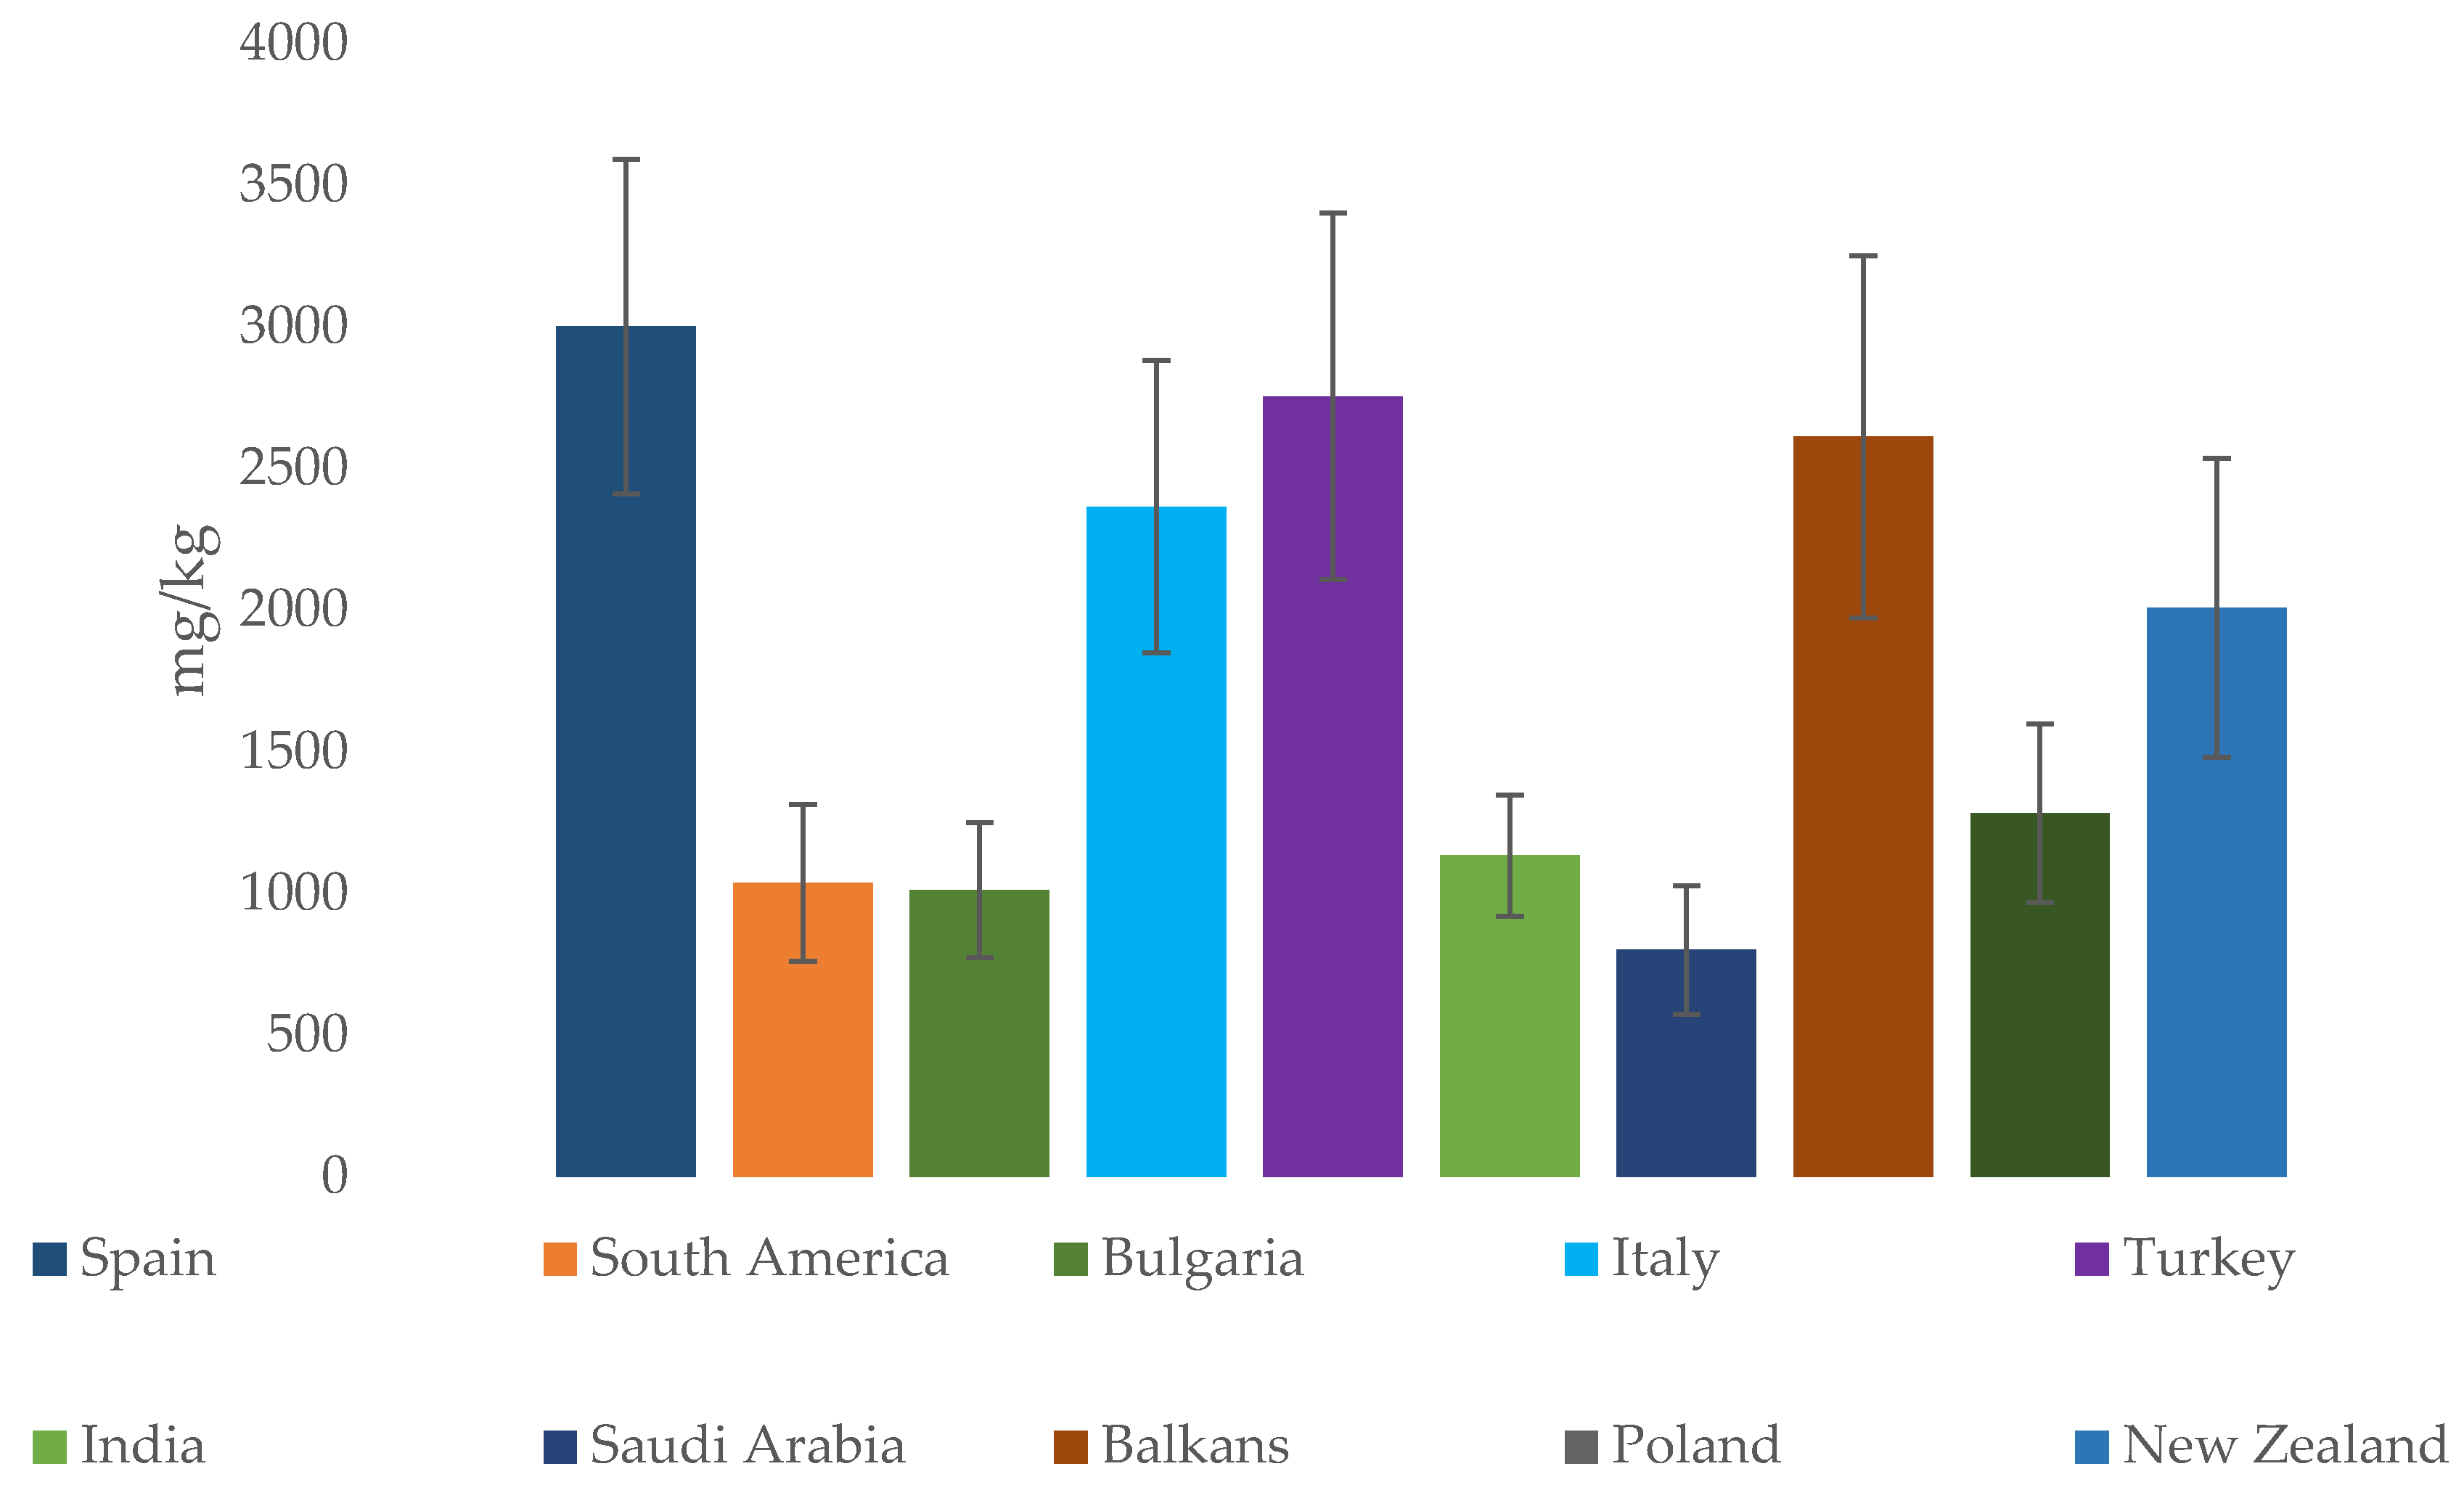
| Country/Region | Al | Ca | Cd | Co | Cr | Cu | Fe | K | Mg | Mn | Na | Ni | Pb | Zn | References |
|---|---|---|---|---|---|---|---|---|---|---|---|---|---|---|---|
| Ireland | n.d. | 111 125 | n.d. | n.d. | n.d. | 1.65 | 8.00 19.0 | 562 566 | 31 36.1 | 4 5.55 | 98 119 | n.d. | n.d. | 5 12.5 | [39,84] |
| Spain | n.d. | 13.8 341 | 0.001 0.36 | 0.001 0.72 | 0.001 4.48 | 0.04 7.80 | 0.84 60 | 14 6785 | 3.60 1079 | 0.01 27 | 11 1221 | 0.01 3.37 | <LOD 1.20 | 0.07 19.1 | [39,51,79,84] |
| South America | n.d. | 6.92 77.4 | 0 0.10 | n.d | n.d | 0.18 0.38 | 1.4 5.7 | 832 1023 | 17.3 26.3 | 0.37 2.61 | 32.2 48.0 | <LOD 0.40 | <LOD 0.20 | 0.85 2.00 | [10,44,51] |
| China | n.d. | 78.2 | 0.017 0.021 | 0.005 | 0.01 | 0.17 0.44 | 2.88 | 1673 | 45.1 | 1.81 | 9.52 | 0.06 | 0.03 0.05 | 1.27 1.40 | [51,87] |
| Italy | 0.52 2.6 | 9.10 409 | 0.001 0.30 | 0.002 0.057 | 0.01 0.10 | 0.14 5.90 | 0.30 35.1 | 147 4136 | 3.90 159 | 0.08 16.9 | 6.10 232 | 0.04 0.17 | 0.003 1.533 | 0.18 8.12 | [10,39,51,74,84] |
| Turkey | 0.004 28.7 | 3.30 900 | 0 0.34 | 0.001 0.03 | 0.001 1.04 | <LOD 3.50 | 0.04 19.7 | 143 7030 | 2 111 | <LOD 74.2 | 9.30 172 | <LOD 2.17 | <LOD 1.20 | <LOD 20.2 | [39,51,84] |
| India | n.d. | 32.6 84.6 | 0.05 0.55 | 0.25 | n.d | 1.06 2.90 | 3.60 28.4 | 490 932 | 18.5 205 | 0.9 10.2 | 97.9 304 | 0.05 0.65 | 0.05 0.92 | 1.10 29 | [39,51] |
| Saudi Arabia | n.d. | 1.5 27.7 | 0 0.04 | n.d | n.d | 0.21 0.6 | 0.31 8.39 | 9.3 1367 | 18.4 23.2 | 0.03 0.37 | 10 133 | n.d. | 0.03 0.24 | 0.2 3 | [39,51] |
| Balkans | 1.2 | 4.10 170 | 0.002 0.222 | 0.01 0.09 | 0 0.4 | <LOD 5.90 | 0.03 7 | 169 3323 | 4.40 182 | 0.11 82 | 5.90 150 | 0.02 1.3 | <LOD 2 | 0.31 15 | [10,39] |
| Poland | n.d. | 3.3 159 | 0 0.03 | 0 0.3 | 0 0.5 | <LOD 1.82 | <LOD 16.1 | 7.7 3659 | 1.10 145 | 0.10 8 | 0.38 131 | <LOD 0.5 | <LOD 0.07 | <LOD 22.3 | [39,51] |
| Egypt | n.d. | n.d | 0 0.5 | 1.75 3.2 | n.d. | <LOD 1.75 | 21.5 3690 | 213 15,550 | 102 1325 | 0.46 5.7 | 378 2550 | <LOD 4.10 | 0.86 9.30 | 1.63 9.3 | [39,51] |
| New Zealand | 0.21 21.3 | 7.21 94.3 | 0.01 0.45 | n.d | 0.12 0.55 | 0.09 0.70 | 0.67 3.39 | 34.8 3640 | 7.52 86.3 | 0.18 4.75 | 1.10 110 | 0.02 0.65 | 0.01 0.04 | 0.20 2.46 | [51] |
| Bulgaria | 0.24 1.58 | 32 110 | 0.01 | 0.01 | 0.01 0.02 | 0.01 0.04 | 0.35 4.37 | 105 1628 | 6.00 97 | 0.06 12.7 | 7.22 16.3 | 0.01 1 | 0.08 0.31 | 0.08 1.17 | [51] |
| Sudan | n.d. | 35.6 82.9 | 0.01 | 0.005 1.17 | 0.01 | 2.94 58.1 | 2.05 33.65 | 17.6 74.7 | 23.7 177 | 0.12 1.02 | 14.1 28.2 | <LOD 4.06 | <LOD 0.45 | 4.86 9.61 | [51] |
Disclaimer/Publisher’s Note: The statements, opinions and data contained in all publications are solely those of the individual author(s) and contributor(s) and not of MDPI and/or the editor(s). MDPI and/or the editor(s) disclaim responsibility for any injury to people or property resulting from any ideas, methods, instructions or products referred to in the content. |
© 2025 by the authors. Licensee MDPI, Basel, Switzerland. This article is an open access article distributed under the terms and conditions of the Creative Commons Attribution (CC BY) license (https://creativecommons.org/licenses/by/4.0/).
Share and Cite
Inaudi, P.; Garzino, M.; Abollino, O.; Malandrino, M.; Giacomino, A. Honey: Inorganic Composition as Possible Marker for Botanical and Geological Assignment. Molecules 2025, 30, 1466. https://doi.org/10.3390/molecules30071466
Inaudi P, Garzino M, Abollino O, Malandrino M, Giacomino A. Honey: Inorganic Composition as Possible Marker for Botanical and Geological Assignment. Molecules. 2025; 30(7):1466. https://doi.org/10.3390/molecules30071466
Chicago/Turabian StyleInaudi, Paolo, Matteo Garzino, Ornella Abollino, Mery Malandrino, and Agnese Giacomino. 2025. "Honey: Inorganic Composition as Possible Marker for Botanical and Geological Assignment" Molecules 30, no. 7: 1466. https://doi.org/10.3390/molecules30071466
APA StyleInaudi, P., Garzino, M., Abollino, O., Malandrino, M., & Giacomino, A. (2025). Honey: Inorganic Composition as Possible Marker for Botanical and Geological Assignment. Molecules, 30(7), 1466. https://doi.org/10.3390/molecules30071466