Article

Electronic–Oxygen Synergy at Ca-Fe Dual-Metal Interfaces for Selective Syngas Regulation in Biomass Chemical Looping Gasification

1
School of Energy and Environmental Engineering, University of Science and Technology Beijing, Beijing 100083, China
2
Beijing Key Laboratory of Resource-Oriented Treatment of Industrial Pollutants, University of Science and Technology Beijing, Beijing 100083, China
3
School of Resource and Safety Engineering, University of Science and Technology Beijing, Beijing 100083, China
4
Key Laboratory of Efficient Mining and Safety of Metal Mines, Ministry of Education, University of Science and Technology Beijing, Beijing 100083, China
5
Faculty of Science, University of the Fraser Valley, Abbotsford, BC V2S 7M8, Canada
*
Authors to whom correspondence should be addressed.
Molecules 2025, 30(7), 1471; https://doi.org/10.3390/molecules30071471
Submission received: 4 March 2025 / Revised: 24 March 2025 / Accepted: 25 March 2025 / Published: 26 March 2025

Abstract

:
This study reveals the efficient catalytic role of Ca-Fe-based oxygen carriers (Ca2Fe2O5) in biomass chemical looping gasification. With oxygen carrier introduction, the CO yield doubled (0.13 Nm3/kg→0.26 Nm3/kg), with 76.10% selectivity. Steam co-feeding further increased the H2 yield from 0.19 Nm3/kg to 0.72 Nm3/kg, significantly elevating the H2/CO ratio to 2.62. Combined with density functional theory (DFT), the micro-mechanism of reduced oxygen carrier surfaces activating CO2/H2O was elucidated. CO2 (adsorption charge −0.952 |e|) and H2O (adsorption charge −0.612 |e|) chemically adsorb at the CaO(111)/Fe(110) interface, where Fe atoms (charges 0.433 |e|, 0.927 |e|) act as electron donors to drive efficient molecule activation. CO2 undergoes single-step splitting (CO2→CO* + O*), with the desorption energy barrier (Ea = 1.09 eV, 105.17 kJ/mol) determining the reaction rate. H2O splits via two-step cleavage (H2O→HO* + H*→2H* + O*), which is rate-limited by the first step (Ea = 0.42 eV, 40.52 kJ/mol). Simultaneously, the reduced oxygen carrier achieves oxidative regeneration through surface O* lattice incorporation. This work atomically reveals the “electron transfer–oxygen transport” synergy at the Ca-Fe bimetallic interface, establishing a theoretical framework for the directional regulation of the syngas composition and the design of high-performance oxygen carriers.

1. Introduction

The urgent need for global energy structure transformation has driven the rapid development of renewable energy technologies represented by biomass energy. As a carbon-neutral renewable energy source that can be directly converted into high-grade fuels, the efficient utilization of biomass energy holds strategic significance in achieving “dual-carbon” goals [1,2,3]. According to International Energy Agency (IEA) statistics, the global annual utilizable biomass resources exceed 1.3 × 10¹¹ tons of standard coal equivalents, but their energy conversion efficiency remains below 10% [4]. High-efficiency biomass gasification technology has become one of the focal points in international energy research under carbon neutrality objectives [5,6]. However, traditional gasification processes face bottlenecks, such as the insufficient secondary cracking of tar, low product selectivity (uncontrollable H2/CO ratio) and inadequate carbon conversion rates [7,8,9]. These limitations reduce the system efficiency and increase the processing costs, severely constraining large-scale applications.
In recent years, chemical looping gasification technology has achieved the directional conversion of biomass into syngas (H2/CO) through redox cycles of oxygen carriers [10,11,12]. A typical chemical looping gasification system consists of a fuel and air reactor, where the former facilitates biomass gasification. At the same time, the latter enables the combustion of incompletely converted biomass and oxygen carrier regeneration [12]. In chemical looping gasification systems, oxygen carriers (typically metal oxides like Fe2O3) utilize lattice oxygen instead of O2 as the oxygen source for fuel reactors [13,14], thereby eliminating the oxygen preparation costs [15]. The incomplete oxidation of biomass with oxygen carriers produces CO, enhancing the gas’ calorific value. Metal oxide oxygen carriers also exhibit catalytic effects on biomass tar cracking [16,17,18], addressing traditional gasification’s shortcomings.
Building upon chemical looping gasification, recent advancements include chemical looping gasification–water splitting (CLGWS) and chemical looping gasification–CO2 splitting (CLGCS) technologies [19,20,21]. These systems integrate splitting processes to convert CO2/H2O into CO/H2, as illustrated in Figure 1. By introducing H2O and CO2 between the fuel and air reactors, the reduced oxygen carriers undergo oxidation to generate high-purity H2 and CO. Subsequently, the partially oxidized oxygen carrier is completely regenerated in air reactors. Both chemical looping gasification–water splitting and chemical looping gasification–CO2 splitting processes rely critically on the oxygen carrier performance [22,23,24,25], which directly determines the gas product quality and yield [26].
Recent studies reveal that composite oxygen carriers [27] can overcome the limitations of single-metal oxygen carriers, such as their poor cycling capacity, instability and low reactivity [28]. Ca-based oxygen carriers have gained attention in chemical looping gasification research due to their cost-effectiveness, ability to reduce the CO2 yield and tar catalytic cracking properties [28,29,30,31,32]. Chan et al. [33] demonstrated that CaO/Fe2O3 oxygen carriers can enhance syngas production with high H2/CO ratios through the co-gasification of biomass and polyethylene.
Performance analyses of Ca-Fe composite oxygen carriers show that Ca2Fe2O5 significantly improves the steam conversion efficiency and H2 yield during gasification [34]. Its moderate oxidation capacity facilitates high-quality syngas production [35].
Density functional theory (DFT) calculations have proven effective in investigating the geometric and electronic structures of metal oxide interfaces, providing atomic-level insights into their properties [36,37,38,39,40]. Feng et al. [37] employed DFT to explore the CH4 conversion pathways in Ca2Fe2O5 oxygen carriers, offering theoretical support for enhanced CH4 conversion efficiency. DFT revealed that [39] Ni doping lowers the oxygen vacancy formation energy and enhances CO2 adsorption, promoting CO2 activation and splitting. Thus, DFT has enabled novel chemical looping gasification systems for CO2 utilization.
This study investigates the direct/steam chemical looping gasification of Ca2Fe2O5 oxygen carriers with Chlorella vulgaris (biomass) through comparative experiments with blank (SiO2) and steam groups, analyzing the oxygen carrier regulation mechanisms through carbon conversion, H2/CO selectivity and the gas calorific value. Using DFT simulations, we construct a CaO(111)/Fe(110) composite interface model to elucidate the complete adsorption–activation–dissociation process of CO2/H2O molecules on reduced Ca2Fe2O5 oxygen carriers (dual-metal sites), including the adsorption energy, transition state geometries and electronic density of state variations. The findings can guide the development of highly stable and selective oxygen carriers in chemical looping gasification–water splitting and chemical looping gasification–CO2 splitting processes.

2. Results and Discussion

2.1. Chemical Looping Gasification Experimental Results

The experimental conditions for chemical looping gasification are listed in Table 1, labeled as A1, A2 and A3. The chemical looping gasification gas production results for each group are shown in Figure 2.
Compared to A1 (without the oxygen carrier), A2 exhibited significant increases in the carbon conversion rate and total gas yield, indicating that adding the oxygen carrier promoted biomass gasification. Although the lower heating value (LHV) of the gas of A2 decreased due to reduced concentrations of high-calorific components such as CH4 and C2Hm, the yields of CO2, H2 and CO all showed positive growth. Notably, the CO gas yield remarkably increased from 0.13 Nm3/kg to 0.26 Nm3/kg, doubling in value. The CO selectivity of A2 improved to 76.10% relative to A1, demonstrating that CO2 was selectively converted to CO under the influence of the oxygen carriers. Previous studies have confirmed that reduced-state Ca2Fe2O5 can decompose CO2 into CO [21].
When steam was introduced to A2 (forming A3), the carbon conversion rate and total gas yield continued to rise. The H2 gas yield increased substantially from 0.19 Nm3/kg to 0.72 Nm3/kg, and the H2/CO ratio significantly improved from 0.60 to 2.62. This indicates that oxygen carriers can effectively enhance H2 production. Research by [20,35,39] revealed that reduced Ca2Fe2O5 undergoes steam oxidation regeneration to its initial state while efficiently releasing H2.
To further investigate the microscopic interaction mechanisms between reduced Ca2Fe2O5 and H2O/CO2, this study employed DFT to calculate and simulate energy exchange and reaction pathways. Before the calculations, the reduced Ca2Fe2O5 was characterized to ensure the reliability of the model construction.

2.2. Characterization of Oxygen Carriers

The physicochemical properties of the Ca2Fe2O5 oxygen carrier before and after reduction were analyzed by XRD, as shown in Figure 3a,b. The reduction performance of Ca2Fe2O5 was investigated through H2-TPR testing, with the results shown in Figure 3c.
As shown in Figure 3a, the primary component of the fresh oxygen carrier was Ca2Fe2O5. Figure 3c reveals two characteristic reduction peaks for Ca2Fe2O5 at 610 °C and 860 °C. Combined with the phase analysis of the reduced sample by XRD (Figure 3b), the high-intensity characteristic peaks at 37.3° and 44.8° correspond to the (111) crystal plane of CaO and the (110) crystal plane of Fe, respectively. It is inferred that these two reduction peaks correspond to the two-step reduction process: Ca2Fe2O5→FeO + CaO and FeO→Fe. These characterization results indicate that Ca2Fe2O5 preferentially exposes the CaO(111)/Fe(110) crystal planes during reduction. The CaO(111)/Fe(110) composite interface was selected as the simplified computational model for reduced Ca2Fe2O5 to balance computational efficiency and model representativeness.

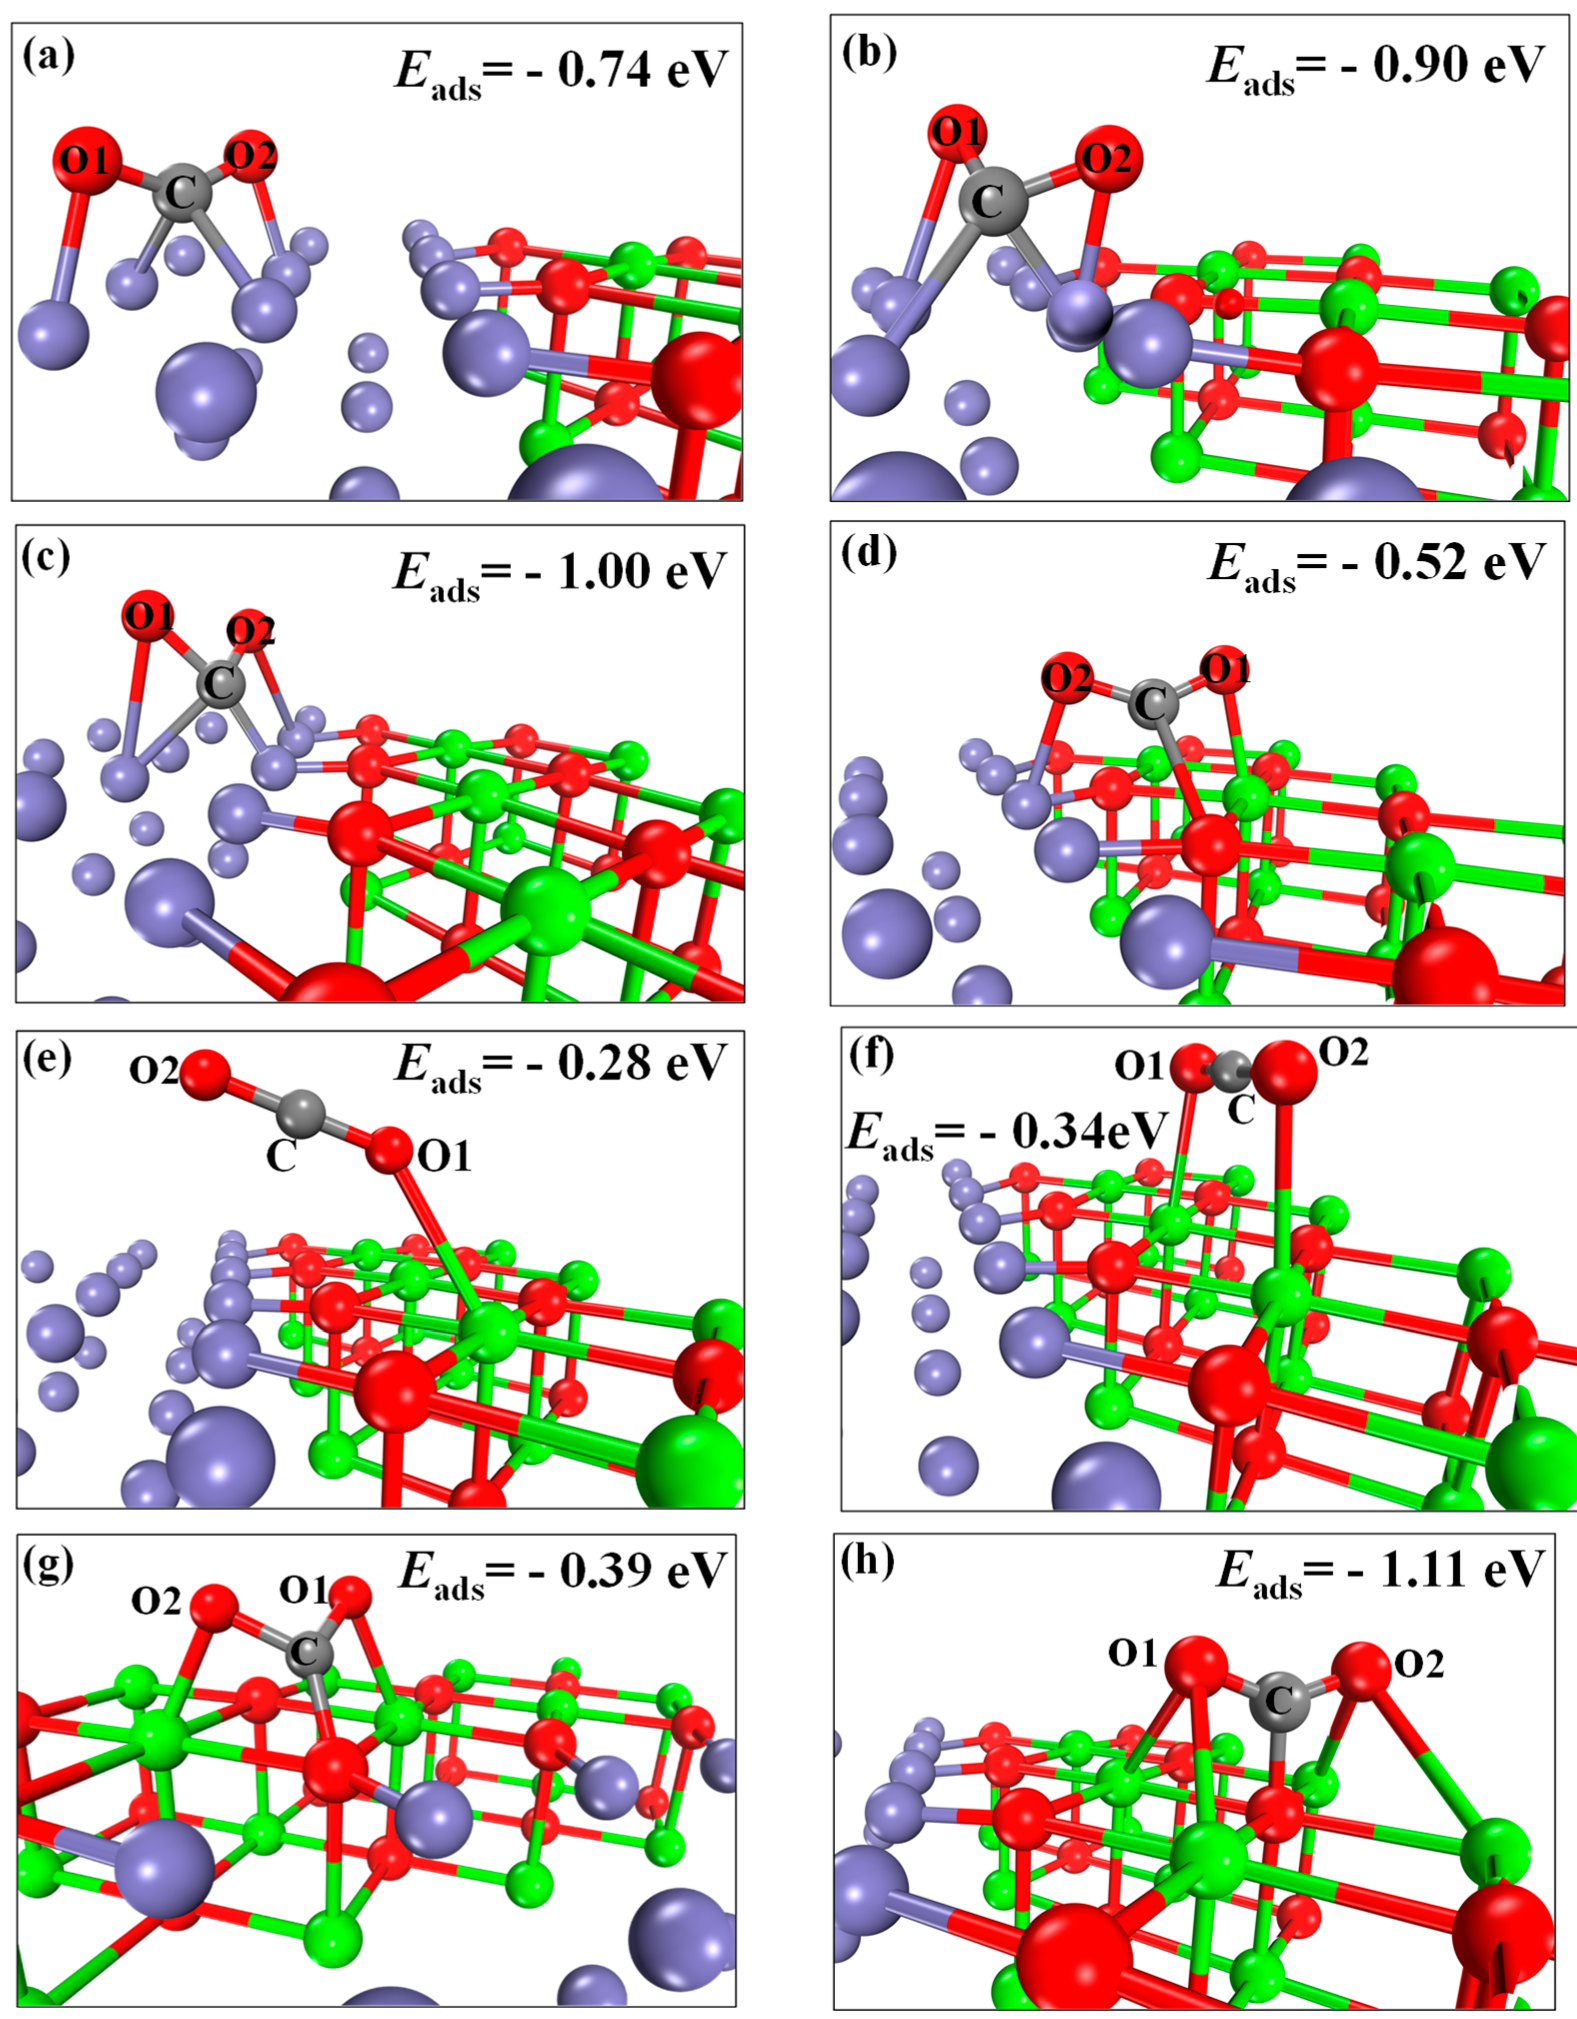
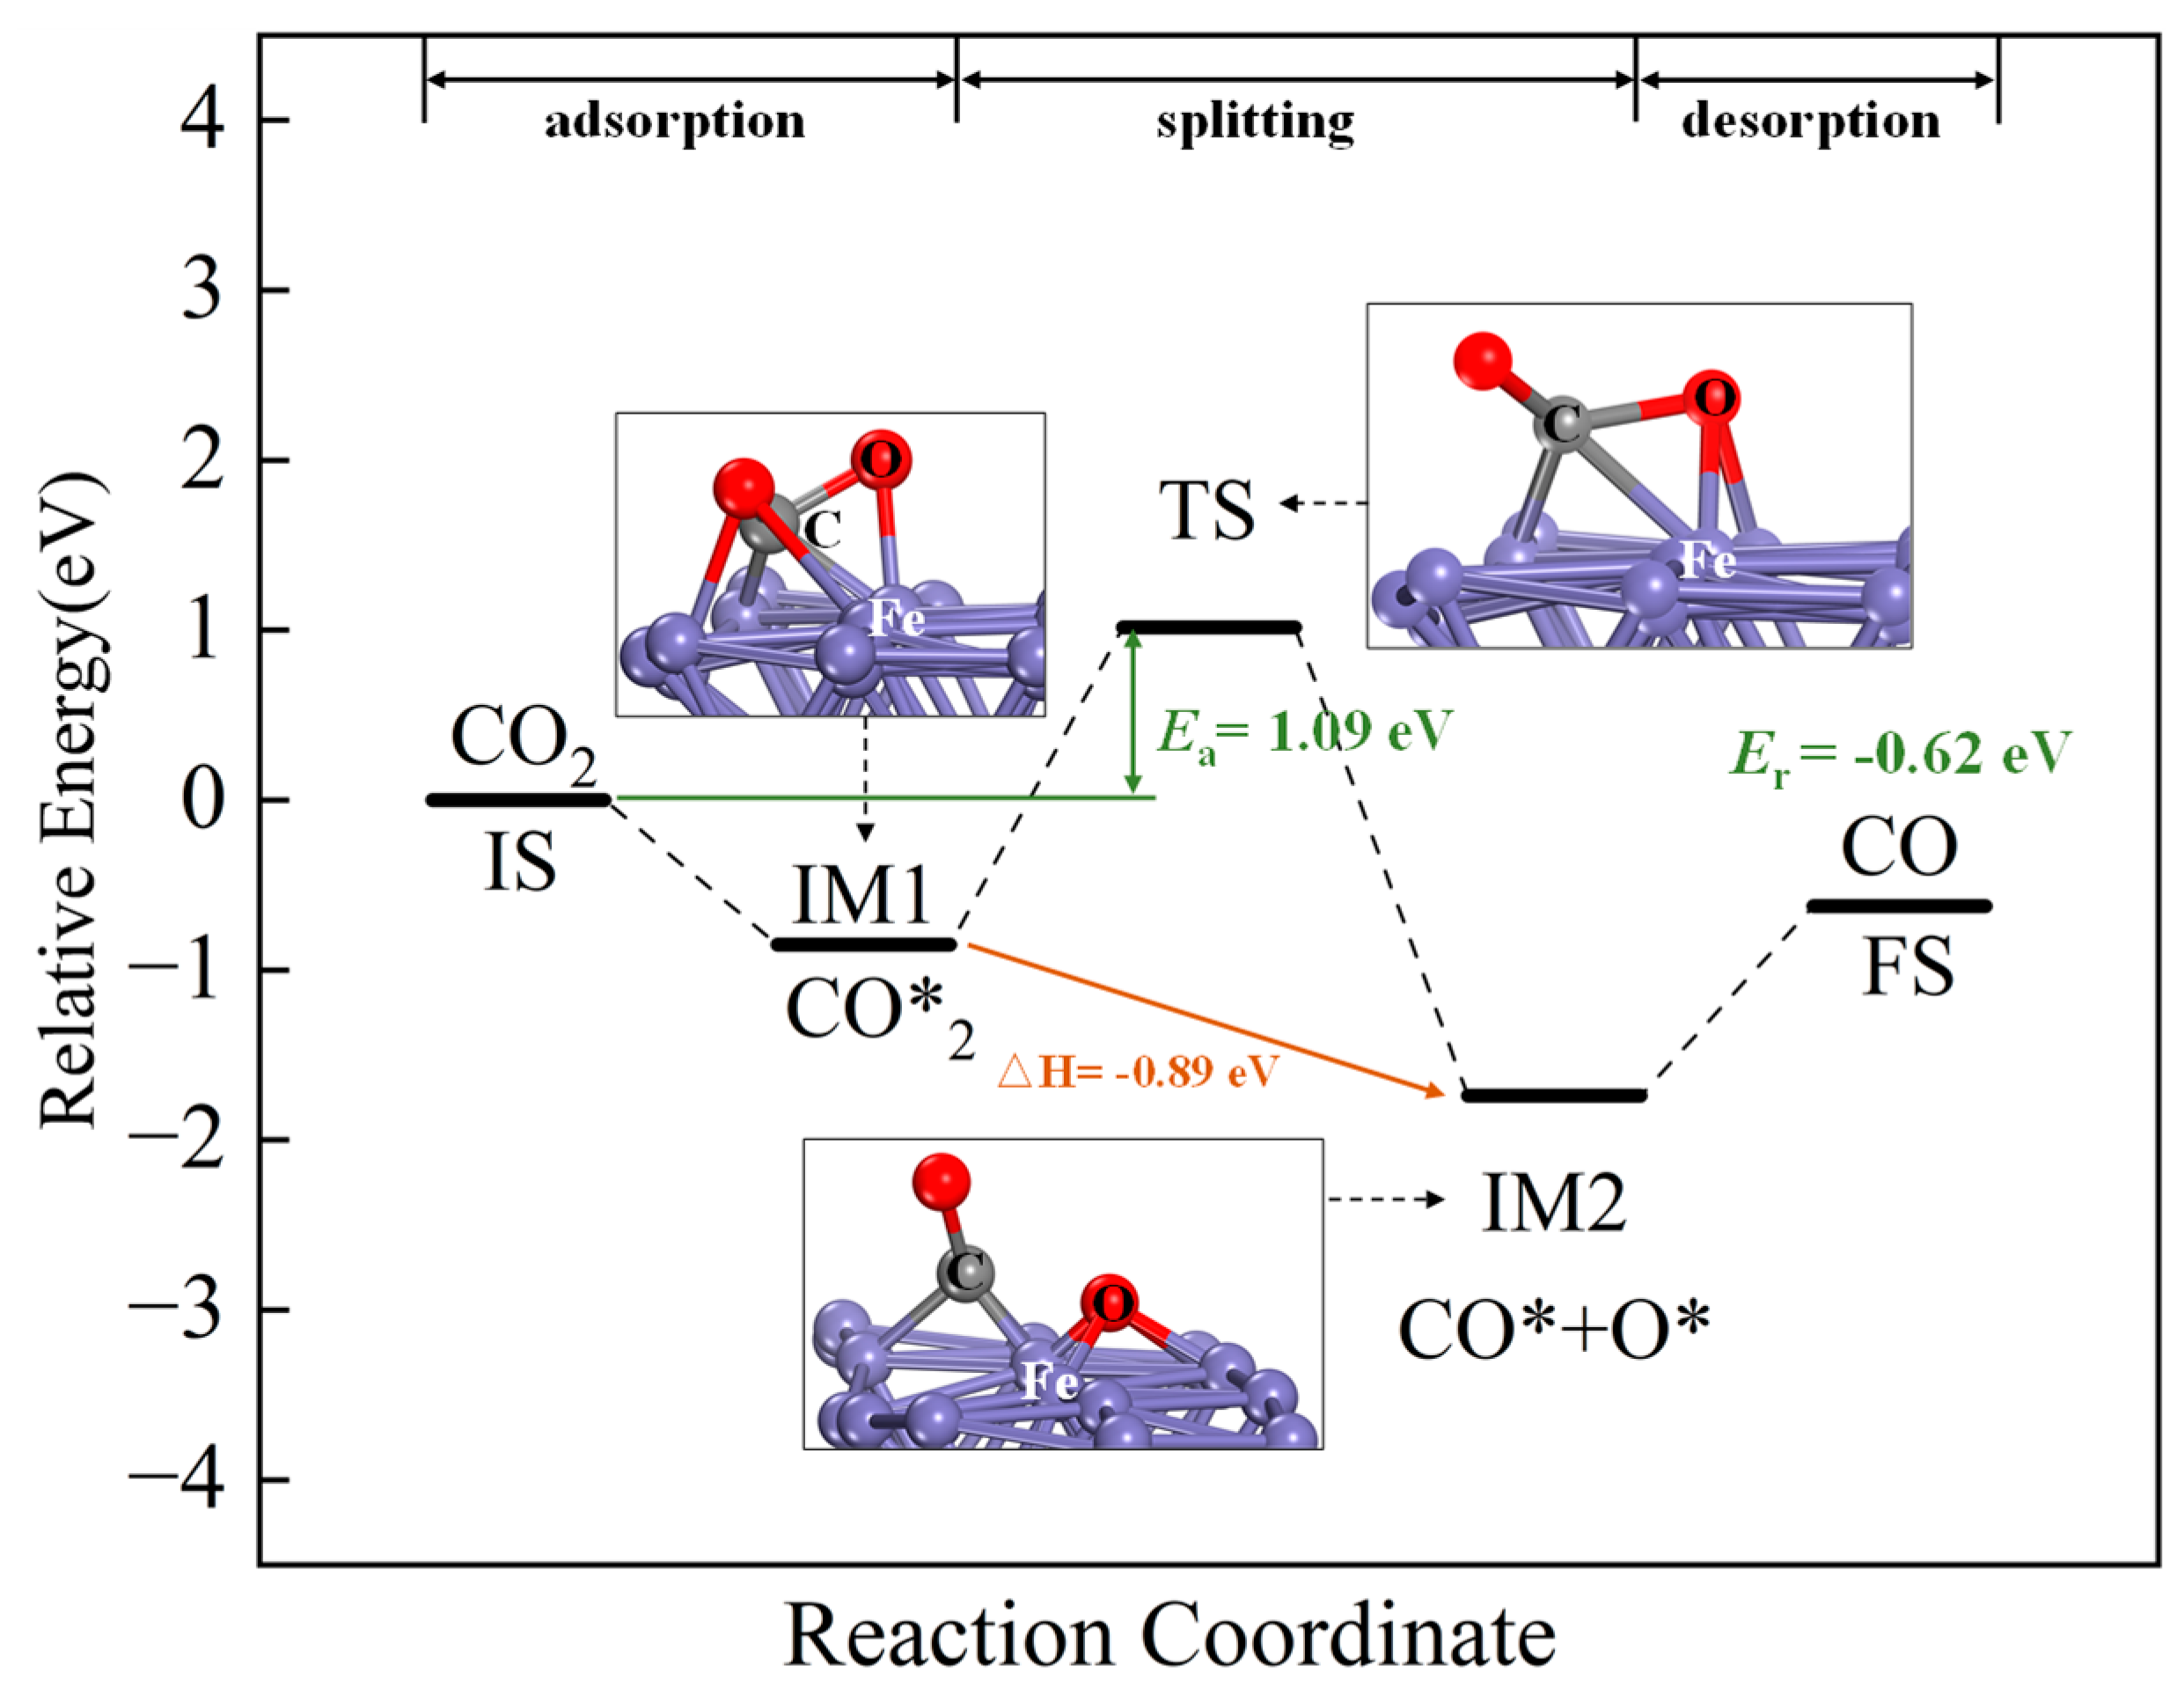
2.3. CO2 Adsorption and Splitting

Based on literature reports and the gasification experiments described in Section 2.1, the reaction between CO2 (as a gaseous oxidizer) and the reduced oxygen carrier is the key step for CO generation. This study employs DFT simulations to investigate the CaO(111)/Fe(110) composite interface system, aiming to reveal the dynamic activation mechanism of CO2 molecules at the interface.
The adsorption configurations of CO2 on the CaO(111)/Fe(110) composite interface are shown in Figure 4a–h. Configurations (a)~(c) represent three adsorption configurations of CO2 at Fe-Fe bridge sites. Configuration (d) corresponds to CO2 adsorption at the O top site between Ca and Fe. Configuration (e) shows CO2 adsorption at the Ca top site. Configuration (f) demonstrates CO2 adsorption at the Ca-Ca bridge site. Configurations (g) and (h) illustrate CO2 adsorption at the O top sites between Ca and Ca. The adsorption energies for (a)~(h) are −0.74, −0.90, −1.00, −0.52, −0.28, −0.34, −0.39, and −1.11 eV (−71.40, −86.84, −96.49, −50.17, −27.02, −32.81, −37.63, and −107.10 kJ/mol), respectively. A more negative adsorption energy (larger absolute value) indicates lower system energy and greater structural stability. Thus, configuration (c) is the most stable for CO2 adsorption on Fe sites, and configuration (h) is the most stable on CaO sites. Configuration (h) corresponds to CO2 chemisorption at alkaline CaO sites, forming CaCO3. However, as shown in Figure 5, at 800 °C, the standard Gibbs free energy △G > 0 of CaCO3, making it thermodynamically unstable. In contrast, the reaction between Fe atoms on CaO(111)/Fe(110) and CO2 exhibits a negative △G (△G < 0), indicating that the reaction can proceed spontaneously. Consequently, configuration (c) becomes the optimal stable state. In this configuration, the C-O1 and C-O2 bond lengths measure 1.2863 Å and 1.2990 Å, respectively, exceeding the original C-O bond length of CO2 (1.1768 Å) by 0.1095 Å and 0.1222 Å. This elongation unequivocally confirms CO2 activation at Fe catalytic sites.
Figure 6 presents the geometry and charge redistribution analysis for CO2 adsorption on CaO(111)/Fe(110). Figure 6a represents the most stable configuration (c) from Figure 4, where CO2 chemisorbs atop an Fe atom, forming an Fe-C bond (1.9218 Å) with an adsorption energy of −1.00 eV (−96.49 kJ/mol). In the deformation charge density map, blue regions denote electron gains (acceptors), and pink regions denote electron losses (donors). The analysis reveals charge transfer during adsorption: C, O1 and O2 act as electron acceptors, while Fe1 and Fe2 act as electron donors. This indicates electron transfer from reduced Ca2Fe2O5 to adsorbed CO2. A Bader charge analysis (Table 2) shows that CO2 in configuration (a) gains −0.952 |e|, acting as an electron acceptor. In Figure 6b, configuration (b) represents CO2* (after electron gain) forming CO* via O migration. Configuration (b) has an adsorption energy of −2.24 eV (−216.13 kJ/mol), indicating higher stability. The deformation charge density analysis shows C, O2 and Fe1 as electron acceptors and O1 and Fe2 as electron donors. The total charges of CO2* before and after adsorption are −0.963 |e| and −1.421 |e|, respectively, confirming CO* as an electron acceptor.
To elucidate the electronic interactions between CaO(111)/Fe(110) and CO2, the partial density of states (PDOS) of C, O and Fe atoms before and after CO2 adsorption on CaO(111)/Fe(110) was calculated. The PDOS reveals the electronic structure and chemical bonding characteristics by decomposing the density of states into individual atomic orbitals (e.g., s, p and d orbitals). As shown in Figure 7, the bonding strength between C and O atoms is reflected by the overlapping of the peaks and their positions relative to the Fermi level (0 eV). Comparing the PDOS results before and after adsorption (Figure 7a,b), new peaks emerge at −8.16 eV and −9.93 eV, indicating the formation of new chemical bonds between Fe atoms and the C atom of CO2 after adsorption. Figure 7b,d demonstrate significant peak overlap between C and Fe atoms at −8.16 eV and −9.93 eV post-adsorption. Comparing Figure 7e,f, as well as Figure 7g,h, new peaks at the same positions as in Figure 7b appear in Figure 7f,h. This suggests that interactions between Fe atoms and the O atoms of CO2 create lower-energy orbitals, weakening the covalent bond between C and O. In Figure 7f,h, the p orbitals of O atoms near the Fermi level shift to lower-energy states. Similarly, the d orbitals of Fe in Figure 7b and the p orbitals of C in Figure 7d shift to lower energy levels. These observations imply that interactions between CO2 and Fe atoms in CaO(111)/Fe(110) reduce the system’s energy, leading to the formation of new molecular orbitals.
Starting from the most stable adsorption configuration, the reaction pathways of CO2 are shown in Figure 8. The initial state (IS) corresponds to the adsorbed CO2. CO2 dissociates to form CO* and O*, with CO* desorbing from the surface to ultimately form gaseous CO as the final state (FS). CO2 adsorption on Fe sites is exothermic. Two possible reaction pathways for CO2 splitting were identified. Both pathways are exothermic (−0.89 eV (−85.87 kJ/mol) and −1.76 eV (−169.82 kJ/mol)), with activation energies of 1.09 eV (−105.17 kJ/mol) and 1.82 eV (−175.60 kJ/mol), respectively. Thermodynamically, both paths are feasible, but Pathway 1 (lower activation energy) is kinetically favored and identified as the optimal pathway.
The energy profile of the optimal pathway, including intermediates, transition states and final states, is shown in Figure 9. The dissociation reaction produces CO* and O* adsorbed on the surface. The O atom adsorbs on an Fe site, forming an Fe-O bond (1.9332 Å), close to the Fe-O bond length in Fe2O3 (1.9440 Å) [41]. The reaction energy is −0.62 eV (−59.82 kJ/mol), corresponding to Fe oxidation. CO desorbs into the gas phase, achieving CO reduction and the oxidative regeneration of reduced Ca2Fe2O5.

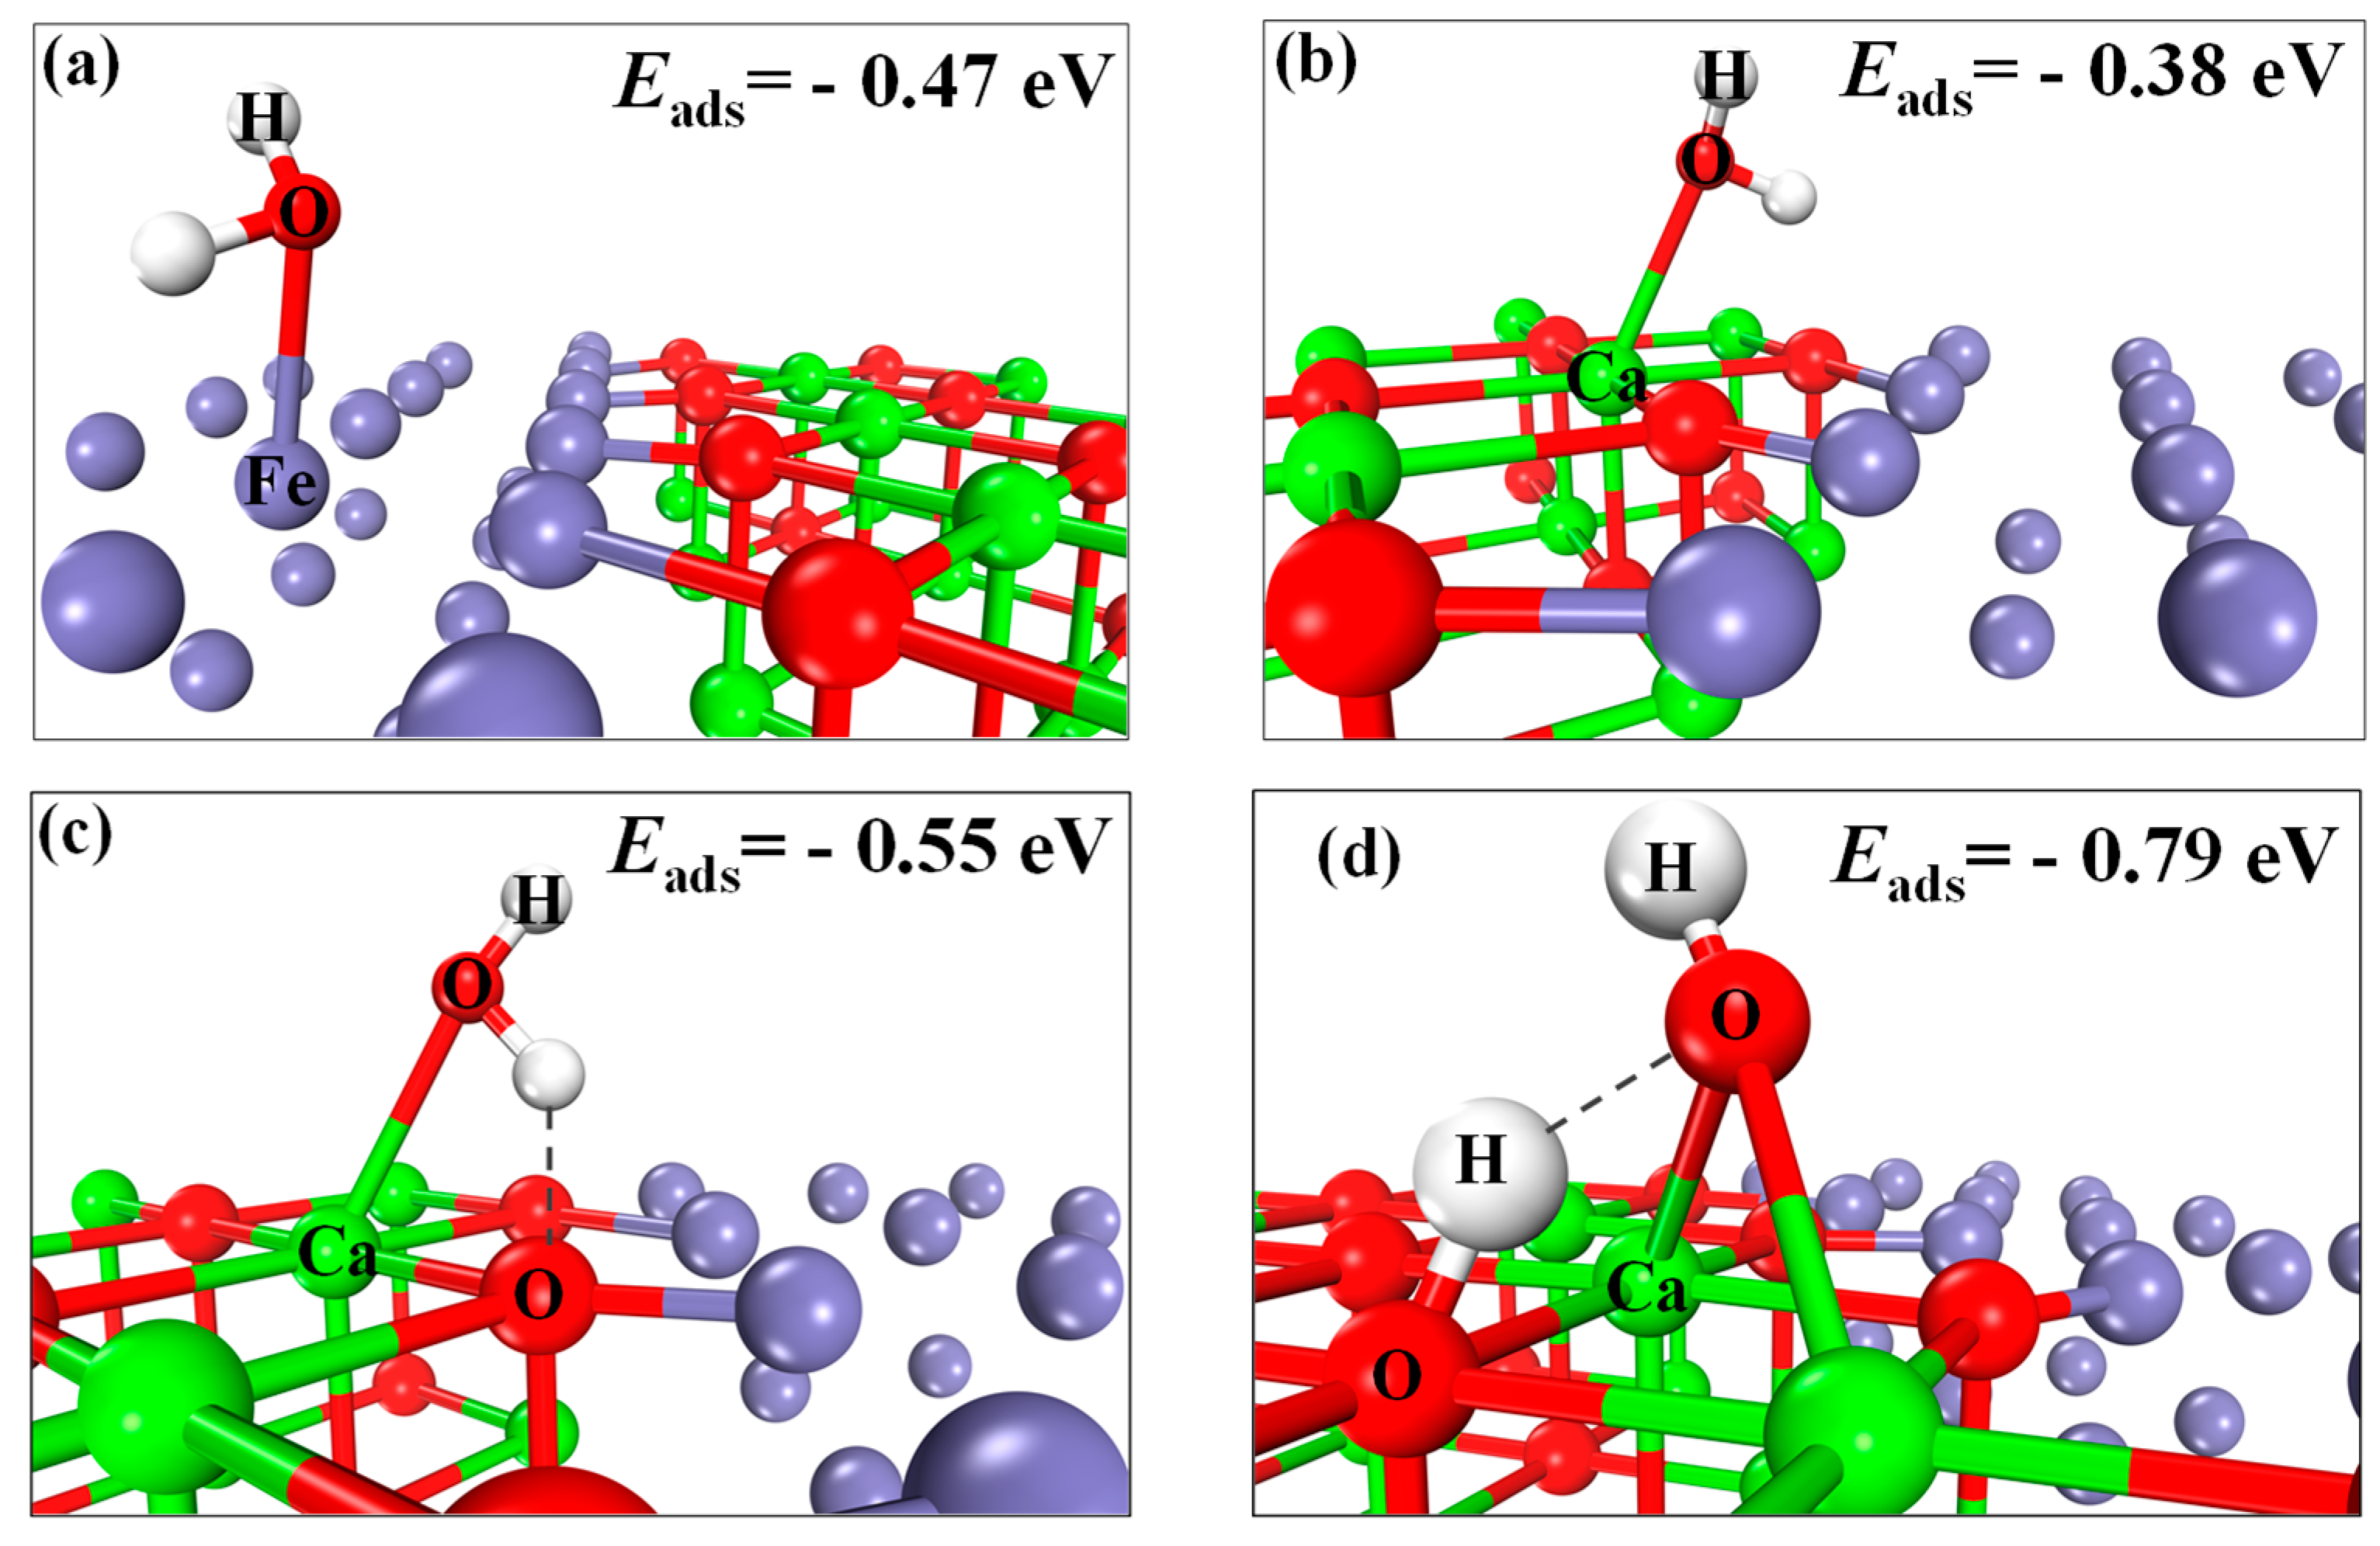
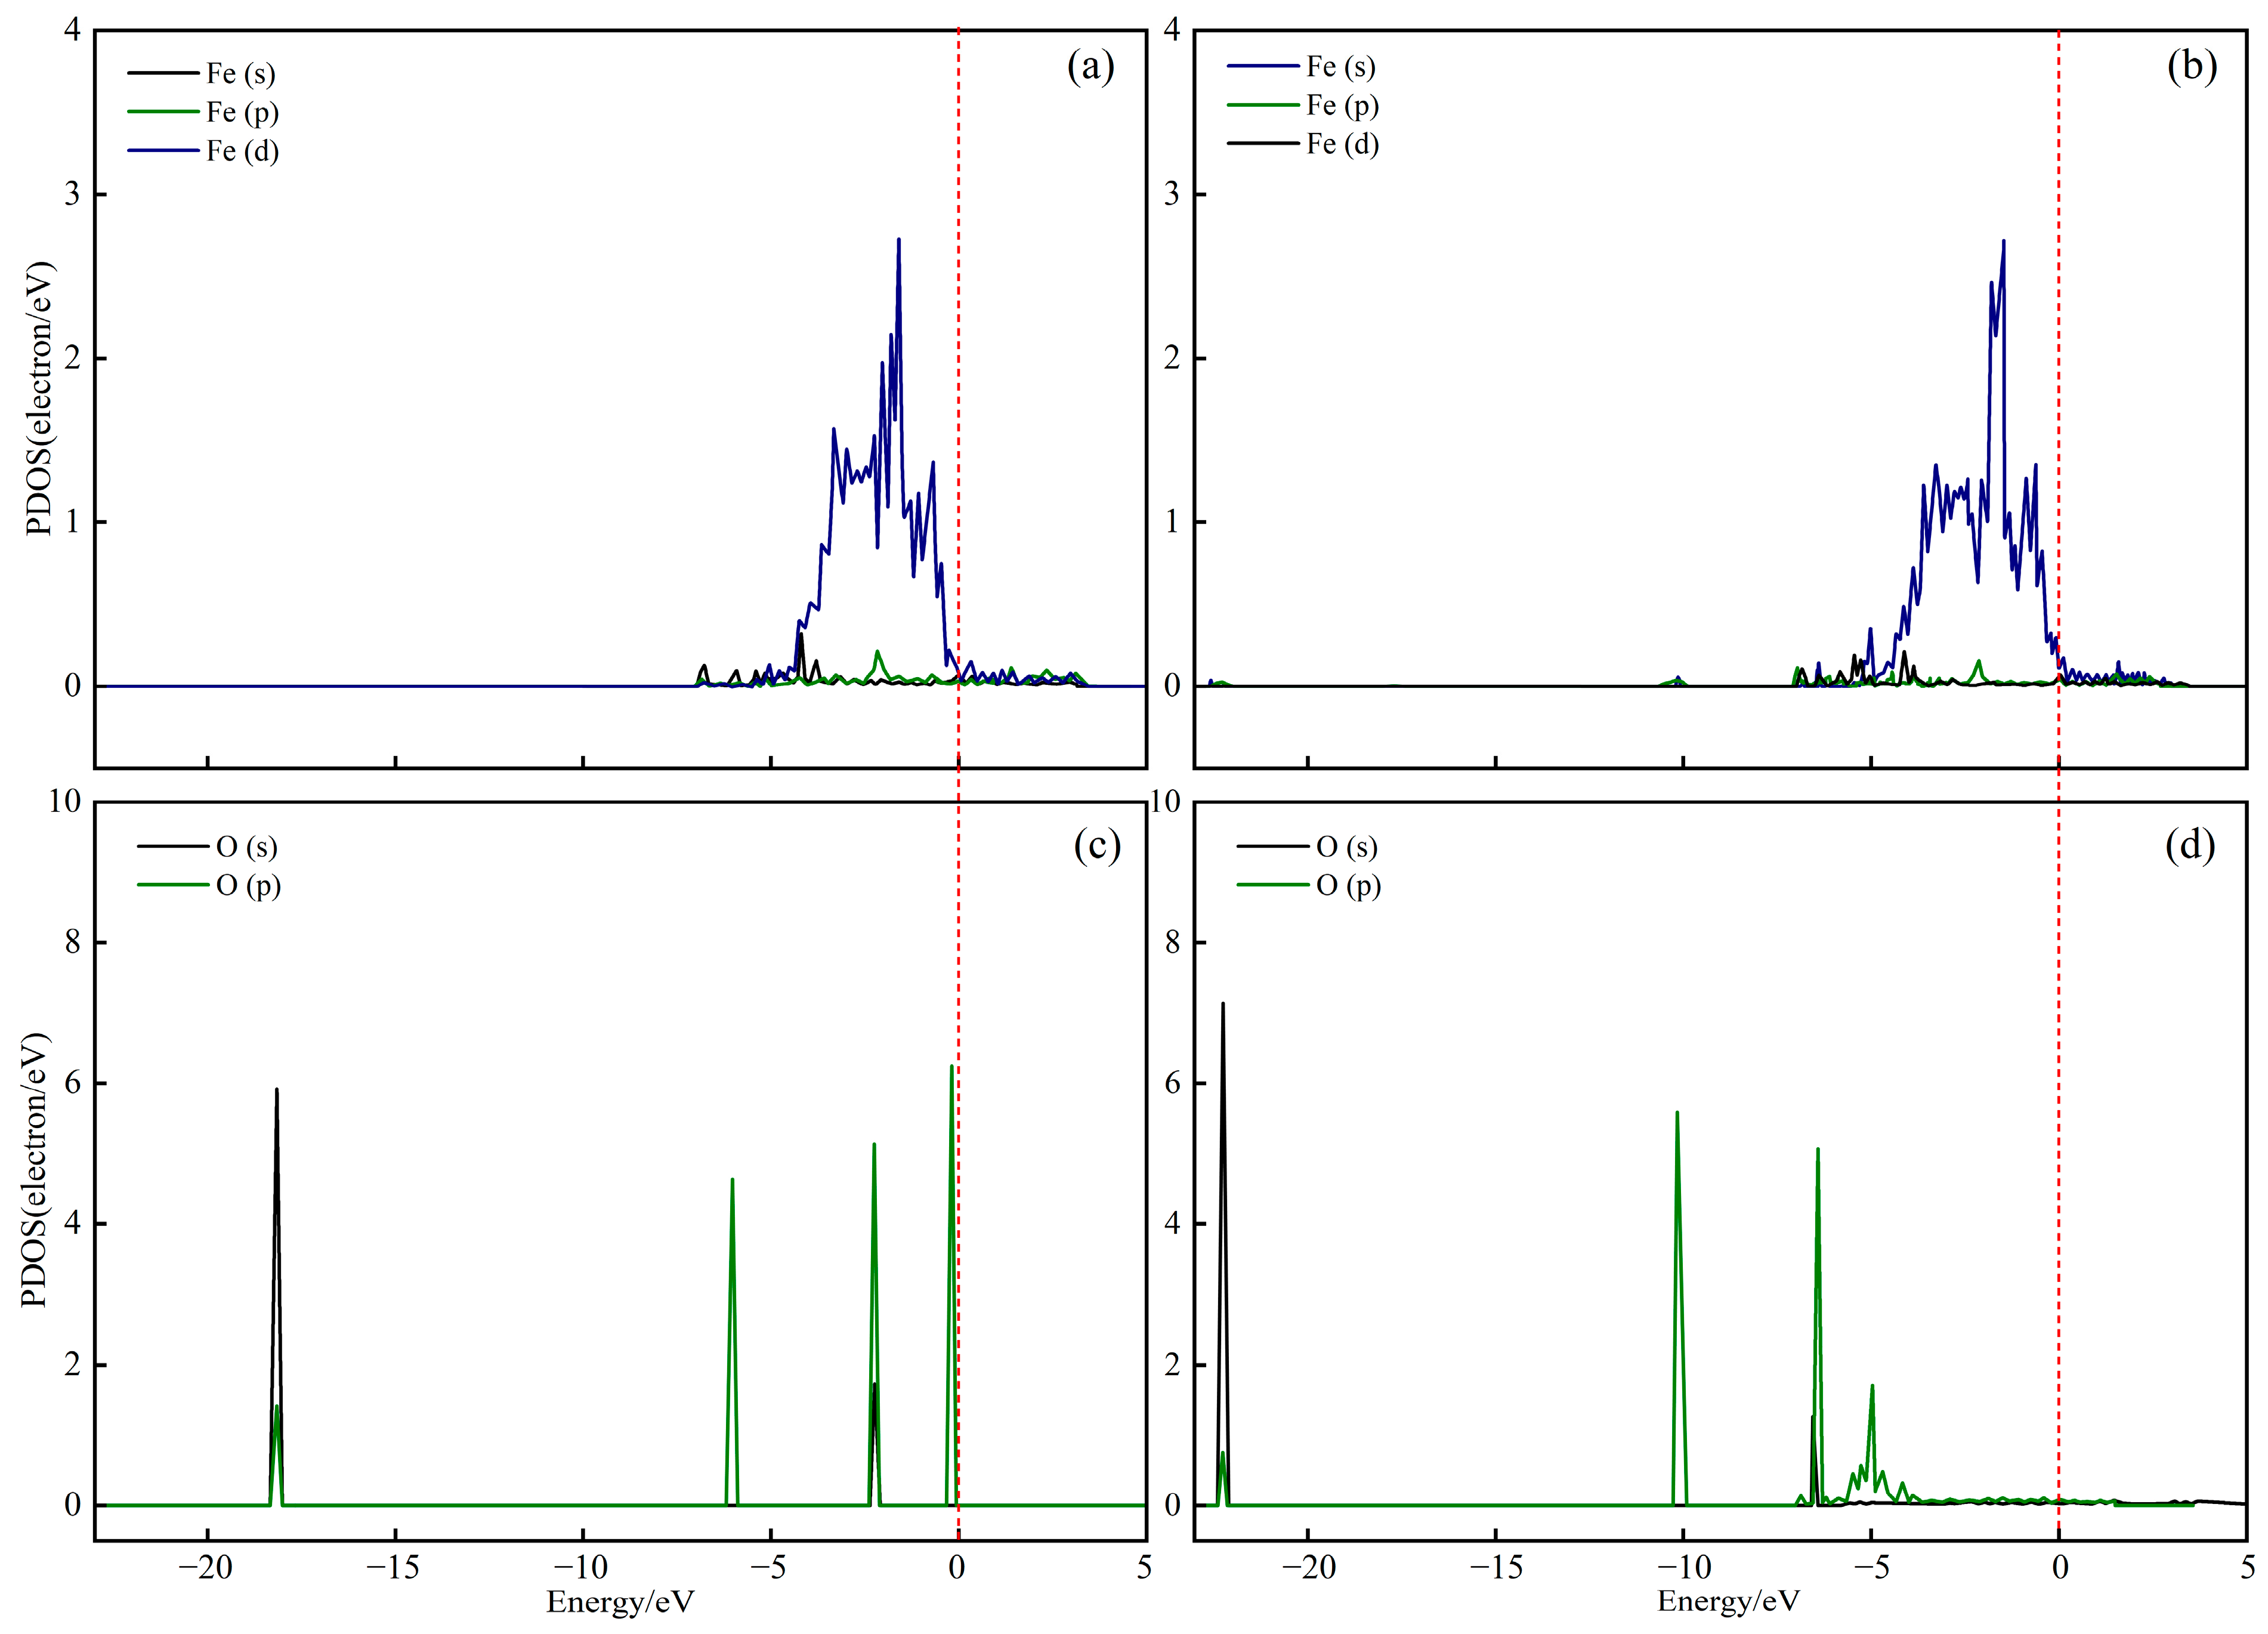
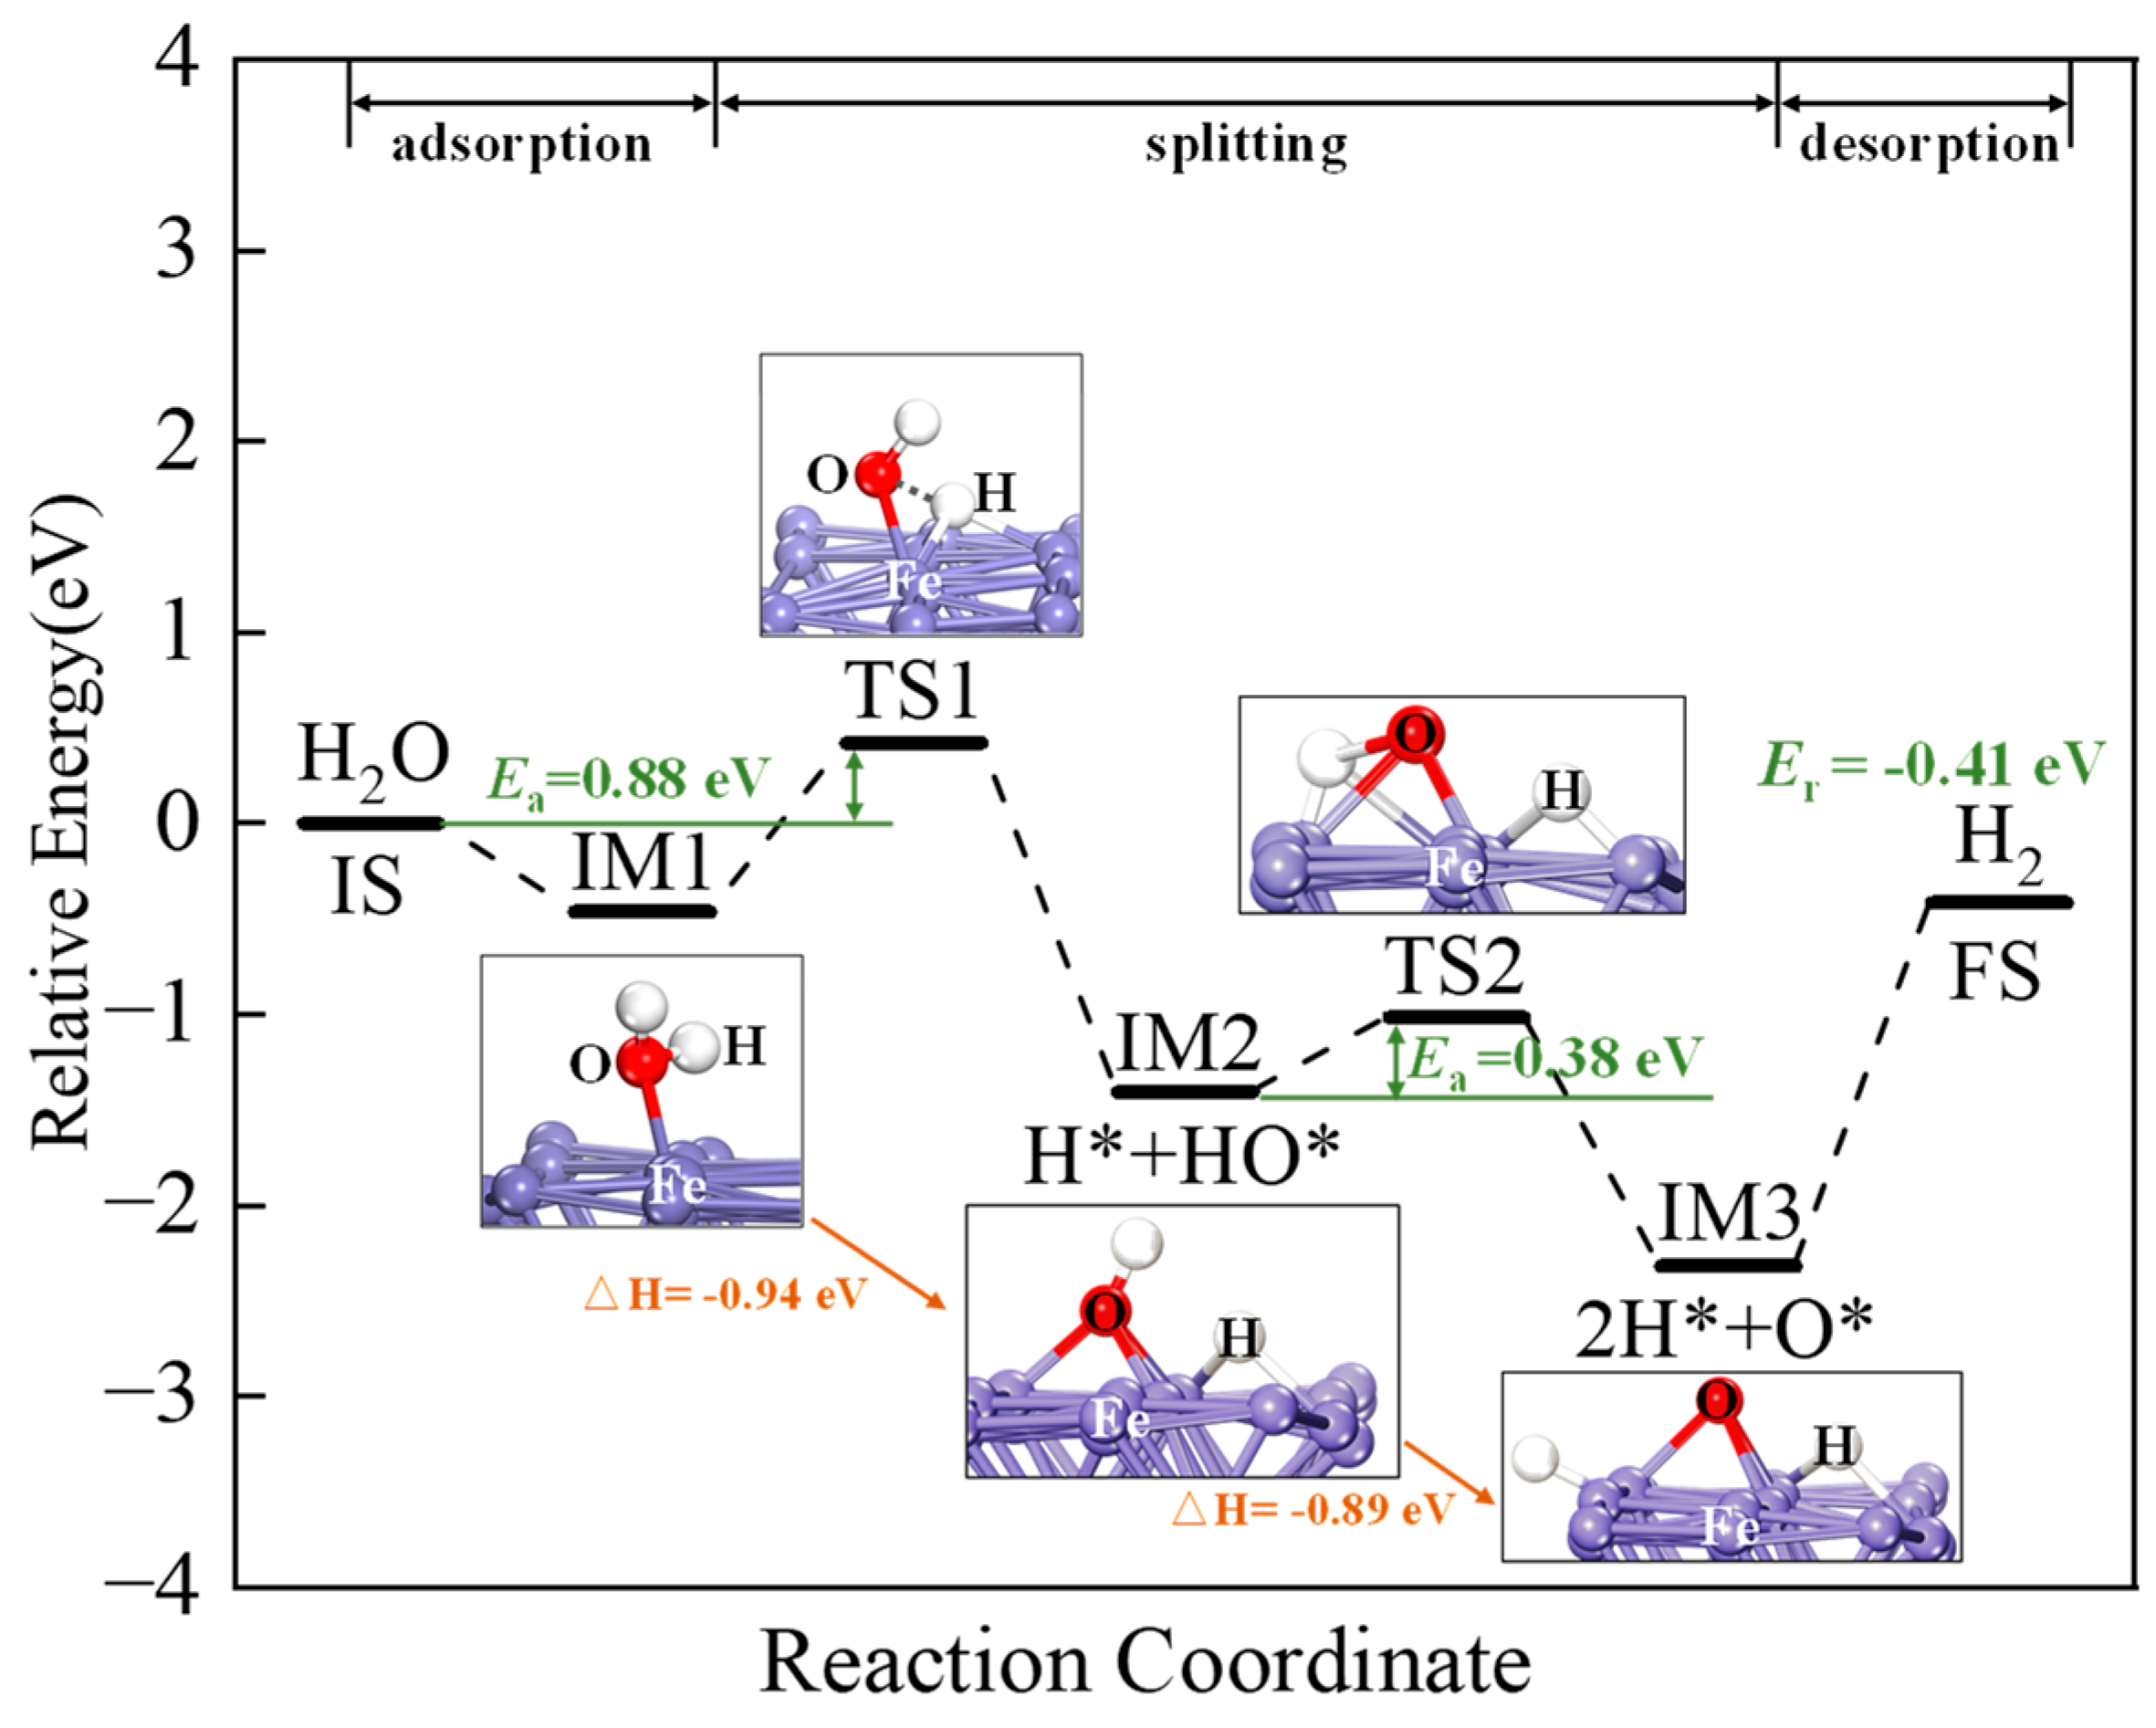
2.4. H2O Adsorption and Splitting

The adsorption configurations of H2O at the CaO(111)/Fe(110) composite interface are shown in Figure 10a–d. Configuration (a) represents H2O adsorbed at the Fe site, (b) at the Ca top site, (c) at the Ca hollow site and (d) at the Ca bridge site. The most negative adsorption energy corresponds to the most stable configuration.
When H2O adsorbs at the Fe site (Figure 10a), the adsorption energy is −0.47 eV (−71.40 kJ/mol). The most substantial adsorption occurs at the Ca bridge site (Figure 10d), with an energy of −0.79 eV (−76.22 kJ/mol). Configurations (b) and (c) exhibit adsorption energies of −0.38 eV (−36.66 kJ/mol) and −0.55 eV (−53.07 kJ/mol), respectively. Thermodynamic simulations (Figure 5) indicate that CaO and H2O cannot spontaneously form Ca(OH)2 above 550 °C. However, the reaction between Fe atoms on CaO(111)/Fe(110) and H2O has a △G < 0, indicating that the reaction can proceed spontaneously. Thus, this study focuses on Fe sites as the primary adsorption sites. Figure 10a shows the most stable H2O adsorption configuration, where the H-O1 and H-O2 bond lengths (0.9792 Å and 0.9805 Å) are 0.0065 Å and 0.0078 Å longer than that of gaseous H2O (0.9727 Å), indicating molecular activation. Previous studies reported Fe-site adsorption energies of −0.38 eV [42] and −0.39 eV [43], while the composite interface shows enhanced adsorption (−0.47 eV (−71.40 kJ/mol)), demonstrating its superiority for H2O adsorption.
The optimized structures and deformation charge density of the H2O adsorption configurations on the CaO(111)/Fe(110) surface were analyzed, as shown in Figure 11. Figure 11a represents the most stable configuration (a) from Figure 10, where H2O undergoes chemisorption atop an Fe atom, forming an Fe-O bond (2.2187 Å) with an adsorption energy of −0.47 eV (−71.40 kJ/mol). The deformation charge density in Figure 11a reveals no significant electron gain/loss in the adsorbed H2O molecule before and after adsorption. Specific Bader analysis results (Table 3) indicate electron transfer between H2O and Fe. During adsorption, H1, H2 and O act as electron acceptors, while Fe1 and Fe2 are electron donors. The adsorbed H2O carries a charge of −0.612 |e|. Configuration (b) in Figure 11 represents the formation of OH* through H atom migration after electron acquisition. The Bader analysis shows H1, H2, Fe1 and Fe2 as electron donors, with O as the acceptor. The total charges of Fe1 before and after adsorption are 0.019 |e| and 0.927 |e|, respectively, confirming Fe1 as an electron donor. This indicates that reduced-state Ca2Fe2O5 acts as the electron donor during the cleavage reaction, while H* serves as the acceptor. The reduced Ca2Fe2O5 is oxidized by H2O at high temperatures.
The PDOS of Fe atoms and H atoms in OH* on CaO(111)/Fe(110) before and after H2O molecule adsorption were calculated. By comparing the PDOS in Figure 12 before and after adsorption, electronic resonances between O and Fe atoms occurred at energies of −22.27 eV and −10.19 eV, indicating the formation of covalent bonds between Fe and O atoms. From the comparison of Figure 12c,d, the P orbitals of the O atoms shifted to lower energy levels, demonstrating that the adsorption of H2O on the Fe atoms of CaO(111)/Fe(110) becomes more stable through the formation of new molecular orbitals.
After H2O is adsorbed on the CaO(111)/Fe(110) surface, the H2O undergoes a dissociation reaction. From the above analysis, H2O can be chemically adsorbed stably on the composite surface as the initial state (IS) for the H2O reduction process. Figure 13 shows the reaction pathway and energy profile for H2O splitting on the composite surface and the oxidation of the reduced Ca2Fe2O5 state.
At the transition state TS1, there are two reaction pathways. The activation energies for Pathway 1 and Pathway 2 are 0.42 eV (40.52 kJ/mol) and 2.18 eV (210.34 kJ/mol), respectively. Pathway 1 is exothermic, with heat release of −0.94 eV (−90.70 kJ/mol), while Pathway 2 is endothermic, with heat absorption of 0.02 eV (1.93 kJ/mol). Therefore, Pathway 1 is the optimal reaction path. The initial dissociation of H2O forms HO* and H*.
At transition state TS2, there are a total of four reaction paths. The adsorbed HO* undergoes further dissociation to form H* and O*. When HO* is adsorbed on the surface, four different adsorption sites exist, resulting in four distinct reaction pathways: Paths 1, 3, 4, and 5. The heat release values are −0.91, −1.23, −1.10, and −0.65 eV (−87.80,−118.68,−106.13, and −62.72 kJ/mol), respectively, all being exothermic reactions. Therefore, all pathways are thermodynamically favorable. The activation energies are 0.38, 1.15, 0.90, and 0.58 eV (36.66, 110.96, 86.84, and 55.96 kJ/mol), respectively. Path 1 has the lowest activation energy, making it the most favorable pathway. The reaction is most likely to proceed through Path 1, which can thus be considered the optimal reaction pathway. The activation energies for transition states TS1 and TS2 are 0.42 eV (40.52 kJ/mol) and 0.38 eV (36.66 kJ/mol), respectively. Since TS1 has higher activation energy than TS2, TS1 determines the dissociation rate of H2O on the composite surface. H2O dissociates into two H* and one O* on the composite surface. The O* adsorbs on Fe sites, forming Fe-O bonds with surface Fe atoms. The two H* combine to form adsorbed H2, which desorbs from the surface to form gaseous H2. As shown in Figure 14, the overall reaction energy is −0.41 eV (−39.56 kJ/mol), indicating that the H2O reduction to form H2 is an exothermic reaction.

3. Materials and Methods

3.1. Material Preparation

The Chlorella vulgaris (biomass) was provided by Xi’an Shengqing Biotechnology Co., Ltd. (Xi’an, China). First, the biomass was dried at 105 °C for 24 h. It was then sieved into particles with a size of less than 100 μm and stored in a sealed desiccator. The ultimate and proximate analyses of the biomass are shown in Table 4.
The Ca2Fe2O5 oxygen carrier was prepared via the sol–gel method. Ca(NO3)2·4H2O (analytical reagent), Fe(NO3)3·9H2O (analytical reagent) and citric acid were dissolved in deionized water at a molar ratio of 1:1:2. The solution was stirred until a viscous substance formed. The obtained viscous material was dried at 105 °C for 24 h and then calcined in a muffle furnace at 900 °C for 4 h. Finally, the solid was ground and sieved to below 100 μm for characterization. SiO2 (analytical reagent) was used as a control in the experiments.

3.2. Material Characterization

The phase composition of the oxygen carrier was determined using an X-ray diffractometer (XRD). A Rigaku Ultima IV X-ray diffractometer (Tokyo, Japan) was employed, with the experimental conditions consisting of a Cu target, a scanning rate of 2°/min and a collection range of 10~90°.
To verify the temperature-programmed reduction (TPR) performance of the oxygen carrier, hydrogen temperature-programmed reduction (H2-TPR) experiments were conducted under a hydrogen reduction atmosphere using an Micromeritics Auto Chem II 2920 instrument (Norcross, GA, USA). Temperature-programmed analysis is a dynamic process that detects changes in surface chemical properties under different atmospheres at specific heating rates under inert gas protection. Typically, 50 mg of oxygen carrier was pretreated by heating to 150 °C under an inert atmosphere and maintained for 30 min. After pretreatment, the temperature was programmed to cool to 30 °C. Once the instrument baseline stabilized, the oxygen carrier was heated to 900 °C at 10 °C/min under a mixed atmosphere of H2 (10 vol.%)/N2 (50 mL/min flow rate).

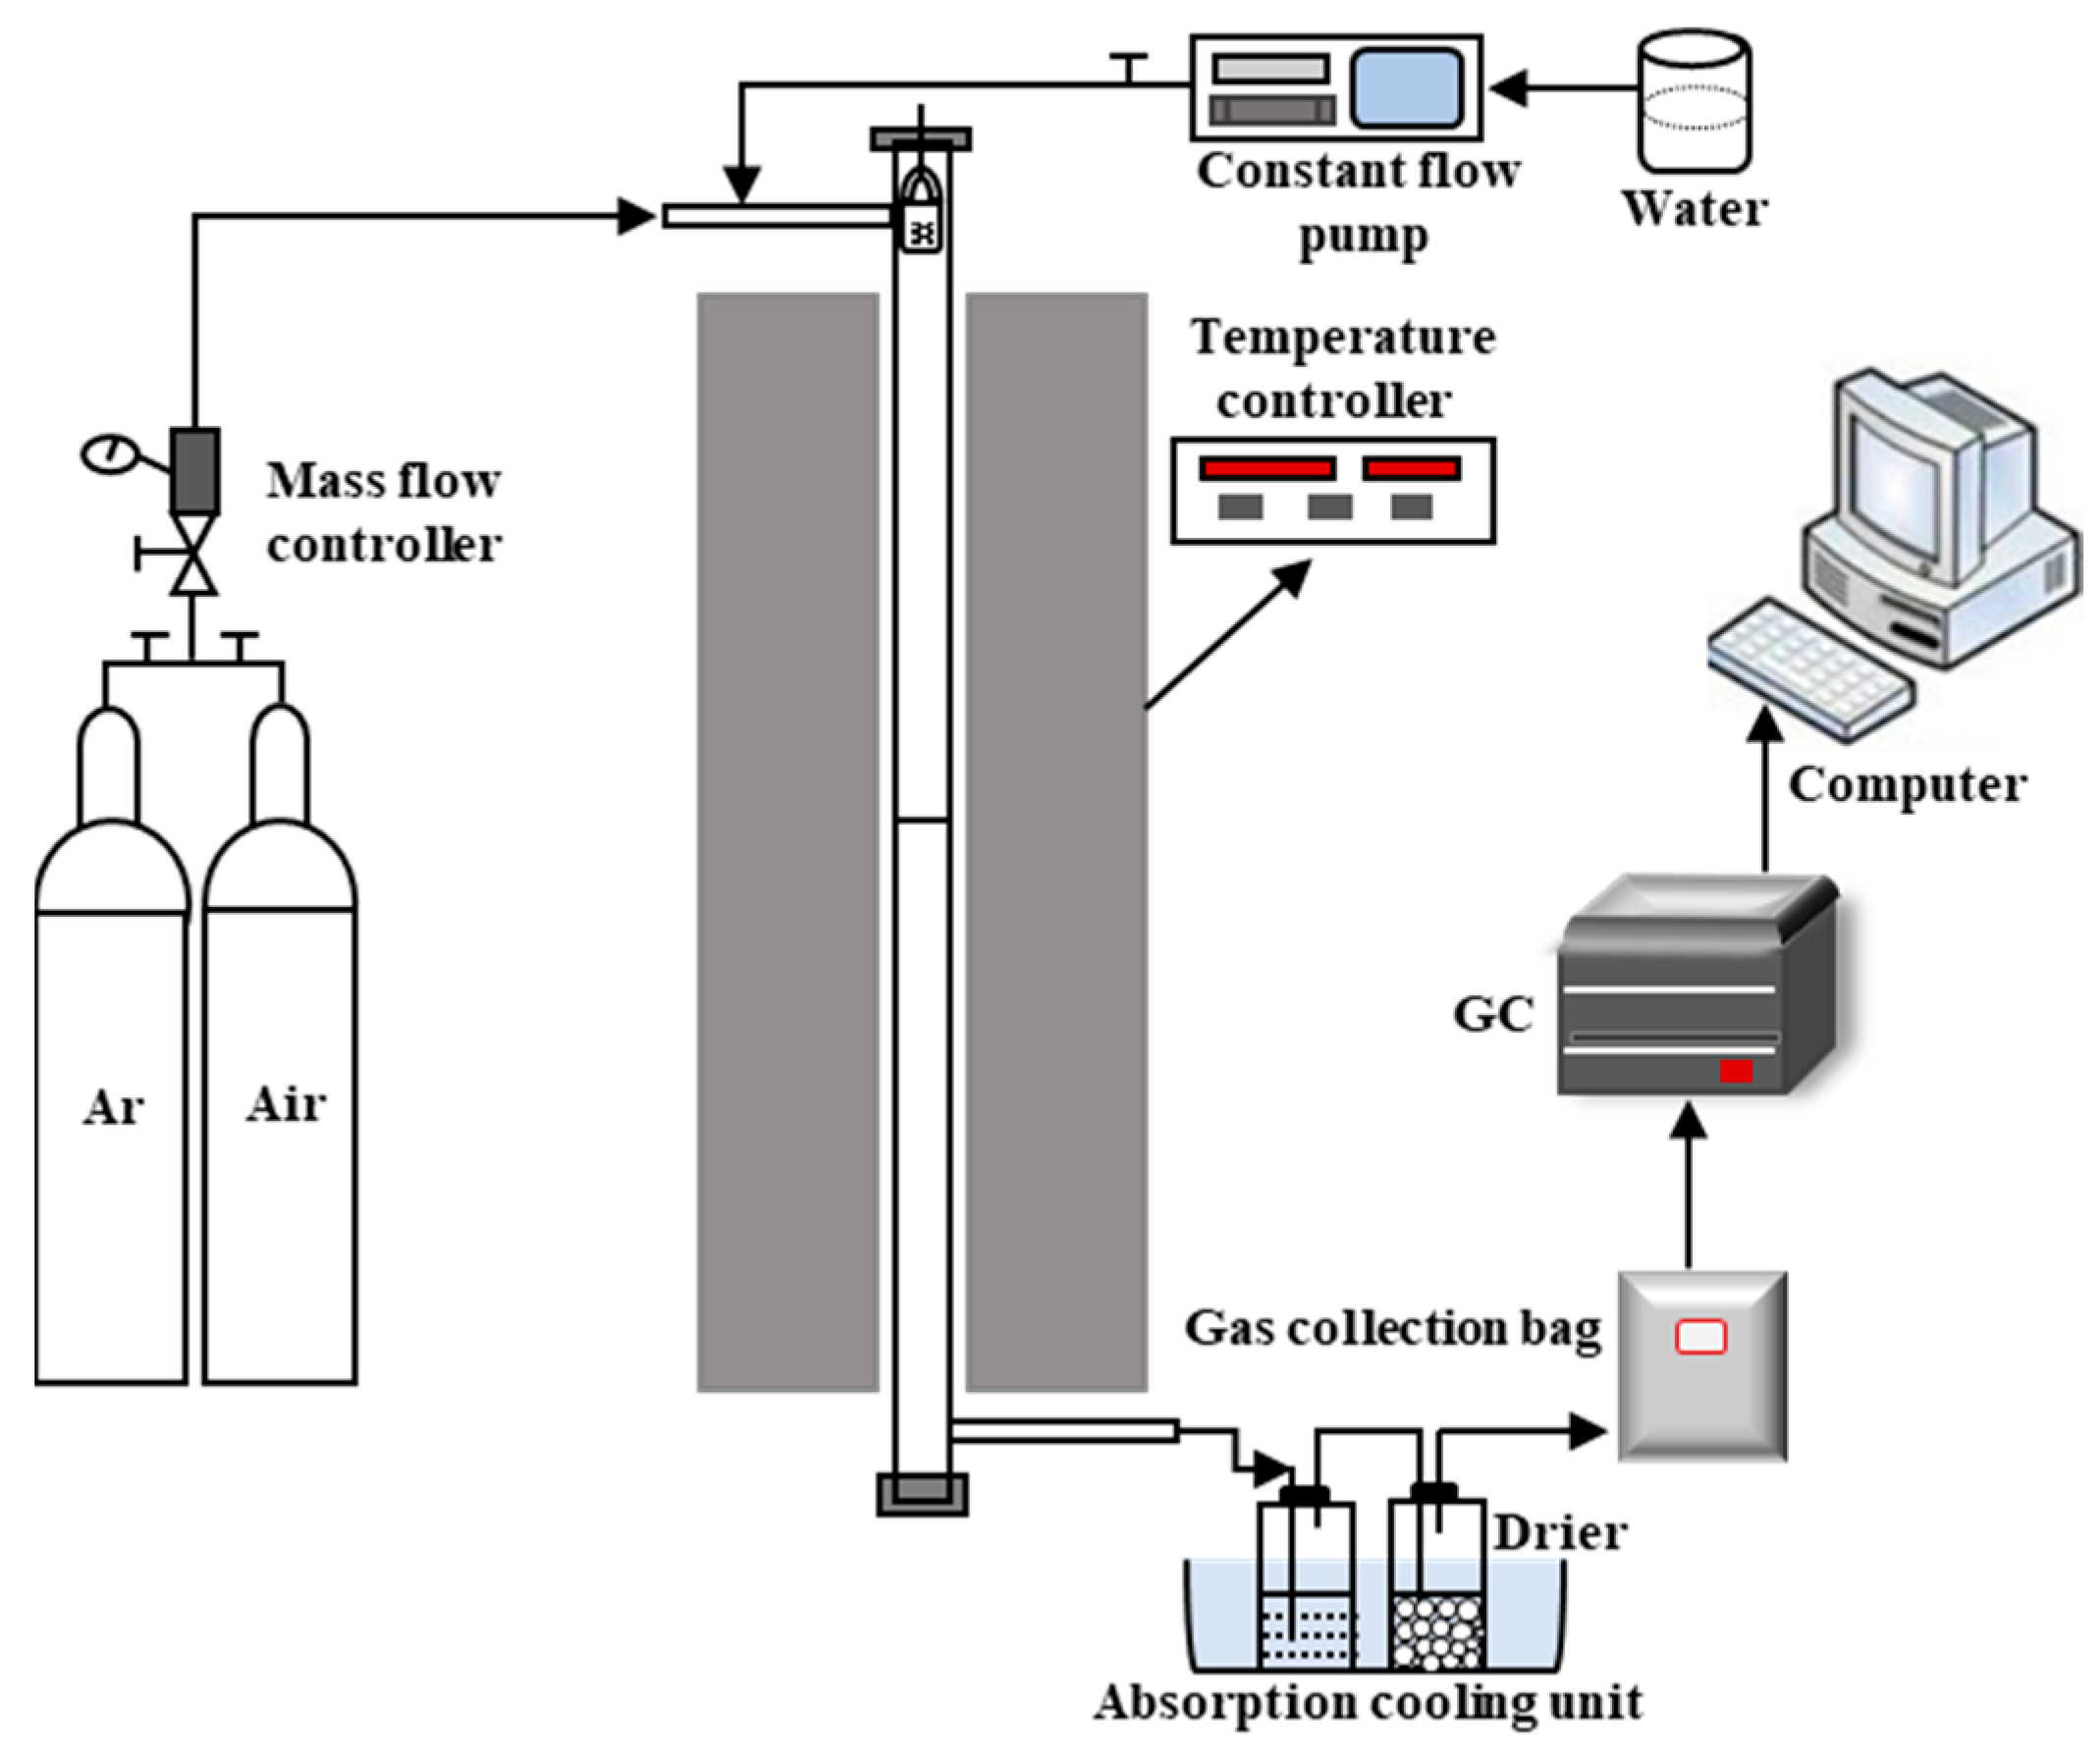
3.3. Chemical Looping Gasification Experiment

Figure 15 shows the fixed-bed setup for the gasification experiments. It mainly consisted of a gas supply system, reaction system, absorption–condensation–drying system, gas collection system and detection system. Argon was used as the carrier gas to maintain the required inert atmosphere during gasification. Steam was continuously fed into the reactor via a constant-flow pump.
Before each experiment, the biomass and oxygen carrier were uniformly mixed at a specific mass ratio and loaded into a basket suspended in the upper part of the tubular furnace. The system was then sealed. When the furnace reached 800 °C, the basket was pulled to drop into the constant-temperature zone for reaction. In the blank experiments, SiO2 replaced the oxygen carrier. Argon was purged into the furnace at 100 mL/min. Deionized water was pumped into the tubular furnace using the constant-flow pump, where it rapidly vaporized and was carried by the argon into the reaction zone. The reaction duration was set to 30 min. The generated gases were collected in gas bags and analyzed using gas chromatography.

3.4. Gasification Performance Evaluation Indicators

As the content of C2 and alkanes and olefins was relatively low, the main gases studied included the following. The definitions and calculation formulas for the chemical looping gasification evaluation indicators are shown below.
The gas yield Gv (Nm3/kg) is calculated via Equation (1):
G V = V g / m B
where Vg represents the volume of the produced gas under standard conditions (273.15 K, 101,325 Pa), Nm3; mB represents the mass of biomass used in the gasification process, kg.
The lower heating value of the gas (LHV) (kJ/Nm3) is calculated via Equation (2):
L H V = 126 V CO + 108 V H 2 + 359 V CH 4 + 635 V C 2 H m
V CO , V H 2 , V CH 4 and V C 2 H m represent the volume fractions (%) of CO, H2, CH4 and C2Hm.
The carbon conversion efficiency ηc (%) is calculated via Equation (3):
η c = 12 × V C O + V C O 2 + V C H 4 + 2 V C 2 H m × G v 22.4 × T 1 / T × C %
where T1 represents the temperature (K) during gas concentration measurement; T represents the standard temperature (K); C % represents the carbon content in the biomass.
The gasification efficiency η (%) is calculated via Equation (4):
η = L H V × G v Q B
where QB represents the lower heating value of the biomass, kJ/Nm3.
The selectivity of CO is given by Equation (5):
C O s e l e c t i v i t y = G C O G C O + G C O 2 × 100 %

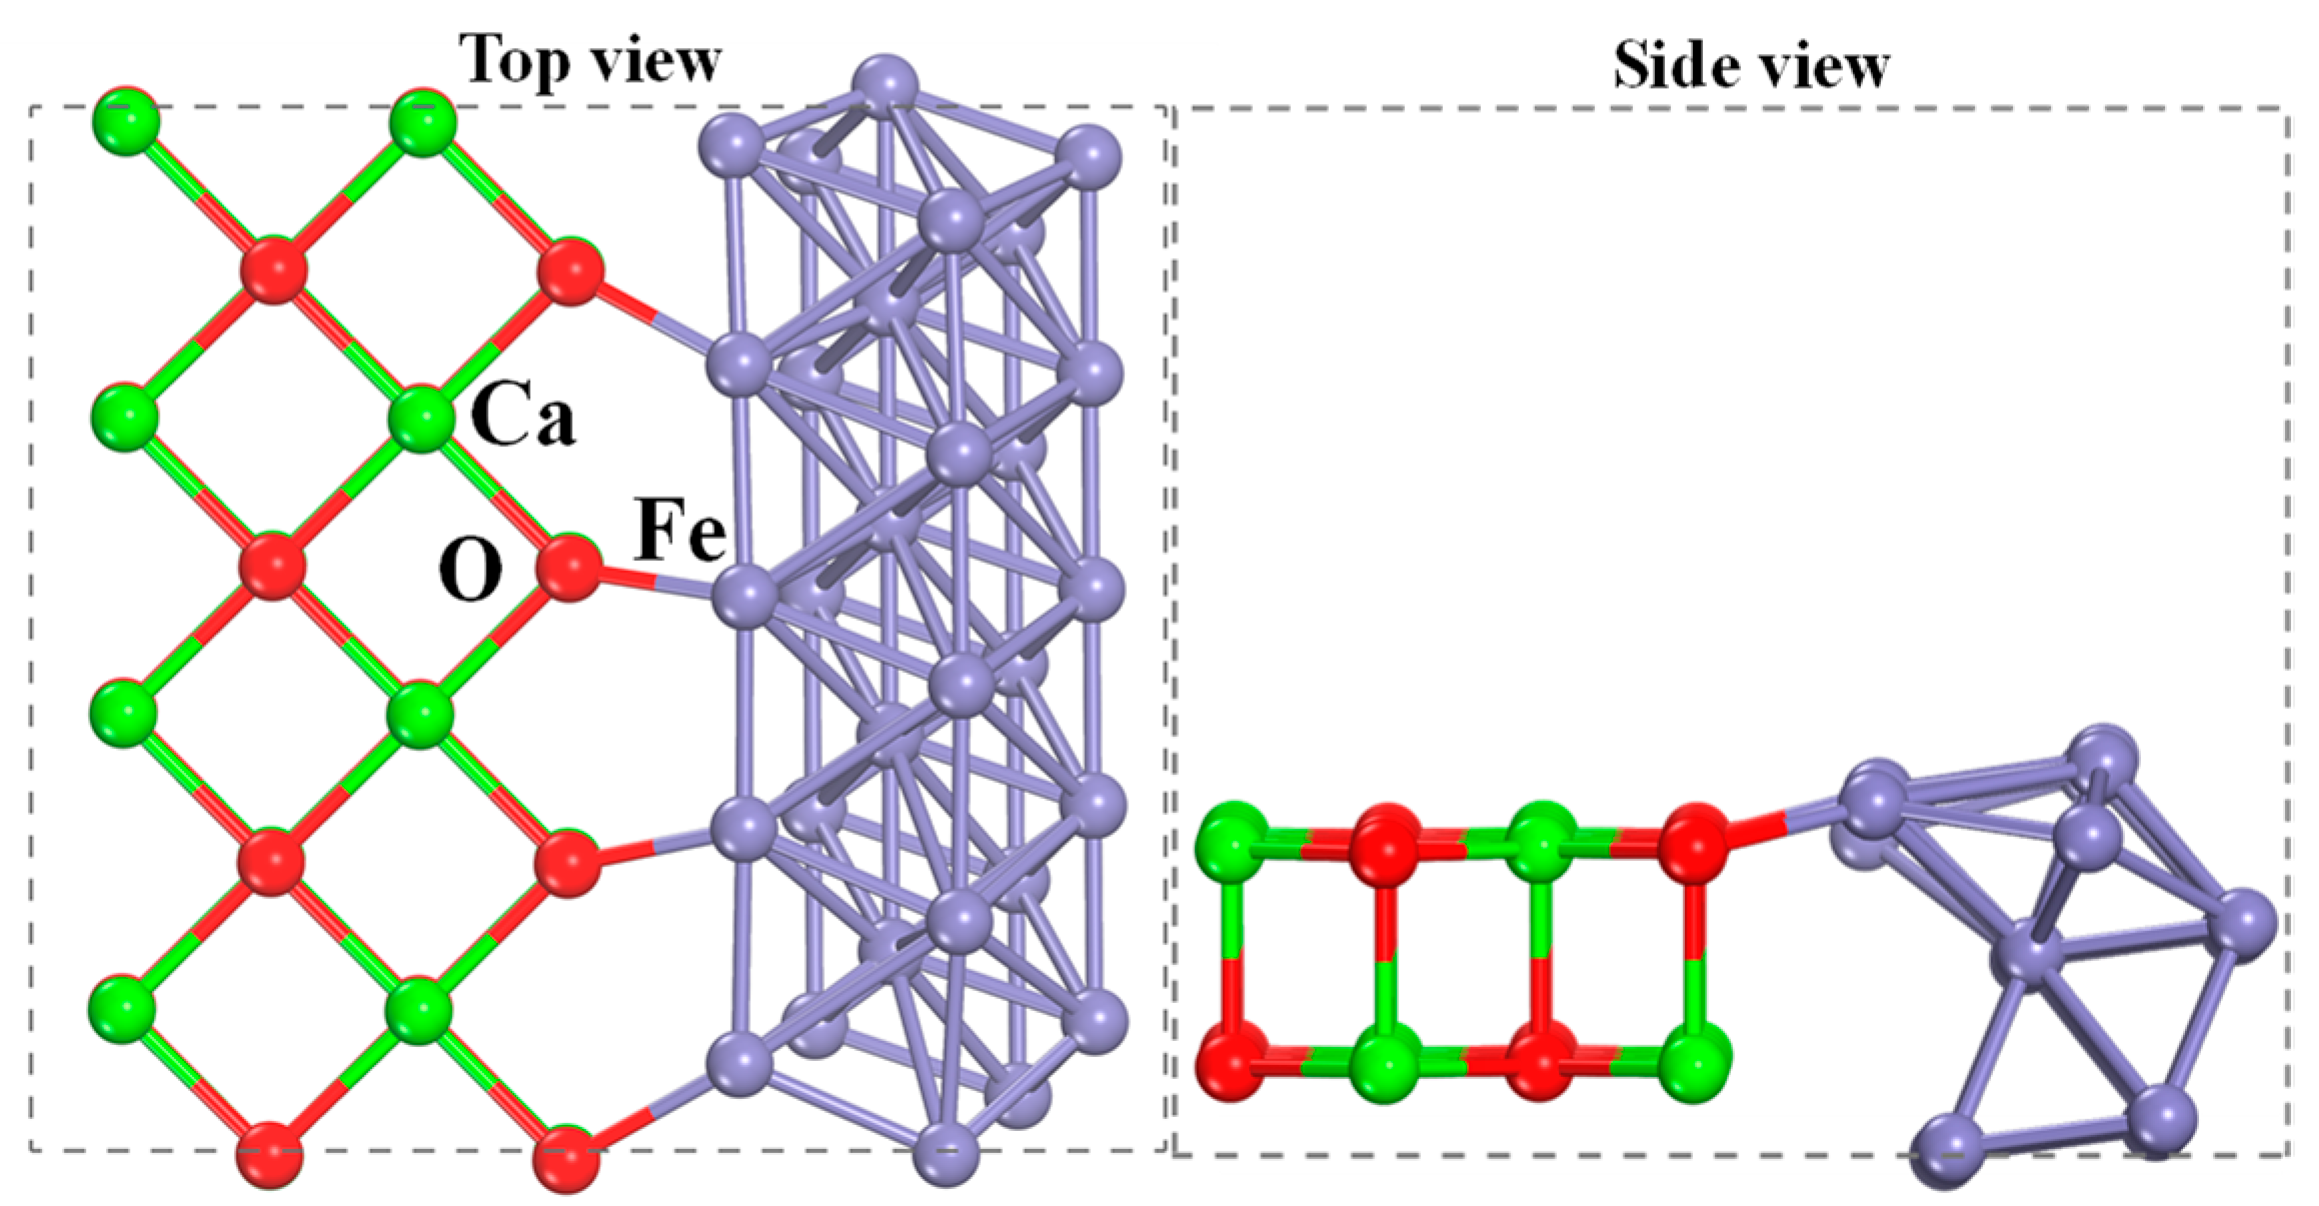
3.5. Computational Details

All calculations were implemented in CASTEP of Materials Studio 6.0. The exchange-correlation energy was treated using the Perdew–Burke–Ernzerhof generalized gradient approximation (GGA-PBE) and the projector augmented wave (PAW) method [36,37,38,39,40]. Dispersion corrections and spin polarization effects were considered. The plane-wave cutoff energy was set to 400 eV. The CaO(111)/Fe(110) surface was constructed to simulate the reduced Ca2Fe2O5 (as shown in Figure 16). The k-point sampling of the Brillouin zone was set to 1 × 1 × 1. A vacuum layer of 15 Å was introduced. Similarly, the molecular structures of CO2, CO, H2O and H2 were optimized.
The fully linear synchronous transit (LST)/quadratic synchronous transit (QST) [44] search protocol was employed to establish pathways between the reactants and products, locating transition states through interpolated reaction path synchronous transition methods. This approach performs LST calculations and iteratively applies conjugate gradient optimization followed by QST processing until the simulation steps terminate. Multiple path optimizations were executed until achieving transition state structures, avoiding unrealistic reaction paths caused by speculative intermediates.
Surface adsorption energy Eads:
Eads = EtotalEsurfaceEspecies
Etotal represents the total energy of the adsorbed surface species; Esurface denotes the energy of the clean surface without adsorption; Especies is the energy of the substance in the gas phase.
Activation energy Ea and reaction energy Er:
Ea = ETSEIS
Er = EFSEIS
ETS is the energy of the transition state; EIS is the energy of the initial state; and EFS is the energy of the final state.
This study did not incorporate zero-point energy (ZPE) corrections, following the general approach commonly used in the dependency analysis of similar periodic systems. The calculated adsorption energy values are consistent with those reported in reference [38].

4. Conclusions

This study reveals the multiscale mechanism of Ca2Fe2O5 oxygen carriers in biomass direct/steam chemical looping gasification. The results demonstrate that introducing an oxygen carrier significantly enhances the gasification performance, with the CO yield doubling (increasing from 0.13 Nm3/kg to 0.26 Nm3/kg). The H2 yield increases from 0.19 Nm3/kg to 0.72 Nm3/kg. This indicates that reduced Ca2Fe2O5 can regenerate to its initial state through oxidation by CO2/H2O at high temperatures, accompanied by efficient CO/H2 release. Combined with DFT calculations, the reaction mechanisms of CO2/H2O at the active interface of the reduced oxygen carrier are systematically elucidated. CO2/H2O are stabilized via chemisorption at the CaO(111)/Fe(110) composite interface. Adsorbed CO2 (total charge −0.952 |e|) and H2O (total charge −0.612 |e|) act as electron acceptors, while surface Fe atoms (charges 0.433 |e|, 0.927 |e|) serve as electron donors, driving efficient reactant activation. CO2 undergoes single-step splitting (CO2→CO* + O*) to form adsorbed CO, with its desorption energy barrier (Ea = 1.09 eV, 105.17 kJ/mol) determining the reaction rate. H2O splits in two steps (H2O→HO* + H*→2H* + O*), with the first step dictating the reaction rate (Ea = 0.42 eV, 40.52 kJ/mol). Overall, CO2/H2O enable oxidative regeneration through surface reactions on reduced Ca2Fe2O5 while supplying heat to the system. This work establishes a theoretical framework for the precision design of high-performance oxygen carriers and opens up new pathways for the selective regulation of biomass gasification products.

Author Contributions

Conceptualization, methodology and writing—original draft preparation, Y.W.; investigation, S.Z.; writing—review and editing, J.L.; visualization and supervision, M.H. All authors have read and agreed to the published version of the manuscript.

Funding

This research received no external funding.

Institutional Review Board Statement

Not applicable.

Informed Consent Statement

Not applicable.

Data Availability Statement

The original contributions presented in this study are included in the article. Further inquiries can be directed to the corresponding author.

Conflicts of Interest

The authors declare no conflicts of interest.

References

  1. Adeniyi, O.M.; Azimov, U.; Burluka, A. Algae biofuel: Current status and future applications. Renew. Sustain. Energy Rev. 2018, 90, 316–335. [Google Scholar] [CrossRef]
  2. Meng, S.; Li, W.; Li, Z.; Song, H. Recent progress of the transition metal-based catalysts in the catalytic biomass gasification: A mini-review. Fuel 2023, 353, 129169. [Google Scholar] [CrossRef]
  3. Sathya, A.B.; Thirunavukkarasu, A.; Nithya, R.; Nandan, A.; Sakthishobana, K.; Kola, A.K.; Sivashankar, R.; Tuan, H.A.; Deepanraj, B. Microalgal biofuel production: Potential challenges and prospective research. Fuel 2023, 332, 126199. [Google Scholar] [CrossRef]
  4. Martins, F.; Felgueiras, C.; Smitkova, M.; Caetano, N. Analysis of Fossil Fuel Energy Consumption and Environmental Impacts in European Countries. Energies 2019, 12, 964. [Google Scholar] [CrossRef]
  5. Ubando, A.T.; Rivera, D.R.T.; Chen, W.-H.; Culaba, A.B. A comprehensive review of life cycle assessment (LCA) of microalgal and lignocellulosic bioenergy products from thermochemical processes. Bioresour. Technol. 2019, 291, 121837. [Google Scholar] [CrossRef]
  6. Gholkar, P.; Shastri, Y.; Tanksale, A. Renewable hydrogen and methane production from microalgae: A techno-economic and life cycle assessment study. J. Clean. Prod. 2021, 279, 123726. [Google Scholar] [CrossRef]
  7. Lin, Y.; Wang, H.; Wang, Y.; Huo, R.; Huang, Z.; Liu, M.; Wei, G.; Zhao, Z.; Li, H.; Fang, Y. Review of Biomass Chemical Looping Gasification in China. Energy Fuels 2020, 34, 7847–7862. [Google Scholar] [CrossRef]
  8. Dieringer, P.; Marx, F.; Alobaid, F.; Stroehle, J.; Epple, B. Process Control Strategies in Chemical Looping Gasification-A Novel Process for the Production of Biofuels Allowing for Net Negative CO2 Emissions. Appl. Sci. 2020, 10, 4271. [Google Scholar] [CrossRef]
  9. Zhu, X.; Imtiaz, Q.; Donat, F.; Mueller, C.R.; Li, F. Chemical looping beyond combustion—A perspective. Energy Environ. Sci. 2020, 13, 772–804. [Google Scholar] [CrossRef]
  10. Goel, A.; Moghaddam, E.M.; Liu, W.; He, C.; Konttinen, J. Biomass chemical looping gasification for high-quality syngas: A critical review and technological outlooks. Energy Convers. Manag. 2022, 268, 116020. [Google Scholar] [CrossRef]
  11. Jiang, H.; Huo, R.; Zhang, Z.; Lin, Y.; Zhao, Z.; Huang, Z.; Fang, Y.; Li, H. Removal of pollution from the chemical looping process: A mini review. Fuel Process. Technol. 2021, 221, 106937. [Google Scholar] [CrossRef]
  12. Zeng, L.; Cheng, Z.; Fan, J.A.; Fan, L.-S.; Gong, J. Metal oxide redox chemistry for chemical looping processes. Nat. Rev. Chem. 2018, 2, 349–364. [Google Scholar] [CrossRef]
  13. Yu, L.; Zhou, W.; Luo, Z.; Wang, H.; Liu, W.; Yin, K. Developing Oxygen Carriers for Chemical Looping Biomass Processing: Challenges and Opportunities. Adv. Sustain. Syst. 2020, 4, 2000099. [Google Scholar] [CrossRef]
  14. Zeng, J.; Hu, J.; Qiu, Y.; Zhang, S.; Zeng, D.; Xiao, R. Multi-function of oxygen carrier for in-situ tar removal in chemical looping gasification: Naphthalene as a model compound. Appl. Energy 2019, 253, 113502. [Google Scholar] [CrossRef]
  15. De Vos, Y.; Jacobs, M.; Van der Voort, P.; Van Driessche, I.; Snijkers, F.; Verberckmoes, A. Development of Stable Oxygen Carrier Materials for Chemical Looping Processes-A Review. Catalysts 2020, 10, 926. [Google Scholar] [CrossRef]
  16. Huang, Z.; Zheng, A.; Deng, Z.; Wei, G.; Zhao, K.; Chen, D.; He, F.; Zhao, Z.; Li, H.; Li, F. Insitu removal of toluene as a biomass tar model compound using NiFe2O4 for application in chemical looping gasification oxygen carrier. Energy 2020, 190, 116360. [Google Scholar] [CrossRef]
  17. O'Malley, K.; Donat, F.; Whitty, K.J.; Sohn, H.Y. Scalable Preparation of Bimetallic Cu/Ni-Based Oxygen Carriers for Chemical Looping. Energy Fuels 2020, 34, 11227–11236. [Google Scholar] [CrossRef]
  18. Miller, D.D.; Smith, M.; Shekhawat, D. Interaction of manganese with aluminosilicate support during high temperature (1100 °C) chemical looping combustion of the Fe-Mn-based oxygen carrier. Fuel 2020, 263, 116738. [Google Scholar] [CrossRef]
  19. Cai, Y.; Wang, C.; Zhang, Z.; Zhong, M.; Wu, Q.; Xiao, B.; Xu, T.; Wang, X. Performance optimization of Ca2Fe2O5 oxygen carrier by doping different metals for coproduction syngas and hydrogen with chemical looping gasification and water splitting. J. Energy Inst. 2023, 111, 101391. [Google Scholar] [CrossRef]
  20. Sun, H.; Wang, Z.; Fang, Y.; Liu, Z.; Dong, L.; Zhou, X.; Yu, Z.; Li, X.; Bai, J.; Huang, J. A novel system of biomass for the generation of inherently separated syngas by combining chemical looping CO2-gasification and steam reforming process. Energy Convers. Manag. 2022, 251, 114876. [Google Scholar] [CrossRef]
  21. Wei, G.-q.; Feng, J.; Hou, Y.-L.; Li, F.-Z.; Li, W.-Y.; Huang, Z.; Zheng, A.-q.; Li, H.-b. Ca-enhanced hematite oxygen carriers for chemical looping reforming of biomass pyrolyzed gas coupled with CO2 splitting. Fuel 2021, 285, 119125. [Google Scholar] [CrossRef]
  22. Hu, Q.; Mao, Q.; Ren, X.; Yang, H.; Chen, H. Inert chemical looping conversion of biochar with iron ore as oxygen carrier: Products conversion kinetics and structural evolution. Bioresour. Technol. 2019, 275, 53–60. [Google Scholar] [CrossRef] [PubMed]
  23. Wei, G.; Wang, H.; Zhao, W.; Huang, Z.; Yi, Q.; He, F.; Zhao, K.; Zheng, A.; Meng, J.; Deng, Z.; et al. Synthesis gas production from chemical looping gasification of lignite by using hematite as oxygen carrier. Energy Convers. Manag. 2019, 185, 774–782. [Google Scholar] [CrossRef]
  24. Wang, X.; Gong, Y.; Wang, X.; Jin, B. Experimental and kinetics investigations of separated-gasification chemical looping combustion of char with an iron ore as the oxygen carrier. Fuel Process. Technol. 2020, 210, 106554. [Google Scholar] [CrossRef]
  25. Xu, F.; Xing, X.; Gao, S.; Zhang, W.; Zhu, L.; Wang, Y.; Chen, J.; Chen, H.; Zhu, Y. Direct chemical looping gasification of pine sawdust using Fe2O3-rich sludge ash as an oxygen carrier: Thermal conversion characteristics, product distributions, and gasification performances. Fuel 2021, 304, 121499. [Google Scholar] [CrossRef]
  26. Huang, X.; Wu, J.; Wang, M.; Ma, X.; Jiang, E.; Hu, Z. Syngas production by chemical looping gasification of rice husk using Fe-based oxygen carrier. J. Energy Inst. 2020, 93, 1261–1270. [Google Scholar] [CrossRef]
  27. Feng, Y.; Wang, N.; Guo, X.; Zhang, S. Dopant screening of modified Fe2O3 oxygen carriers in chemical looping hydrogen production. Fuel 2020, 262, 116489. [Google Scholar] [CrossRef]
  28. Zeng, D.; Qiu, Y.; Zhang, S.; Ma, L.; Li, M.; Cui, D.; Zeng, J.; Xiao, R. Synergistic effects of binary oxygen carriers during chemical looping hydrogen production. Int. J. Hydrogen Energy 2019, 44, 21290–21302. [Google Scholar] [CrossRef]
  29. Wu, J.; Hu, Z.; Miao, Z.; Wu, W.; Jiang, E. Effect of alkaline earth metal Ca in rice husk during chemical looping gasification process. Fuel 2021, 299, 120902. [Google Scholar] [CrossRef]
  30. Yan, X.; Li, Y.; Zhang, C.; Wang, Y.; Zhao, J.; Wang, Z. Understanding the enhancement of CaO on water gas shift reaction for H2 production by density functional theory. Fuel 2021, 303, 121257. [Google Scholar] [CrossRef]
  31. Si, T.; Huang, K.; Lin, Y.; Gu, M. ReaxFF Study on the Effect of CaO on Cellulose Pyrolysis. Energy Fuels 2019, 33, 11067–11077. [Google Scholar] [CrossRef]
  32. Chen, X.; Li, S.; Liu, Z.; Chen, Y.; Yang, H.; Wang, X.; Che, Q.; Chen, W.; Chen, H. Pyrolysis characteristics of lignocellulosic biomass components in the presence of CaO. Bioresour. Technol. 2019, 287, 121493. [Google Scholar] [CrossRef]
  33. Chan, M.S.C.; Liu, W.; Ismail, M.; Yang, Y.; Scott, S.A.; Dennis, J.S. Improving hydrogen yields, and hydrogen: Steam ratio in the chemical looping production of hydrogen using Ca2Fe2O5. Chem. Eng. J. 2016, 296, 406–411. [Google Scholar] [CrossRef]
  34. Wang, Y.; Niu, P.; Zhao, H. Chemical looping gasification of coal using calcium ferrites as oxygen carrier. Fuel Process. Technol. 2019, 192, 75–86. [Google Scholar] [CrossRef]
  35. Sun, Z.; Wu, X.; Russell, C.K.; Dyar, M.D.; Sklute, E.C.; Toan, S.; Fan, M.; Duan, L.; Xiang, W. Synergistic enhancement of chemical looping-based CO2 splitting with biomass cascade utilization using cyclic stabilized Ca2Fe2O5 aerogel. J. Mater. Chem. A 2019, 7, 1216–1226. [Google Scholar] [CrossRef]
  36. Feng, Y.; Wang, N.; Guo, X.; Zhang, S. Reaction mechanism of Ca2Fe2O5 oxygen carrier with CO in chemical looping hydrogen production. Appl. Surf. Sci. 2020, 534, 147583. [Google Scholar] [CrossRef]
  37. Feng, Y.; Wang, N.; Guo, X. Reaction mechanism of methane conversion over Ca2Fe2O5 oxygen carrier in chemical looping hydrogen production. Fuel 2021, 290, 120094. [Google Scholar] [CrossRef]
  38. Sun, Z.; Liu, H.; Bai, H.; Yu, S.; Russell, C.K.; Zeng, L.; Sun, Z. The crucial role of deoxygenation in syngas refinement and carbon dioxide utilization during chemical looping-based biomass gasification. Chem. Eng. J. 2022, 428, 132068. [Google Scholar] [CrossRef]
  39. Shah, V.; Cheng, Z.; Baser, D.S.; Fan, J.A.; Fan, L.-S. Highly Selective Production of Syngas from Chemical Looping Reforming of Methane with CO2 Utilization on MgO-supported Calcium Ferrite Redox Materials. Appl. Energy 2021, 282, 116111. [Google Scholar] [CrossRef]
  40. Shah, V.; Cheng, Z.; Mohapatra, P.; Fan, L.-S. Enhanced methane conversion using Ni-doped calcium ferrite oxygen carriers in chemical looping partial oxidation systems with CO2 utilization. React. Chem. Eng. 2021, 6, 1928–1939. [Google Scholar] [CrossRef]
  41. Rassouli, L.; Dupuis, M. Electronic Structure of Excitons in Hematite Fe2O3. J. Phys. Chem. C 2024, 128, 743–758. [Google Scholar] [CrossRef]
  42. Liu, S.; Tian, X.; Wang, T.; Wen, X.; Li, Y.-W.; Wang, J.; Jiao, H. Coverage dependent water dissociative adsorption on Fe(110) from DFT computation. Phys. Chem. Chem. Phys. 2015, 17, 8811–8821. [Google Scholar] [CrossRef] [PubMed]
  43. Jung, S.C.; Kang, M.H. Adsorption of a water molecule on Fe(100): Density-functional calculations. Phys. Rev. B 2010, 81, 115460. [Google Scholar] [CrossRef]
  44. Govind, N.; Petersen, M.; Fitzgerald, G.; King-Smith, D.; Andzelm, J. A generalized synchronous transit method for transition state location. Comput. Mater. Sci. 2003, 28, 250–258. [Google Scholar] [CrossRef]
Figure 1. Schematic of chemical looping gasification–water splitting and chemical looping gasification–CO2 splitting.
Molecules 30 01471 g001
Figure 2. Gas production results in different conditions.
Molecules 30 01471 g002
Figure 3. (a) XRD patterns of fresh Ca2Fe2O5; (b) XRD patterns of H2-reduced Ca2Fe2O5; (c) H2-TPR profiles of Ca2Fe2O5.
Molecules 30 01471 g003aMolecules 30 01471 g003b
Figure 4. Adsorption configurations of CO2 on the CaO(111)/Fe(110) surface: (ac) Fe-Fe bridge; (d) O-top; (e) Ca-top; (f) Ca-Ca bridge; (g,h) O-top.
Molecules 30 01471 g004
Figure 5. △G of different reactions.
Molecules 30 01471 g005
Figure 6. Optimized structures and deformation charge density of CO2 adsorption over CaO(111)/Fe(110) surface: (a) configuration a; (b) configuration b.
Molecules 30 01471 g006
Figure 7. PDOS of CO2 adsorption on CaO(111)/Fe(110) surface: (a,c,e,g) before adsorption; (b,d,f,h) after adsorption.
Molecules 30 01471 g007
Figure 8. The energy profile of intermediates, transition states and final states of CO2 splitting on the CaO(111)/Fe(110) surface.
Molecules 30 01471 g008
Figure 9. The energy profile of the optimal pathway’s intermediates, transition states and final states of CO2 splitting on CaO(111)/Fe(110) surface.
Molecules 30 01471 g009
Figure 10. Adsorption configurations of H2O on the CaO(111)/Fe(110) surface: (a) Fe-top; (b) Ca-top; (c) Ca-O hole; (d) Ca-O bridge.
Molecules 30 01471 g010
Figure 11. Optimized structures and deformation charge density of H2O adsorption over CaO(111)/Fe(110) surface: (a) configuration a; (b) configuration b.
Molecules 30 01471 g011
Figure 12. PDOS of H2O adsorption on CaO(111)/Fe(110)surface: (a,c) before adsorption; (b,d) after adsorption.
Molecules 30 01471 g012
Figure 13. The energy profile of intermediates, transition states and final states of H2O splitting on the CaO(111)/Fe (110) surface.
Molecules 30 01471 g013
Figure 14. The energy profile of the optimal pathway’s intermediates, transition states and final states of H2O splitting on CaO(111)/Fe(110) surface.
Molecules 30 01471 g014
Figure 15. Schematic of fixed bed experiment.
Molecules 30 01471 g015
Figure 16. Views of the composite CaO(111)/Fe(110) configuration.
Molecules 30 01471 g016
Table 1. Design of chemical looping gasification experiments.
BiomassOxygen CarrierSteam (mL/min)Temperature (°C)Time (min)
A1Chlorella vulgarisSiO2/80030
A2Chlorella vulgarisCa2Fe2O5/80030
A3Chlorella vulgarisCa2Fe2O50.0480030
Table 2. Bader charge analysis.
Configuration CO1O2Fe1OFe2C
aBefore adsorption1.626−0.812−0.814−0.0570.172
After adsorption0.918−0.907−0.963−0.1090.503
bBefore adsorption1.236−1.087−0.814−0.0570.172
After adsorption0.421−0.974−0.868−0.6050.433
Table 3. Bader charge analysis.
Configuration H1H2OFe1Fe2
aBefore adsorption0.5810.551−1.1320.019−0.011
After adsorption0.3290.231−1.1720.1980.391
bBefore adsorption0.5130.551−1.1320.018−0.011
After adsorption0.431−0.467−0.8710.9270.198
Table 4. Proximate and ultimate analyses of biomass.
Proximate Analysis (wt.%, ad)Ultimate Analysis (wt.%, ad)Low Heating Value (MJ/kg)
MoistureVolatilesFCAshCHNSO a
4.4076.6314.556.4248.666.969.260.6534.4719.23
a Difference calculation.
Disclaimer/Publisher’s Note: The statements, opinions and data contained in all publications are solely those of the individual author(s) and contributor(s) and not of MDPI and/or the editor(s). MDPI and/or the editor(s) disclaim responsibility for any injury to people or property resulting from any ideas, methods, instructions or products referred to in the content.

