


Liquid Chromatography-Tandem Mass Spectrometry Method Development and Validation for the Determination of a New Mitochondrial Antioxidant in Mouse Liver and Cerebellum, Employing Advanced Chemometrics


 ,
,  and
and 
Abstract

1. Introduction
2. Results
2.1. Instrumental Conditions
2.1.1. Optimized Conditions of Mass Spectrometric Analysis
2.1.2. Selection of the Chromatographic Mode and the Mobile Phase Requirements
2.1.3. Selection of the Chromatographic Column
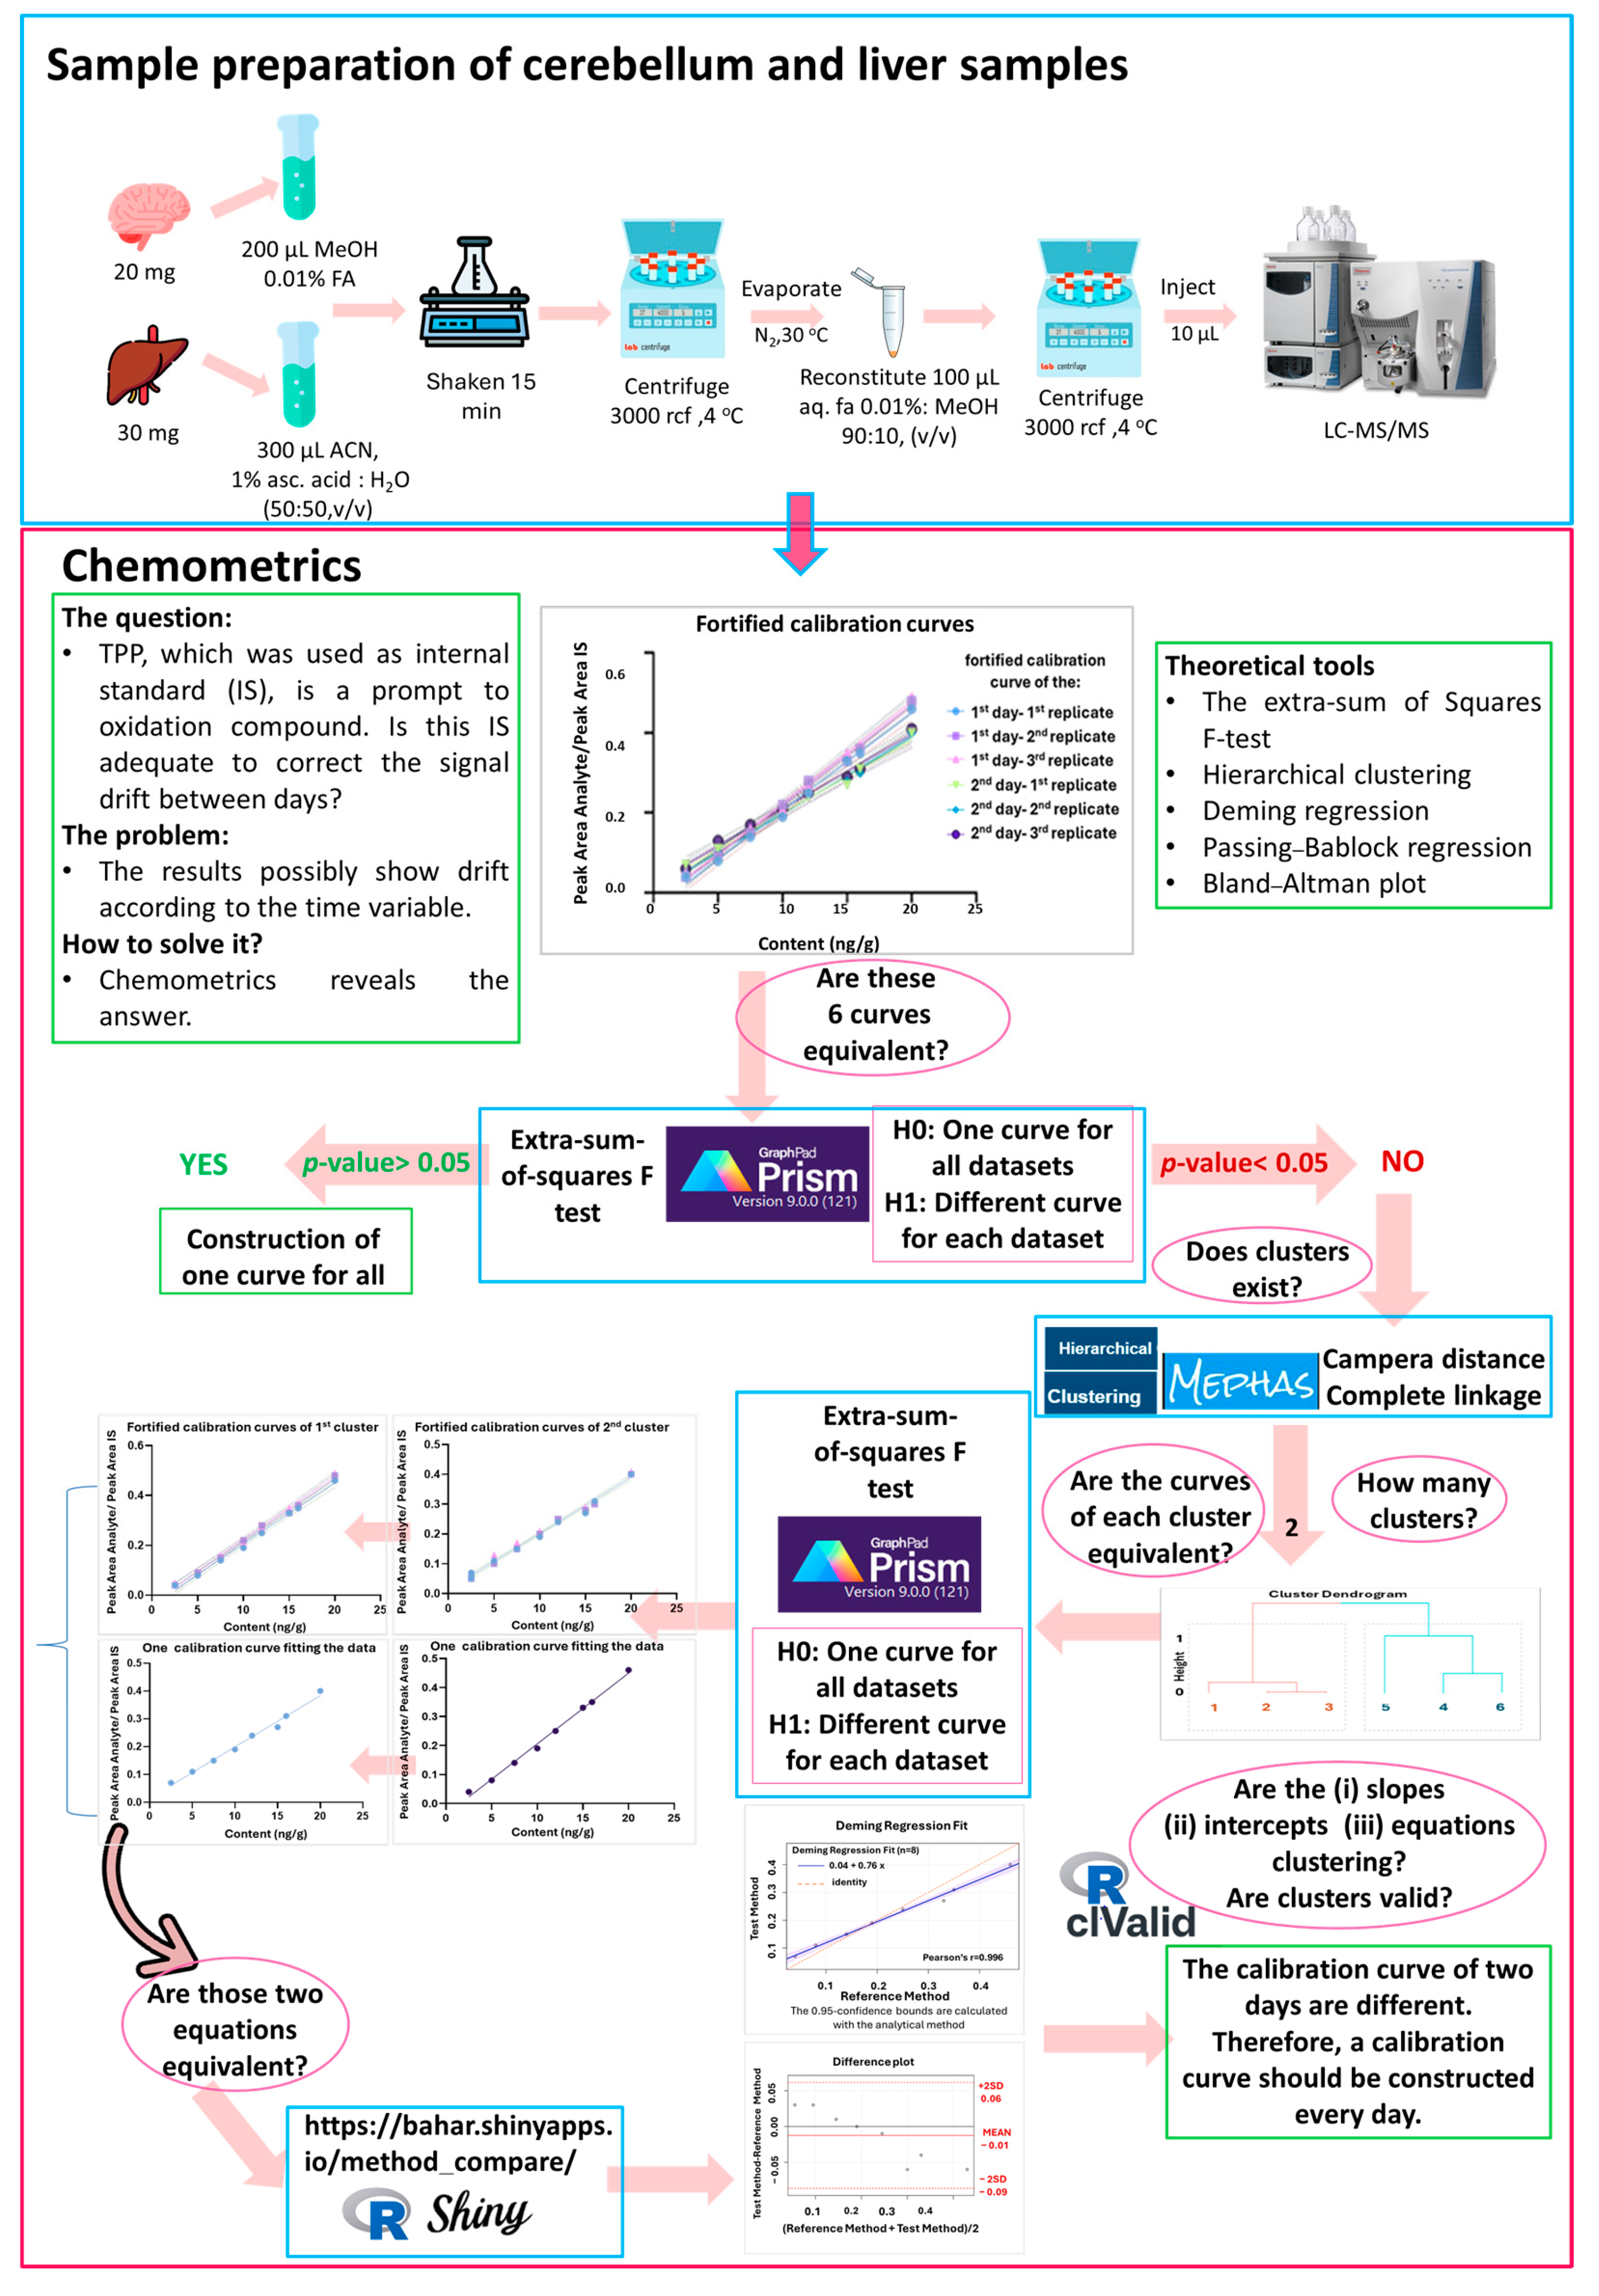
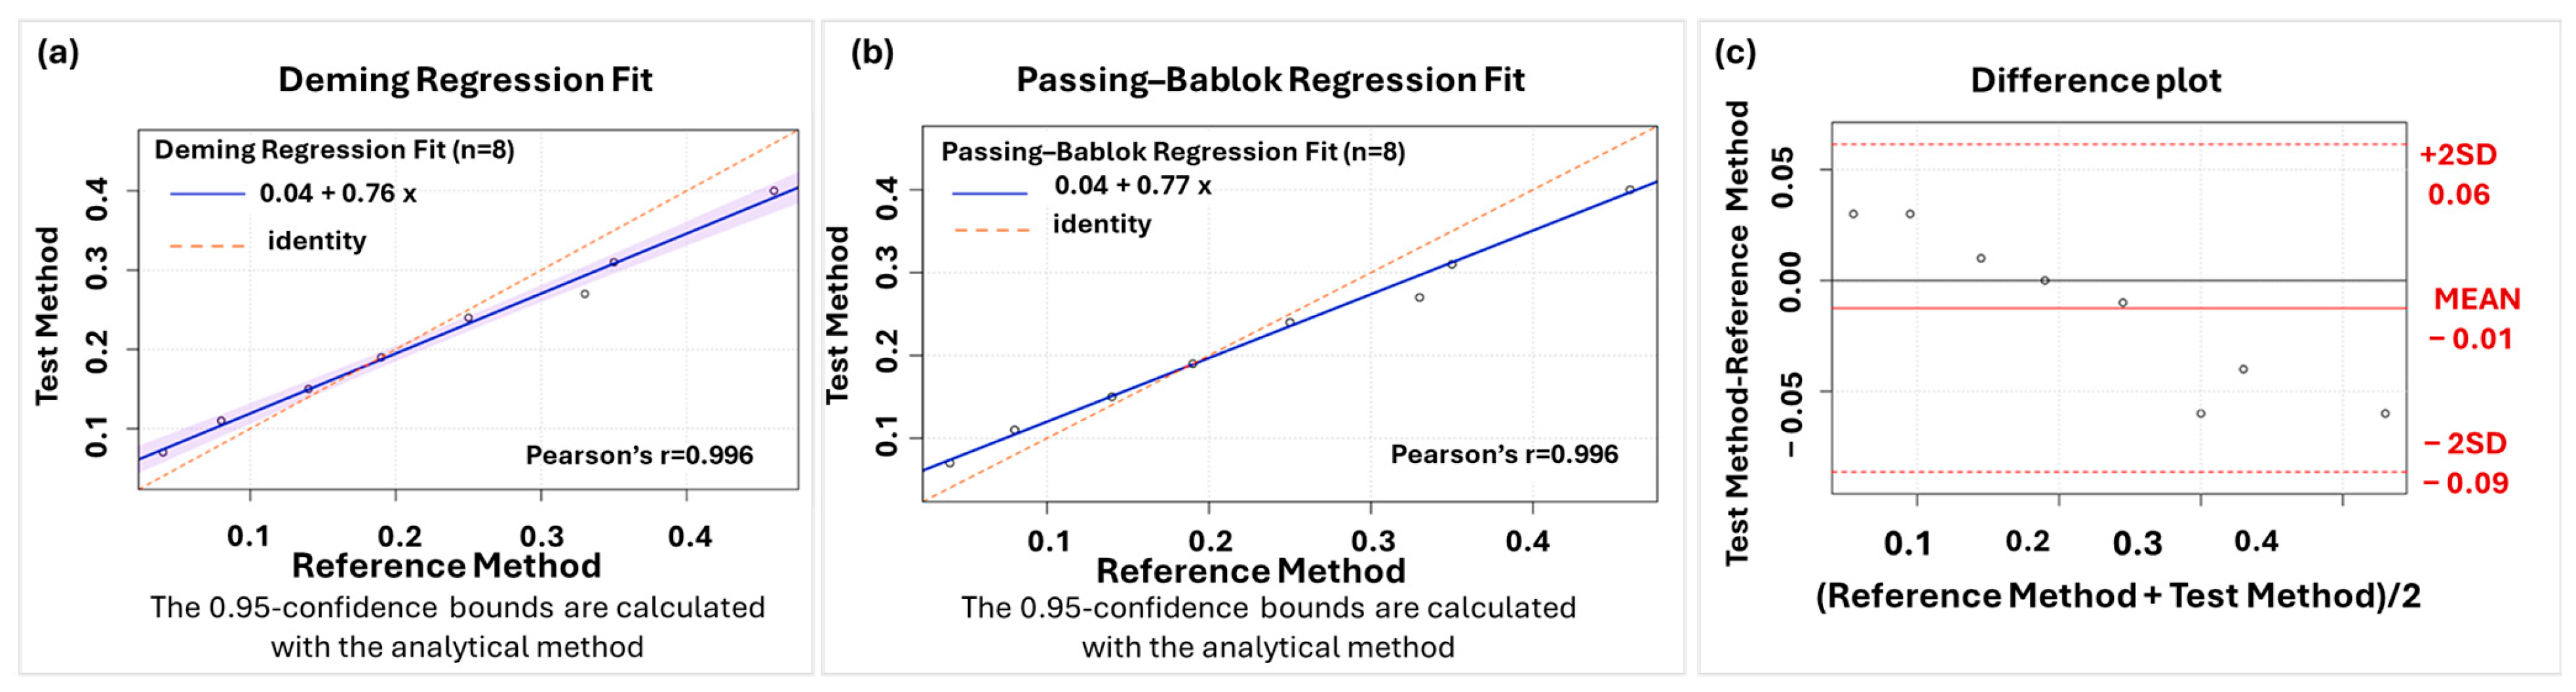
2.2. Chemometrics
2.3. Validation
2.3.1. Selectivity
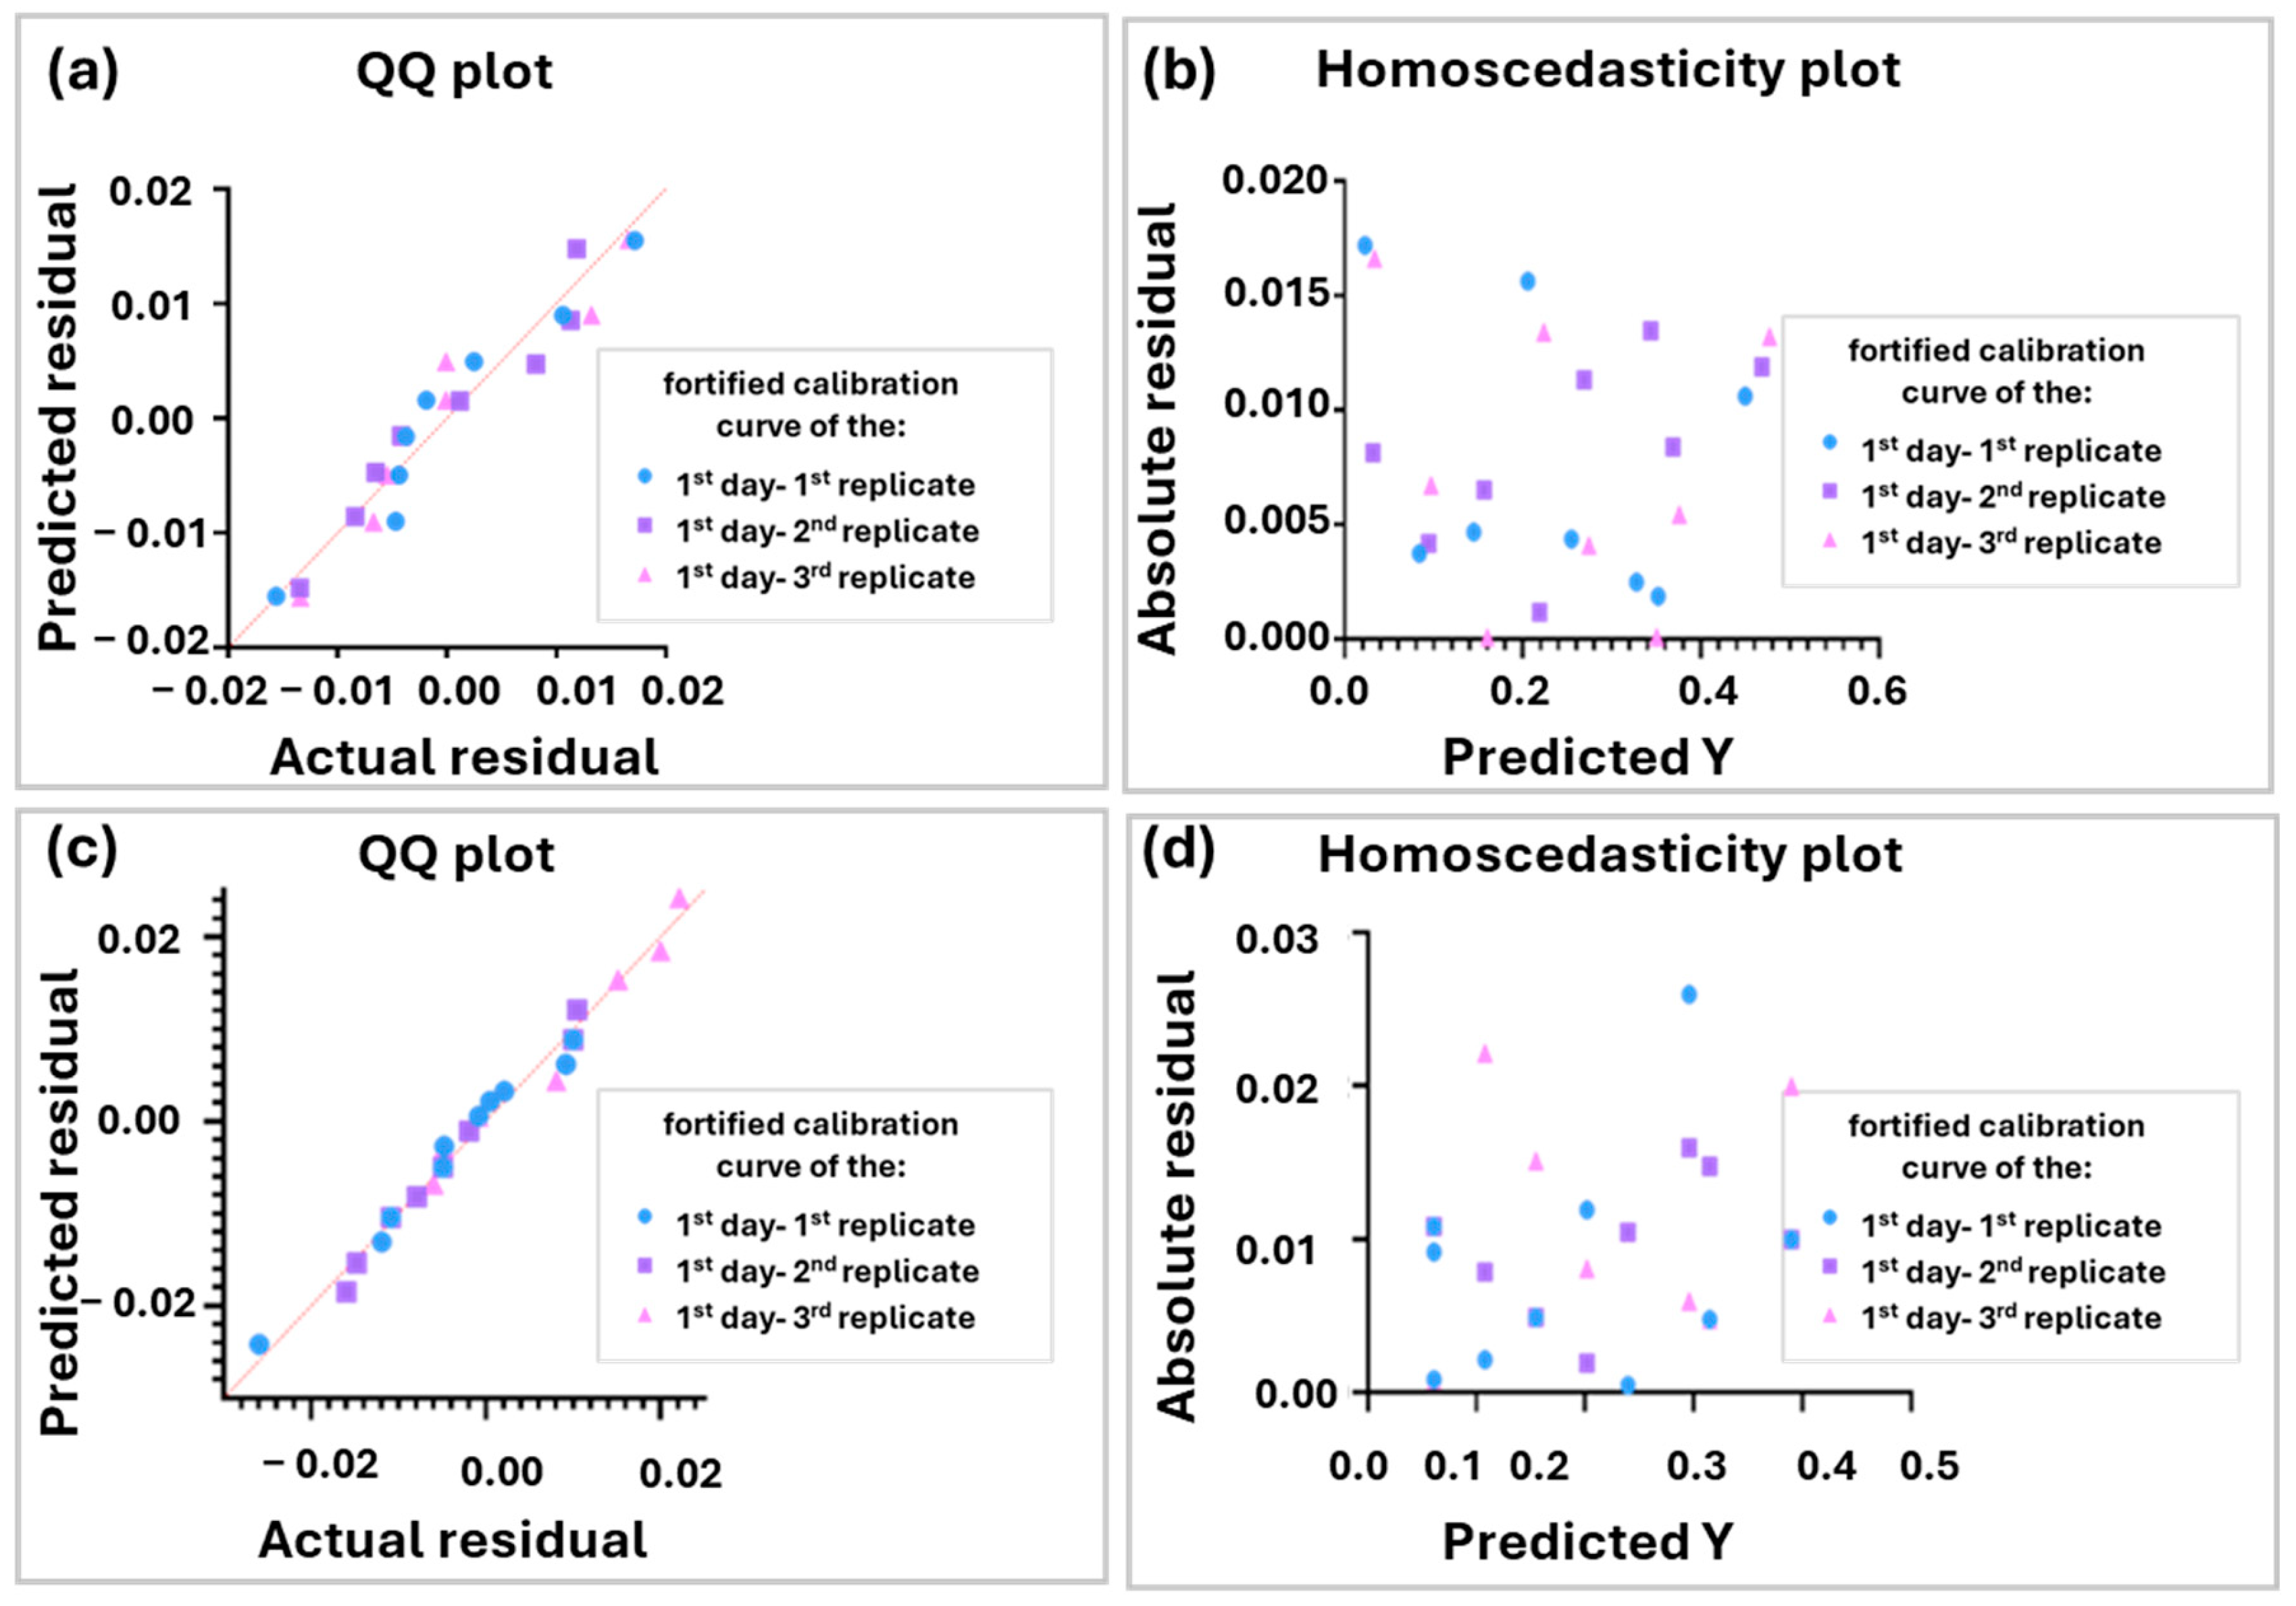
2.3.2. Linearity
2.3.3. Accuracy (Precision and Trueness)
2.3.4. Matrix Effect
2.3.5. Carryover
2.3.6. Limit of Detection and Quantification
2.4. Results of Analysis in Cerebellum and Liver Samples
3. Discussion
3.1. Selection of Experimental Conditions
3.1.1. Selection of the Detection Methodology
3.1.2. Selection of the Chromatographic Mode and the Mobile Phase Requirements
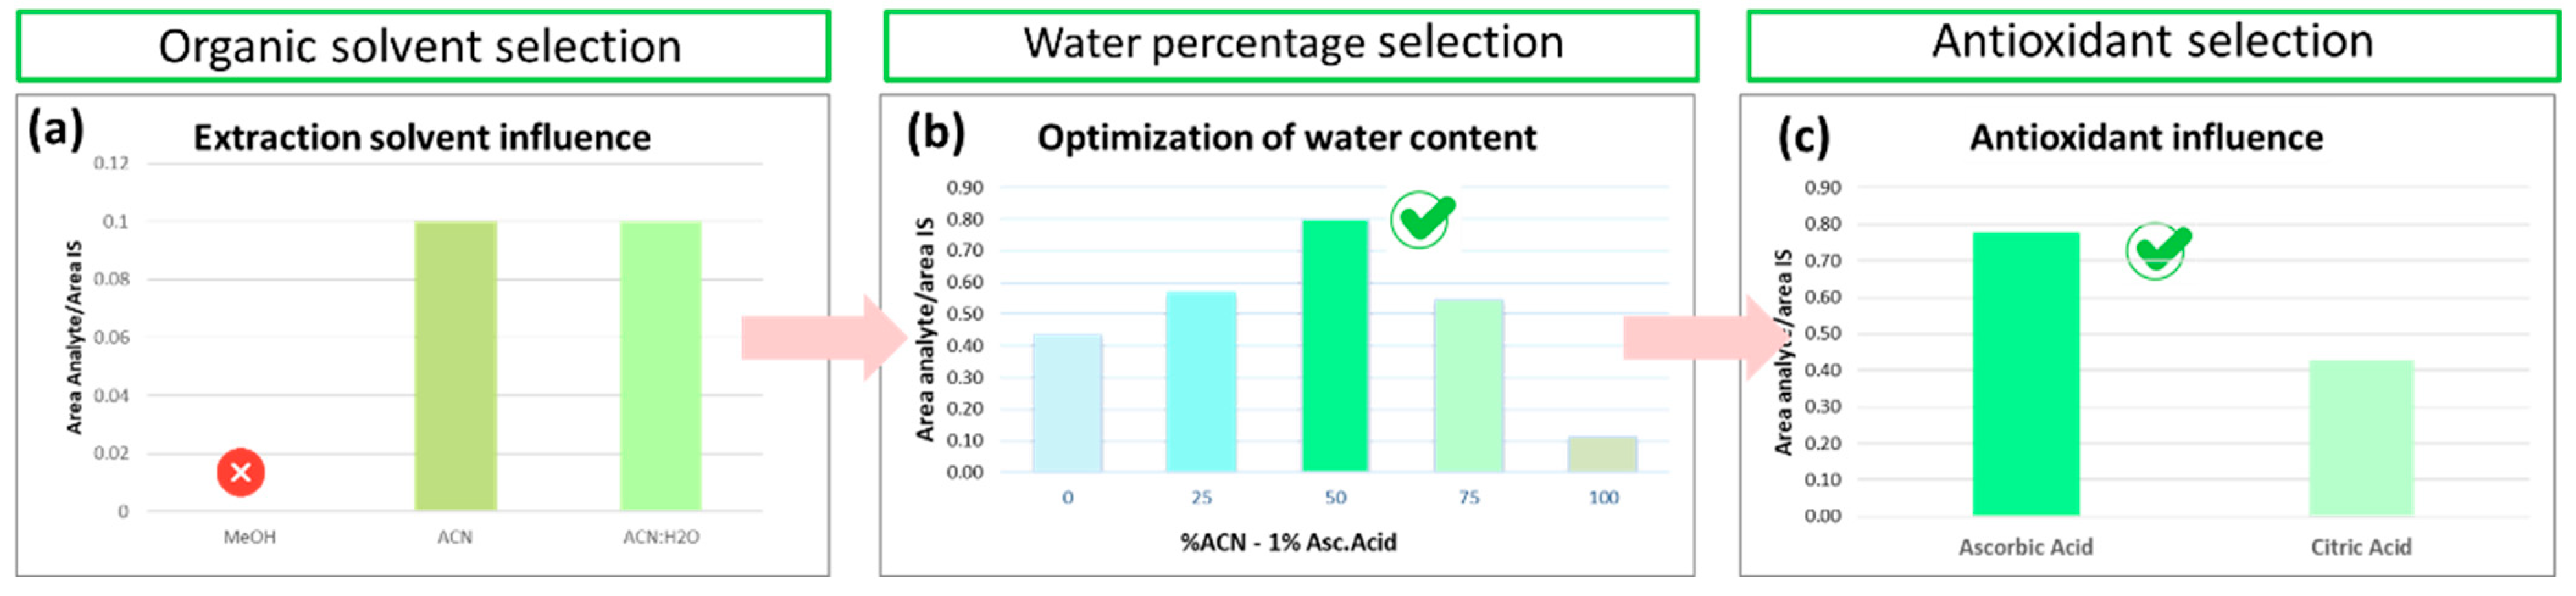
3.1.3. Optimization of Pretreatment in Liver Samples
3.2. Chemometrics
4. Materials and Methods
4.1. Compliance with Ethics Guidelines
4.2. In Vivo TPP-HT Administration and Tissue Collection
4.3. Reagents and Materials
4.4. LC-MS/MS Instrumentation
4.5. Method Optimization
4.5.1. Optimization of ESI Source Conditions
4.5.2. Optimization of Liquid Chromatographic Conditions
In Silico Calculations
Selection of Chromatographic Column
4.5.3. Sample Preparation
Optimization of Pretreatment in Liver Samples
Optimized Liver Sample Preparation
4.6. Chemometrics Methodology
4.7. Methods Validation and Acceptance Criteria
4.7.1. Selectivity
4.7.2. Linearity
4.7.3. Accuracy (Trueness and Precision)
4.7.4. Matrix Effect
4.7.5. Carryover
4.7.6. Limit of Detection and Quantification
5. Conclusions
Supplementary Materials
Author Contributions
Funding
Institutional Review Board Statement
Informed Consent Statement
Data Availability Statement
Acknowledgments
Conflicts of Interest
Abbreviations
| TPP | Triphenylphosphine |
| HT | hydroxytyrosol |
| UHPLC-MS/MS | Ultra-high-performance liquid chromatography-tandem triple quadrupole mass spectrometry |
| BBB | Blood–brain barrier |
| ROS | Reactive oxygen species |
| IS | Internal standard |
| SRM | Single reaction monitoring |
| SE | Standard error |
| LOD | Limit of detection |
| LOQ | Limit of quantification |
| LLOQ, | Lower limit of quantification |
| LQC, | Lower quality control |
| MQC | Middle quality control |
| HQC | Higher quality control |
| ULOQ | Upper limit of quantification- |
| RSD | Relative standard deviation |
| HILIC | Hydrophilic interaction liquid chromatography |
| RP | Reversed phase |
| MeOH | Methanol |
| FA | Formic acid |
| ACN | Acetonitrile |
| CE | Collision energy |
| TL | Tube lens |
References
- Institute for Health Metrics and Evaluation. Available online: https://www.healthdata.org/research-analysis/health-risks-issues/mental-health (accessed on 6 October 2024).
- Javaid, S.F.; Hashim, I.J.; Hashim, M.J.; Stip, E.; Samad, M.A.; Ahbabi, A.A. Epidemiology of anxiety disorders: Global burden and sociodemographic associations. Middle East Curr. Psychiatry 2023, 30, 44. [Google Scholar] [CrossRef]
- Mahmud, S.; Mohsin, M.; Dewan, M.N.; Muyeed, A. The Global Prevalence of Depression, Anxiety, Stress, and Insomnia Among General Population During COVID-19 Pandemic: A Systematic Review and Meta-analysis. Trends Psychol. 2022, 31, 143–170. [Google Scholar] [CrossRef]
- Word Health Organization. Available online: https://www.who.int/news-room/fact-sheets/detail/anxiety-disorders (accessed on 6 October 2024).
- Chrousos, G.P. Stress and disorders of the stress system. Nat. Rev. Endocrinol. 2009, 5, 374–381. [Google Scholar] [CrossRef]
- Vyas, A.; Pillai, A.G.; Chattarji, S. Recovery after chronic stress fails to reverse amygdaloid neuronal hypertrophy and enhanced anxiety-like behavior. Neuroscience 2004, 128, 667–673. [Google Scholar] [CrossRef] [PubMed]
- McLaughlin, K.A.; Hatzenbuehler, M.L. Stressful life events, anxiety sensitivity, and internalizing symptoms in adolescents. J. Abnorm. Psychol. 2009, 118, 659–669. [Google Scholar] [CrossRef]
- Picard, M.; McEwen, B.S. Psychological Stress and Mitochondria: A Systematic Review. Psychosom. Med. 2018, 80, 141–153. [Google Scholar] [CrossRef]
- Filiou, M.D.; Sandi, C. Anxiety and Brain Mitochondria: A Bidirectional Crosstalk. Trends Neurosci. 2019, 42, 573–588. [Google Scholar] [CrossRef]
- Papageorgiou, M.P.; Filiou, M.D. Mitochondrial dynamics and psychiatric disorders: The missing link. Neurosci. Biobehav. Rev. 2024, 165, 105837. [Google Scholar] [CrossRef]
- Papageorgiou, M.P.; Theodoridou, D.; Nussbaumer, M.; Syrrou, M.; Filiou, M.D. Deciphering the Metabolome under Stress: Insights from Rodent Models. Curr. Neuropharmacol. 2024, 22, 884–903. [Google Scholar] [CrossRef]
- Picard, M.; McManus, M.J.; Gray, J.D.; Nasca, C.; Moffat, C.; Kopinski, P.K.; Seifert, E.L.; McEwen, B.S.; Wallace, D.C. Mitochondrial functions modulate neuroendocrine, metabolic, inflammatory, and transcriptional responses to acute psychological stress. Proc. Natl. Acad. Sci. USA 2015, 112, E6614–E6623. [Google Scholar] [CrossRef]
- Duan, K.; Gu, Q.; Petralia, R.S.; Wang, Y.X.; Panja, D.; Liu, X.; Lehmann, M.L.; Zhu, H.; Zhu, J.; Li, Z. Mitophagy in the basolateral amygdala mediates increased anxiety induced by aversive social experience. Neuron 2021, 109, 3793–3809.e3798. [Google Scholar] [CrossRef] [PubMed]
- Gebara, E.; Zanoletti, O.; Ghosal, S.; Grosse, J.; Schneider, B.L.; Knott, G.; Astori, S.; Sandi, C. Mitofusin-2 in the Nucleus Accumbens Regulates Anxiety and Depression-like Behaviors Through Mitochondrial and Neuronal Actions. Biol. Psychiatry 2021, 89, 1033–1044. [Google Scholar] [CrossRef] [PubMed]
- Filiou, M.D.; Zhang, Y.; Teplytska, L.; Reckow, S.; Gormanns, P.; Maccarrone, G.; Frank, E.; Kessler, M.S.; Hambsch, B.; Nussbaumer, M.; et al. Proteomics and metabolomics analysis of a trait anxiety mouse model reveals divergent mitochondrial pathways. Biol. Psychiatry 2011, 70, 1074–1082. [Google Scholar] [CrossRef] [PubMed]
- Iris, F.; Filiou, M.; Turck, C.W. Differential proteomics analyses reveal anxiety-associated molecular and cellular mechanisms in cingulate cortex synapses. Am. J. Psychiatry Neurosci. 2014, 2, 25–42. [Google Scholar] [CrossRef]
- Hollis, F.; van der Kooij, M.A.; Zanoletti, O.; Lozano, L.; Canto, C.; Sandi, C. Mitochondrial function in the brain links anxiety with social subordination. Proc. Natl. Acad. Sci. USA 2015, 112, 15486–15491. [Google Scholar] [CrossRef]
- Thomou, C.; Nussbaumer, M.; Grammenou, E.; Komini, C.; Vlaikou, A.M.; Papageorgiou, M.P.; Filiou, M.D. Early Handling Exerts Anxiolytic Effects and Alters Brain Mitochondrial Dynamics in Adult High Anxiety Mice. Mol. Neurobiol. 2024, 61, 10593–10612. [Google Scholar] [CrossRef]
- Chan, S.T.; McCarthy, M.J.; Vawter, M.P. Psychiatric drugs impact mitochondrial function in brain and other tissues. Schizophr. Res. 2020, 217, 136–147. [Google Scholar] [CrossRef]
- Nussbaumer, M.; Asara, J.M.; Teplytska, L.; Murphy, M.P.; Logan, A.; Turck, C.W.; Filiou, M.D. Selective Mitochondrial Targeting Exerts Anxiolytic Effects In Vivo. Neuropsychopharmacology 2015, 41, 1751–1758. [Google Scholar] [CrossRef]
- Hargreaves, I.P. Coenzyme Q10 as a therapy for mitochondrial disease. Int. J. Biochem. Cell Biol. 2014, 49, 105–111. [Google Scholar] [CrossRef]
- Perry, J.B.; Davis, G.N.; Allen, M.E.; Makrecka-Kuka, M.; Dambrova, M.; Grange, R.W.; Shaikh, S.R.; Brown, D.A. Cardioprotective effects of idebenone do not involve ROS scavenging: Evidence for mitochondrial complex I bypass in ischemia/reperfusion injury. J. Mol. Cell Cardiol. 2019, 135, 160–171. [Google Scholar] [CrossRef]
- Hinkle, J.S.; Rivera, C.N.; Vaughan, R.A. AICAR stimulates mitochondrial biogenesis and BCAA catabolic enzyme expression in C2C12 myotubes. Biochimie 2022, 195, 77–85. [Google Scholar] [CrossRef] [PubMed]
- Kamatani, N.; Kushiyama, A.; Toyo-Oka, L.; Toyo-Oka, T. Treatment of two mitochondrial disease patients with a combination of febuxostat and inosine that enhances cellular ATP. J. Hum. Genet. 2019, 64, 351–353. [Google Scholar] [CrossRef]
- Zielonka, J.; Joseph, J.; Sikora, A.; Hardy, M.; Ouari, O.; Vasquez-Vivar, J.; Cheng, G.; Lopez, M.; Kalyanaraman, B. Mitochondria-Targeted Triphenylphosphonium-Based Compounds: Syntheses, Mechanisms of Action, and Therapeutic and Diagnostic Applications. Chem. Rev. 2017, 117, 10043–10120. [Google Scholar] [CrossRef] [PubMed]
- Buchke, S.; Sharma, M.; Bora, A.; Relekar, M.; Bhanu, P.; Kumar, J. Mitochondria-Targeted, Nanoparticle-Based Drug-Delivery Systems: Therapeutics for Mitochondrial Disorders. Life 2022, 12, 657. [Google Scholar] [CrossRef] [PubMed]
- He, X.; Liang, S.M.; Wang, H.Q.; Tao, L.; Sun, F.F.; Wang, Y.; Zhang, C.; Huang, Y.C.; Xu, D.X.; Chen, X. Mitoquinone protects against acetaminophen-induced liver injury in an FSP1-dependent and GPX4-independent manner. Toxicol. Appl. Pharmacol. 2023, 465, 116452. [Google Scholar] [CrossRef]
- Williamson, J.; Hughes, C.M.; Cobley, J.N.; Davison, G.W. The mitochondria-targeted antioxidant MitoQ, attenuates exercise-induced mitochondrial DNA damage. Redox Biol. 2020, 36, 101673. [Google Scholar] [CrossRef]
- Driss, F.; El-Benna, J. Antioxidant Effect of Hydroxytyrosol, a Polyphenol from Olive Oil by Scavenging Reactive Oxygen Species Produced by Human Neutrophils. In Olives and Olive Oil in Health and Disease Prevention; Victor, R., Preedy, R.R.W., Eds.; Academic Press: Cambridge, MA, USA, 2010; pp. 1289–1294. [Google Scholar]
- Peng, S.; Zhang, B.; Yao, J.; Duan, D.; Fang, J. Dual protection of hydroxytyrosol, an olive oil polyphenol, against oxidative damage in PC12 cells. Food Funct. 2015, 6, 2091–2100. [Google Scholar] [CrossRef]
- Karkovic Markovic, A.; Toric, J.; Barbaric, M.; Jakobusic Brala, C. Hydroxytyrosol, Tyrosol and Derivatives and Their Potential Effects on Human Health. Molecules 2019, 24, 2001. [Google Scholar] [CrossRef]
- Liu, X.; Gao, J.; Yan, Y.; Georgiou, E.A.; Lou, J.; Feng, M.; Zhang, X.; Gao, F.; Liu, J.; Kostakis, I.K.; et al. Mitochondria-Targeted Triphenylphosphonium-Hydroxytyrosol Prevents Lipotoxicity-Induced Endothelial Injury by Enhancing Mitochondrial Function and Redox Balance via Promoting FoxO1 and Nrf2 Nuclear Translocation and Suppressing Inflammation via Inhibiting p38/NF-small ka, CyrillicB Pathway. Antioxidants 2023, 12, 175. [Google Scholar] [CrossRef]
- Chacko, B.K.; Srivastava, A.; Johnson, M.S.; Benavides, G.A.; Chang, M.J.; Ye, Y.; Jhala, N.; Murphy, M.P.; Kalyanaraman, B.; Darley-Usmar, V.M. Mitochondria-targeted ubiquinone (MitoQ) decreases ethanol-dependent micro and macro hepatosteatosis. Hepatology 2011, 54, 153–163. [Google Scholar] [CrossRef]
- Qsee, H.S.; Shetty, S.; De, S.; Bharati, S. Mitochondria-targeted antioxidant, mitoQ protects hepatic tissue from N-nitrosodiethylamine-induced damage by modulating mitochondrial function and redox status. Adv. Redox Res. 2024, 12, 100108. [Google Scholar] [CrossRef]
- Ekemeyong Awong, L.E.; Zielinska, T. Comparative Analysis of the Clustering Quality in Self-Organizing Maps for Human Posture Classification. Sensors 2023, 23, 7925. [Google Scholar] [CrossRef]
- ICH Q2(R2) Validation of Analytical Procedures—Scientific Guideline. 2022. Available online: https://www.ema.europa.eu/en/ich-q2r2-validation-analytical-procedures-scientific-guideline (accessed on 10 November 2024).
- Bioanalytical Method Validation Guidance for Industry. Bioanalytical Method Validation 2018. Available online: https://www.fda.gov/regulatory-information/search-fda-guidance-documents/bioanalytical-method-validation-guidance-industry (accessed on 10 November 2024).
- Pardridge, W.M. Alzheimer’s disease drug development and the problem of the blood-brain barrier. Alzheimers Dement. 2009, 5, 427–432. [Google Scholar] [CrossRef] [PubMed]
- Garcia-Altieri, M.; Carrera-Mejias, K.; Hernaez, R. Management of depression/anxiety in patients with chronic liver disease. Clin. Liver Dis. 2024, 23, e0179. [Google Scholar] [CrossRef] [PubMed]
- Rutledge, T. The Surprising Link Between the Liver and Mental Health and Why Nearly Half of American Adults May Be at Risk. Available online: https://www.psychologytoday.com/intl/blog/the-healthy-journey/202304/feeling-stressed-it-might-be-your-liver-calling (accessed on 7 January 2025).
- Shea, S.; Lionis, C.; Kite, C.; Lagojda, L.; Uthman, O.A.; Dallaway, A.; Atkinson, L.; Chaggar, S.S.; Randeva, H.S.; Kyrou, I. Non-alcoholic fatty liver disease and coexisting depression, anxiety and/or stress in adults: A systematic review and meta-analysis. Front. Endocrinol. 2024, 15, 1357664. [Google Scholar] [CrossRef]
- Sulaimon, L.A.; Afolabi, L.O.; Adisa, R.A.; Ayankojo, A.G.; Afolabi, M.O.; Adewolu, A.M.; Wan, X. Pharmacological significance of MitoQ in ameliorating mitochondria-related diseases. Adv. Redox Res. 2022, 5, 100037. [Google Scholar] [CrossRef]
- Chemaxon. Available online: https://www.chemaxon.com (accessed on 7 October 2024).
- Zhou, Y.; Leung, S.W.; Mizutani, S.; Takagi, T.; Tian, Y.S. MEPHAS: An interactive graphical user interface for medical and pharmaceutical statistical analysis with R and Shiny. BMC Bioinform. 2020, 21, 183. [Google Scholar] [CrossRef] [PubMed]
- R Team. RStudio: Integrated Development for R; RStudio, PBC: Boston, MA, USA, 2020. [Google Scholar]
- R Core Team. R: A Language and Environment for Statistical Computing; R Foundation for Statistical Computing: Vienna, Austria, 2024. [Google Scholar]
- Brock, G.; Pihur, V.; Datta, S.; Datta, S. clValid: An R Package for Cluster Validation. J. Stat. Softw. 2008, 25, 1–22. [Google Scholar] [CrossRef]
- Bahar, B.; Tuncel, A.F.; Holmes, E.W.; Holmes, D.T. An interactive website for analytical method comparison and bias estimation. Clin. Biochem. 2017, 50, 1025–1029. [Google Scholar] [CrossRef]


| Repeatability (n = 6) | Intermediate Precision (n = 9) | Trueness (n = 6) | |||
|---|---|---|---|---|---|
| Fortification Level (ng g−1) | Average (ng g−1) | %RSD | Average(ng g−1) | %RSD | %Recovery (Average ± Confidence Interval (95%)) |
| 2.5 (LLOQ) | 2.63 | 4.4 | 2.67 | 5.7 | 106 ± 9.0 |
| 7.5 (LQC) | 7.35 | 5.5 | 7.21 | 9.7 | 97 ± 11 |
| 10 (MQC) | 9.34 | 5.0 | 9.19 | 6.1 | 93 ± 9.1 |
| 17.5 (HQC) | 16.61 | 3.7 | 16.55 | 3.3 | 104 ± 7.5 |
| 20 (ULOQ) | 20.06 | 3.1 | 20.10 | 2.8 | 100 ± 6.2 |
| Compound | Precursor Ion (m/z) | Quantifier Ion (m/z) | CE (eV) | Qualifier Ion (m/z) | CE (eV) | Tube Lens |
|---|---|---|---|---|---|---|
| TPP-HT | 499.2 | 182.7 | 67 | 261.4 | 42 | 126 |
| TPP | 307.0 | 182.8 | 42 | 184.8 | 24 | 78 |
Disclaimer/Publisher’s Note: The statements, opinions and data contained in all publications are solely those of the individual author(s) and contributor(s) and not of MDPI and/or the editor(s). MDPI and/or the editor(s) disclaim responsibility for any injury to people or property resulting from any ideas, methods, instructions or products referred to in the content. |
© 2025 by the authors. Licensee MDPI, Basel, Switzerland. This article is an open access article distributed under the terms and conditions of the Creative Commons Attribution (CC BY) license (https://creativecommons.org/licenses/by/4.0/).
Share and Cite
Panara, A.; Biliraki, D.; Nussbaumer, M.; Filiou, M.D.; Thomaidis, N.S.; Kostakis, I.K.; Gikas, E. Liquid Chromatography-Tandem Mass Spectrometry Method Development and Validation for the Determination of a New Mitochondrial Antioxidant in Mouse Liver and Cerebellum, Employing Advanced Chemometrics. Molecules 2025, 30, 1900. https://doi.org/10.3390/molecules30091900
Panara A, Biliraki D, Nussbaumer M, Filiou MD, Thomaidis NS, Kostakis IK, Gikas E. Liquid Chromatography-Tandem Mass Spectrometry Method Development and Validation for the Determination of a New Mitochondrial Antioxidant in Mouse Liver and Cerebellum, Employing Advanced Chemometrics. Molecules. 2025; 30(9):1900. https://doi.org/10.3390/molecules30091900
Chicago/Turabian StylePanara, Anthi, Dimitra Biliraki, Markus Nussbaumer, Michaela D. Filiou, Nikolaos S. Thomaidis, Ioannis K. Kostakis, and Evagelos Gikas. 2025. "Liquid Chromatography-Tandem Mass Spectrometry Method Development and Validation for the Determination of a New Mitochondrial Antioxidant in Mouse Liver and Cerebellum, Employing Advanced Chemometrics" Molecules 30, no. 9: 1900. https://doi.org/10.3390/molecules30091900
APA StylePanara, A., Biliraki, D., Nussbaumer, M., Filiou, M. D., Thomaidis, N. S., Kostakis, I. K., & Gikas, E. (2025). Liquid Chromatography-Tandem Mass Spectrometry Method Development and Validation for the Determination of a New Mitochondrial Antioxidant in Mouse Liver and Cerebellum, Employing Advanced Chemometrics. Molecules, 30(9), 1900. https://doi.org/10.3390/molecules30091900