Proceeding Paper

Comparison of Regression and Neural Network Model for Short Term Load Forecasting: A Case Study †

1
Department of Electrical Engineering, University of Gujrat, Gujrat 50700, Pakistan
2
Saudi Electric Company, KSA, Riyadh 11416, Saudi Arabia
3
Department of Electrical Engineering, Lahore College for Women University, Lahore 54000, Pakistan
*
Author to whom correspondence should be addressed.
Presented at the 1st International Conference on Energy, Power and Environment, Gujrat, Pakistan, 11–12 November 2021.
Eng. Proc. 2021, 12(1), 29; https://doi.org/10.3390/engproc2021012029
Published: 24 December 2021
(This article belongs to the Proceedings of The 1st International Conference on Energy, Power and Environment)

Abstract

:
Short term load forecasting (STLF) is an obligatory and vibrant part of power system planning and dispatching. It utilized for short and running targets in power system planning. Electricity consumption has nonlinear patterns due to its reliance on factors such as time, weather, geography, culture, and some random and individual events. This research work emphasizes STLF through utilized load profile data from domestic energy meter and forecasts it by Multiple Linear Regression (MLR) and Cascaded Forward Back Propagation Neural Network (CFBP) techniques. First, simple regression statistical calculations used for prediction, later the model improved by using a neural network tool. The performance of both models compared with Mean Absolute Percent Error (MAPE). The MAPE error for MLR observed as 47% and it reduced to 8.9% for CFBP.

1. Introduction

Energy crisis in Pakistan urged the need to focus on running solution along with planning future to reduce the demand supply energy gap [1]. This energy demand gap reaches its peak during summer due to rise in temperature and air conditioning loads. The unit commitment for distribution companies is challenging during summer. It is thus very effective if these months are planned in time. Short Term Load Forecasting becomes vital in this time.
Electrical load forecast is necessary due to the growing trends such as population, urbanization, culture, economic trends, industrial growth and uncertainties in weather. Previous data gathered from a residential three phase static energy meter installed under Gujranwala Electric Power Company (GEPCo) division.
Good estimation is as best fit between prediction and target points. Estimation can result in both positive and negative variation from the required value. Regression through neural al network is most commonly used for short term load forecasting [2,3]. Hidden layers are induced in regression models for better calculation such as human brain mechanism.
Generally, energy forecasting methods can be broadly classified in to three major classes; Artificial Intelligence (AI) Method, Statistical Method and Engineering Method [4]. Popular methods widely used in load forecasting is the Artificial Intelligence (AI) Method, which includes Support Vector Machine (SVM) and Artificial Neural Network (ANN). The other two techniques, i.e., Engineering Methods and Statistical Methods are yet connected, yet a few inadequacies distinguished in both strategies, midst the insufficiency in engineering method is its complexity to apply it for all intents and purposes, its absence of information data [5]. ANNs have been extremely great application in time-series prediction, because of their accuracy and simplicity. The erudition practice is usually relying on slope strategy back propagation (BP) computation. Back spread estimation has noteworthy detriments: the learning strategy is repetitive and there is no meticulous statute for setting the number of covered neurons to evade over or under fitting, and in a perfect world, influencing the figuring out how to arrange concurrent. Comparison was made utilizing distinctive strategies [6]. Regression and Neural network working topology can be described by Figure 1.
STLF is more focused in terms of load forecasting, used ANN models as clustering to predict the bus load for next hour or a day [7]. Hybrid fore casted model gives improved accuracy than traditional models. This was tested on bus model. PSF can be modeled with ANN. The model is in two levels first PSF is used for prediction than ANN is used to refine the results [8]. STLF is nonlinear in nature. Regression with combination of ANN is very suitable for load curves Spread parameter determines the performance of the General Regression Neural Network (GRNN). This problem can be dealt using fruit fly algorithm. Step Fruit-fly Optimization Algorithm (SFOA) is combines with GRNN with decreasing step. This model is compared with other ANN on the basis of prediction error [9]. Neural networks have been very impressive for load forecasting in present era many papers with different models have been published with practical application with high success rates [10,11,12,13,14]. ANN can completely adjust master information and change their parameters as needs to recreate the issue’s attributions through preparing ideal models [15].

2. Methodology

The methodology of this work is composed of; Data Collection > MLR > Data sorting for ANN > ANN development > Simulation> Results > Conclusion.
ANN requires input and target data. The accuracy of the ANN output is very much affected by type and depth of the data, it is not so much useful for less data. ANN accepts data in form of matrices. it took input as rows of a matrix and respective weights in column. ANN train the input data and tries to fit the plot between target values. To improve the accuracy of the ANN, data as descried in Table 1 is fed to the input:

3. Results

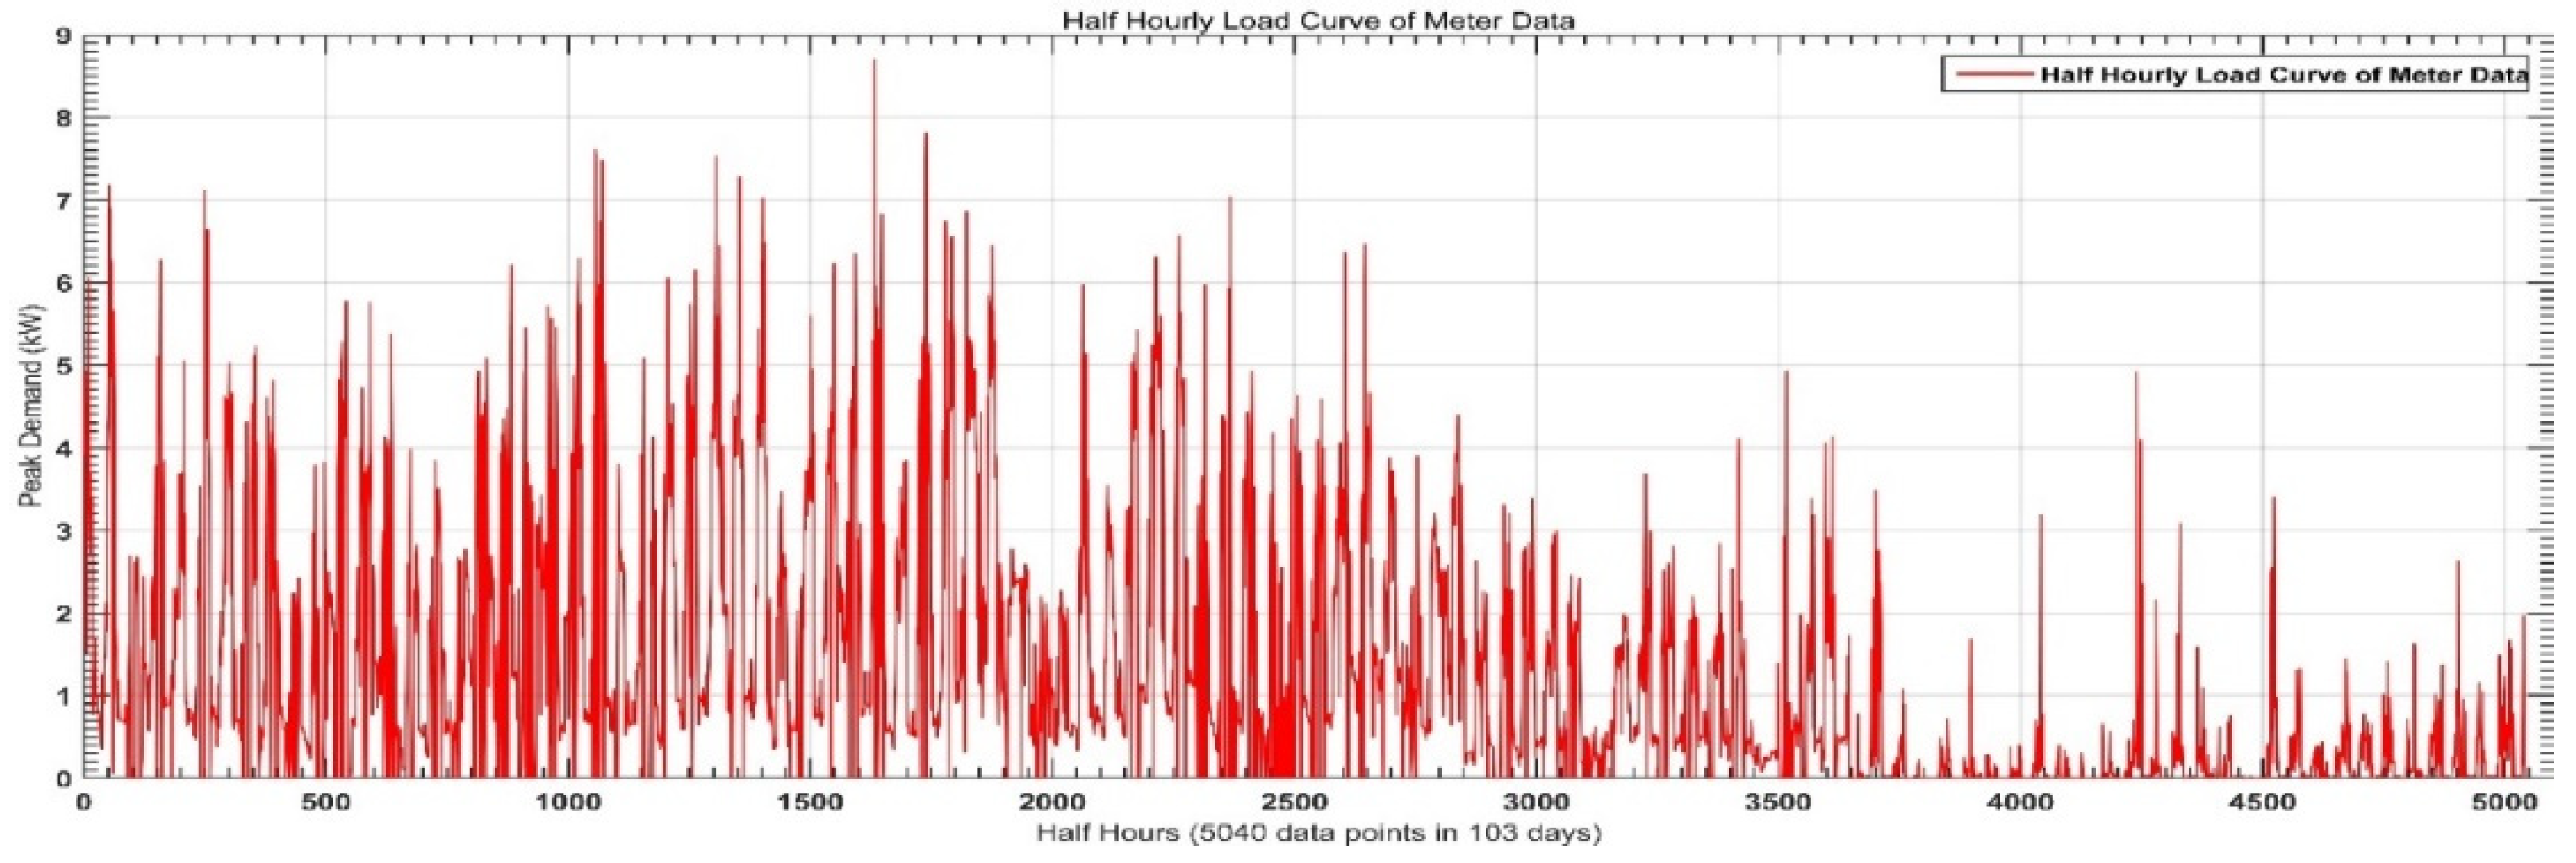
Data obtained from the energy meter is represented in Figure 2, number of power outages in this duration in Figure 3 and target day curve is revealed in Figure 4.
Network created with succeeding parameters: Network Type was “Cascaded Forward Back Propagation Neural Network (CFBP)” Training function used “trainlm”, Adaption function was “learndgm”, Performance function was “mse”, Nos of layers were “2”, Nos of neuron were layer1: 10, layer2: 1 and Transfer function was “purelin”.
Created network executed for 48 h forecast. The load profile collected from energy meter was in raw form. There were many power outages that can be noticed from profile as gap of the continuity in the load profile timing.
These power outages induce complexity and uncertainty in output. To avoid this problem refined duration with minimum power outages in 30 days is selected and regression analysis is applied to it using Data analysis tool in MS Excel. The results are obtained and plotted with comparison of the targets as shown in Figure 5.
The results of regression analysis were not so much accurate when compared to target values. Some alternatives should be used for better results. MAPE is measured as;
MAPE = i = 1 N | T i P i T i | N × 100

4. Conclusions

Limited scope of MLR over non-linear trends suggest using alternate solution for energy forecasting. ANN tools are widely used for this purpose. This research work also proposed ANN best suitable for STLF. MAPE used as performance comparison criteria for regression and proposed ANN. It was evident from the comparison results that CFBP outperformed in contrast with MLR. The error was reduced to 8.9% by CFBP from 47% by MLR. Neural networks outperformed in forecasting with high nonlinearity and discontinuity.

Conflicts of Interest

The authors declare no conflict of interest.

References

  1. Mufti, G.M.; Jamil, M.; Nawaz, M.; Hassan, S.Z.; Kamal, T. Evaluating the Issues and Challenges in Context of the Energy Crisis of Pakistan. Indian J. Sci. Technol. 2016, 9, 36. [Google Scholar] [CrossRef]
  2. Chae, Y.T.; Horesh, R.; Hwang, Y.; Lee, Y.M. Artificial neural network model for forecasting sub-hourly electricity usage in commercial buildings. Energy Build. 2016, 111, 184–194. [Google Scholar] [CrossRef]
  3. Yildiz, B.; Bilbao, J.; Sproul, A. A review and analysis of regression and machine learning models on commercial building electricity load forecasting. Renew. Sustain. Energy Rev. 2017, 73, 1104–1122. [Google Scholar] [CrossRef]
  4. Ahmad, A.; Hassan, M.; Abdullah, M.; Rahman, H.A.; Hussin, F.; Abdullah, H.; Saidur, R. A review on applications of ANN and SVM for building electrical energy consumption forecasting. Renew. Sustain. Energy Rev. 2014, 33, 102–109. [Google Scholar] [CrossRef]
  5. Ying, L.-C.; Pan, M.-C. Using adaptive network based fuzzy inference system to forecast regional electricity loads. Energy Convers. Manag. 2008, 49, 205–211. [Google Scholar] [CrossRef]
  6. Khwaja, A.; Naeem, M.; Anpalagan, A.; Venetsanopoulos, A.; Venkatesh, B. Improved short-term load forecasting using bagged neural networks. Electr. Power Syst. Res. 2015, 125, 109–115. [Google Scholar] [CrossRef]
  7. Panapakidis, I.P. Clustering based day-ahead and hour-ahead bus load forecasting models. Int. J. Electr. Power Energy Syst. 2016, 80, 171–178. [Google Scholar] [CrossRef]
  8. Koprinska, I.; Rana, M.; Troncoso, A.; Martínez-Álvarez, F. Combining pattern sequence similarity with neural networks for forecasting electricity demand time series. In Proceedings of the 2013 International Joint Conference on Neural Networks (IJCNN), Dallas, TX, USA, 4–9 August 2013; pp. 1–8. [Google Scholar] [CrossRef]
  9. Hu, R.; Wen, S.; Zeng, Z.; Huang, T. A short-term power load forecasting model based on the generalized regression neural network with decreasing step fruit fly optimization algorithm. Neurocomputing 2017, 221, 24–31. [Google Scholar] [CrossRef]
  10. Wang, J.-L.; Wu, H.-N.; Guo, L. Passivity and Stability Analysis of Reaction-Diffusion Neural Networks with Dirichlet Boundary Conditions. IEEE Trans. Neural Networks 2011, 22, 2105–2116. [Google Scholar] [CrossRef] [PubMed]
  11. Liu, H.; Wang, Z.; Shen, B.; Alsaadi, F.E. state estimation for discrete-time memristive recurrent neural networks with stochastic time-delays. Int. J. Gen. Syst. 2016, 45, 633–647. [Google Scholar] [CrossRef] [Green Version]
  12. Wang, J.-L.; Wu, H.-N.; Guo, L. Stability analysis of reaction–diffusion Cohen–Grossberg neural networks under impulsive control. Neurocomputing 2013, 106, 21–30. [Google Scholar] [CrossRef]
  13. Wen, S.; Zeng, Z.; Chen, M.Z.Q.; Huang, T. Synchronization of Switched Neural Networks With Communication Delays via the Event-Triggered Control. IEEE Trans. Neural Networks Learn. Syst. 2017, 28, 2334–2343. [Google Scholar] [CrossRef] [PubMed]
  14. Li, K.; Su, H.; Chu, J. Forecasting building energy consumption using neural networks and hybrid neuro-fuzzy system: A comparative study. Energy Build. 2011, 43, 2893–2899. [Google Scholar] [CrossRef]
  15. Panapakidis, I.P. Application of hybrid computational intelligence models in short-term bus load forecasting. Expert Syst. Appl. 2016, 54, 105–120. [Google Scholar] [CrossRef]
Figure 1. This figure depicts regression through employment of artificial neural networks. (a) Describing simple linear regression for predicting a single variable (b) Estimating more than one variable through a greater number of hidden layers and complex variables.
Engproc 12 00029 g001
Figure 2. This graph shows the half-hourly load curve of the unsorted data obtained from the meter with high nonlinearity.
Engproc 12 00029 g002
Figure 3. Daily power outages from unsorted data.
Engproc 12 00029 g003
Figure 4. 48-H Target load curve for regression and ANN from sorted data.
Engproc 12 00029 g004
Figure 5. This figure shows final forecasted results with reference to the targeted load curve. (a) Describing MLR and its performance during power outages (b) Specified ANN result compared with target targeted output.
Engproc 12 00029 g005
Table 1. Data arrangement for ANN input.
Arrangement of Data
Day/timePeak Load(kW) of Hours of DaysForecast
48 Days 48 × 1 matrixData from Meter 48 × 24 matrix48 H 48 × 1 matrix
Publisher’s Note: MDPI stays neutral with regard to jurisdictional claims in published maps and institutional affiliations.