The Effect of Sodium Dodecyl Sulfate (SDS) and Cetyltrimethylammonium Bromide (CTAB) on the Properties of ZnO Synthesized by Hydrothermal Method

Abstract
:1. Introduction
2. Results and Discussion
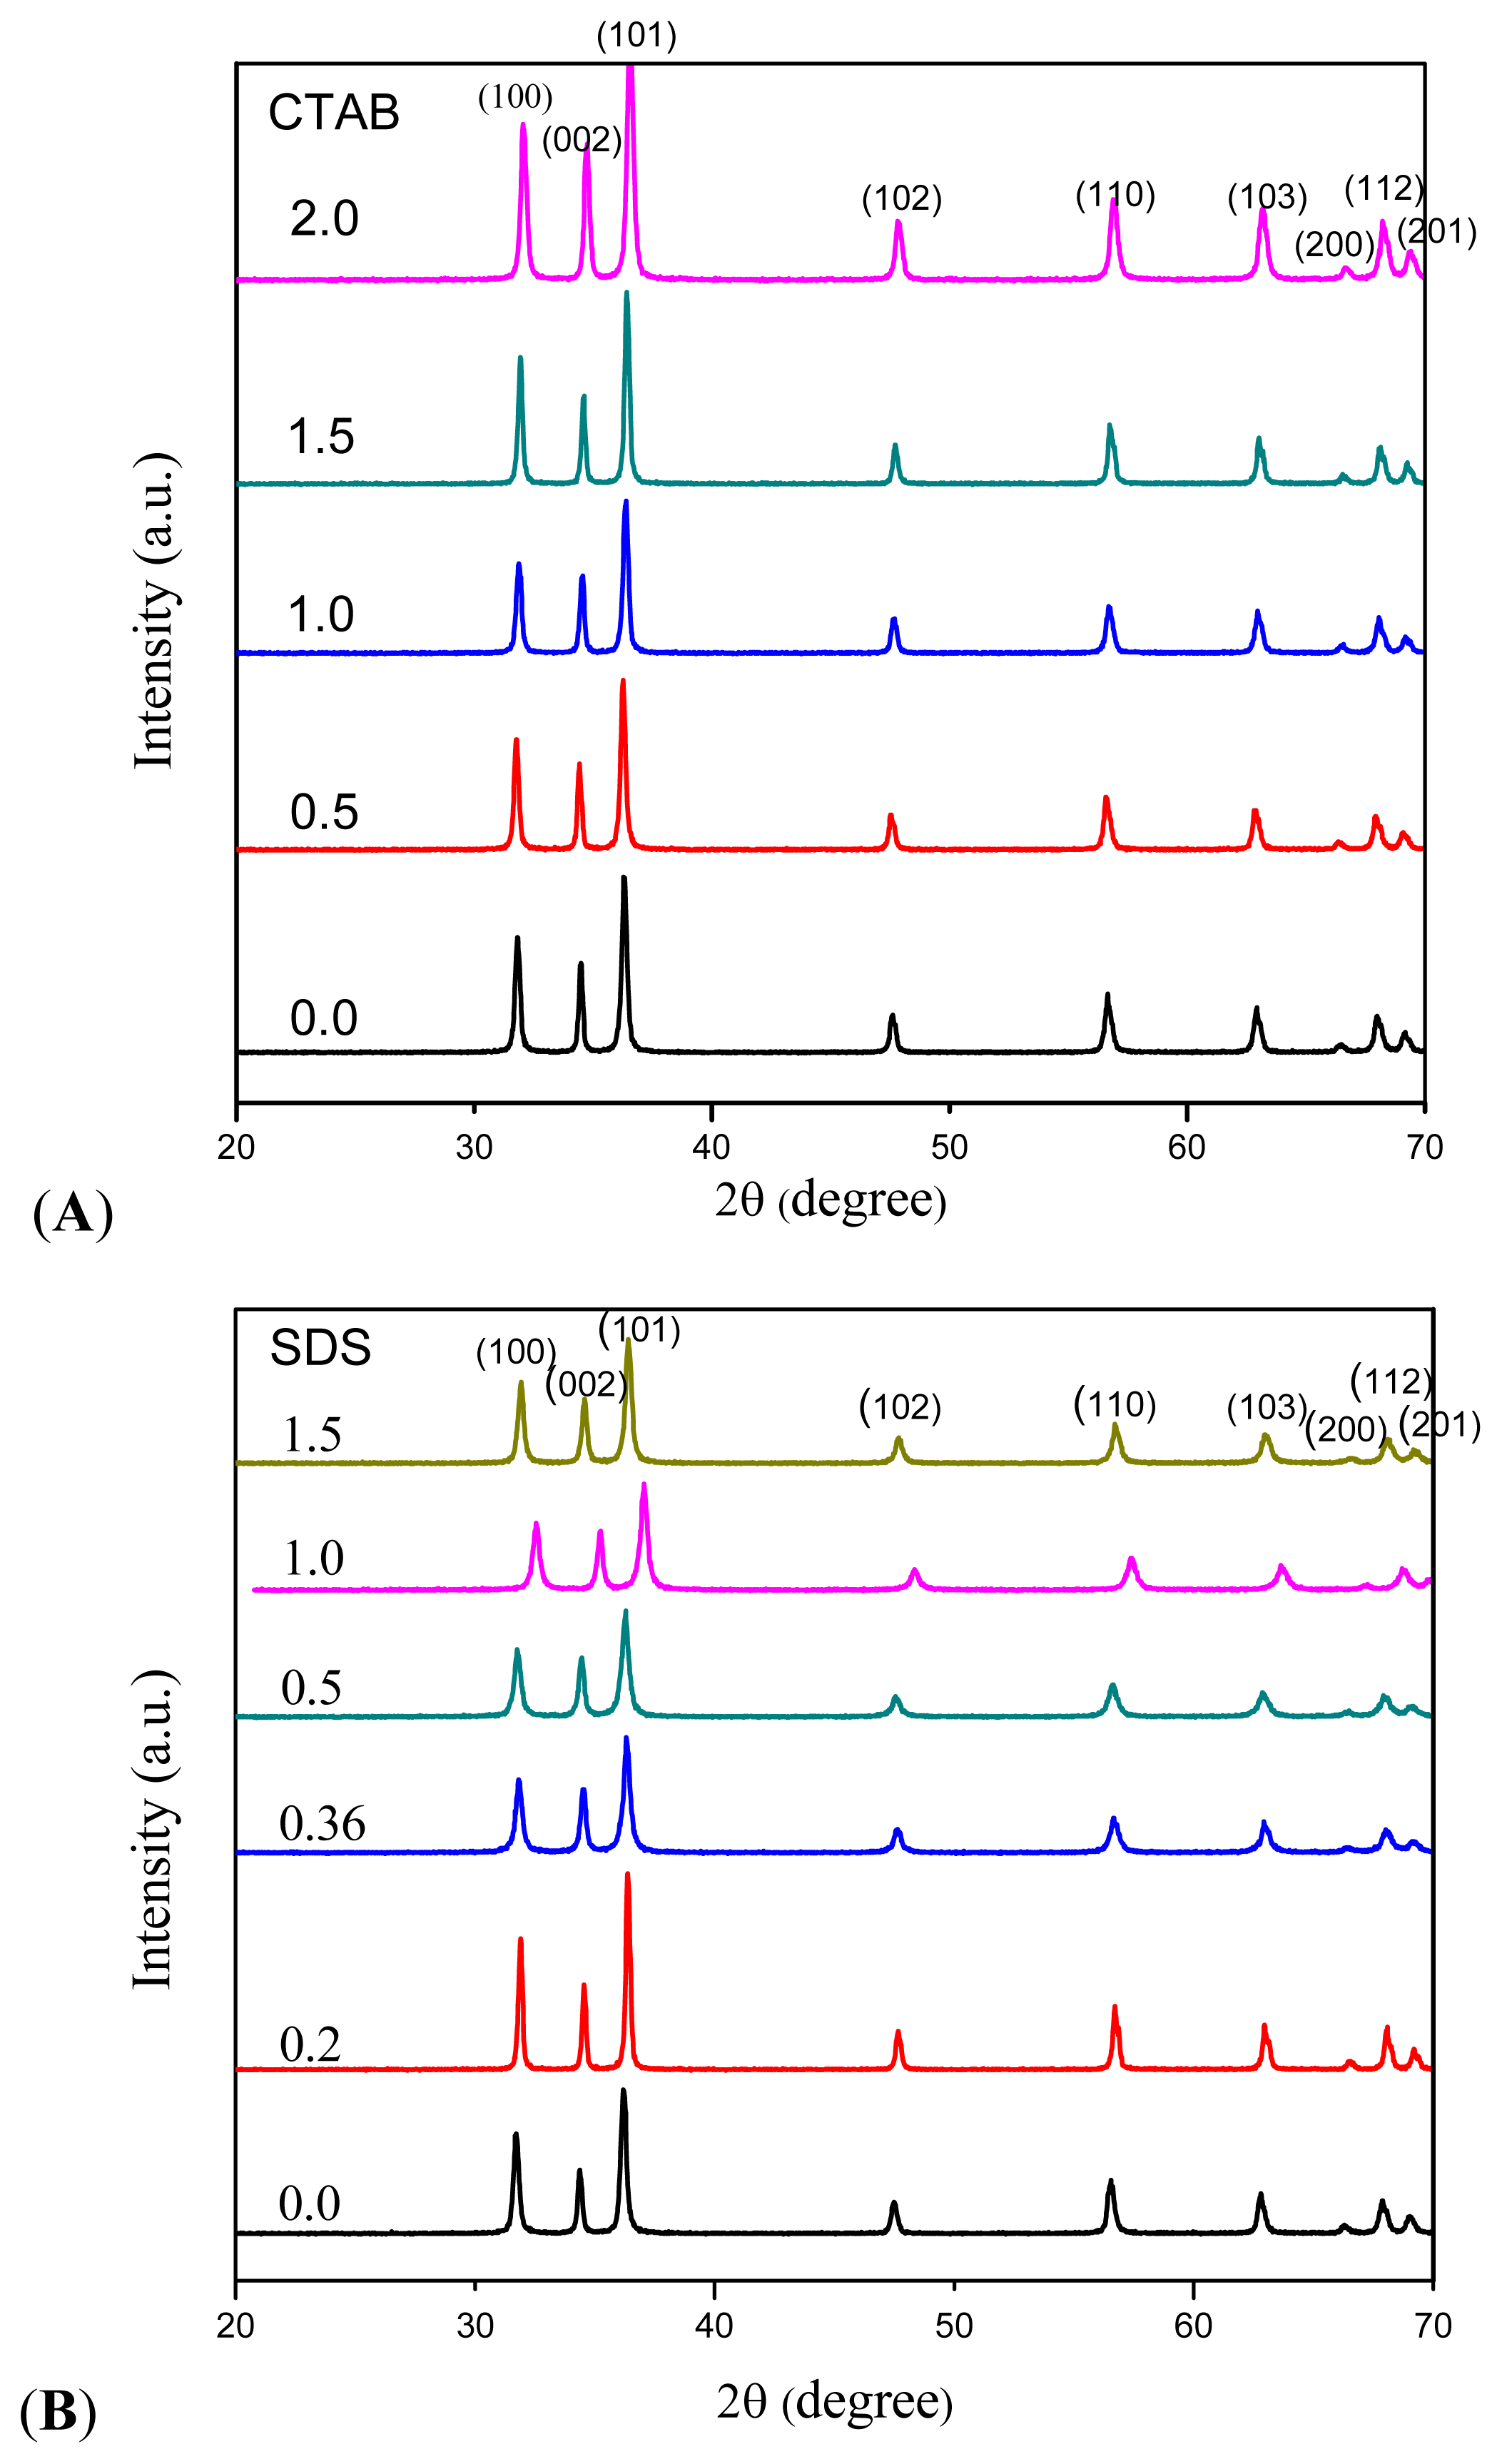
2.1. XRD Analysis
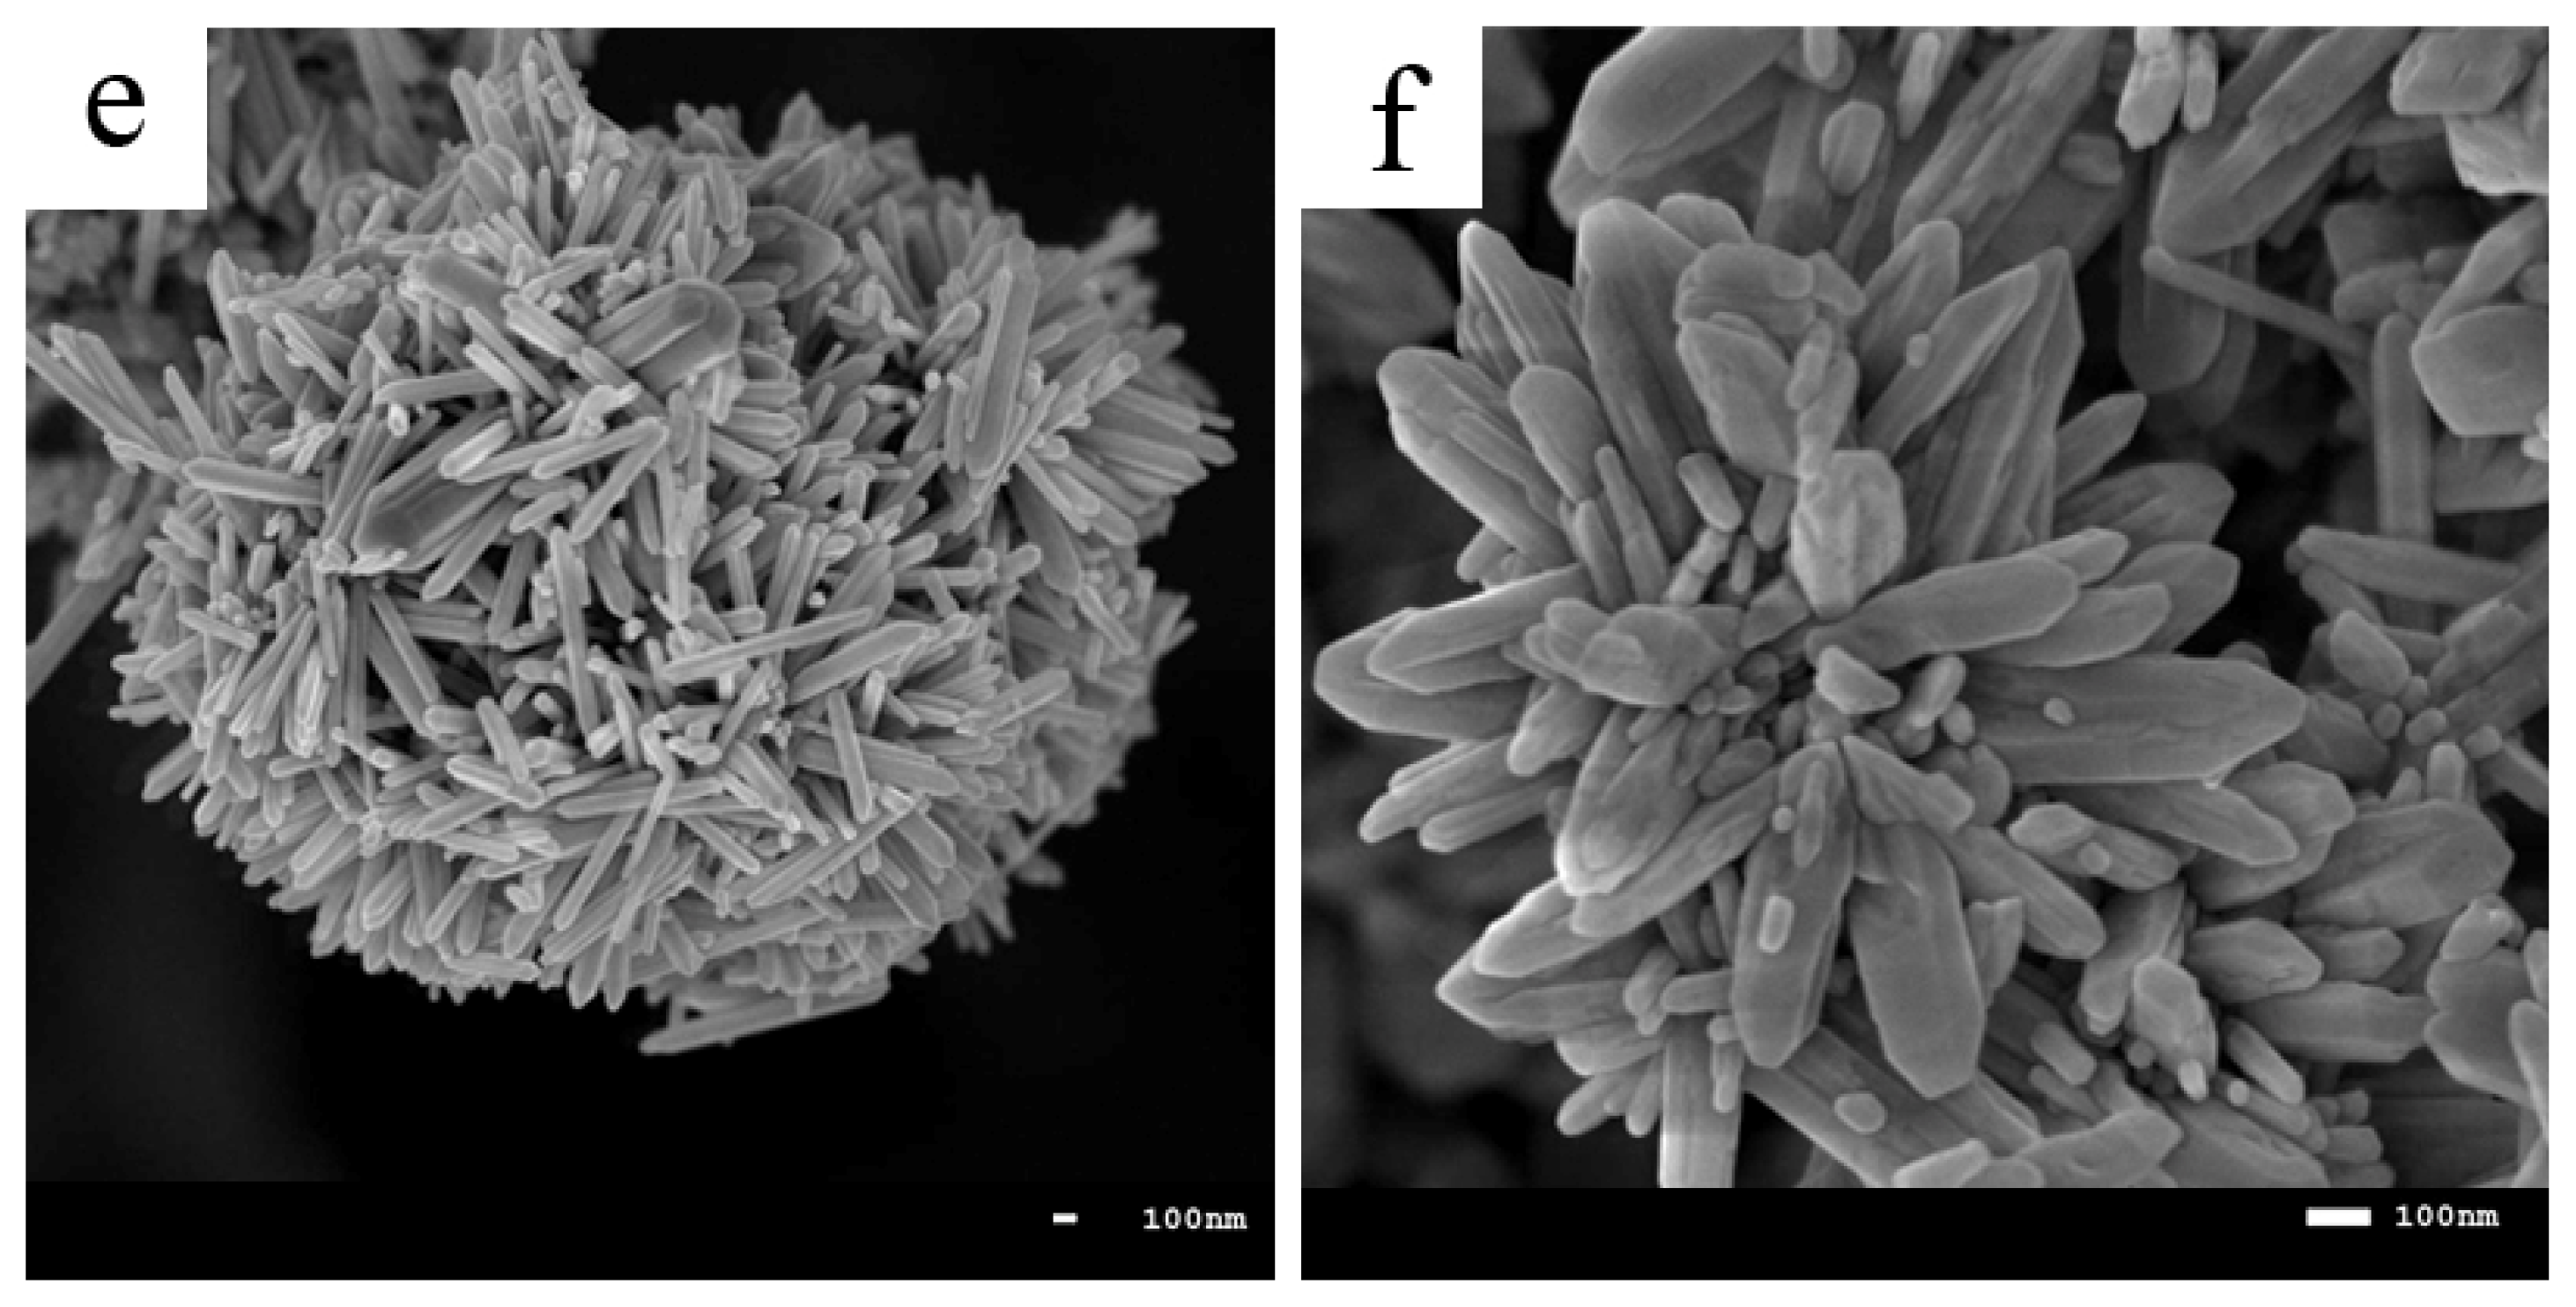
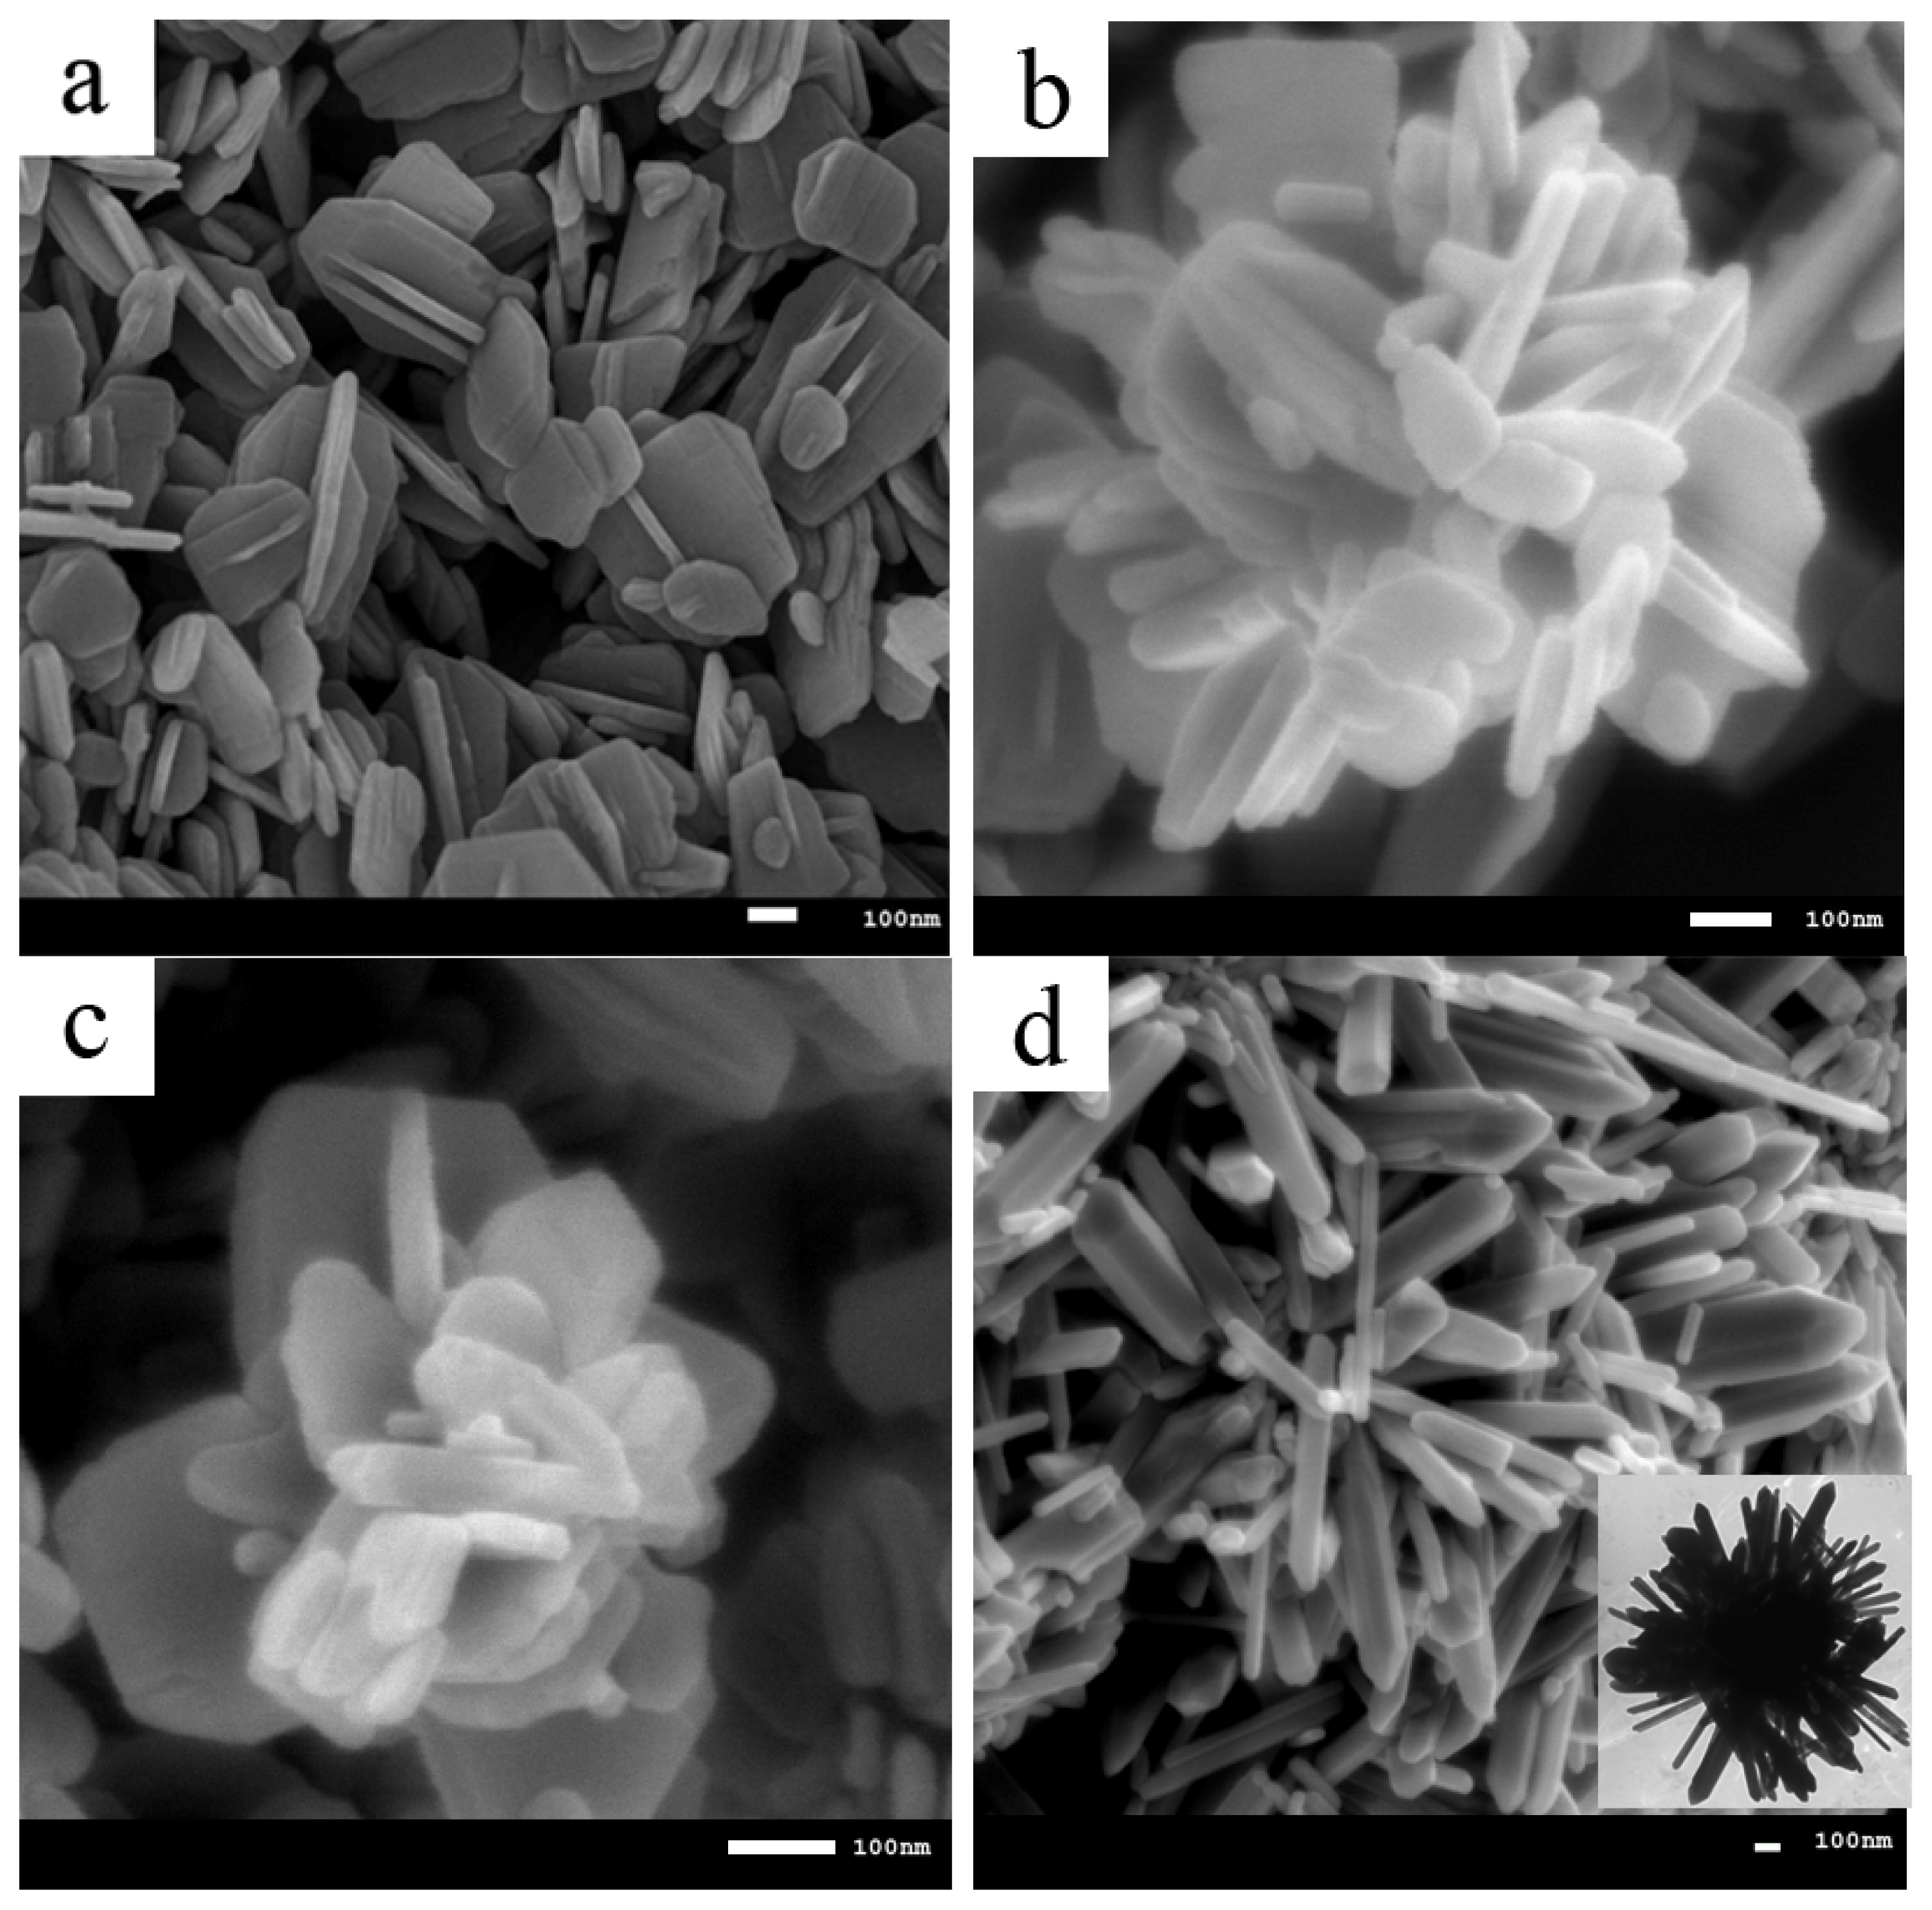
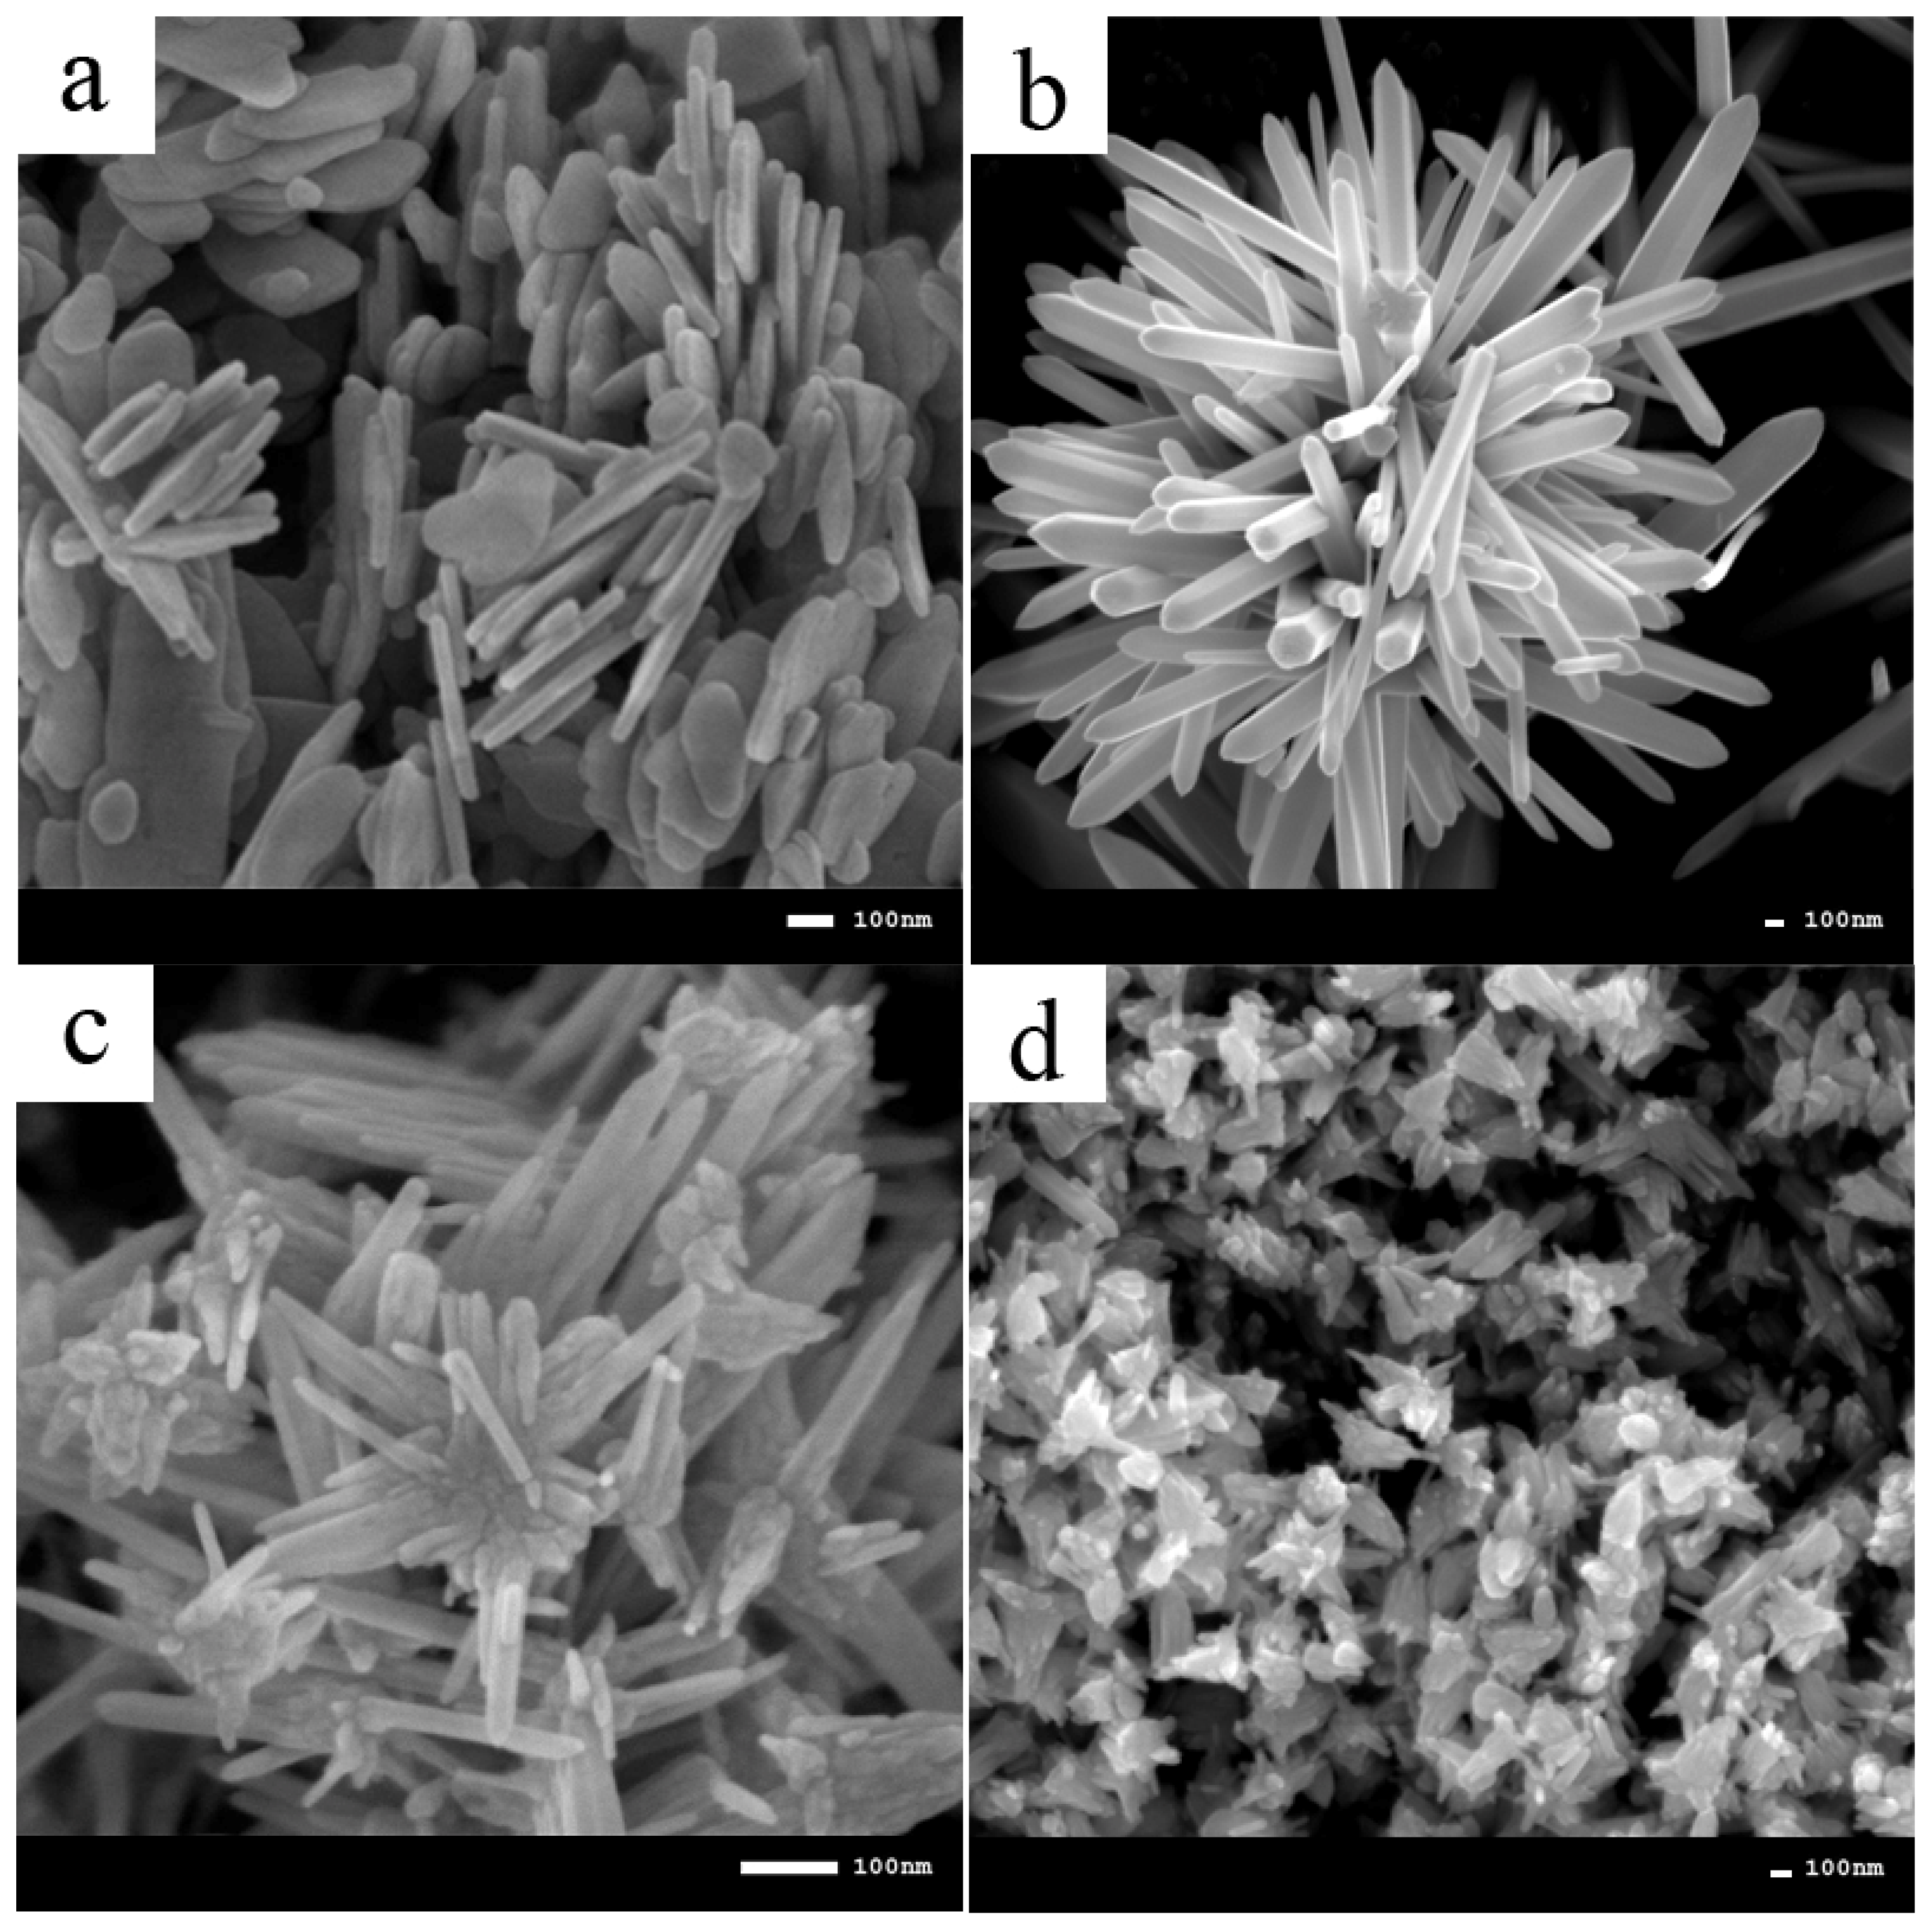
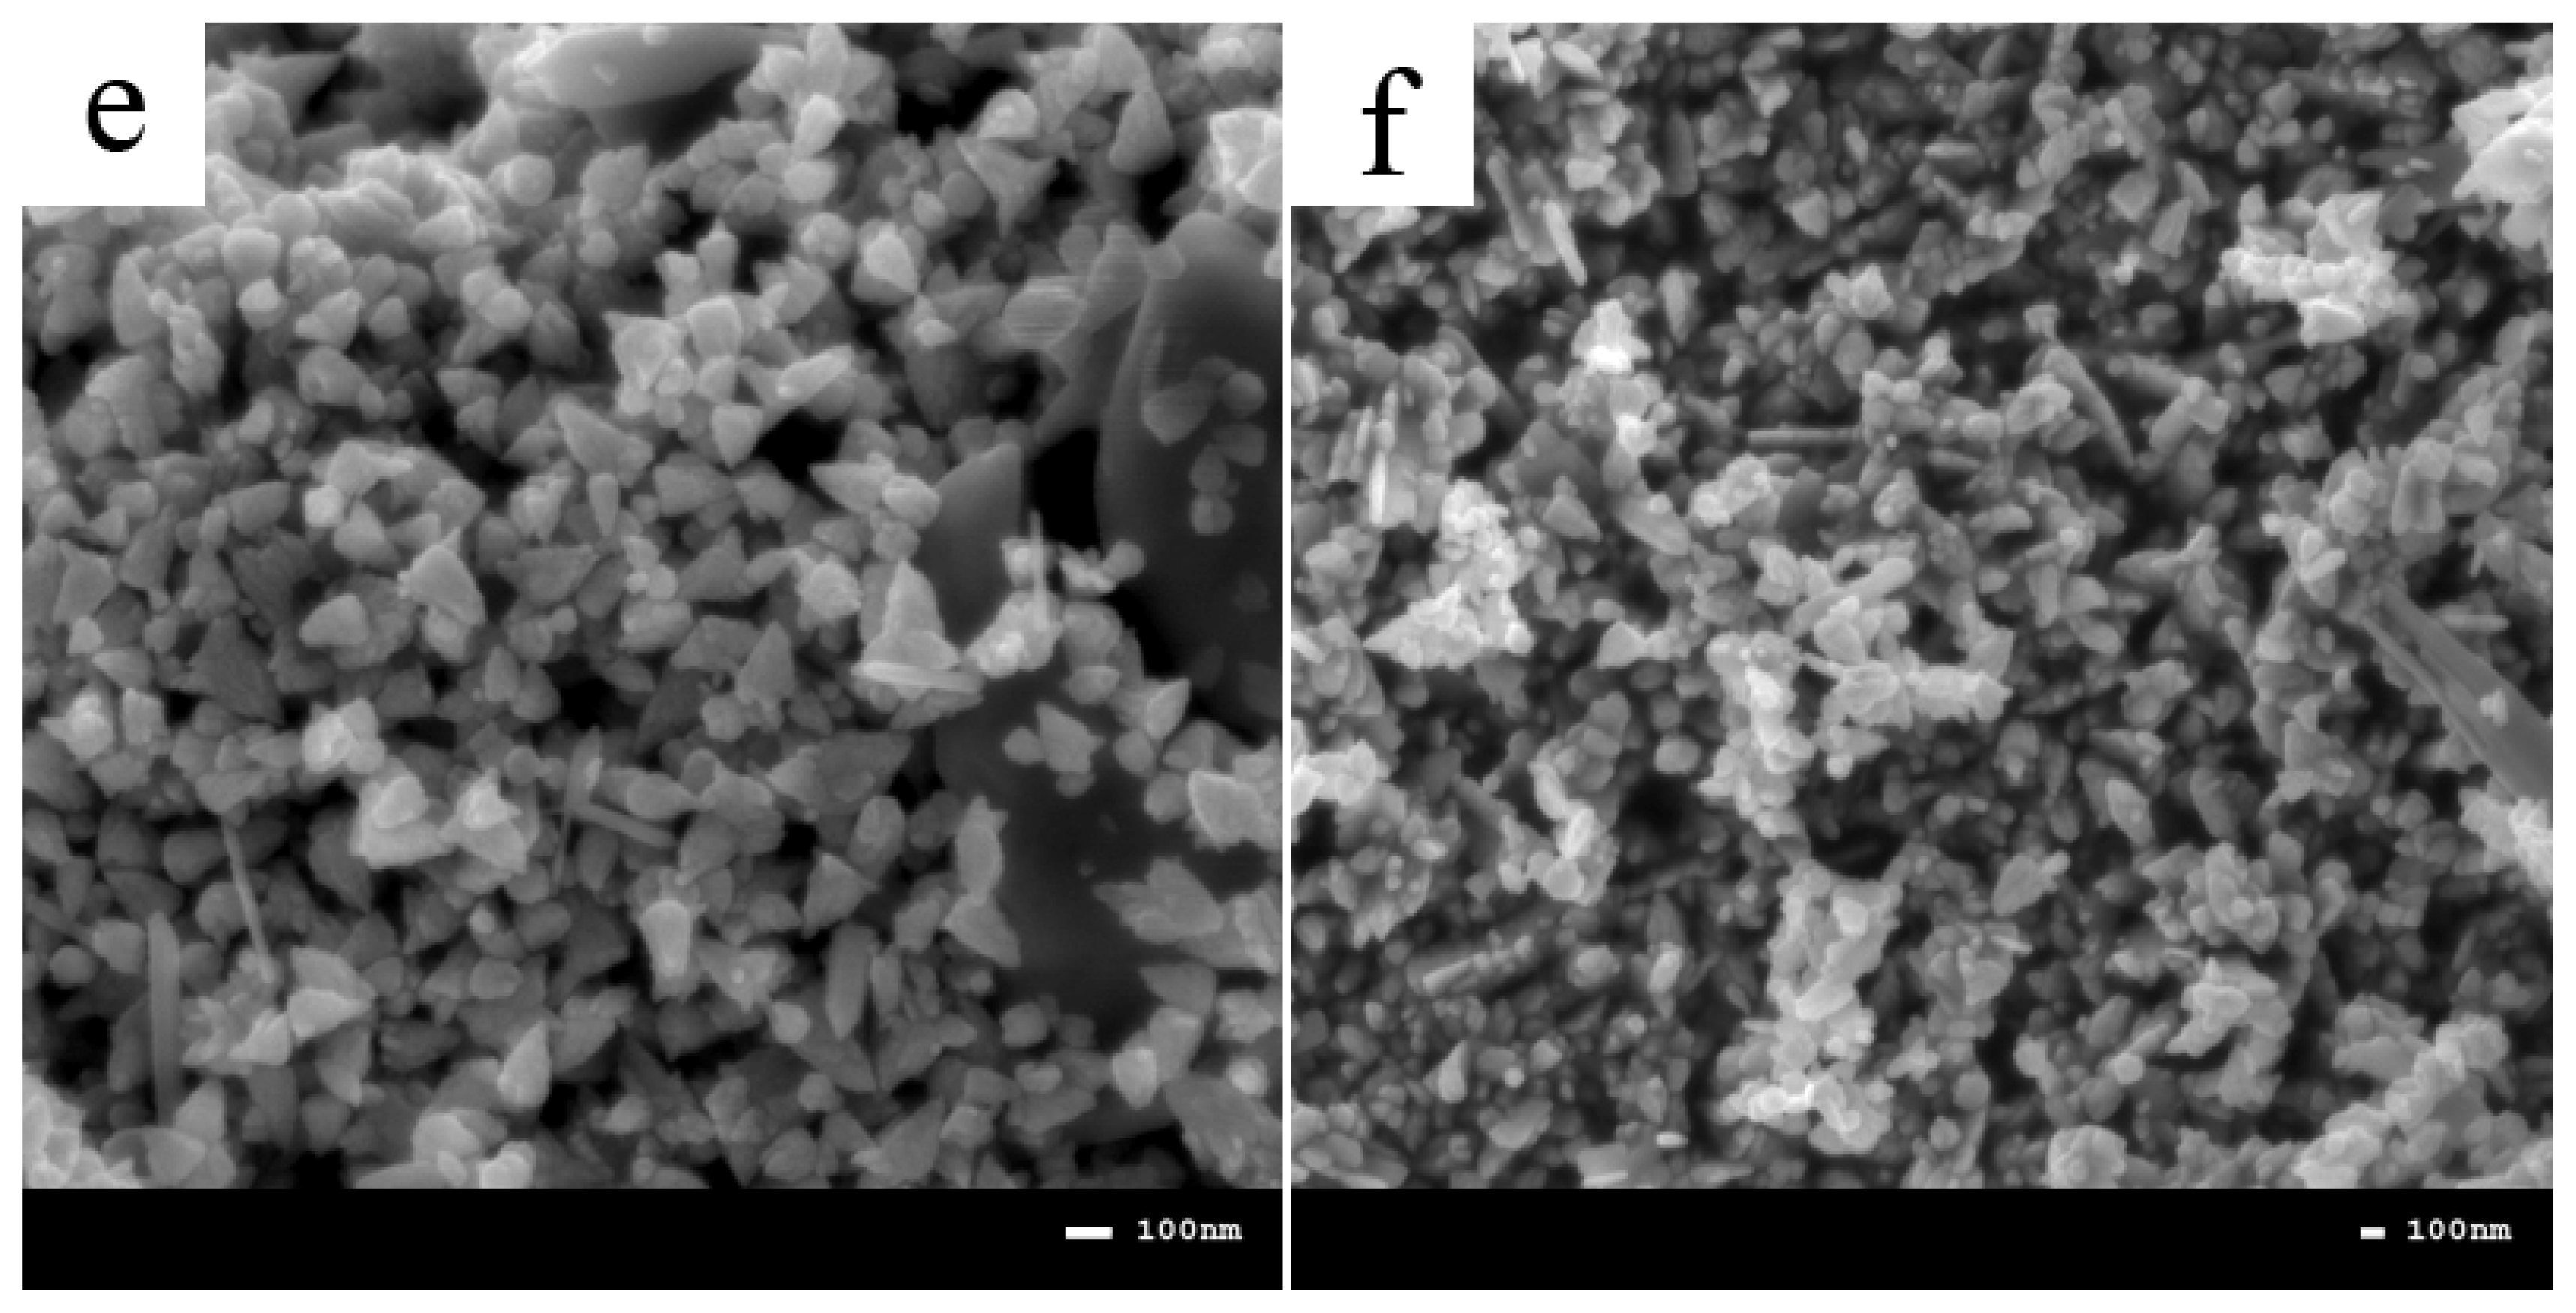
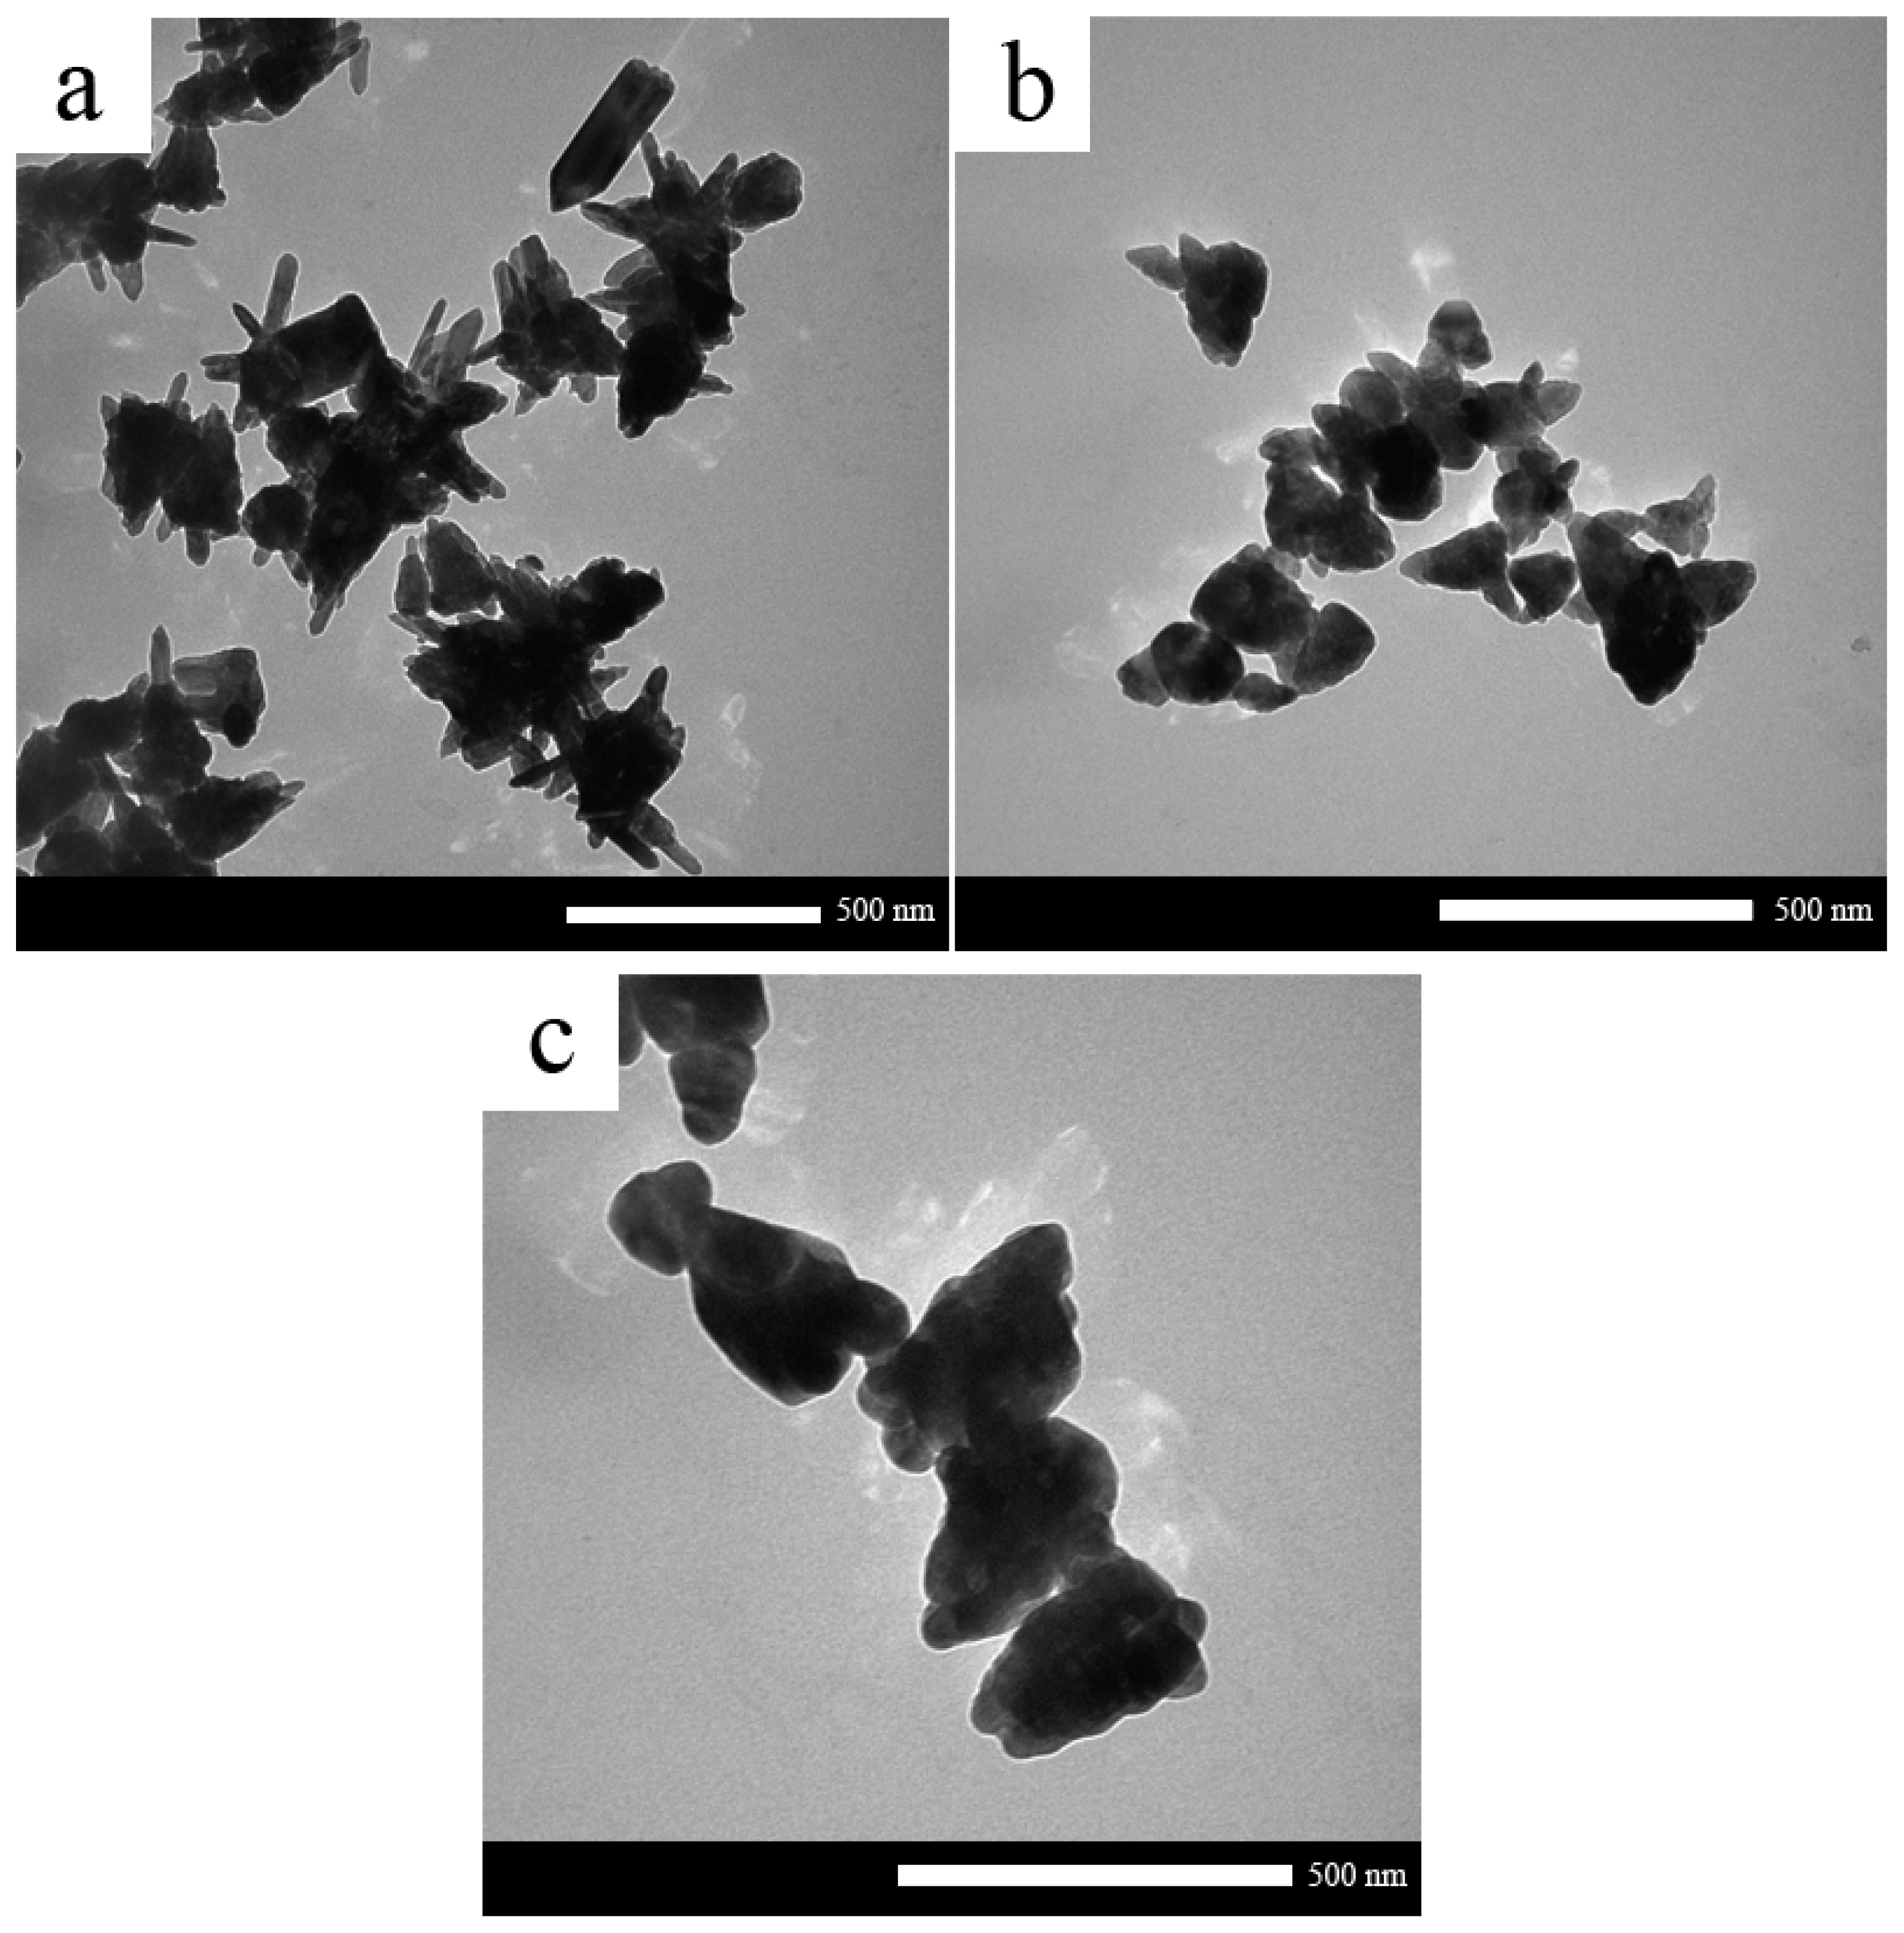
2.2. Morphology
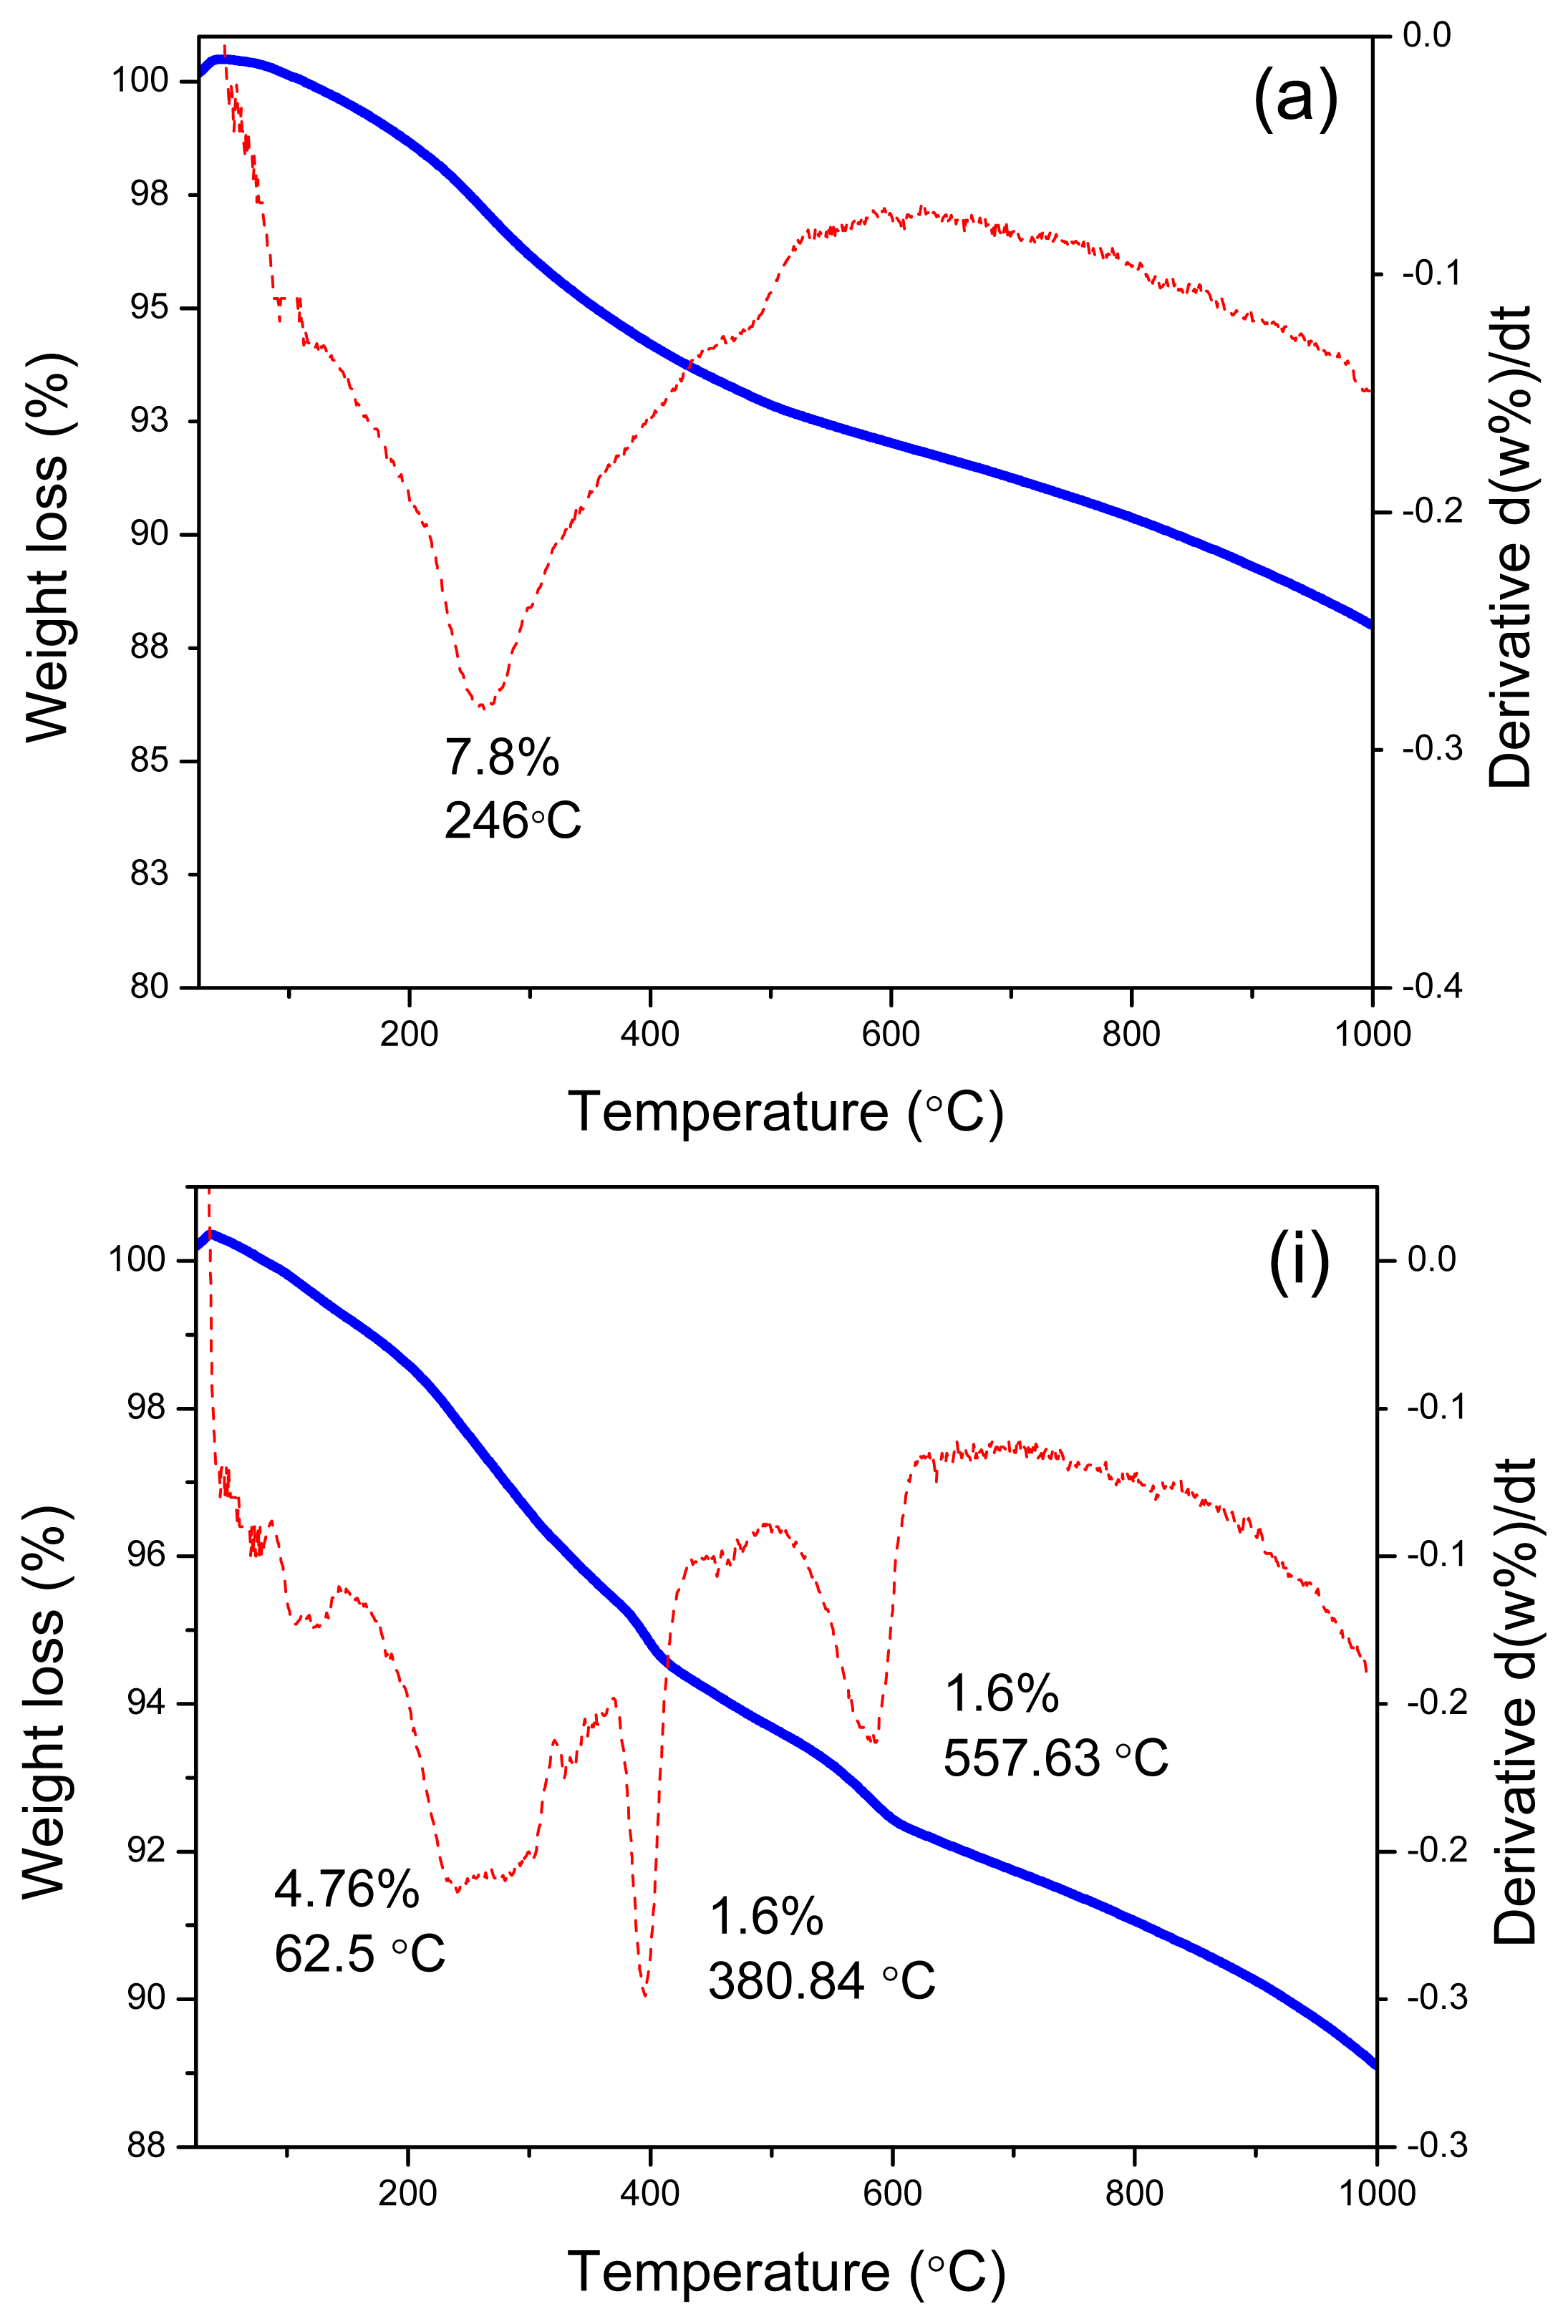
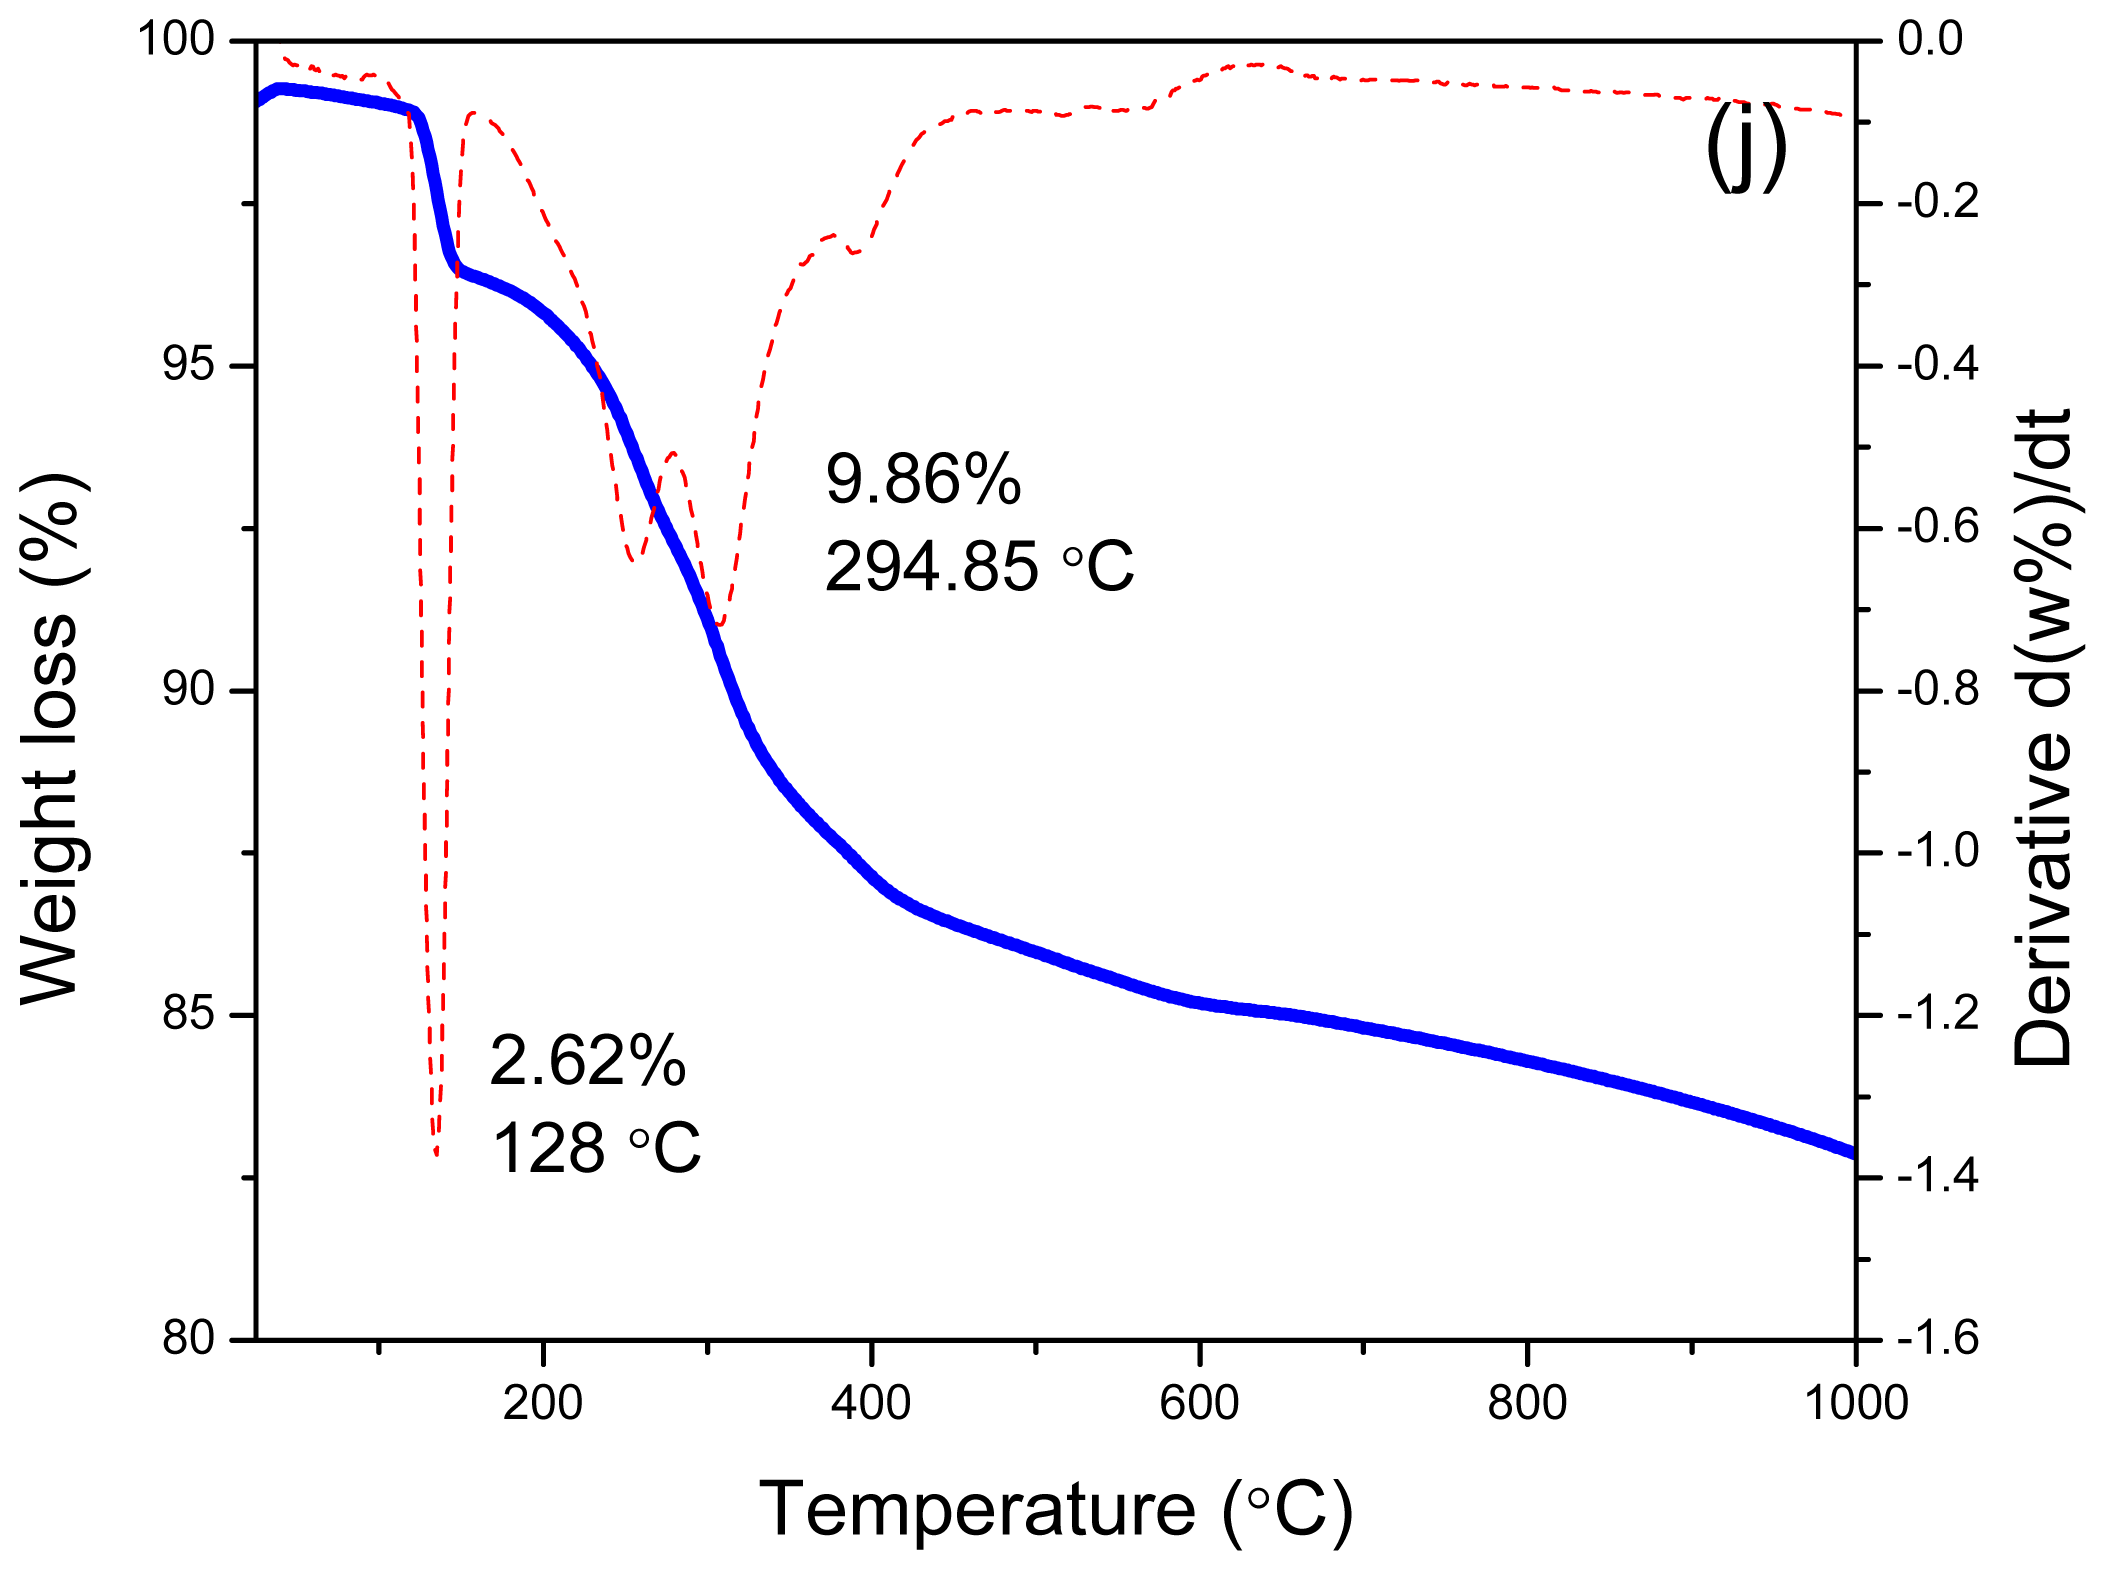
2.3. Thermal Analysis
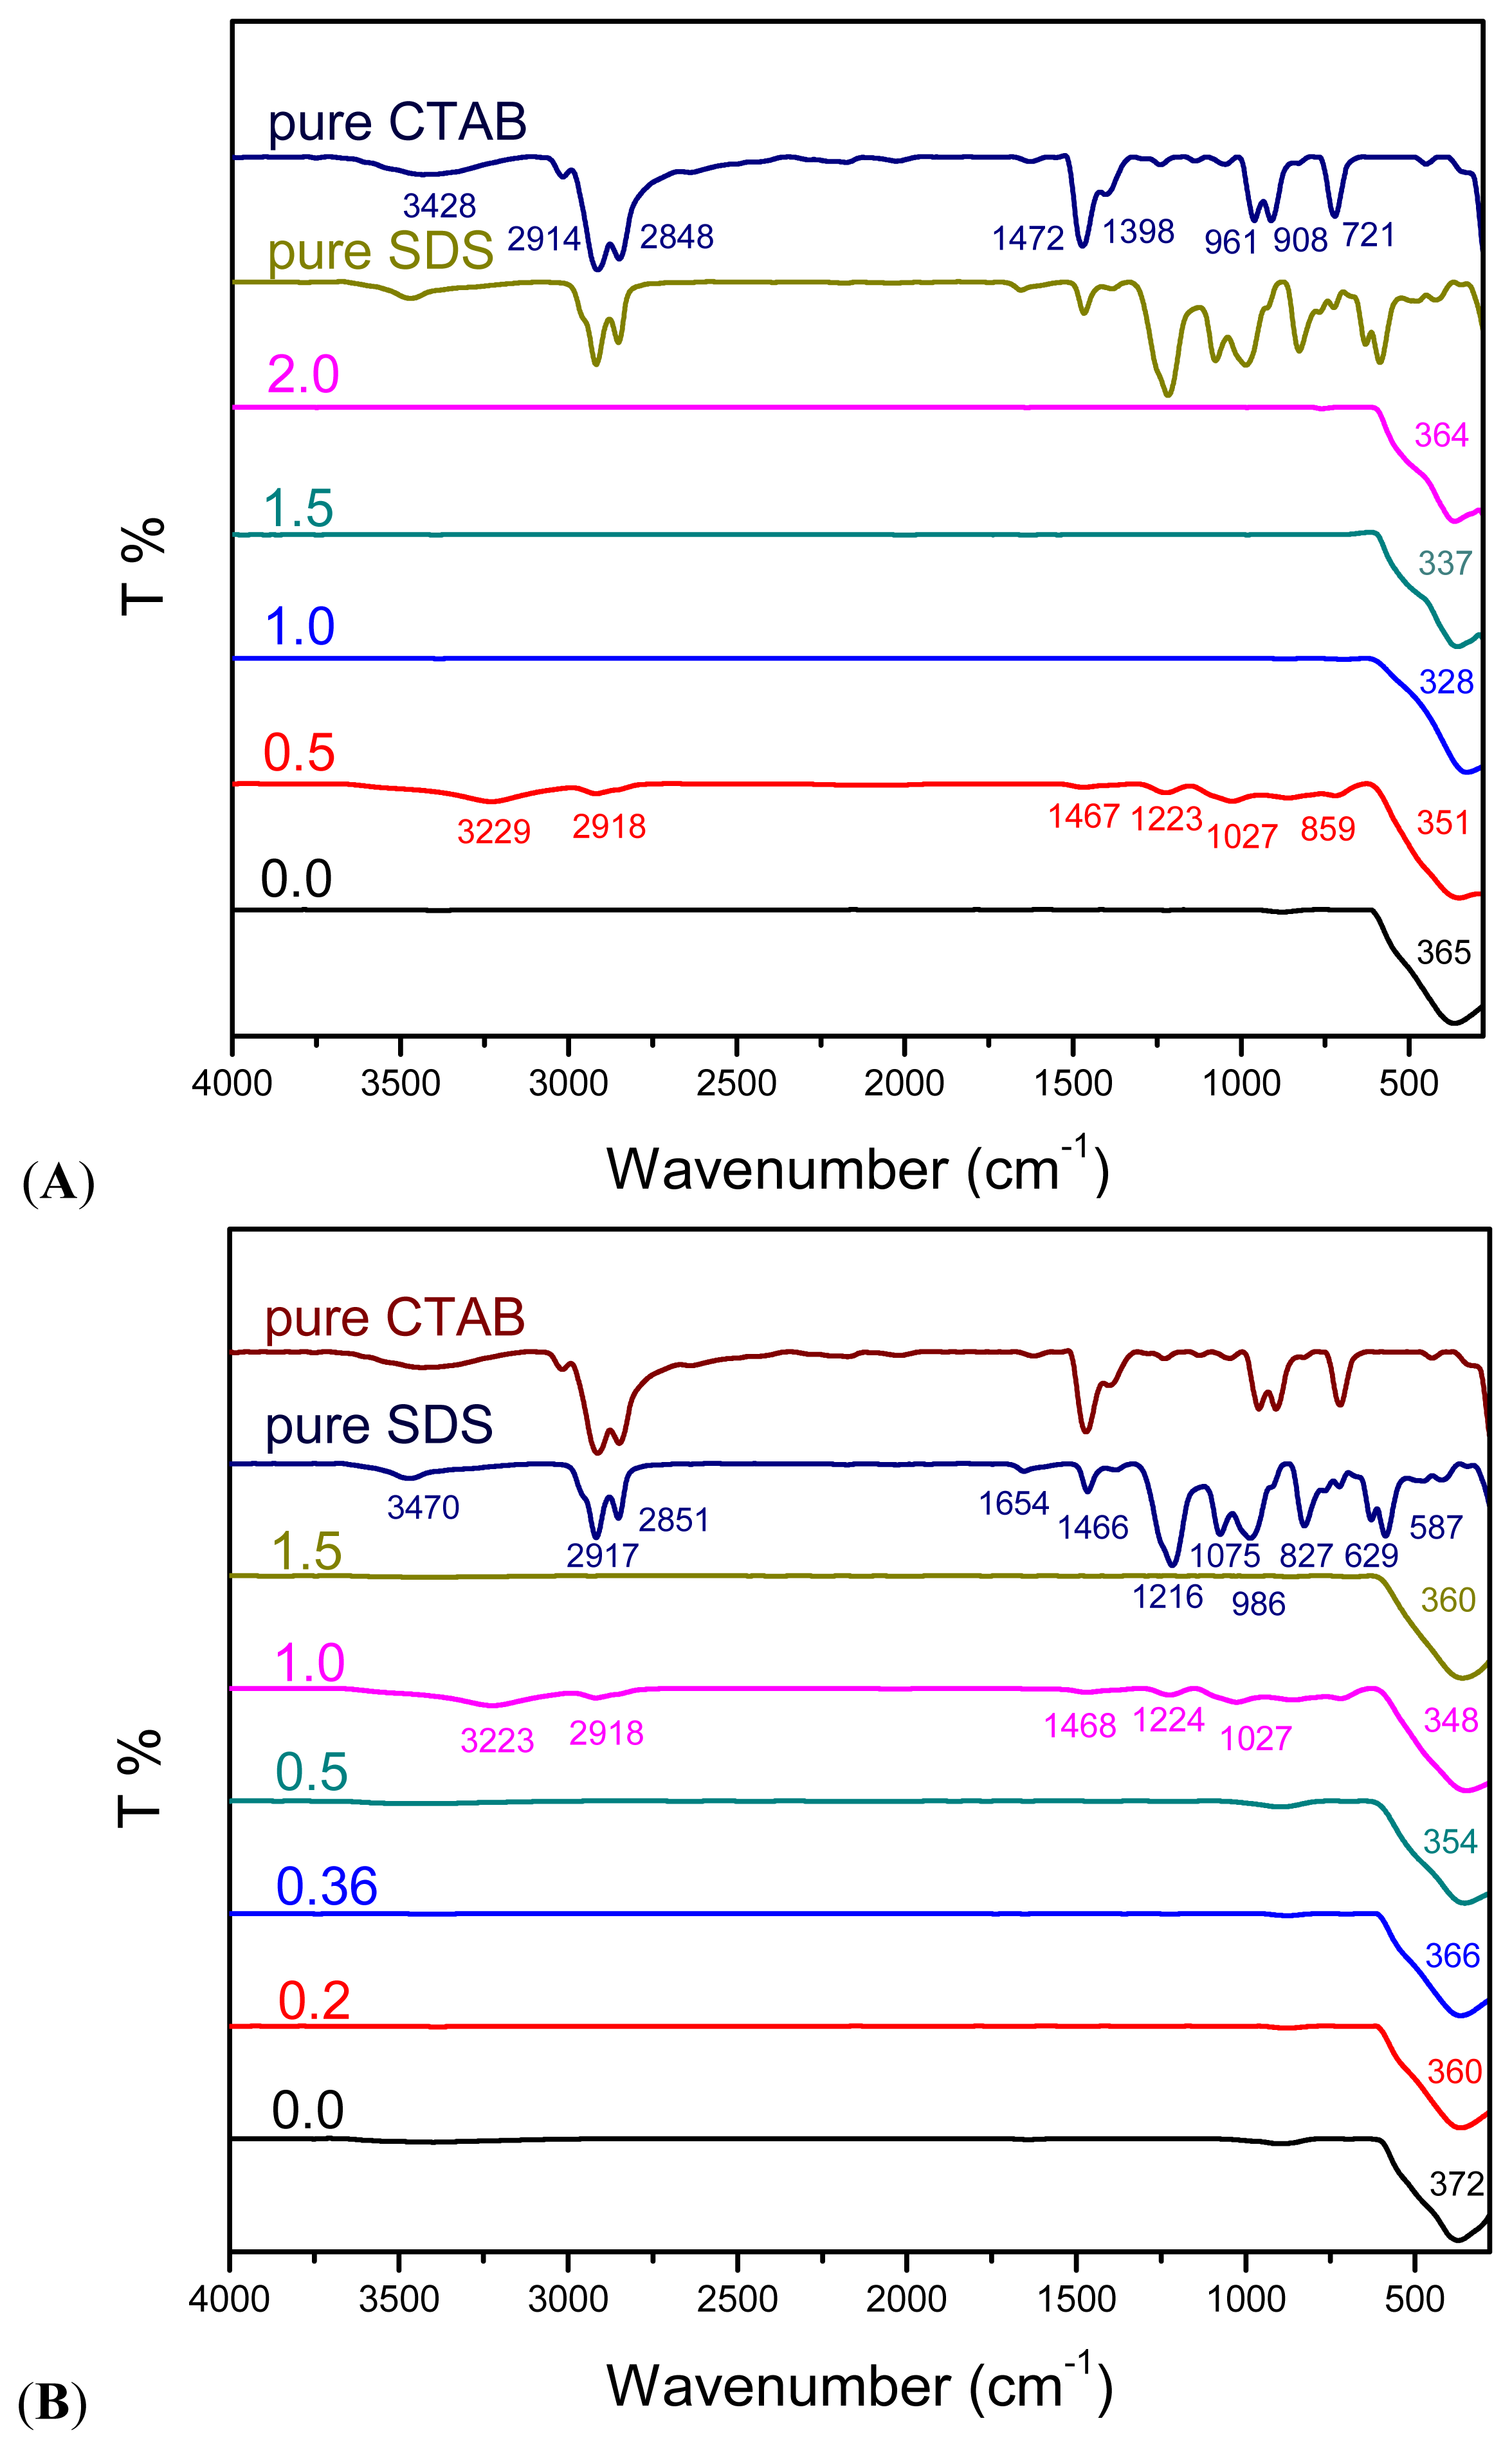
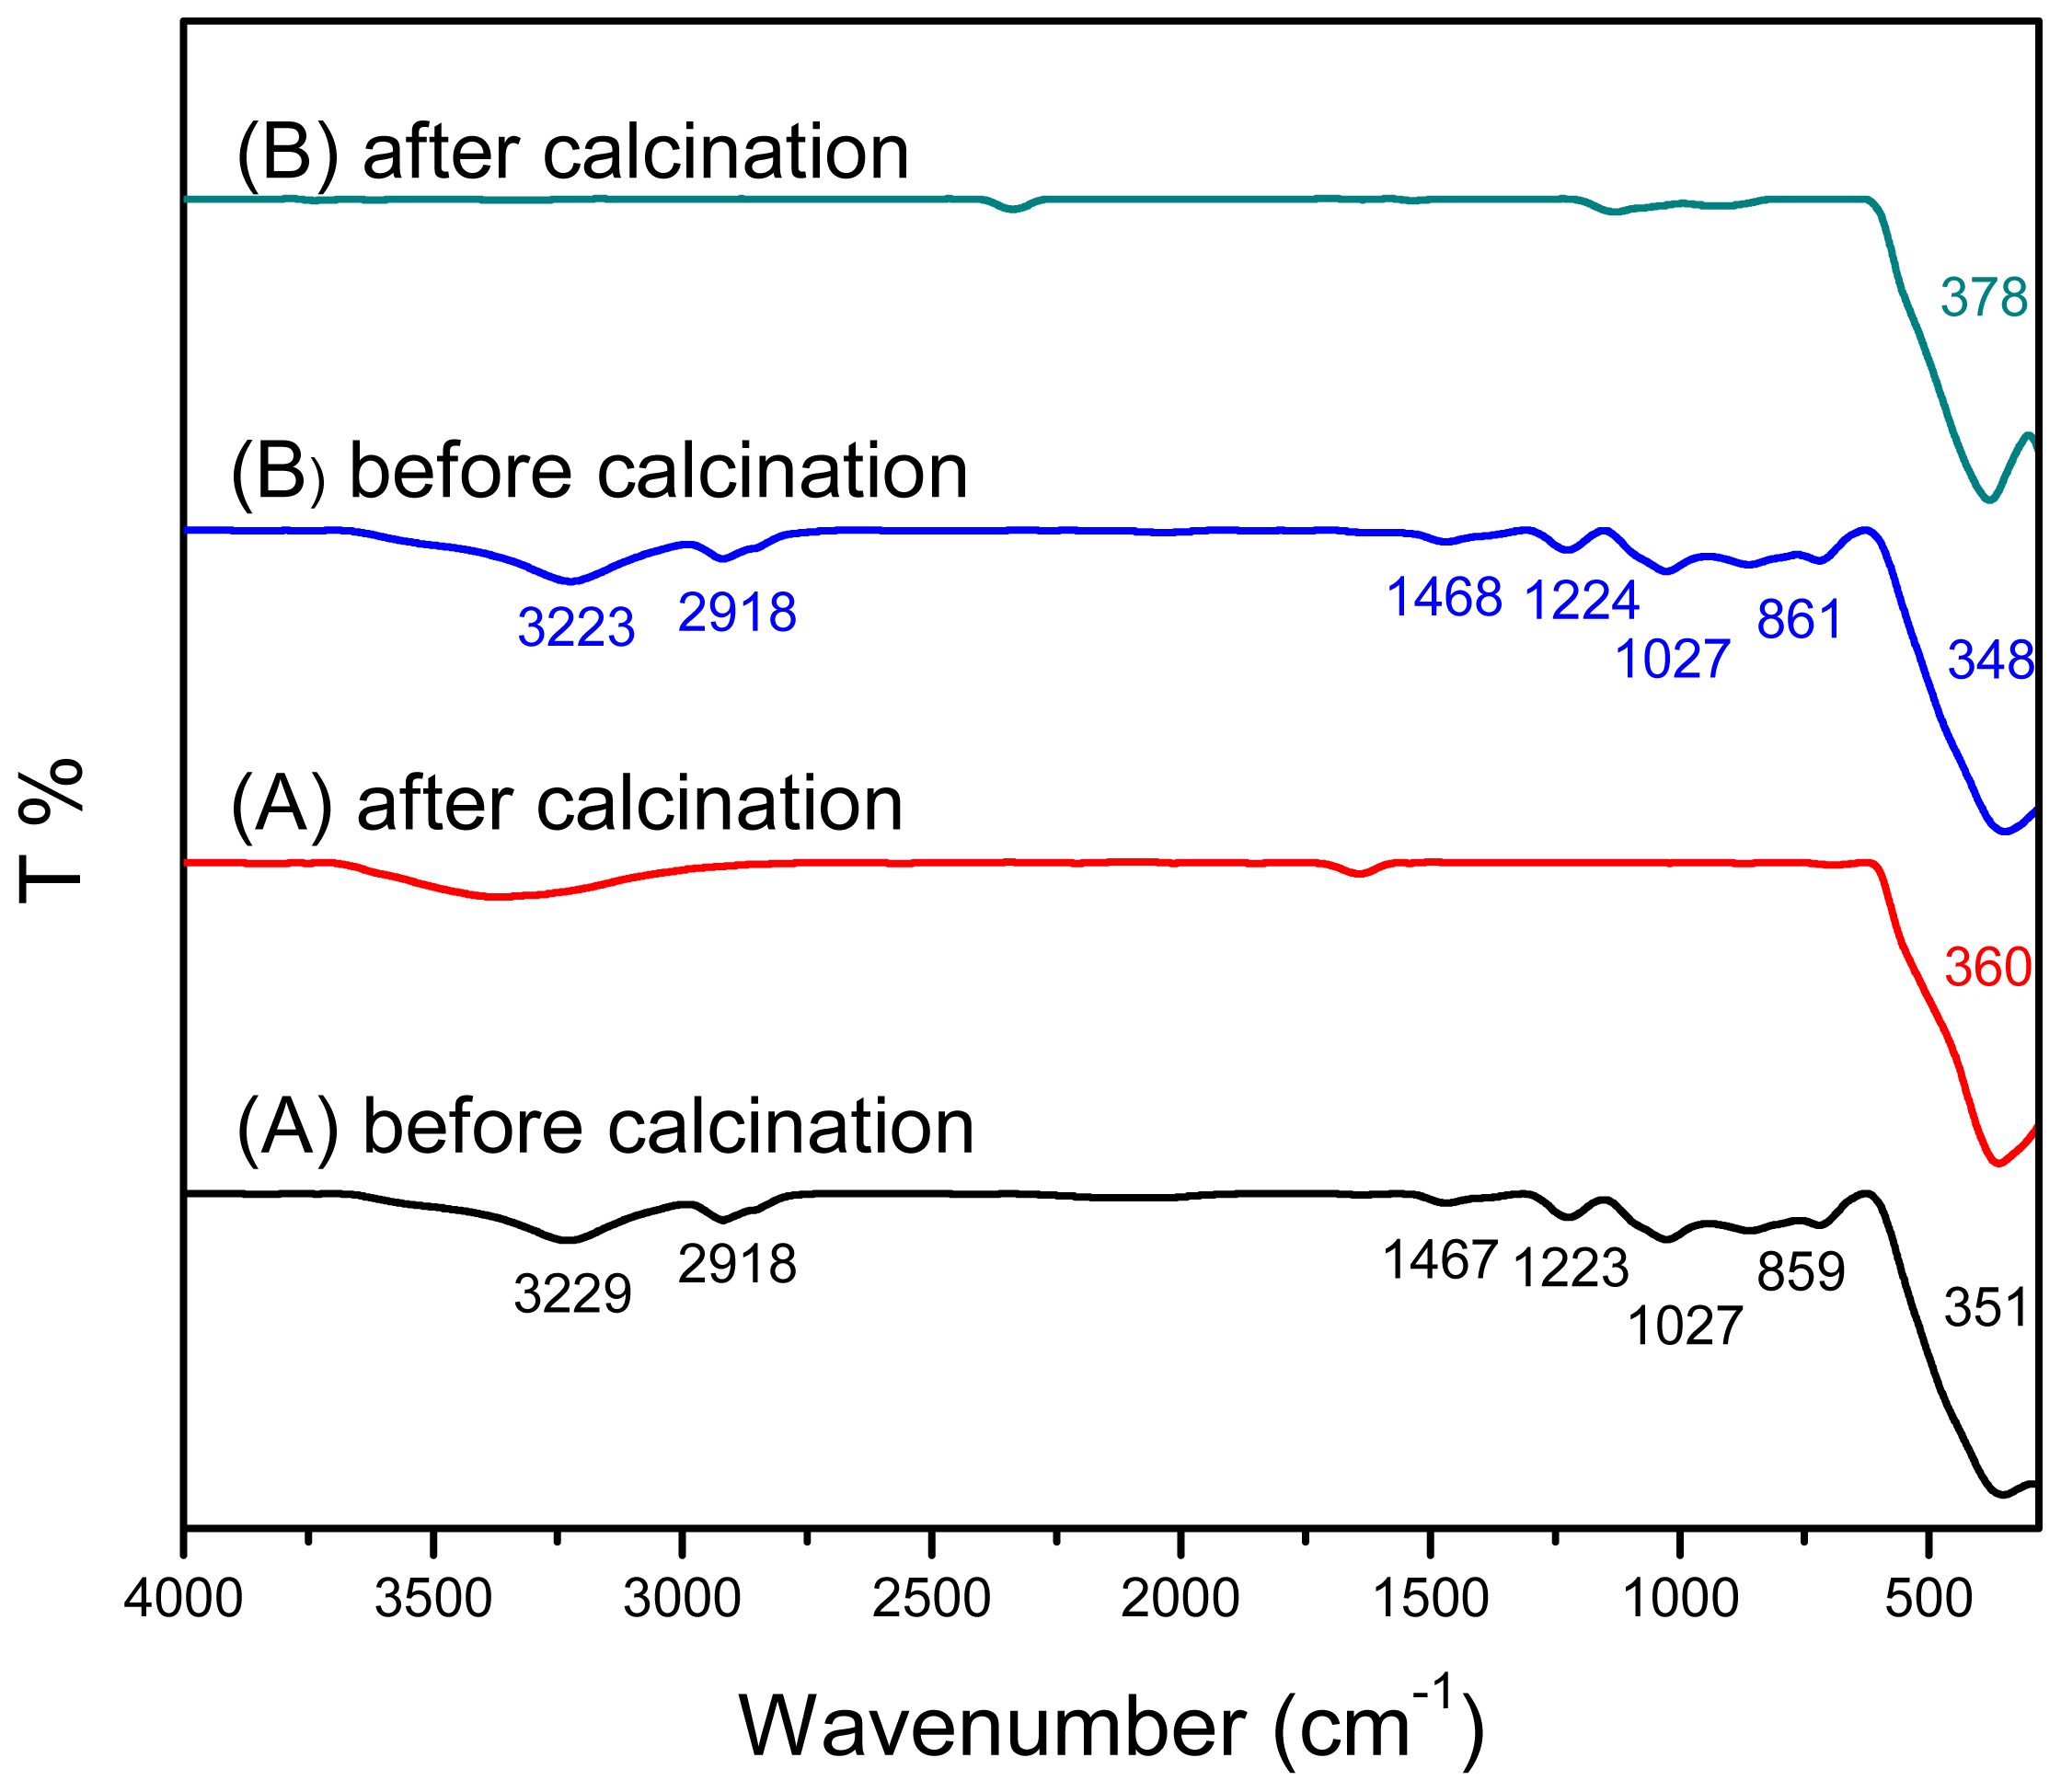
2.4. FTIR Spectroscopy
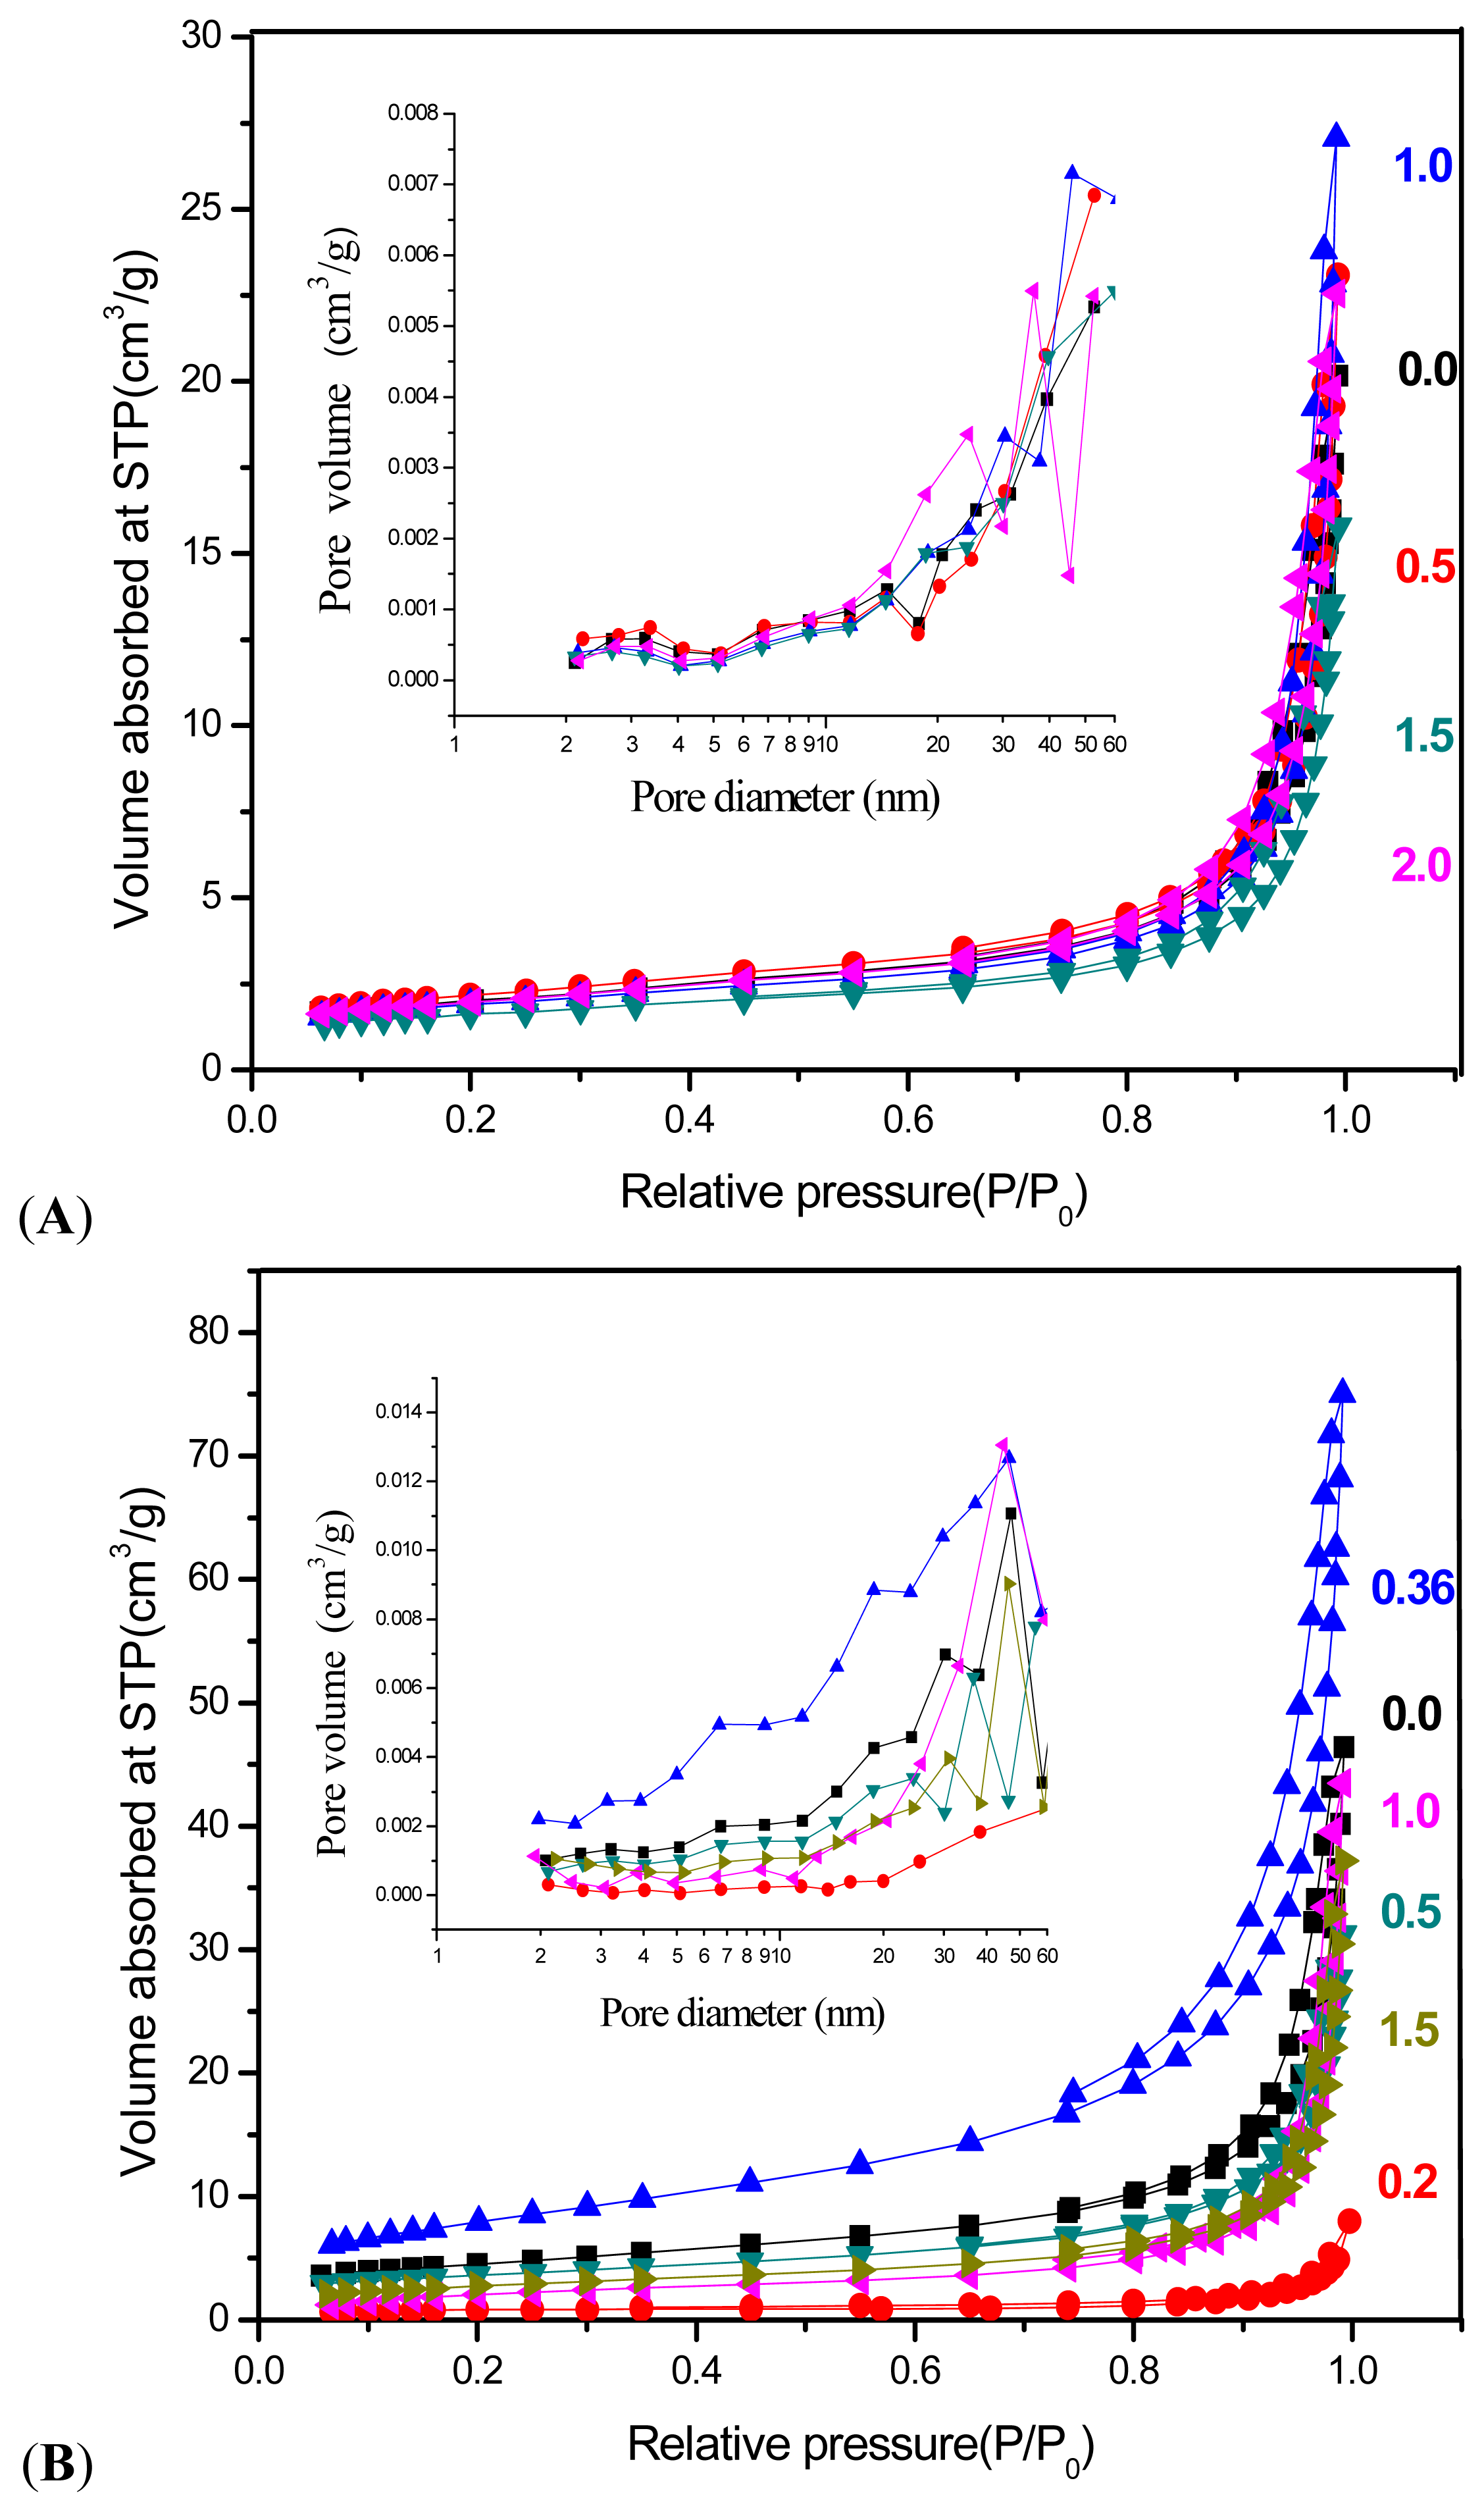
2.5. Surface Properties
3. Experimental Procedures
3.1. Reagent
3.2. Hydrothermal Growth
3.2.1. Synthesis of ZnO Using CTAB (Constant) and SDS (Variant)
3.2.2. Synthesis of ZnO Using SDS (Constant) and CTAB (Variant)
3.3. Characterization
4. Conclusions
Supplementary Materials
ijms-13-13275-s001.pdfAcknowledgements
References
- Vayssieres, L.; Keis, K.; Hagfeldt, A.; Lindquist, S. Three-dimensional array of highly oriented crystalline ZnO microtubes. Communications 2001, 13, 52–55. [Google Scholar]
- Kind, H.; Yan, H.; Messer, B.; Law, M.; Yang, P. Nanowire ultraviolet photodetectors and Optical switches. Adv. Mater 2002, 14, 158–160. [Google Scholar]
- Yang, J.L.; An, S.J.; Park, W.I.; Yi, G.-C.; Choi, W. Photocatalysis using ZnO thin films and nanoneedles grown by metal-organic chemical vapor deposition. Adv. Mater 2004, 16, 1661–1664. [Google Scholar]
- Qurashi, A.; Tabet, N.; Faiz, M.; Yamzaki, T. Ultra-fast microwave synthesis of ZnO nanowires and their dynamic response toward hydrogen gas. Nanoscale Res. Lett 2009, 4, 948–954. [Google Scholar]
- McBride, R.A.; Kelly, J.M.; McCormack, D.E. Growth of well-defined ZnO microparticles by hydroxide ion hydrolysis of zinc salts. J. Mater. Chem 2003, 13, 1196–1201. [Google Scholar]
- Li, Q.; Kumar, V.; Li, Y.; Zhang, H.; Marks, T.J.; Chang, R.P.H. Fabrication of ZnO nanorods and nanotubes in aqueous solutions. Chem. Mater 2005, 5, 1001–1006. [Google Scholar]
- Wang, W.Z.; Zeng, B.Q.; Yang, J.; Poudel, B.; Huang, J.Y.; Naughton, M.J.; Ren, Z.F. Aligned ultralong ZnO nanobelts and their enhanced field emission. Adv. Mater 2006, 18, 3275–3278. [Google Scholar]
- Krishnakumar, T.; Jayaprakash, R.; Pinna, N.; Singh, V.N.; Mehta, B.R.; Phani, A.R. Microwave-assisted synthesis and characterization of flower shaped zinc oxide nanostructures. Mater. Lett 2008, 63, 242–245. [Google Scholar]
- Tabet, N.; Al Ghashani, R.; Achour, S. Ultra fast synthesis of zinc oxide nanostructures by microwaves. Superlattice Microst 2009, 45, 598–603. [Google Scholar]
- Samaele, N.; Amornpitoksuk, P.; Suwanboon, S. Effect of pH on the morphology and optical properties of modified ZnO particles by SDS via a precipitation method. Powder Technol 2010, 203, 243–247. [Google Scholar]
- Kulkarni, S.B.; Patil, U.M.; Salunkhe, R.R.; Joshi, S.S.; Lokhande, C.D. Temperature impact on morphological evolution of ZnO and its consequent effect on physico-chemical properties. J. Alloys Compd 2011, 509, 3486–3492. [Google Scholar]
- Sun, G.; Cao, M.; Wang, Y.; Hu, C.; Liu, Y.; Ren, L.; Pu, Z. Anionic surfactant-assisted hydrothermal synthesis of high-aspect-ratio ZnO nanowires and their photoluminescence property. Mater. Lett 2006, 60, 2777–2782. [Google Scholar]
- Zhao, M.; Wu, D.; Chang, J.; Bai, Z.; Jiang, K. Synthesis of cup-like ZnO microcrystals via a CTAB-assisted hydrothermal route. Mater. Chem. Phys 2009, 117, 422–424. [Google Scholar]
- Feng, Y.; Zhang, M.; Guo, M.; Wang, X. Studies on the PEG-assisted hydrothermal synthesis and growth mechanism of ZnO microrod and mesoporous microsphere arrays on the substrate. Cryst. Growth Des 2010, 10, 1500–1507. [Google Scholar]
- Lim, Z.H.; Chia, Z.X.; Kevin, M.; Wong, A.S.W.; Ho, G.W. A facile approach towards ZnO nanorods conductive textile for room temperature multifunctional sensors. Sens. Actuators B: Chem 2010, 151, 121–126. [Google Scholar]
- Kevin, M.; Fou, Y.H.; Wong, A.S.W.; Ho, G.W. A novel maskless approach towards aligned, density modulated and multi-junction ZnO nanowires for enhanced surface area and light trapping solar cells. Nanotechnology 2010, 21, 315602. [Google Scholar]
- Choi, K.-S.; Lichtenegger, H.C.; Stucky, G.D.; McFarland, E.W. Electrochemical synthesis of nanostructured ZnO films utilizing self-assembly of surfactant molecules at solid-liquid interfaces. J. Am. Chem. Soc 2002, 124, 12402–12403. [Google Scholar]
- Tan, Y.; Steinmiller, E.M.P.; Choi, K.-S. Electrochemical tailoring of lamellar-structured ZnO films by interfacial surfactant templating. Langmuir 2005, 21, 9618–9624. [Google Scholar]
- Usui, H. The effect of surfactants on the morphology and optical properties of precipitated wurtzite ZnO. Mater. Lett 2009, 63, 1489–1492. [Google Scholar]
- Lv, S.; Wang, C.; Zhou, T.; Jing, S.; Wu, Y.; Zhao, C. In situ synthesis of ZnO nanostructures on a zinc substrate assisted with mixed cationic/anionic surfactants. J. Alloys Compd 2009, 477, 364–369. [Google Scholar]
- Ni, Y.; Wu, G.; Zhang, X.; Cao, X.; Hu, G.; Tao, A.; Yang, Z.; Wei, X. Hydrothermal preparation, characterization and property research of flowerlike ZnO nanocrystals built up by nanoflakes. Mater. Res. Bull 2008, 43, 2919–2928. [Google Scholar]
- Maiti, U.N.; Nandy, S.; Karan, S.; Mallik, B.; Chattopadhyay, K.K. Enhanced optical and field emission properties of CTAB-assisted hydrothermal grown ZnO nanorods. Appl. Surf. Sci 2008, 254, 7266–7271. [Google Scholar]
- Steinmiller, E.M.P.; Choi, K.-S. Anodic construction of lamellar structured ZnO films using basic media via interfacial surfactant templating. Langmuir 2007, 23, 12710–12715. [Google Scholar]
- Poyraz, A.S.; Dag, O. Role of organic and inorganic additives on the assembly of CTAB-P123 and the morphology of mesoporous silica particles. J. Phys. Chem. C 2009, 113, 18596–18607. [Google Scholar]
- Wang, Y.D.; Zhang, S.; Ma, C.L.; Li, H.D. Synthesis and room temperature photoluminescence of ZnO/CTAB ordered layered nanocomposite with flake-like architecture. J. Lumin 2007, 126, 661–664. [Google Scholar]
- Denoyel, R.; Keene, M.T.J.; Llewellyn, P.L.; Rouquerol, J. Thermal methods in the synthesis of new ordered mesoporous adsorbents. J. Therm. Anal. Calorim 1999, 56, 261–266. [Google Scholar]
- Prasad, V.; D’Souza, C.; Yadav, D.; Shaikh, A.J.; Vigneshwaran, N. Spectroscopic characterization of zinc oxide nanorods synthesized by solid-state reaction. Spectrochim Acta A 2006, 65, 173–178. [Google Scholar]
- Drmosh, Q.A.; Gondal, M.A.; Yamani, Z.H.; Saleh, T.A. Spectroscopic characterization approach to study surfactants effect on ZnO2 nanoparticles synthesis by laser ablation process. Appl. Surf. Sci 2010, 256, 4661–4666. [Google Scholar]
- Al-Gaashani, R.; Radiman, S.; Tabet, N.; Daud, A.R. Effect of microwave power on the morphology and optical property of zinc oxide nano-structures prepared via a microwave-assisted aqueous solution method. Mater. Chem. Phys 2011, 125, 846–852. [Google Scholar]
- Wu, L.; Wu, Y.; Lü, W. Preparation of ZnO Nanorods and optical characterizations. Phys. E 2005, 28, 76–82. [Google Scholar]
- Xiong, G.; Luo, L.; Li, C.; Yang, X. Synthesis of mesoporous ZnO (m-ZnO) and catalytic performance of the Pd/m-ZnO catalyst for methanol steam reforming. Energy Fuels 2009, 23, 1342–1346. [Google Scholar]
- Hussein, M.Z.; Al Ali, S.H.; Zainal, Z.; Hakim, M.N. Development of antiproliferative nanohybrid compound with controlled release property using ellagic acid as the active agent. Int. J. Nanomed 2011, 6, 1373–1383. [Google Scholar]
- Hu, J.-S.; Ren, L.-L.; Guo, Y.-G.; Liang, H.-P.; Cao, A.-M.; Wan, L.-J.; Bai, C.-L. Mass production and high photocatalytic activity of ZnS nanoporous nanoparticles. Angew. Chem. Int. Edit 2005, 44, 1269–1273. [Google Scholar]
- Wurster, D.E.; Oh, E.; Wang, J.C.T. Determination of the mechanism for the decrease in zinc oxide surface area upon high-temperature drying. J. Pharm. Sci 1995, 84, 1301–1307. [Google Scholar]
- Zhou, X.; Hu, Z.; Fan, Y.; Chen, S.; Ding, W.; Xu, N. Microspheric organization of multilayered ZnO nanosheets with hierarchically porous structures. J. Phys. Chem. C 2008, 112, 11722–11728. [Google Scholar]


| A. CTAB | Weight loss | Total W.L. % | Residue % | ||
|---|---|---|---|---|---|
| onset | Offset | W.L. % | |||
| 0.0 | 34 | 502 | 7.8 | 7.8 | 92.6 |
| 0.5 | 65 | 443 | 3.2 | 3.5 | 96.6 |
| 444 * | 493 * | 0.3 * | |||
| 1.0 | 70 | 478 | 4.7 | 4.7 | 94.3 |
| 1.5 | 70 | 650 | 5.2 | 5.2 | 95.0 |
| 2.0 | 38 | 215 | 1.7 | 7.0 | 92.6 |
| 424 * | 948 * | 5.3 * | |||
| B. SDS | onset | Offset | W.L. % | Total W.L. % | Residue % |
| 0.0 | 35 | 456 | 5.3 | 5.3 | 93.5 |
| 0.2 | 31 | 455 | 5.6 | 5.6 | 94.8 |
| 0.36 | 247 | 934 | 2.2 | 2.2 | 99.0 |
| 0.5 | 30 | 349 | 4.8 | 8.0 | 92.2 |
| 355 * | 464 * | 1.6 * | |||
| 464 ** | 599 ** | 1.6 ** | |||
| 1.0 | 105 | 152 | 2.6 | 12.5 | 86.4 |
| 167 * | 437 * | 9.9 * | |||
| 1.5 | 79 | 592 | 5.6 | 5.6 | 94.6 |
| CTAB | BET surface area (m2/g) | BJH pore diameter (nm) | BJH pore volume (cm3/g) |
|---|---|---|---|
| 0.0 | 7 | 16.8 | 0.027 |
| 0.5 | 8 | 16.8 | 0.031 |
| 1.0 | 7 | 22.9 | 0.037 |
| 1.5 | 6 | 16.4 | 0.02 |
| 2.0 | 7 | 19.1 | 0.032 |
| SDS | BET surface area (m2/g) | BJH pore diameter (nm) | BJH pore volume (cm3/g) |
| 0.0 | 16 | 16.1 | 0.067 |
| 0.2 | 3 | 15.0 | 0.007 |
| 0.36 | 29 | 13.1 | 0.011 |
| 0.5 | 13 | 15.0 | 0.044 |
| 1.0 | 9 | 23.8 | 0.061 |
| 1.5 | 10 | 19.2 | 0.051 |
| Comparison in different temperature | ||
|---|---|---|
| Sample | Temperature | Surface Area (m2/g) |
| ZnO(SDS:CTAB = 1:2) | 120 °C | 7 |
| 150 °C | 5 | |
| 180 °C | 5 | |
| ZnO(CTAB:SDS = 1:0.36) | 120 °C | 29 |
| 150 °C | 2 | |
| 180 °C | 2 | |
© 2012 by the authors; licensee Molecular Diversity Preservation International, Basel, Switzerland. This article is an open-access article distributed under the terms and conditions of the Creative Commons Attribution license (http://creativecommons.org/licenses/by/3.0/).
Share and Cite
Ramimoghadam, D.; Hussein, M.Z.B.; Taufiq-Yap, Y.H. The Effect of Sodium Dodecyl Sulfate (SDS) and Cetyltrimethylammonium Bromide (CTAB) on the Properties of ZnO Synthesized by Hydrothermal Method. Int. J. Mol. Sci. 2012, 13, 13275-13293. https://doi.org/10.3390/ijms131013275
Ramimoghadam D, Hussein MZB, Taufiq-Yap YH. The Effect of Sodium Dodecyl Sulfate (SDS) and Cetyltrimethylammonium Bromide (CTAB) on the Properties of ZnO Synthesized by Hydrothermal Method. International Journal of Molecular Sciences. 2012; 13(10):13275-13293. https://doi.org/10.3390/ijms131013275
Chicago/Turabian StyleRamimoghadam, Donya, Mohd Zobir Bin Hussein, and Yun Hin Taufiq-Yap. 2012. "The Effect of Sodium Dodecyl Sulfate (SDS) and Cetyltrimethylammonium Bromide (CTAB) on the Properties of ZnO Synthesized by Hydrothermal Method" International Journal of Molecular Sciences 13, no. 10: 13275-13293. https://doi.org/10.3390/ijms131013275