Abstract
The turbot (Scophthalmus maximus) is a commercially valuable flatfish and one of the most promising aquaculture species in Europe. Two transcriptome 454-pyrosequencing runs were used in order to detect Single Nucleotide Polymorphisms (SNPs) in genes related to immune response and gonad differentiation. A total of 866 true SNPs were detected in 140 different contigs representing 262,093 bp as a whole. Only one true SNP was analyzed in each contig. One hundred and thirteen SNPs out of the 140 analyzed were feasible (genotyped), while III were polymorphic in a wild population. Transition/transversion ratio (1.354) was similar to that observed in other fish studies. Unbiased gene diversity (He) estimates ranged from 0.060 to 0.510 (mean = 0.351), minimum allele frequency (MAF) from 0.030 to 0.500 (mean = 0.259) and all loci were in Hardy-Weinberg equilibrium after Bonferroni correction. A large number of SNPs (49) were located in the coding region, 33 representing synonymous and 16 non-synonymous changes. Most SNP-containing genes were related to immune response and gonad differentiation processes, and could be candidates for functional changes leading to phenotypic changes. These markers will be useful for population screening to look for adaptive variation in wild and domestic turbot.
1. Introduction
The turbot (Scophthalmus maximus; Scophthalmidae, Pleuronectiformes) is a commercially valuable flatfish that has been intensively cultured since the 1980s. Its production has steadily increased up to the present figure of 8549 tons in 2011 (91.2% European production from Spain; [1]) and it appears to be one of the most promising aquaculture species in Europe. In response to turbot industry demands, genetic markers have been developed in this species in order to evaluate genetic resources in both wild and hatchery populations and perform parentage analysis to support genetic breeding programs [2–4]. These markers have also been applied to develop genomic tools to identify genomic regions associated with productive characters [5–7] and to detect selection footprints in wild populations [8]. Increasing growth rate, controlling sex ratio (females largely outgrow males) and enhancing disease resistance currently constitute the main goals of genetic breeding programs in this species.
The necessity of understanding the immune response to pathogens of industrial relevance and to identify genes involved in the sex differentiation pathway led us to increase genomic resources in turbot. As a consequence thereof, an Expressed Sequence Tag (EST) database from cDNA libraries of the main immune tissues was constructed using Sanger sequencing [9]. Recently, this database has been amplified with two 454 FLX runs [10,11] (454-Life Sciences, Brandford, CT, USA; for 454-technique methodology see [12,13]). Next Generation Sequencing (NGS) technologies offer the ability to produce an enormous volume of data with a very low sequencing cost per base [12]. Thus, this turbot EST database is currently composed of ~70,000 unique sequences (~20,000 contigs and ~50,000 singletons). ESTs are essential to ascertain the gene [14,15], but also to identify polymorphic gene-associated markers, such as microsatellites and single nucleotide polymorphisms (SNPs) (type I markers; [9,16–18]). Type I markers are very useful for constructing genetic or physical maps, and for comparative mapping [7,19,20].
SNPs have several advantages over other markers when it comes to mapping genes or inferring population structure [21]. They can be easily evaluated in silico off public databases and their genotypes quickly assessed by mini-sequencing reactions [9,22] or by high-throughput technologies [23,24]. SNP alleles are almost exclusively identical-by-descent (IBD) and thus they prevent scoring errors associated to homoplasy [25]. They are extremely stable, due to low mutation rates [26], and occur more often in the genome than other markers. In the human genome, for instance, there is on average 1 SNP per 300 bp [27], and their frequency in non-model species has been estimated at ~1 in 200–500 bases for non-coding DNA and ~1 in 500–1000 bases for coding DNA [28]. In turbot, Vera et al. [29] estimated 1 true SNP every ~100 bp from the EST database composed only of Sanger sequences, suggesting the existence of large SNP resources in this species. During the last decade, SNP discovery pipelines have been developed for aquaculture species including fish [18,30–35], shellfish [36–38] and crustaceans [39,40]. In turbot, a SNP calling tool was included in the turbot database [9] and it has been refined in the updated version [11]. In this study, we screened genomic resources available in an updated version of the turbot EST database using contigs containing NGS 454-sequences to identify and characterize SNPs associated to immune- and reproduction-related genes. These markers will be used for further structural genomic analysis focused on quantitative trait loci (QTLs) linked to productive traits, as well as for population screening to look for adaptive variation in wild and domestic turbot.
2. Results and Discussion
2.1. Database Exploitation and SNP Detection
The main characteristics of the turbot 454-transcriptome sequencing runs have been described in previous studies [10,11]. The used database (version 4.0 September 2011) was constituted by 71,033 unique sequences, 18,880 contigs and 52,153 singletons including 454-sequences and Sanger sequences [9] with a total length of 52,402,177 base pairs (bp, ~52 Mb). However, in order to avoid duplicates with the previous SNPs developed from sequences obtained with Sanger methodology [29], and since we were mainly interested in validating SNPs at new immune- and reproduction-related genes, only contigs composed exclusively of at least four 454-sequences were used for SNP detection. Thus, 140 contigs from the turbot database, which met these requirements, were taken into account for the SNP development. The total length analyzed was 262,093 bp and contig length ranged from 728 bp to 4885 bp, with a mean length value of 1872.09 ± 746.69 bp. The total number of true SNPs detected using the program QualitySNP (for true SNP definition see the experimental section) was 866, SNP number per contig ranged from 1 to 58, with a mean value of 6.18 ± 8.34. Thus, the expected frequency of SNP appearance in the analyzed sequences would be 1 SNP every 302 bp. This value is lower than that previously reported in S. maximus (1 SNP each ~100 bp; [29]), but similar to those described in non-model species [28]. The success of any genotyping method is reflected in what is referred to as the conversion rate and the global success rate. The former only considers the polymorphic markers, whereas the latter considers all the markers (monomorphic and polymorphic) that were successfully typed within the analyzed samples [41]. Of the 140 true SNPs tested, 27 (19.3%) could not be genotyped, and thus they were considered to be genotyping failures due to technical and/or genotyping problems. Only 2 out of the 113 feasible SNPs (see definition in the experimental section) were monomorphic. Therefore, the global success rate and conversion rate were 80.7% and 79.3%, respectively. Global success rate was very similar to that previously described in the species (78.4%), but conversion rate was much higher than previously reported using sequences from cDNA libraries (37.7%; see Vera et al. [29]), likely due to the different library construction methods and bioinformatic pipeline approaches followed in 454 and Sanger contigs (see experimental section).
2.2. SNP Performance
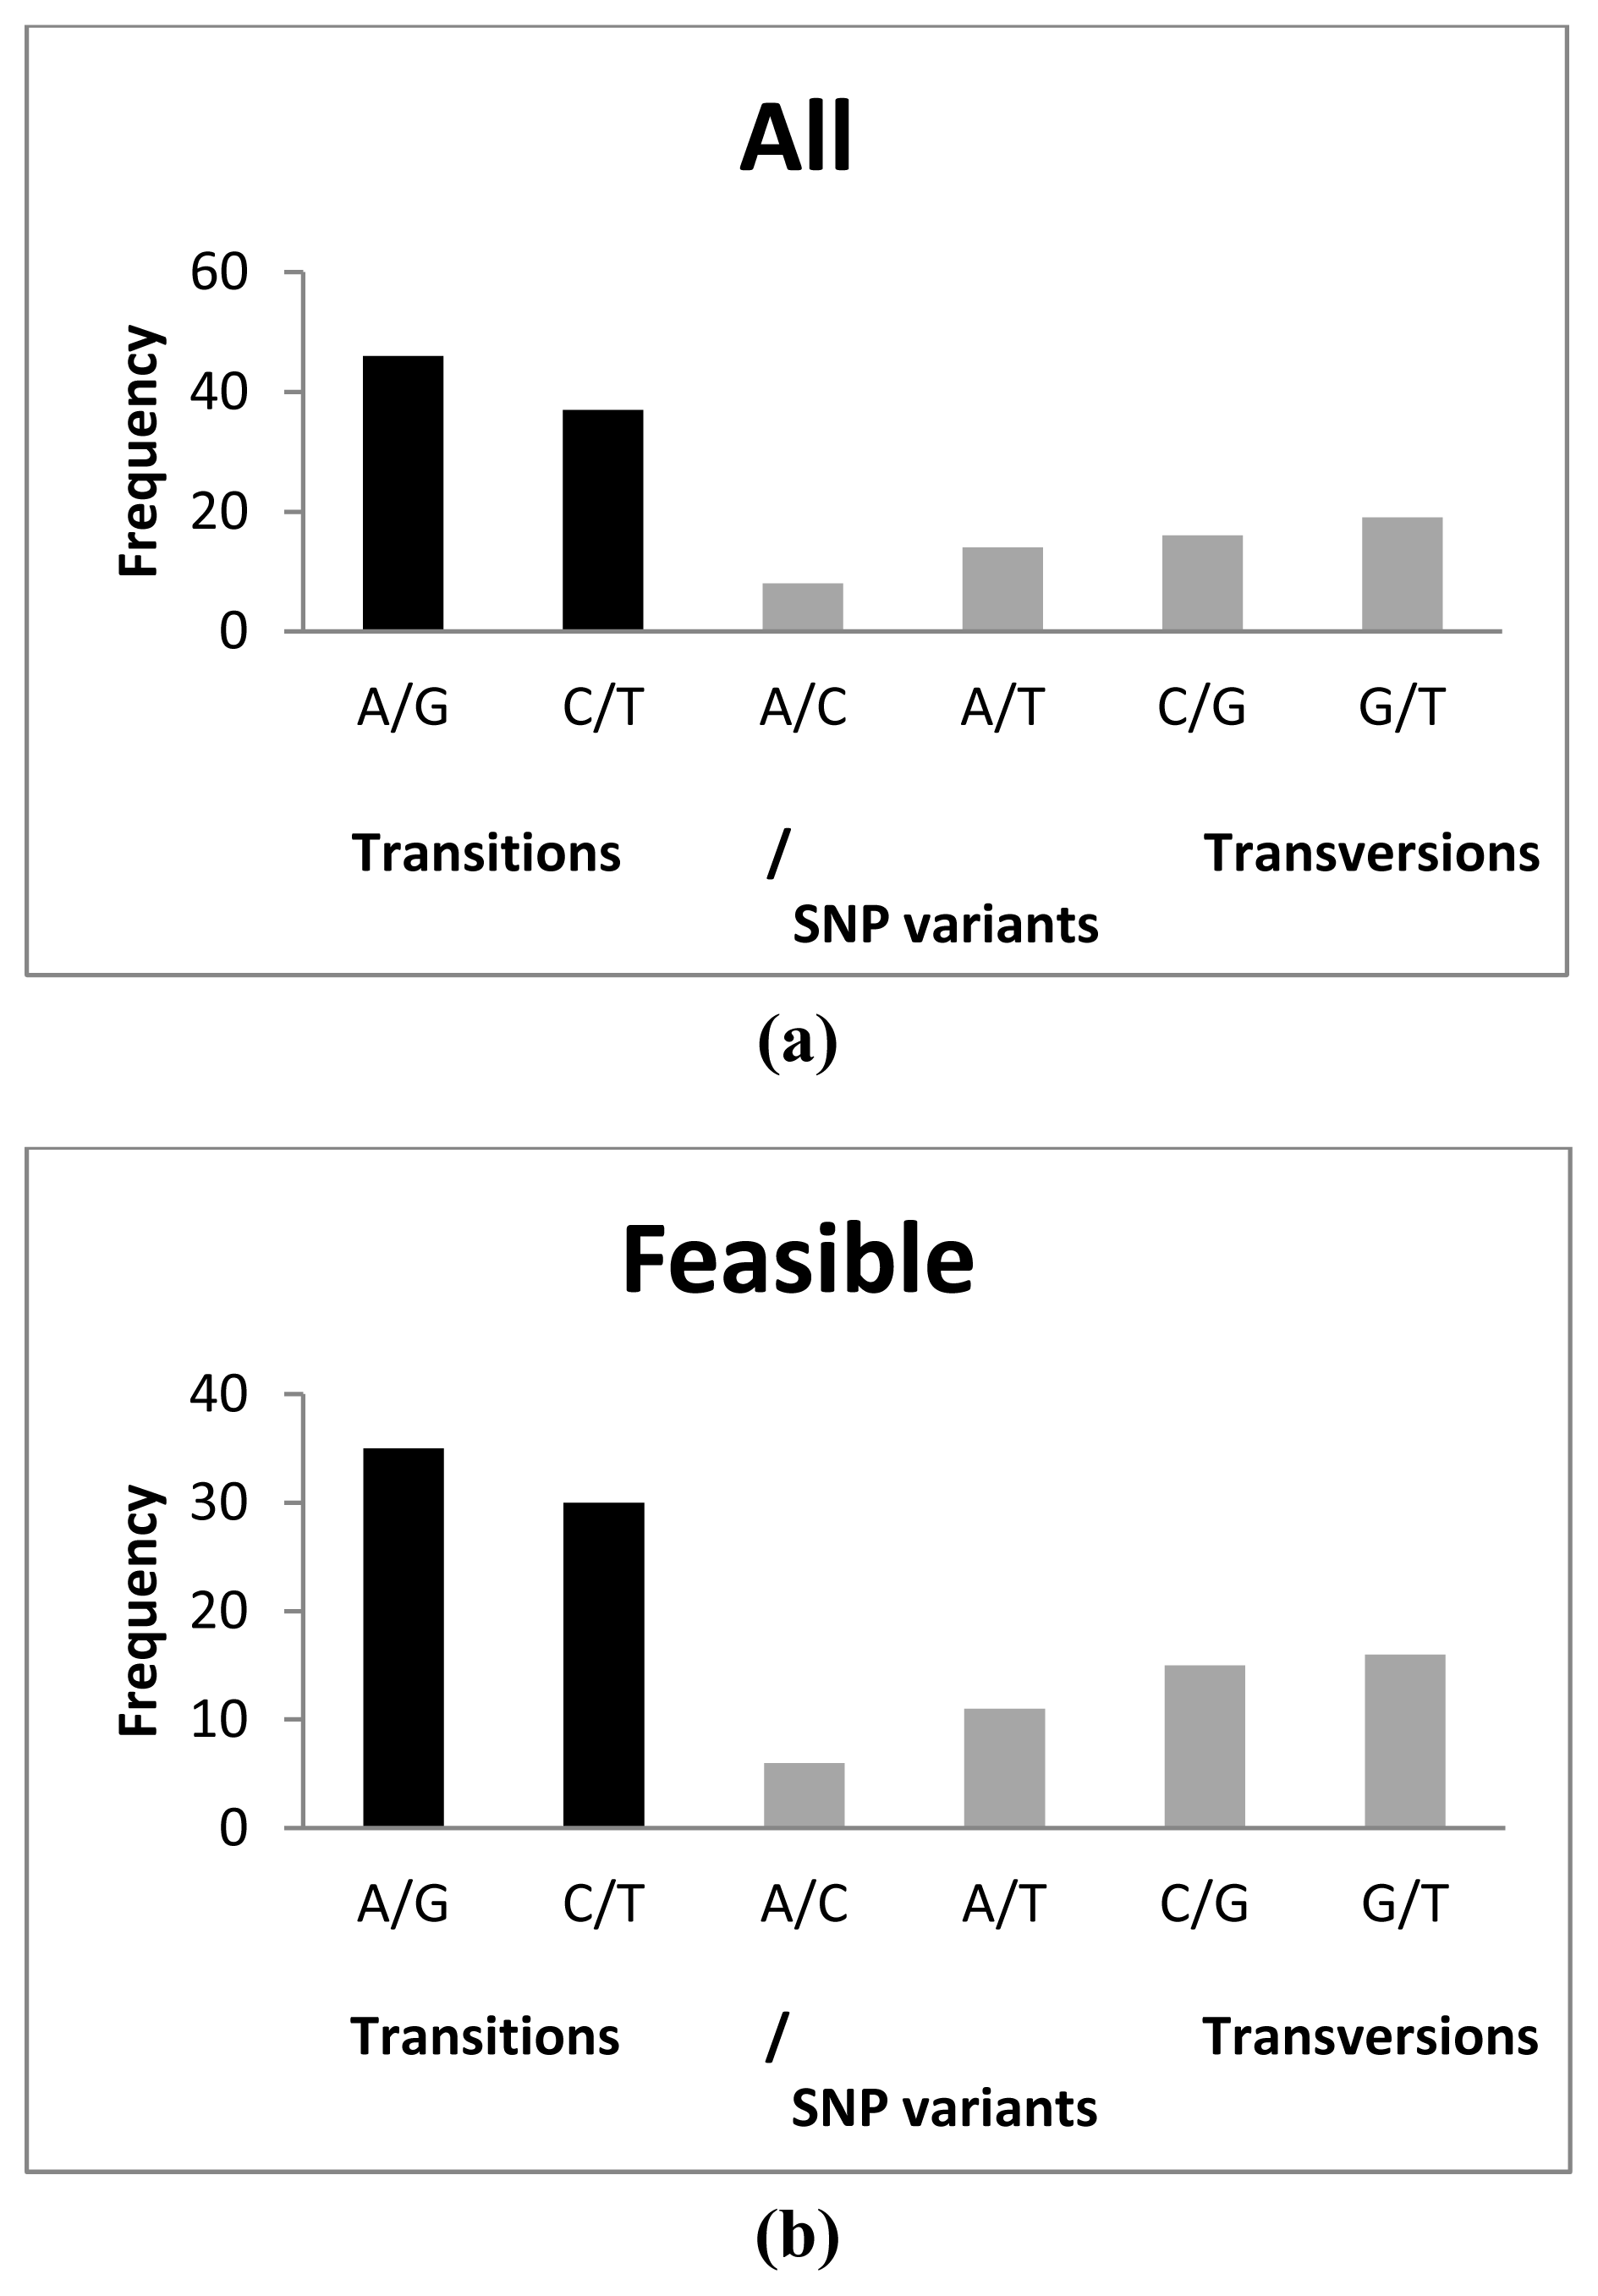
A total of 65 transitions (A/G and C/T) and 48 transversions (A/C, A/T, C/G and G/T) were detected among feasible SNPs, A/G being the most common (35) and A/C the least common (6) substitutions observed (Figure 1). This represented a transition/transversion (ts/tv) ratio of 1.354. This ratio was lower than that observed by Vera et al. [29] (1.885) and in silico (1.456) by Pardo et al. [9], but it was very similar to that described for common carp (Cyprinus carpio) (1.310) [42] and gilthead seabream (Sparus aurata) (1.375) [31]. Also, the most frequent transitions and transversions differed from previous reports: C/T and G/T, respectively [29], and A/G and A/C [9]. These discrepancies could be due to the opposite sequencing directions, as all sequences by Vera et al. [29] and Pardo et al. [9] were obtained from the 3′ end using cDNA libraries, while those from the 454-run were randomly obtained by fragmentation of the whole cDNA according to the cDNA rapid library preparation method (Roche Farma, S. A. [43]). Moreover, the longer coding region portion analyzed in 454-runs regarding Sanger sequencing in our study may determine differences because of the different selective constraints of UTR regarding coding regions. No differences were detected among distribution of the variants between tested SNPs and feasible SNPs (χ2 = 0.3115; p = 0.9974). All polymorphic SNP loci showed two alleles and all of them agreed with those expected from the database information.

Figure 1.
Distribution of SNP variants analyzed in this study (a) using all SNPs tested; (b) using only feasible SNPs. Transitions (ts) and transversions (tv) are indicated in black and grey colour, respectively.
2.3. SNP Diversity
Only two loci among the 113 feasible SNPs were monomorphic (SmaSNP_287 and SmaSNP_334). Among polymorphic SNPs, unbiased gene diversity (He) estimates ranged from 0.060 at SmaSNP_237, SmaSNP_245 and SmaSNP_305 to 0.510 at SmaSNP_225 with a mean value of 0.344 ± 0.149. The minimum allele frequency (MAF) in the polymorphic markers ranged from 0.030 (SmaSNP_237, SmaSNP_245 and SmaSNP_305) to 0.500 in SmaSNP_249 with a mean value of 0.259 ± 0.140. Departures from Hardy-Weinberg equilibrium (HWE) were detected in five markers (SmaSNP_253, SmaSNP_271, SmaSNP279, SmaSNP_289, SmaSNP_326; Table 1), although all markers were at equilibrium after Bonferroni correction (p = 0.0004). The samples from the Cantabrian turbot population were globally in accordance with HWE expectations when tested simultaneously for all loci (p = 0.9999). These polymorphic values were in the range to those previously described in the species [29], and they were also similar to those reported in other fish species [42,44]. No Linkage disequilibrium (LD) was detected among the 6328 loci pairs after Bonferroni correction (p = 0.0004).

Table 1.
Annotation, variants and diversity values of the 113 technically feasible SNPs in the Cantabric turbot population (33 individuals) used in this study.
2.4. SNP Position within Genes: Synonymous vs. Non-Synonymous Substitutions
Consensus sequences of contigs containing polymorphic SNPs were compared using NCBI BLAST with public databases, namely UniRef90, NCBI’s nr, KEGG, COG, PFAM, LSU and SSU. The subsequent BLAST output was then parsed with Auto FACT [45]. All contigs containing feasible SNPs were annotated (except SmaSNP_320, Table 1). The informative strand, reading frame, and stop codon at each contig were recorded using homology with the highest homologous annotated sequence in public databases. Nine feasible SNPs (8.0%) could not be positioned, because no consistent reading frames were detected (indicated as “unknown” location on Table 2). Fifty-five SNPs (48.7%) were located in untranslated regions (UTR), either in the 5′ UTR (17, 15.0%) or 3′ UTR (38, 33.6%), which is in accordance with the approximately double length of 3′ compared to 5′ UTR [9]. On the other hand, 49 SNPs (43.4%) were localized in the coding region (Table 2), a percentage of SNPs higher than previously reported in the species (24.7%, [29]) and in other aquaculture fish species (e.g., Atlantic salmon 24%, [32]; Atlantic cod 17.4%, [34]). All these studies followed a 3′ UTR Sanger sequencing strategy, and therefore the coding region was less represented than in the case of the 454 Roche runs after a cDNA rapid library preparation protocol, which accounts for the differences observed. This result shows the utility of the NGS methodologies for SNP detection in the coding region. Thirty-three (29.2%) of these 49 SNPs were synonymous, and 16 (14.2%) were non-synonymous. On the other hand, the relationship between synonymous vs. non-synonymous changes (2:1) was lower than in other species [46,47]. Evolutionary constraints should preferentially eliminate non-synonymous variation because it is usually associated with deleterious mutations [35].
Table 2.
Predicted position, SNP location within genes and their correspondent synonymous vs. non-synonymous variants of the 113 technically feasible SNPs.
Non-synonymous SNPs in coding regions represent alternative allelic variants of a gene, which can determine functional changes in the corresponding proteins and lead to phenotypic changes. Among these genes there can be found a retinol dehydrogenase (SmaSNP_264), three zona pellucida proteins (SmaSNP_212, SmaSNP_217, SmaSNP_282) related to reproduction processes, and a lipocalin (SmaSNP_325) involved in tear secretion (Table 2).
In the present study, we used sequences obtained from two transcriptome 454-pyrosequencing runs, one related to immune system [10] and another one from the hypothalamic pituitary-gonad axis [11]. Thus, GO terms were mainly related to immune response and reproduction processes (Table 2). The non-synonymous variation was associated with genes involving either immune response or sex differentiation processes. A large number of SNP linked to annotated genes were identified and validated. This set of markers are being used for population genomic studies and turbot genetic map enrichment, both approaches providing useful information for evolutionary and turbot industry applied studies.
3. Experimental Section
3.1. EST Database, SNP Detection and Annotation
Sequences were obtained from two transcriptome 454-pyrosequencing runs of turbot cDNA libraries, one belonging to the immune transcriptome [10] and another one from the hypothalamic pituitary-gonad axis [11]. A brief description of both runs is shown in Table 3. All the 454-reads were assembled with MIRA [48], and they make up the 454-sequences incorporated into the turbot database. In order to create contigs and detect SNPs, these 454-sequences were assembled alongside Sanger sequences available [9] in the database with CAP3 [49] using default parameters. This is a common strategy when dealing with hybrid Sanger-454 assemblies [50]. The resulting ACE format assembly file was fed into QualitySNP [51] in conformity with the bioinformatic pipeline described by Vera et al. [29]. Briefly, QualitySNP uses three filters for the identification of reliable SNPs: Filter 1 screens for all potential SNPs with the requirement that every allele is represented in more than one sequence (each contig has to have at least a depth of 4 sequences); filter 2 uses a haplotype-based strategy to detect reliable SNPs after reconstructing confident haplotypes with an algorithm that minimizes false haplotypes due to the occurrence of sequencing errors; and filter three screen SNPs by calculating a confidence score based on sequence redundancy and quality (only sequences with PHRED >20 were used). SNPs that pass filters 1 and 2 are called real SNPs and those passing all filters are called true SNPs [51]. Resulting files were processed with our own custom Perl programs to extract relevant information. The obtained data were imported into a mySQL server [52]. A user-friendly web access interface was designed so that contig graphs are clickable and the output visually refined with color-coded nucleotide views [53]. A graphical interface allowing for SNP database search by alleles, contig depth, and annotation was set up. EST annotation of these contigs was performed using BLASTx, which searches proteins using a translated nucleotide query [54]. Only E-values lower than 10−5 were considered for gene annotation (Table 1, Table S1).
Table 3.
Description of two transcriptome 454-pyrosequencing runs of turbot.
3.2. SNP Genotyping and Validation
DNA of all individuals analyzed was extracted from a piece of caudal fin using standard phenol-chloroform procedures [55].
SNPs identified were validated and genotyped with the MassARRAY platform (Sequenom, San Diego, CA, USA) following the protocols and recommendations provided by the manufacturer. Briefly, the technique consists of an initial locus-specific polymerase chain reaction (PCR), followed by single-base extension using mass-modified dideoxynucleotide terminators of an oligonucleotide primer that anneals immediately upstream of the polymorphic site (SNP) of interest (see [56,57] for more technical information). The distinct mass of the extended primer identifies the SNP allele. Primer sequences, SNP position, expected variants and annotation for the 140 tested SNPs are shown on Supplementary Table 1. MALDI-TOF mass spectrometry analysis in an Autoflex spectrometer was used for allele scoring.
Assays were designed for 140 true SNPs always located in different sequences and were combined in 7 multiplex reactions including 24 SNPs each except for multiplex 5 (23 SNPs), 6 (18 SNPs) and 7 (3 SNPs) (see Supplementary Table 1 for multiplex information). SNP multiplexes were designed in silico and tested on a panel of 8 turbot individuals from a wild Cantabrian (northern Spain) population. SNPs were classified based on manual inspection as “failed assays” (in case that the majority of genotypes could not be scored and/or the samples did not cluster well according to genotype), and feasible SNPs (markers with proper and reliable genotypes), these being either monomorphic or polymorphic.
3.3. Gene Diversity and Population Analysis
In order to estimate genetic diversity parameters, all SNPs were genotyped for polymorphism evaluation in a sample of 33 individuals (including the 8 individuals used for marker performance) from the wild Cantabrian population previously used.
Estimates of genetic diversity (unbiased expected heterozygosity (He) and minimum allele frequency (MAF)) were estimated using FSTAT 2.9.3 [58]. The conformance to Hardy-Weinberg (HW) and genotypic equilibria were obtained using GENEPOP 4.0 [59,60]. Conformance to HWE was checked using the complete enumeration method [61] because only two alleles were detected at each locus. Bonferroni correction was applied when multiple tests were performed [62].
3.4. Detection of Synonymous/Non-Synonymous SNPs
All the six possible reading frames of the consensus sequence of each containing SNP functionally annotated contig were obtained using ORF (Open Reading Frame) Finder application [63]. The best candidate frame (usually the longest one) was compared against the NCBI protein database using BLASTp and BLASTx, and the protein with highest E-value was downloaded and aligned with the selected frame for SNP location using Clustal W [64] implemented in BioEdit v. 7.1. [65]. This approach enabled us to locate SNPs by looking at the coding region. For those SNPs in the coding region, the resulting amino acid sequences of both variants were translated to determine whether SNP variants were synonymous or non-synonymous. Gene onthology (GO) terms were searched using QUICKGO [66] and AmiGO [67] utilities.
4. Conclusions
A total of 140 contigs (total length 262,093 bp) formed exclusively by 454-pyrosequencing reads were used to identify new putative SNPs in S. maximus. One hundred and thirteen SNPs of the 140 tested were amplified and genotyped, 111 being polymorphic in a wild Cantabrian population, showing the utility of the new NGS techniques for true SNP detection (conversion rate = 79.3%). Diversity levels at the population were similar to previous studies [29,42,44] and were in accordance with HWE expectations. An important number of these polymorphic SNPs were located in the coding region and 16 of them (14.4%) represented non-synonymous changes at genes related to immune response and gonad differentiation processes as shown by the detected GO terms. Therefore, these SNPs are valuable resources for future population genetics, high-resolution genetic maps, quantitative trait loci (QTL) identification, association studies and marker assisted selection (MAS) breeding in turbot.
Acknowledgments
We thank Susana Sánchez-Darriba and Sonia Gómez for their technical assistance. We are indebted to M. Torres for her support on Sequenom methodology. Genotyping was performed in the USC node of the Spanish National Centre of Genotyping (CeGen ISCIII). This study was supported by the Consolider Ingenio Aquagenomics (CSD200700002), the Science and Education Spanish Ministry (AGL2009-11782) and the Xunta de Galicia (09MMA011261PR) projects.
References
- APROMAR. La Acuicultura Marina en Espana; Asociación Empresarial de Productores de Cultivos Marinos: Chiclana, Spain, 2012; p. 84. Available online: http://www.apromar.es/Informes/informe%202012/Informe-APROMAR-2012.pdf accessed on 10 July 2012.
- Bouza, C.; Presa, P.; Castro, J.; Sanchez, L.; Martinez, P. Allozyme and microsatellite diversity in natural and domestic populations of turbot (Scophthalmus maximus) in comparison with other Pleuronectiformes. Can. J. Fish. Aquat. Sci 2002, 59, 1460–1473. [Google Scholar]
- Castro, J.; Bouza, C.; Sanchez, L.; Cal, R.M.; Piferrer, F.; Martinez, P. Gynogenesis assessment using microsatellite genetic markers in turbot (Scophthalmus maximus). Mar. Biotechnol 2003, 5, 584–592. [Google Scholar]
- Castro, J.; Bouza, C.; Presa, P.; Pino-Querido, A.; Riaza, A.; Ferreiro, I.; Sanchez, L.; Martinez, P. Potential sources of error in parentage assessment of turbot (Scophthalmus maximus) using microsatellite loci. Aquaculture 2004, 242, 119–135. [Google Scholar]
- Sanchez-Molano, E.; Cerna, A.; Toro, M.A.; Bouza, C.; Hermida, M.; Pardo, B.G.; Cabaleiro, S.; Fernandez, J.; Martinez, P. Detection of growth-related QTL in turbot (Scophthalmus maximus). BMC Genomics 2011, 12, 473. [Google Scholar]
- Rodriguez-Ramilo, S.T.; Toro, M.A.; Bouza, C.; Hermida, M.; Pardo, B.G.; Cabaleiro, S.; Martinez, P.; Fernandez, J. QTL detection for Aeromonas salmonicida resistance related traits in turbot (Scophthalmus maximus). BMC Genomics 2011, 12, 541. [Google Scholar]
- Bouza, C.; Hermida, M.; Pardo, B.G.; Vera, M.; Fernandez, C.; de la Herran, R.; Navajas-Perez, R.; Alvarez-Dios, J.A.; Gomez-Tato, A.; Martinez, P. An Expressed Sequence Tag (EST)-enriched genetic map of turbot (Scophthalmus maximus): A useful framework for comparative genomics across model and farmed teleosts. BMC Genetics 2012, 13, 54. [Google Scholar]
- Vilas, R.; Bouza, C.; Vera, M.; Millan, A.; Martinez, P. Variation in anonymous and EST-microsatellites suggests adaptive population divergence in turbot. Mar. Ecology-Prog. Ser 2010, 420, 231–239. [Google Scholar]
- Pardo, B.G.; Fernandez, C.; Millan, A.; Bouza, C.; Vazquez-Lopez, A.; Vera, M.; Alvarez-Dios, J.A.; Calaza, M.; Gomez-Tato, A.; Vazquez, M.; et al. Expressed sequence tags (ESTs) from immune tissues of turbot (Scophthalmus maximus) challenged with pathogens. BMC Vet. Res 2008, 4, 37. [Google Scholar]
- Pereiro, P.; Balseiro, P.; Romero, A.; Dios, S.; Forn-Cuni, G.; Fuste, B.; Planas, J.V.; Beltran, S.; Novoa, B.; Figueras, A. High-Throughput sequence analysis of turbot (Scophthalmus maximus) transcriptome using 454-pyrosequencing for the discovery of antiviral immune genes. PLoS One 2012, 7, e35369. [Google Scholar]
- Ribas, L.; Pardo, B.G.; Fernandez, C.; Alvarez-Dios, J.A.; Gomez-Tato, A.; Quiroga, M.I.; Planas, J.; Sitja-Bobadilla, A.; Martinez, P.; Piferrer, F. A combined strategy involving Sanger and 454 pyrosequencing increases genomic resources to aid in the management of reproduction; disease control and genetic selection in the turbot (Scophthalmus maximus). BMC Genomics 2013. submitted. [Google Scholar]
- Metzker, M.L. Applications of next-generation sequencing: Sequencing technologies—The next generation. Nat. Rev. Genetics 2010, 11, 31–46. [Google Scholar]
- Voelkerding, K.V.; Dames, S.A.; Durtschi, J.D. Next-Generation sequencing: From basic research to diagnostics. Clin. Chem 2009, 55, 641–658. [Google Scholar]
- Adams, M.D.; Kelley, J.M.; Gocayne, J.D.; Dubnick, M.; Polymeropoulos, M.H.; Xiao, H.; Merril, C.R.; Wu, A.; Olde, B.; Moreno, R.F.; et al. Complementary DNA sequencing— Expressed sequence tags and human genome project. Science 1991, 252, 1651–1656. [Google Scholar]
- Marra, M.A.; Hillier, L.; Waterston, R.H. Expressed sequence tags-ESTablishing bridges between genomes. Trends Genetics 1998, 14, 4–7. [Google Scholar]
- Liu, Z.J.; Li, P.; Kocabas, A.; Karsi, A.; Ju, Z.L. Microsatellite-containing genes from the channel catfish brain: Evidence of trinucleotide repeat expansion in the coding region of nucleotide excision repair gene RAD23B. Biochem. Biophys. Res. Commu 2001, 289, 317–324. [Google Scholar]
- Serapion, J.; Kucuktas, H.; Feng, J.A.; Liu, Z.J. Bioinformatic mining of type I microsatellites from expressed sequence tags of channel catfish (Ictalurus punctatus). Mar. Biotechnol 2004, 6, 364–377. [Google Scholar]
- He, C.; Chen, L.; Simmons, M.; Li, P.; Kim, S.; Liu, Z.J. Putative SNP discovery in interspecific hybrids of catfish by comparative EST analysis. Anim. Genetics 2003, 34, 445–448. [Google Scholar]
- Bouza, C.; Hermida, M.; Pardo, B.G.; Fernandez, C.; Fortes, G.G.; Castro, J.; Sanchez, L.; Presa, P.; Perez, M.; Sanjuan, A.; et al. A microsatellite genetic map of the turbot (Scophthalmus maximus). Genetics 2007, 177, 2457–2467. [Google Scholar]
- Moen, T.; Hayes, B.; Nilsen, F.; Delghandi, M.; Fjalestad, K.T.; Fevolden, S.E.; Berg, P.R.; Lien, S. Identification and characterisation of novel SNP markers in Atlantic cod: Evidence for directional selection. BMC Genetics 2008, 9, 18. [Google Scholar]
- Morin, P.A.; Luikart, G.; Wayne, R.K.; Grp, S.N.P.W. SNPs in ecology; evolution and conservation. Trends Ecol. Evol 2004, 19, 208–216. [Google Scholar]
- Ferber, S.; Reusch, T.B.H.; Stam, W.T.; Olsen, J.L. Characterization of single nucleotide polymorphism markers for eelgrass (Zostera marina). Mol. Ecol. Resour 2008, 8, 1429–1435. [Google Scholar]
- Stapley, J.; Reger, J.; Feulner, P.G.D.; Smadja, C.; Galindo, J.; Ekblom, R.; Bennison, C.; Ball, A.D.; Beckerman, A.P.; Slate, J. Adaptation genomics: The next generation. Trends Ecol. Evol 2010, 25, 705–712. [Google Scholar]
- Kim, S.; Misra, A. SNP genotyping: Technologies and biomedical applications. Ann. Rev. Biomed. Eng 2007, 9, 289–320. [Google Scholar]
- Bester, A.E.; Roodt-Wilding, R.; Whitaker, H.A. Discovery and evaluation of single nucleotide polymorphisms (SNPs) for Haliotis midae: A targeted EST approach. Anim. Genetics 2008, 39, 321–324. [Google Scholar]
- Sachidanandam, R.; Weissman, D.; Schmidt, S.C.; Kakol, J.M.; Stein, L.D.; Marth, G.; Sherry, S.; Mullikin, J.C.; Mortimore, B.J.; Willey, D.L.; et al. A map of human genome sequence variation containing 1.42 million single nucleotide polymorphisms. Nature 2001, 409, 928–933. [Google Scholar]
- Reich, D.E.; Gabriel, S.B.; Altshuler, D. Quality and completeness of SNP databases. Nat. Genetics 2003, 33, 457–458. [Google Scholar]
- Brumfield, R.T.; Beerli, P.; Nickerson, D.A.; Edwards, S.V. The utility of single nucleotide polymorphisms in inferences of population history. Trends Ecol. Evol 2003, 18, 249–256. [Google Scholar]
- Vera, M.; Alvarez-Dios, J.A.; Millan, A.; Pardo, B.G.; Bouza, C.; Hermida, M.; Fernandez, C.; de la Herran, R.; Molina-Luzon, M.J.; Martinez, P. Validation of single nucleotide polymorphism (SNP) markers from an immune Expressed Sequence Tag (EST) turbot; Scophthalmus maximus; database. Aquaculture 2011, 313, 31–41. [Google Scholar]
- Stickney, H.L.; Schmutz, J.; Woods, I.G.; Holtzer, C.C.; Dickson, M.C.; Kelly, P.D.; Myers, R.M.; Talbot, W.S. Rapid mapping of zebrafish mutations with SNPs and oligonucleotide microarrays. Genome Res 2002, 12, 1929–1934. [Google Scholar]
- Cenadelli, S.; Maran, V.; Bongioni, G.; Fusetti, L.; Parma, P.; Aleandri, R. Identification of nuclear SNPs in gilthead seabream. J. Fish. Biol 2007, 70, 399–405. [Google Scholar]
- Hayes, B.; Laerdahl, J.K.; Lien, S.; Moen, T.; Berg, P.; Hindar, K.; Davidson, W.S.; Koop, B.F.; Adzhubei, A.; Hoyheim, B. An extensive resource of single nucleotide polymorphism markers associated with Atlantic salmon (Salmo salar) expressed sequences. Aquaculture 2007, 265, 82–90. [Google Scholar]
- Wang, S.L.; Sha, Z.X.; Sonstegard, T.S.; Liu, H.; Xu, P.; Somridhivej, B.; Peatman, E.; Kucuktas, H.; Liu, Z.J. Quality assessment parameters for EST-derived SNPs from catfish. BMC Genomics 2008, 9, 450. [Google Scholar]
- Hubert, S.; Bussey, J.T.; Higgins, B.; Curtis, B.A.; Bowman, S. Development of single nucleotide polymorphism markers for Atlantic cod (Gadus morhua) using expressed sequences. Aquaculture 2009, 296, 7–14. [Google Scholar]
- Hubert, S.; Higgins, B.; Borza, T.; Bowman, S. Development of a SNP resource and a genetic linkage map for Atlantic cod (Gadus morhua). BMC Genomics 2010, 11, 191. [Google Scholar]
- Sauvage, C.; Bierne, N.; Lapegue, S.; Boudry, P. Single nucleotide polymorphisms and their relationship to codon usage bias in the Pacific oyster Crassostrea gigas. Gene 2007, 406, 13–22. [Google Scholar]
- Vera, M.; Pardo, B.G.; Pino-Querido, A.; Alvarez-Dios, J.A.; Fuentes, J.; Martinez, P. Characterization of single-nucleotide polymorphism markers in the Mediterranean mussel; Mytilus galloprovincialis. Aquac. Res 2010, 41, e568–e575. [Google Scholar]
- Zhang, L.S.; Guo, X.M. Development and validation of single nucleotide polymorphism markers in the eastern oyster Crassostrea virginica Gmelin by mining ESTs and resequencing. Aquaculture 2010, 302, 124–129. [Google Scholar]
- Du, Z.Q.; Ciobanu, D.C.; Onteru, S.K.; Gorbach, D.; Mileham, A.J.; Jaramillo, G.; Rothschild, M.F. A gene-based SNP linkage map for pacific white shrimp; Litopenaeus vannamei. Anim. Genetics 2010, 41, 286–294. [Google Scholar]
- Gorbach, D.M.; Hu, Z.L.; Du, Z.Q.; Rothschild, M.F. Mining ESTs to determine the usefulness of SNPs across shrimp species. Anim. Biotechnol 2010, 21, 100–103. [Google Scholar]
- Lepoittevin, C.; Frigerio, J.M.; Garnier-Gere, P.; Salin, F.; Cervera, M.T.; Vornam, B.; Harvengt, L.; Plomion, C. In vitro vs. in silico detected SNPs for the development of a genotyping array: What can we learn from a non-model species? PLoS One 2010, 5, e11034. [Google Scholar]
- Zhu, C.; Cheng, L.; Tong, J.; Yu, X. Development and characterization of new single nucleotide polymorphism markers from expressed sequence tags in common carp (Cyprinus carpio). Int. J. Mol. Sci 2012, 13, 7343–7353. [Google Scholar]
- Roche Diagnostics GmbH, cDNA Rapid Library Preparation Method Manual; Roche Applied Science: Manheim, Germany, 2009.
- Campbell, N.R.; Amish, S.J.; Pritchard, V.L.; McKelvey, K.S.; Young, M.K.; Schwartz, M.K.; Garza, J.C.; Luikart, G.; Narum, S.R. Development and evaluation of 200 novel SNP assays for population genetic studies of westslope cutthroat trout and genetic identification of related taxa. Mol. Ecol. Resour 2012, 12, 942–949. [Google Scholar]
- Koski, L.B.; Gray, M.W.; Lang, B.F.; Burger, G. AutoFACT: An (Auto)under-barmatic (F)under-barunctional (A)under-barnnotation and (C)under-barlassification (T)under-barool. BMC Bioinforma 2005, 6, 151. [Google Scholar]
- Kim, H.; Schmidt, C.J.; Decker, K.S.; Emara, M.G. A double-screening method to identify reliable candidate non-synonymous SNPs from chicken EST data. Anim. Genetics 2003, 34, 249–254. [Google Scholar]
- Wondji, C.S.; Hemingway, J.; Ranson, H. Identification and analysis of single nucleotide polymorphisms (SNPs) in the mosquito Anopheles funestus; malaria vector. BMC Genomics 2007, 8, 5. [Google Scholar]
- Chevreux, B.; Pfisterer, T.; Drescher, B.; Driesel, A.; Müller, W.E.G.; Wetter, T.; Suhai, S. Using the miraEST assembler for reliable and automated mRNA transcript assembly and dtection in sequenced ESTs. Genome Res 2004, 14, 1147–1159. [Google Scholar]
- Huang, X.; Madan, A. CAP3: A DNA sequence assembly program. Genome Res 1999, 9, 868–877. [Google Scholar]
- Ueno, S.; le Provost, G.; Leger, V.; Klopp, C.; Noirot, C.; Frigerio, J.-M.; Salin, F.; Salse, J.; Abrouk, M.; Murat, F.; et al. Bioinformatic analysis of ESTs collected by Sanger and pyrosequencing methods for a keystone forest tree species: Oak. BMC Genomics 2010, 11, 650. [Google Scholar]
- Tang, J.; Vosman, B.; Voorrips, R.E.; Linden, C.G.; van der Linden, C.G.; Leunissen, J.A.M. QualitySNP: A pipeline for detecting single nucleotide polymorphisms and insertions/deletions in EST data from diploid and polyploid species. BMC Bioinforma 2006, 7, 438. [Google Scholar]
- MySQL Home Page. Available online: http://www.mysql.com accessed on 1 July 2009.
- M-View Home Page. Available online: http://bio-mview.sourceforge.net accessed on 1 July 2009.
- BLAST Home Page. Available online: http://blast.ncbi.nlm.nih.gov/Blast.cgi? accessed on 2 November 2012.
- Sambrook, J.; Fritsch, E.F.; Maniatis, T. Molecular Cloning: A Laboratory Manual, 1st ed; Press CSHL: New York, NY, USA, 1989. [Google Scholar]
- Buetow, K.H.; Edmonson, M.; MacDonald, R.; Clifford, R.; Yip, P.; Kelley, J.; Little, D.P.; Strausberg, R.; Koester, H.; Cantor, C.R.; et al. High-throughput development and characterization of a genomewide collection of gene-based single nucleotide polymorphism markers by chip-based matrix-assisted laser desorption/ionization time-of-flight mass spectrometry. Proc. Natl. Acad. Sci. USA 2001, 98, 581–584. [Google Scholar]
- Oeth, P.; del Mistro, G.; Marnellos, G.; Shi, T.; van den Boom, D. Qualitative and quantitative genotyping using single base primer extension coupled with matrix-assisted laser desorption/ionization time-of-flight mass spectrometry (MassARRAY). Methods Mol. Biol 2009, 578, 307–343. [Google Scholar]
- Goudet, J. FSTAT, a program to estimate and test gene diversities and fixation indices (version 2.9.3). Available online: http://www.unil.ch/izea/softwares/fstat.html accessed on 1 March 2003.
- Raymond, M.; Rousset, F. GENEPOP (Version 1.2)—Population genetics software for exact tests and ecumenicism. J. Hered 1995, 86, 248–249. [Google Scholar]
- Rousset, F. GENEPOP’007: A complete re-implementation of the GENEPOP software for Windows and Linux. Mol. Ecol. Resour 2008, 8, 103–106. [Google Scholar]
- Louis, E.J.; Dempster, E.R. An exact test for Hardy-Weinberg and multiple alleles. Biometrics 1987, 43, 805–811. [Google Scholar]
- Rice, W.R. Analyzing tables of statistical tests. Evolution 1989, 43, 223–225. [Google Scholar]
- ORF Finder Home Page. Available online: http://www.ncbi.nlm.nih.gov/gorf/gorf.html accessed on 8 November 2012.
- Thompson, J.D.; Higgins, D.G.; Gibson, T.J. CLUSTAL W improving the sensitivity of progressive multiple sequence alignment through sequence weighting; position-specific gap penalties and weight matrix choice. Nucl. Acids Res 1994, 22, 4673–4680. [Google Scholar]
- Hall, T.A. BioEdit: A user-friendly biological sequence alignment editor and analysis program fro Windows 95/98/NT. Nucl. Acids Symp. Ser 1999, 41, 95–98. [Google Scholar]
- QuickGO Home Page. Available online: http://www.ebi.ac.uk/QuickGO/ accessed on 15 October 2012.
- AmiGO Home Page. Available online: http://amigo.geneontology.org/cgi-bin/amigo/go.cgi accessed on 16 October 2012.
Supplementary Files
© 2013 by the authors; licensee MDPI, Basel, Switzerland. This article is an open-access article distributed under the terms and conditions of the Creative Commons Attribution license (http://creativecommons.org/licenses/by/3.0/).