Article

Use of Heat Stress Responsive Gene Expression Levels for Early Selection of Heat Tolerant Cabbage (Brassica oleracea L.)

1
Plant Systems Engineering Research Center, Korea Research Institute of Bioscience and Biotechnology (KRIBB), 125 Gwahangno, Yuseong-gu, Daejeon 305-806, Korea
2
Department of Animal Resources Technology, Gyeongnam National University of Science and Technology, Jinju 660-758, Korea
3
Asia Seed Company, 447-2, Inhwang-Ri, Janghowon-Eup, Ichen 467-906, Korea
4
Department of Pharmacology, Medical Sciences, Seonam University, Kwangchi-dong, Namwon 590-711, Korea
*
Authors to whom correspondence should be addressed.
These authors contributed equally to this work.
Int. J. Mol. Sci. 2013, 14(6), 11871-11894; https://doi.org/10.3390/ijms140611871
Submission received: 24 April 2013 / Revised: 21 May 2013 / Accepted: 21 May 2013 / Published: 4 June 2013
(This article belongs to the Special Issue Molecular Research in Plant Secondary Metabolism)

Abstract

:
Cabbage is a relatively robust vegetable at low temperatures. However, at high temperatures, cabbage has disadvantages, such as reduced disease tolerance and lower yields. Thus, selection of heat-tolerant cabbage is an important goal in cabbage breeding. Easier or faster selection of superior varieties of cabbage, which are tolerant to heat and disease and have improved taste and quality, can be achieved with molecular and biological methods. We compared heat-responsive gene expression between a heat-tolerant cabbage line (HTCL), “HO”, and a heat-sensitive cabbage line (HSCL), “JK”, by Genechip assay. Expression levels of specific heat stress-related genes were increased in response to high-temperature stress, according to Genechip assays. We performed quantitative RT-PCR (qRT-PCR) to compare expression levels of these heat stress-related genes in four HTCLs and four HSCLs. Transcript levels for heat shock protein BoHsp70 and transcription factor BoGRAS (SCL13) were more strongly expressed only in all HTCLs compared to all HSCLs, showing much lower level expressions at the young plant stage under heat stress (HS). Thus, we suggest that expression levels of these genes may be early selection markers for HTCLs in cabbage breeding. In addition, several genes that are involved in the secondary metabolite pathway were differentially regulated in HTCL and HSCL exposed to heat stress.

1. Introduction

Cabbage (Brassica oleracea L.) is a low-calorie leafy vegetable that is high in vitamin C, minerals and dietary fiber [1]. However, cabbage cultivation is vulnerable to high temperatures. Thus, cultivation is typically restricted to the highland areas of the tropics or subtropics. Breeding of heat-tolerant cabbage varieties has been a key focus of cabbage seed companies for many years [2]. In addition to heat tolerance, another research interest has been to develop improved cabbage varieties that are resistant to insects or disease and have various tastes or colors. Therefore, discovering a way to select heat-tolerant lines quickly and quantitatively will contribute to the breeding and development of new heat-tolerant cabbage varieties.
Exposure of plants to above-optimal growth temperatures affects the enzymatic activities required for many essential metabolic processes, including photosynthesis, carbon fixation and development. Thus, plants defend against heat-induced damage by retaining components required for maintenance of cellular homeostasis. In particular, molecular chaperones play critical roles in the cellular environment by helping to ensure that proteins are folded and assembled correctly. Many molecular chaperones function as heat shock proteins (Hsps) [3]. Hsps and other stress proteins protect cells against the deleterious effects of stress [49]. In some cells, Hsps are constitutively expressed. In other cells, Hsp expression is regulated by the cell cycle or development [10,11].
The five distinct classes of Hsps according to molecular weights are Hsp100s, Hsp90s, Hsp70s, Hsp60s and small Hsps (sHsps). Hsp60s are found in prokaryotes and in eukaryotic mitochondria and plastids. Hsp60s help to ensure that newly made proteins are correctly assembled [12,13]. Hsp70s are highly conserved, with at least 50% amino acid homology retained through evolution at the N-terminal ATPase domain and C-terminal peptide binding domain [14]. Hsp70s are strongly induced by heat shock and other cellular stresses. Some Hsp70s are constitutively expressed and have essential functions that are not related to stress [15]. Plants that overexpress the Hsp70 genes are tolerant to heat and have increased resistance to environmental stressors [1517]. In addition to functioning as general chaperones, Hsp70s also regulate expression of stress-associated genes [18]. In contrast to many Hsps, most Hsp90 substrates are signaling proteins, including receptors for steroid hormones and kinases. Thus, although Hsp90 plays an important role in protein folding, it also has functions in signaling, cell cycle regulation, protein turnover and localization, morphology and the cellular response to stress [12,1921]. Hsp100s are members of the large AAA ATPase superfamily and have diverse functions [22,23]. Hsp100s are important for protein disaggregation and/or degradation. Although constant expression of Hsp100s is often observed in plants, developmental processes or environmental stressors may also regulate expression [2427]. The low-molecular weight (12–40 kDa) sHsps are the most abundant group of Hsps and are uniquely expressed in higher plants. Although sHsps do not directly assist with protein folding, they do help facilitate protein folding by other ATP-dependent chaperones, probably through hydrophobic interactions with non-native proteins [2830]. The diversification of plant sHsps might be related to molecular adaptations to stress conditions that are unique to plants [15].
Heat stress transcription factors (Hsfs) are the central regulators of the heat shock (HS) stress response [31]. The overall basic structures and consensus DNA-binding sites of Hsfs are conserved from yeast to humans [32]. Plants possess large families of genes that encode Hsfs. For example, Arabidopsis plants have 21 genes that encode Hsfs, and rice plants have 23 Hsf genes. In contrast, yeast have one Hsf gene, and humans have three Hsf genes [6,31]. In addition, 28 Poplus trichocarpa Hsfs and 16 Medicago truncatula Hsfs were identified through bioinformatics analyses. Seventeen Hsfs have been identified in tomato from expressed sequence tags (ESTs) [33,34]. There are three groups of plant Hsfs (A, B and C). These groups are based on the length of the area between the DNA-binding domain and the hydrophobic coiled-coil region of the Hsf protein. The consensus Hsf binding sequence, “nGAAnnTCCn”, is located in the promoter region of many defense genes. Thus, plant Hsfs control expression of genes that have overlapping or flexible functions in the response of plants to various environmental stressors [35].
In this report, to provide a way to quickly determine cabbage heat tolerance at the young stage and in vitro, expression levels of heat stress and secondary metabolism-related genes were examined in young heat-tolerant cabbage lines (HTCLs) and young heat-sensitive cabbage lines (HSCLs), which were grown in normal conditions (NS) or at a high temperature (HS), reexamined to distinguish heat shock tolerance in the early stage of four HTCLs and four HSCLs in the heat stress condition using qRT-PCR. In addition, expression levels of secondary metabolism-related genes between an HTCL and HSCL were evaluated.

2. Results

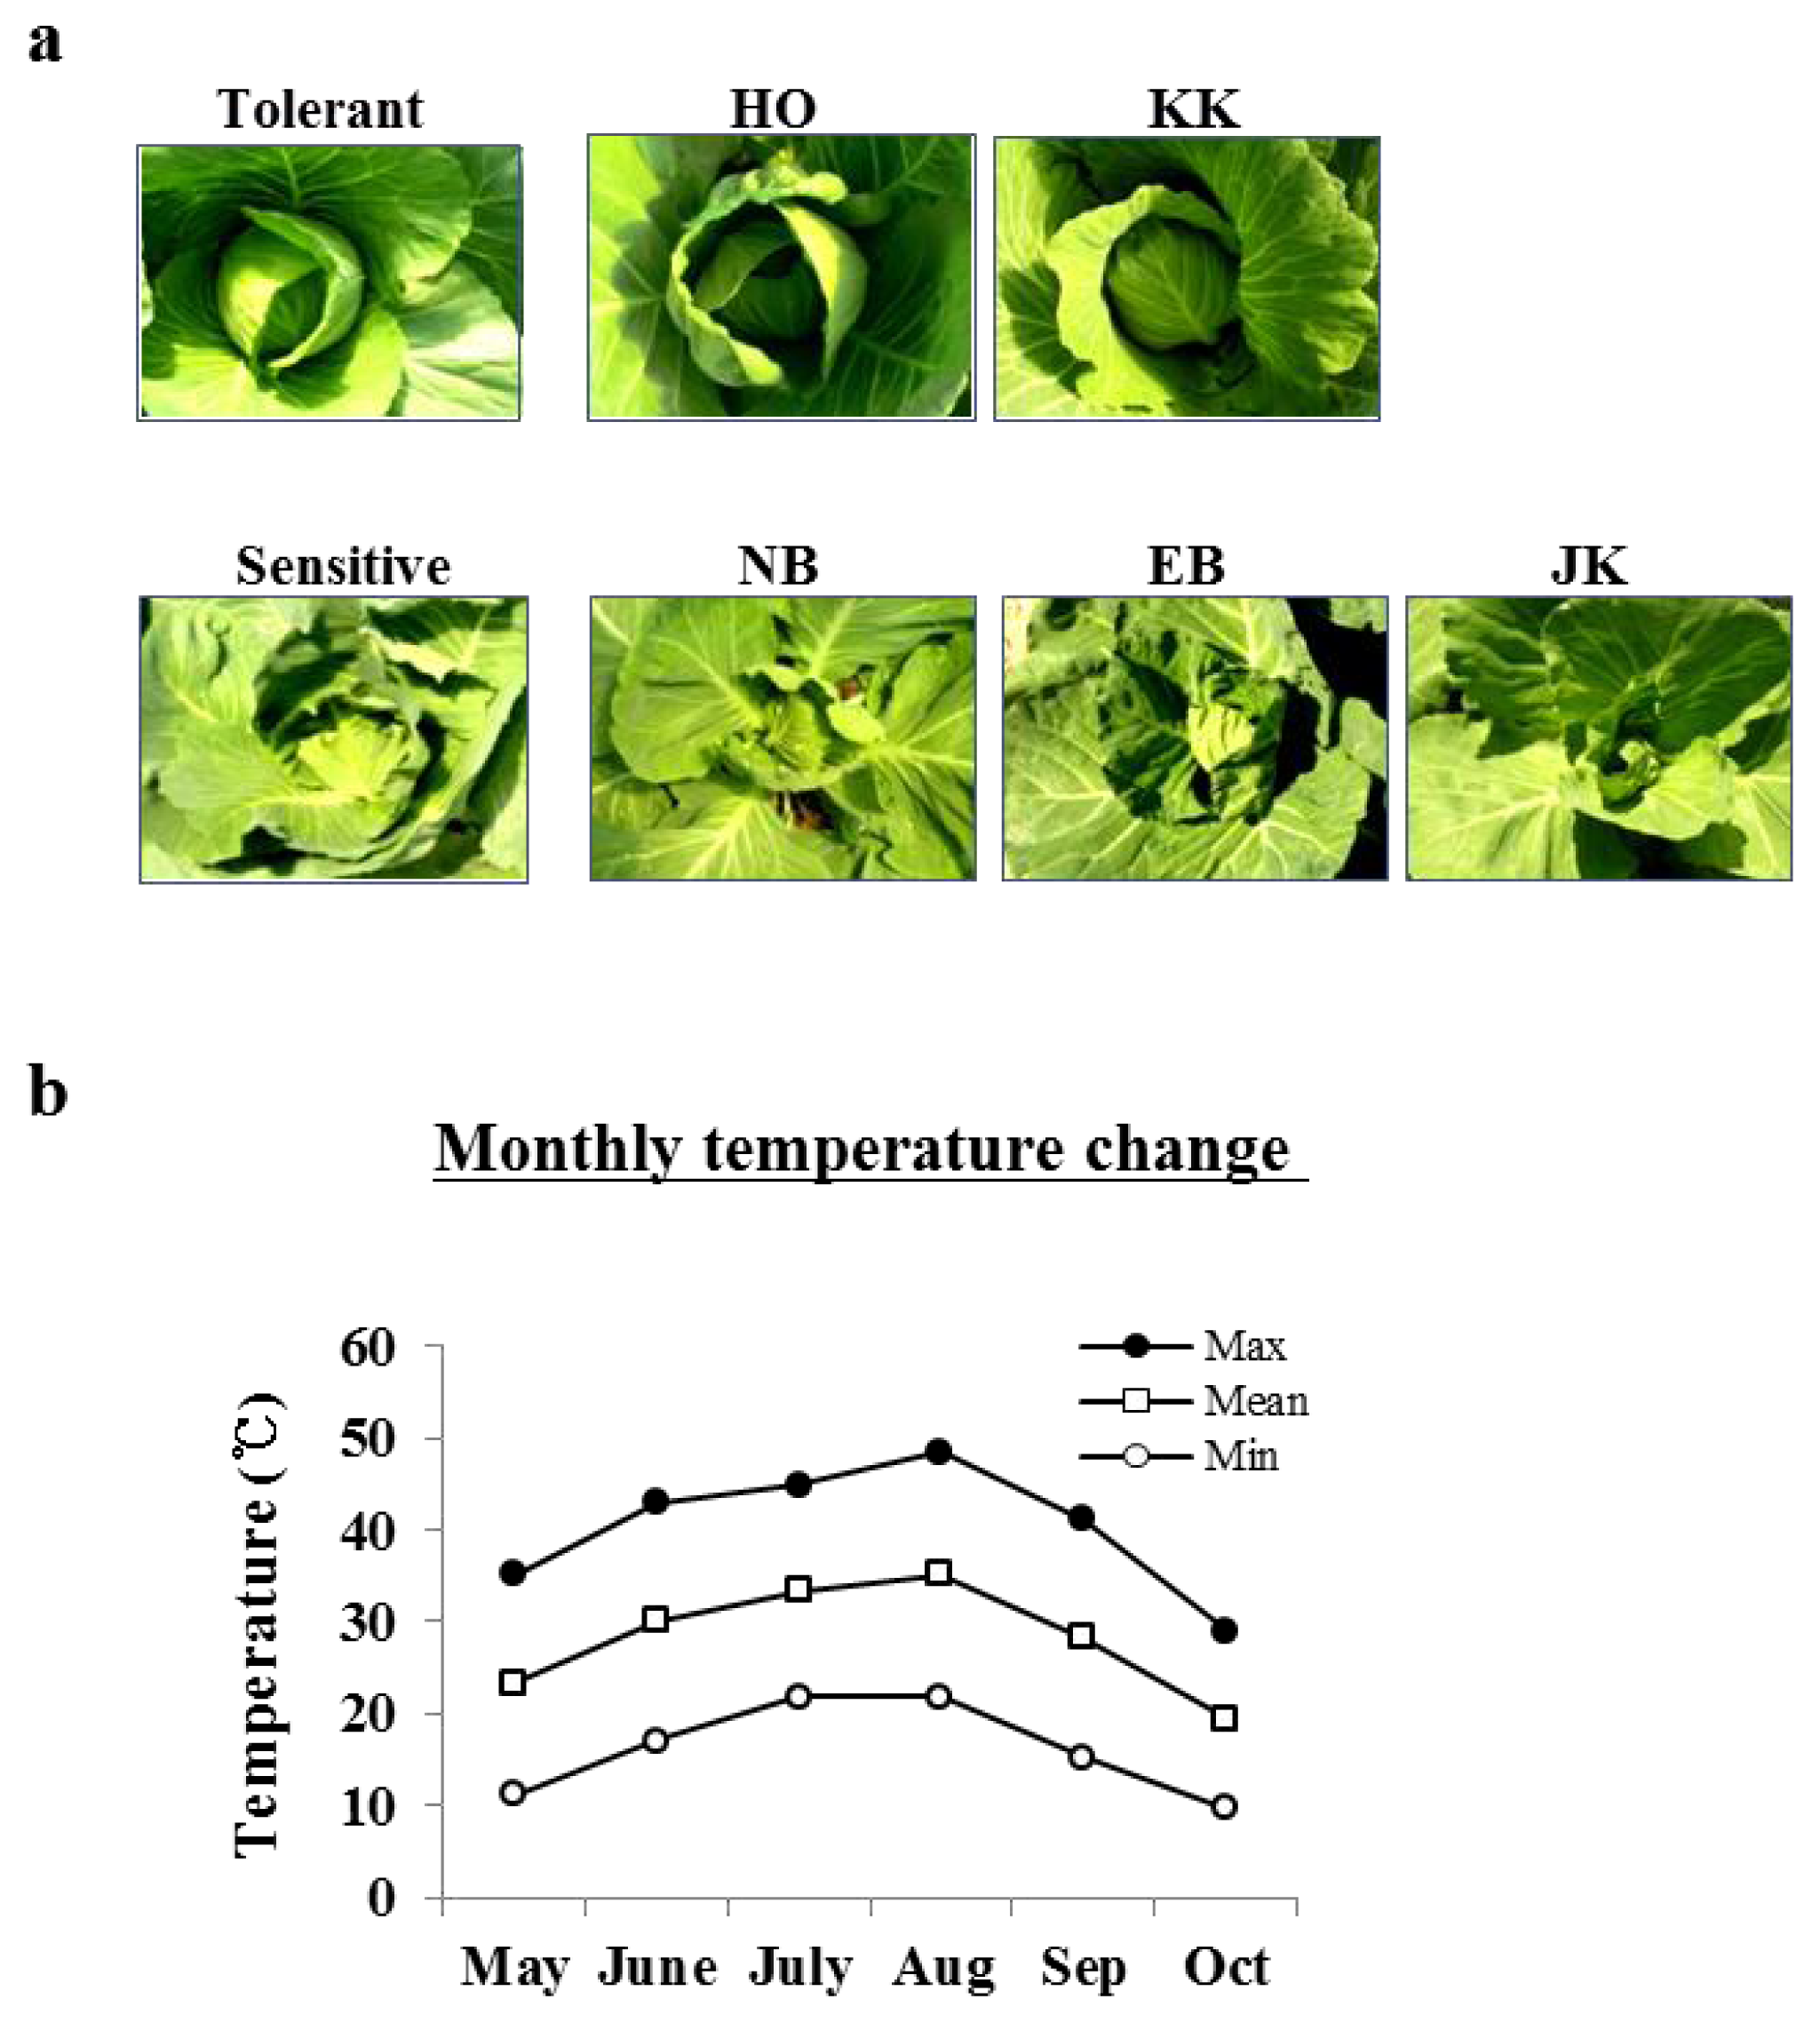
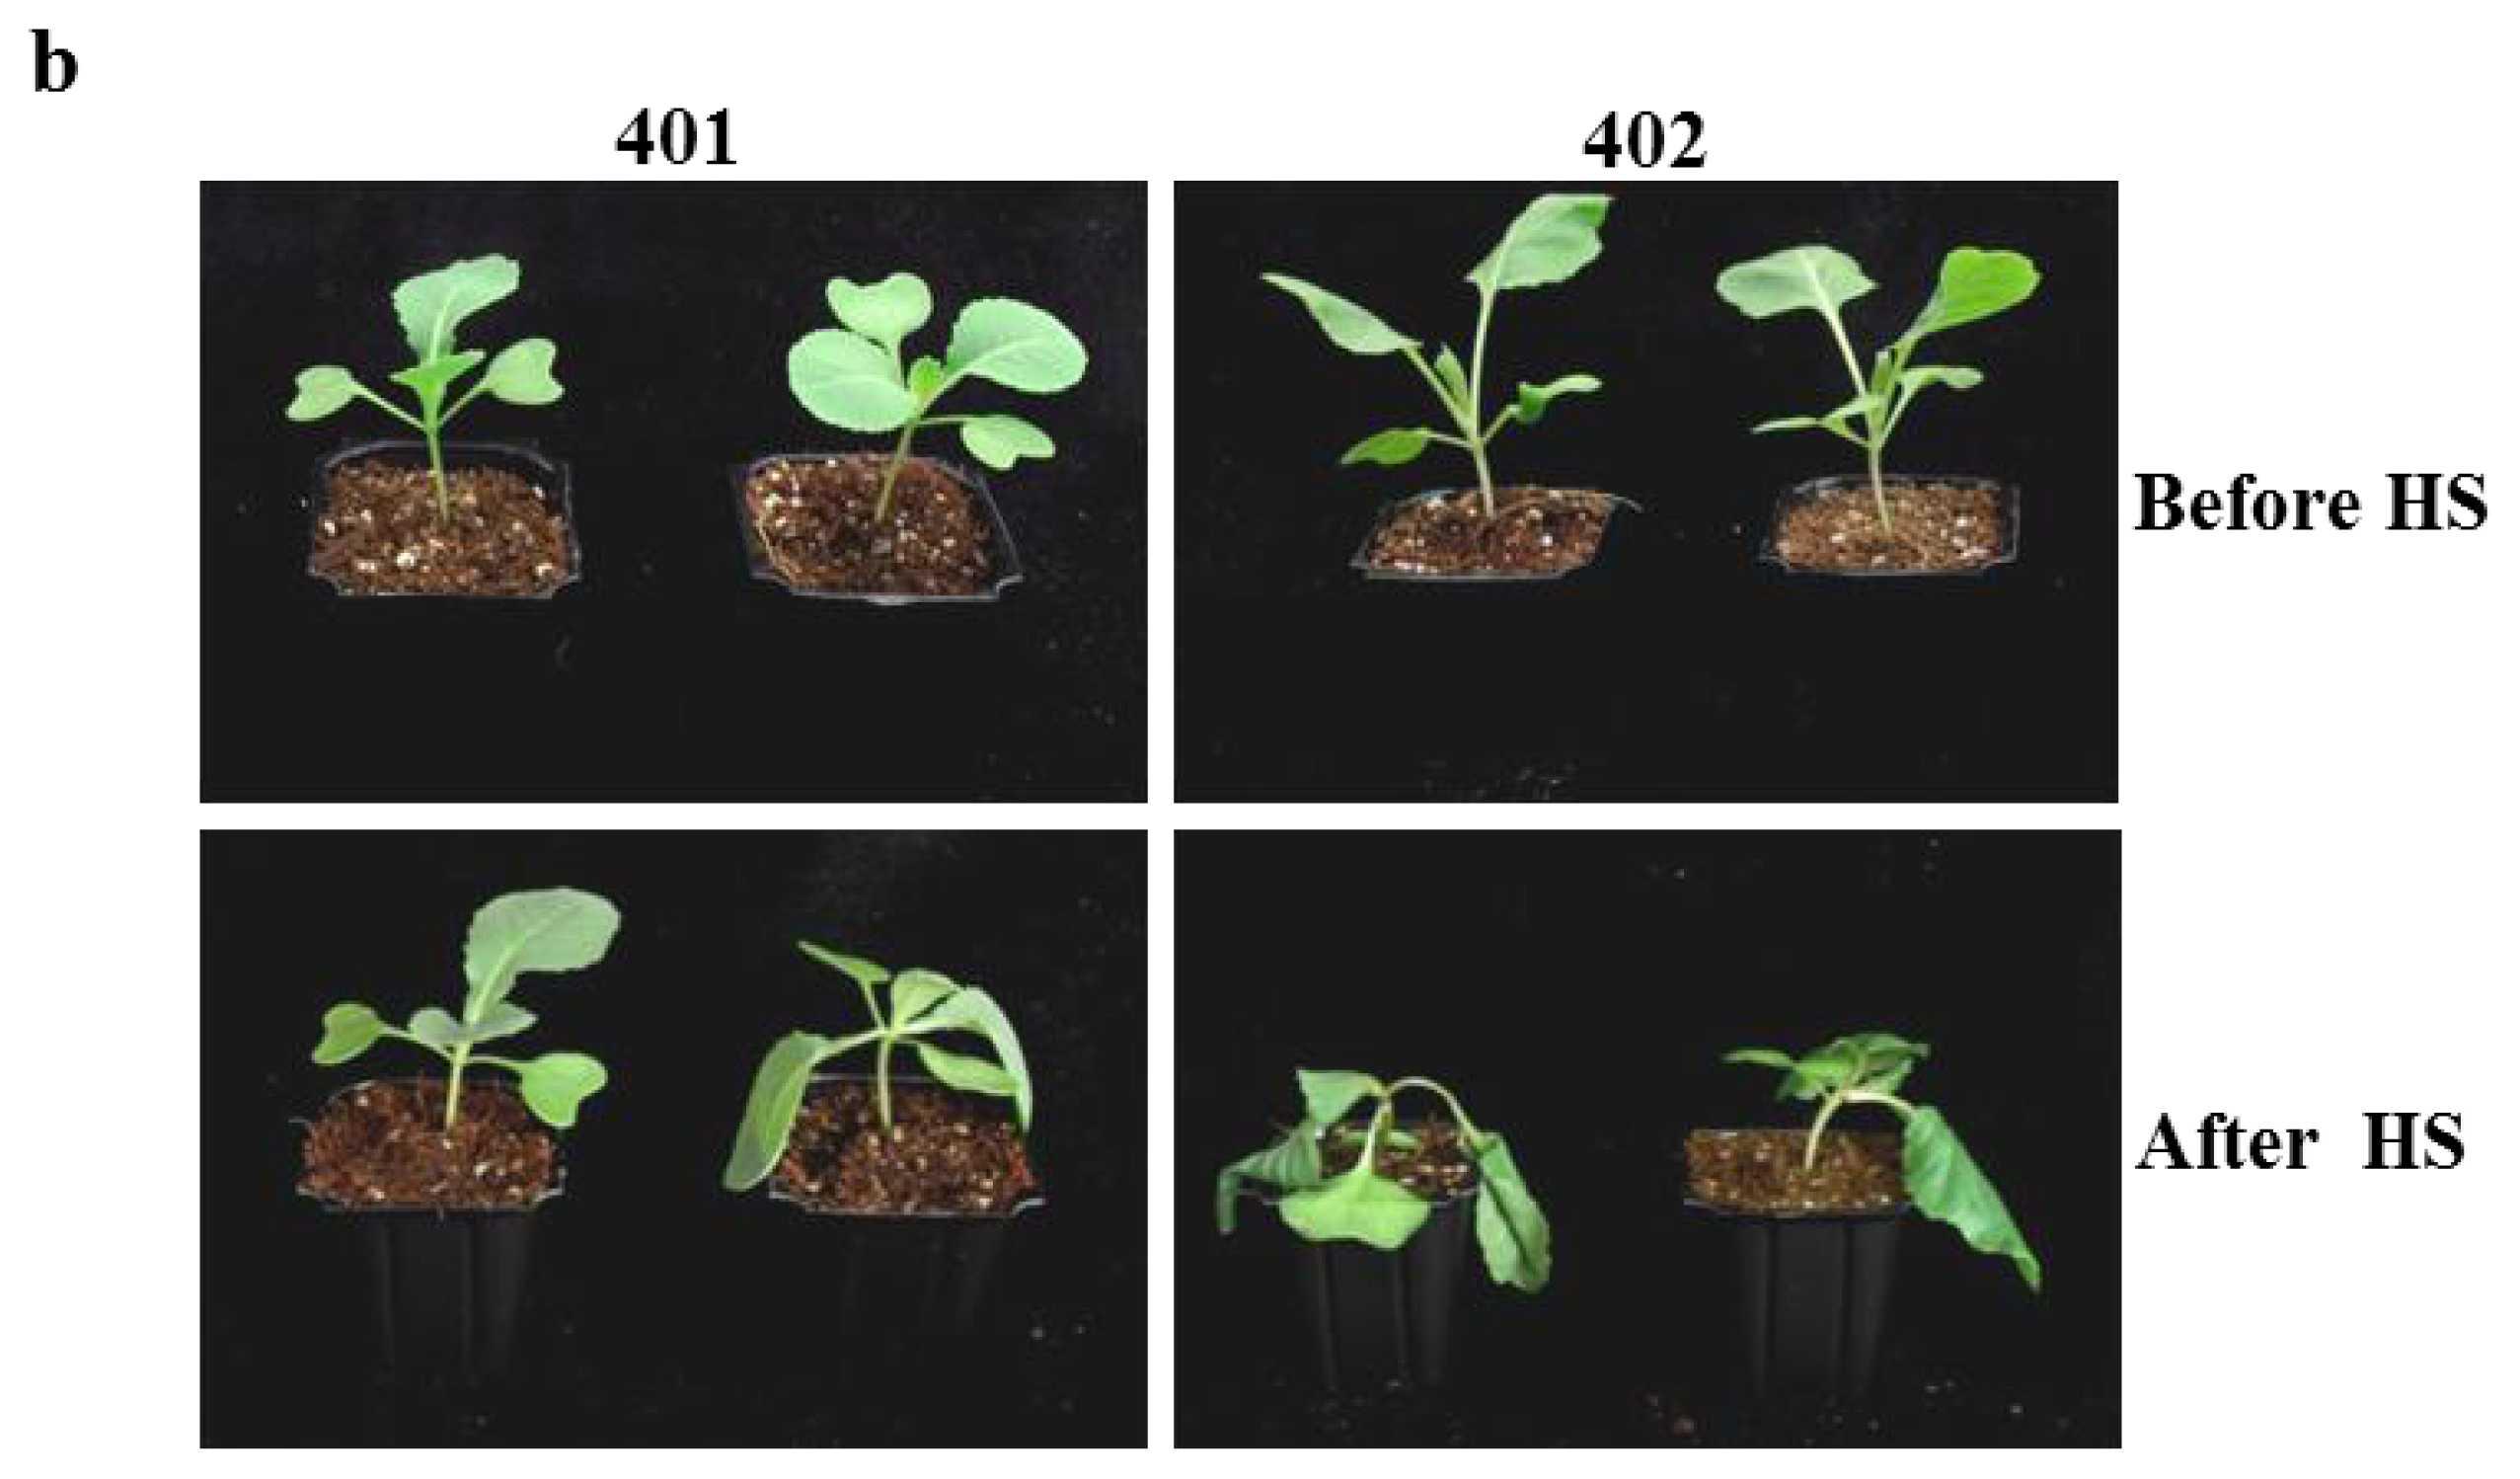
2.1. The Phenotypic Differences between HTCLs and HSCLs at a High Temperature

Cabbage head formation depends on a significant genotype-environment interaction [36]. Thus, the main phenotypic difference that we examined between HTCLs and HSCLs was the ability to form cabbage heads at a high temperature. Inbred HTCLs started to form heads during the vegetative growth period, whereas inbred HSCLs did not (Figure 1a). The HTCLs “HO” and “KK” and the HSCLs “NB”, “EB” and “JK” were developed by the Asia Seed Company and cultivated from May 2011 to October 2011 at a company greenhouse in the Gyeonggi-Do area. Photos were taken on October 10, 2011. Although the leaf position at which head formation started (LPH) varied between the two HTCLs, both lines started normal head formation (data not presented). In contrast, the three HSCLs showed poor head formation. Temperature changes in the greenhouse during the growth period for the cabbage lines are shown in Figure 1b. The maximum temperature at midday exceeded 40 °C from June and reached a maximum of 48.5 °C in August.

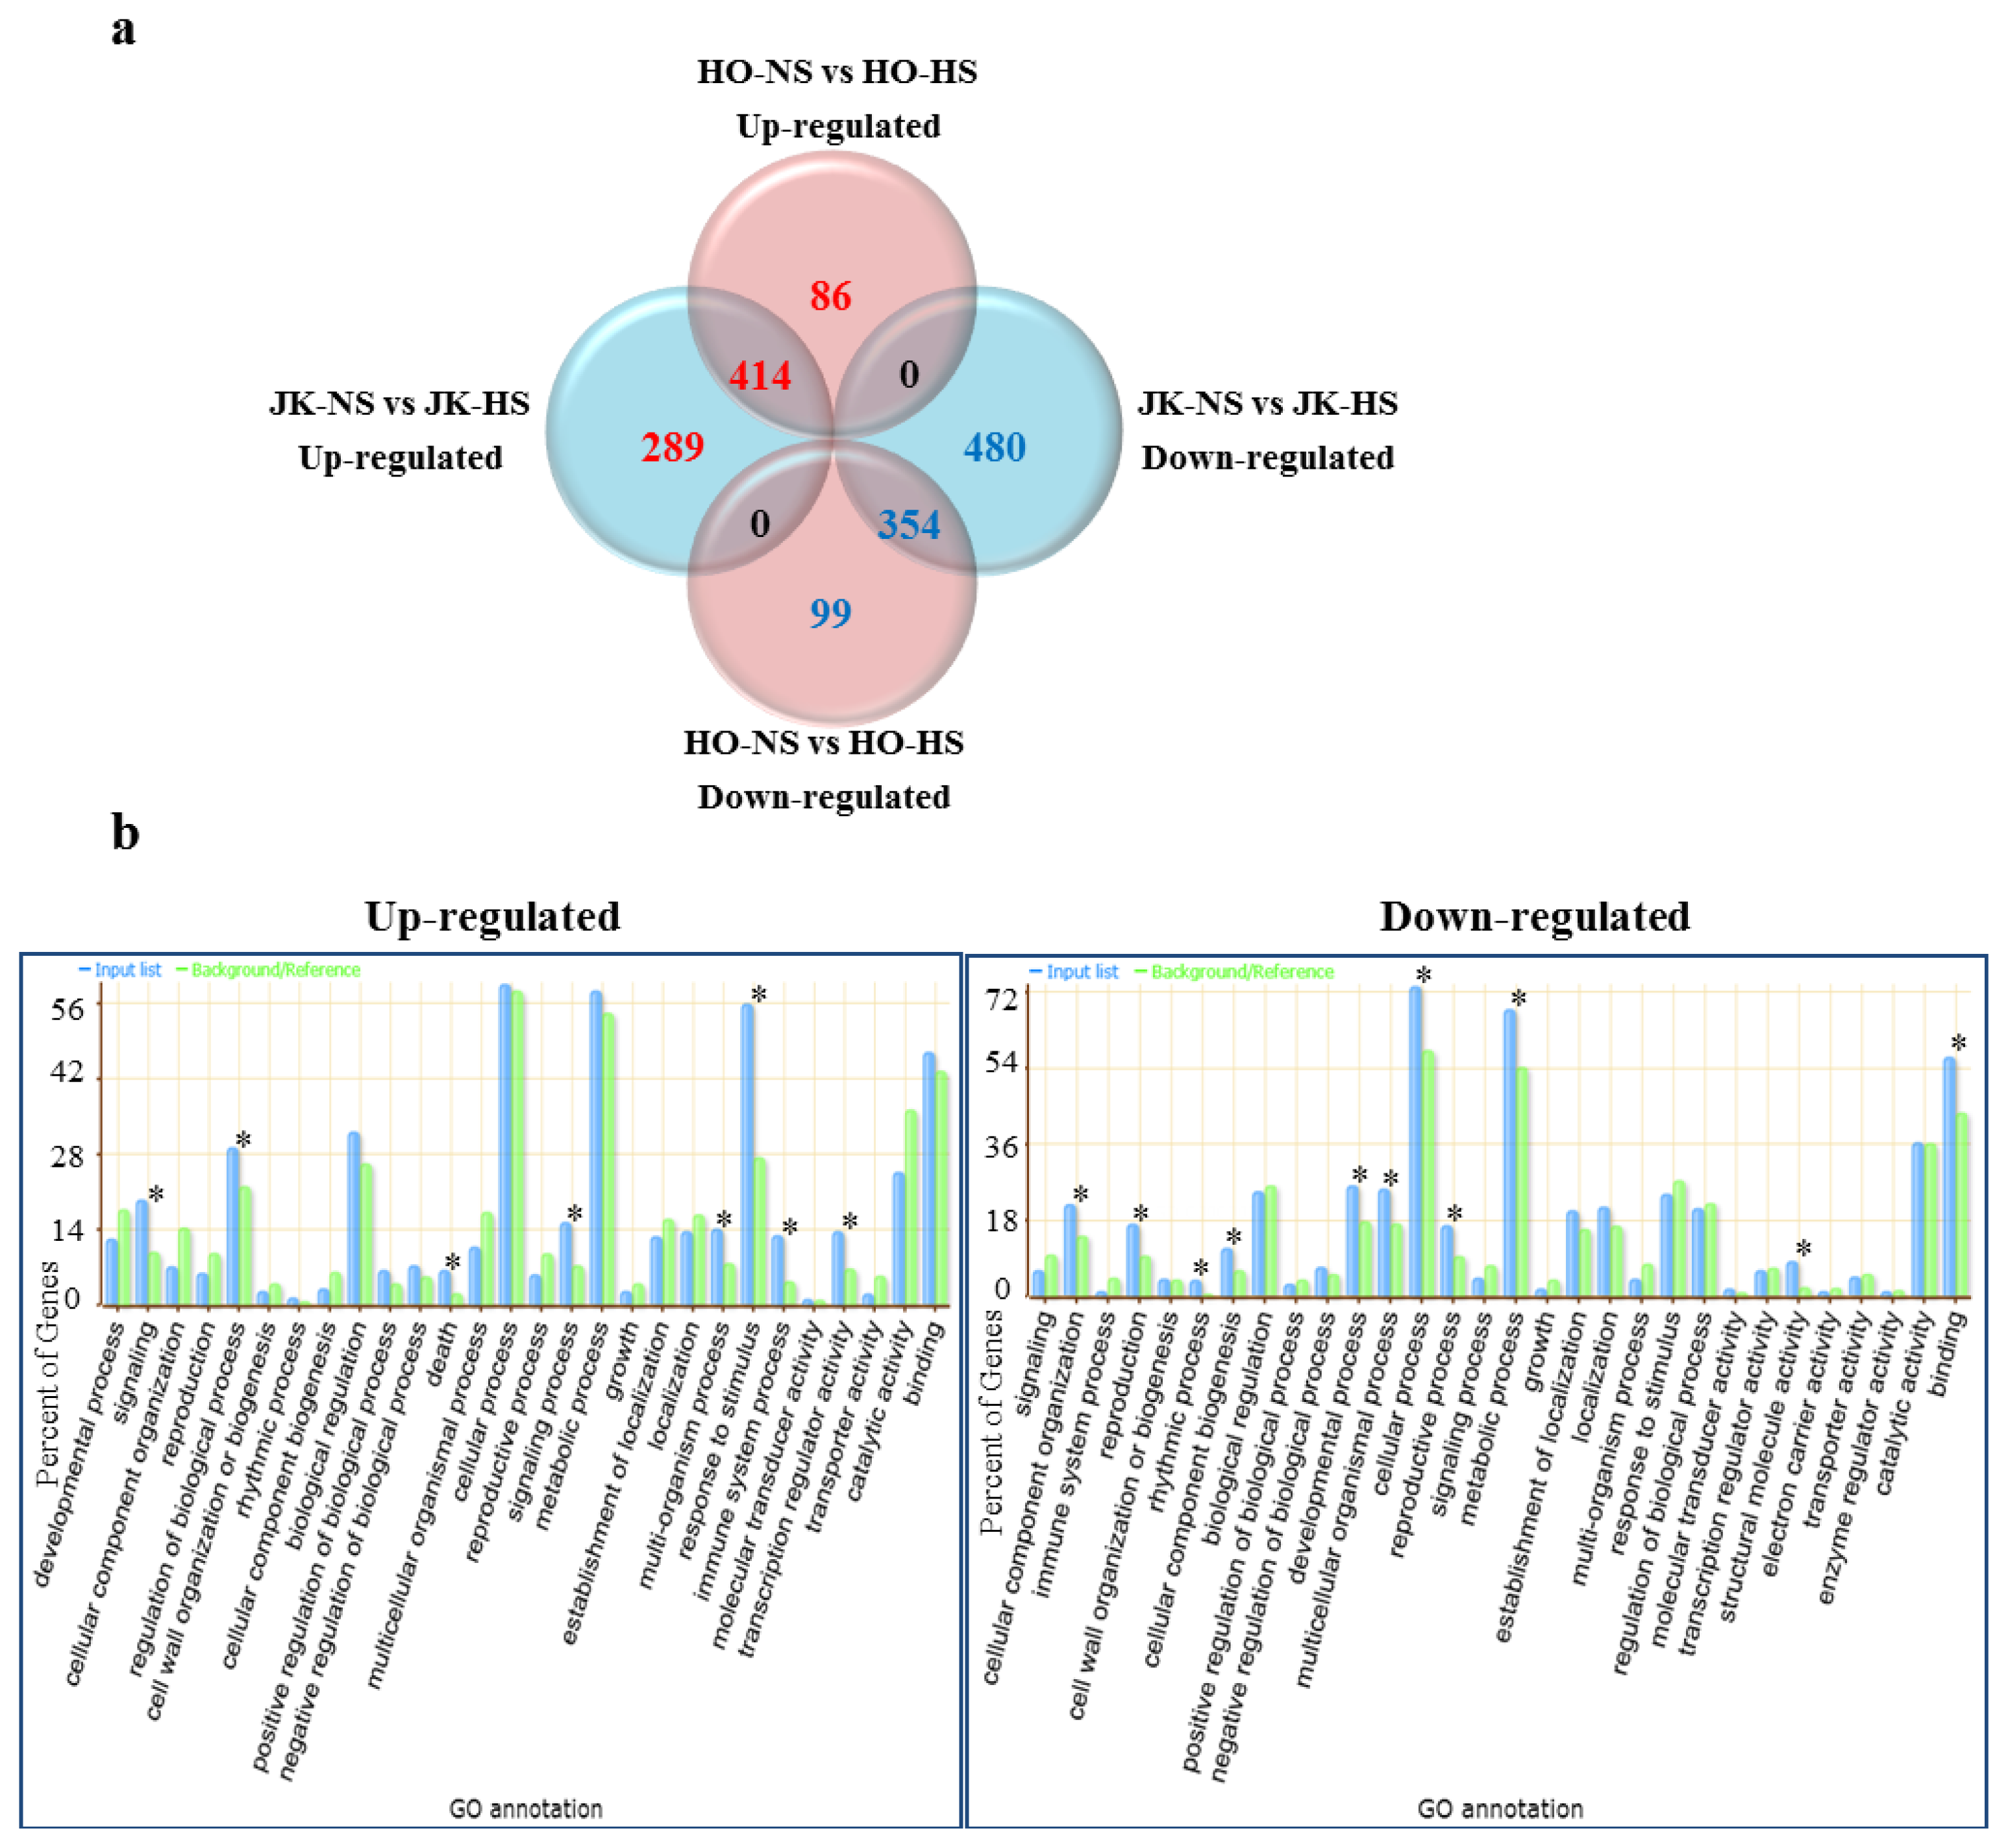
2.2. Heat Stress-Responsive Transcriptome between HTCL “HO” and HSCL “JK” by Brassica Microarray

Expression analyses were performed on two inbred lines (“HO” for HTCL and “JK” for HSCL) at an early developmental stage (two-week-old, young plants) in HS and NS conditions on an Agilent Brassica GE 2 × 10⁵k microarray. In the HTCL “HO” line, 500 and 453 transcripts were differently up- and down-regulated in the HS and NS condition, respectively. In the HSCL “JK” line, 703 and 834 transcripts were identified as being up- and down-regulated in the HS and NS condition, respectively (data not shown).

2.3. Functional Categories of Heat Stress Response Genes in Cabbage

Venn diagram analysis identified 414 and 354 transcripts with significant changes in expression in response to heat stress in HTCL and HSCL, respectively (Figure 2a). We further characterized genes that have significant GO terms (p ≤ 0.05) in biological processes and molecular functions with the agriGO web-based GO analysis toolkit [37] and Arabidopsis orthologs. The GO annotation of upregulated genes in both cabbage lines in the HS condition revealed that 414 genes were significantly assigned with GO terms for signaling, regulation of biological processes, immune system processes, death, multi-organism processes, response to stimuli and regulation of transcriptional activity (Figure 2b). Among the GO terms associated with response to stimuli in biological processes, the most significant categories were response to chemical stimuli, chitin, heat, light intensity and stress. Transcriptional regulator activity was the only significant molecular function category. Many of the genes were heat stress-responsive genes, like HSPs, and showed a high level of expression. Similarly, 354 genes were downregulated in the HS condition. GO terms were assigned for genes involved in development, multicellular organisms, reproduction organization of cellular components, rhythmic processes, cellular processes, metabolic processes, cellular component biogenesis and structural molecule activity and binding (Figure 2b). The GO terms for biological process included a large range of GO categories, which were other cellular processes, other metabolic processes, developmental processes, cell organization and biogenesis, DNA or RNA metabolism, one-carbon metabolic processes and protein metabolism. GO terms for the molecular function indicated that the genes represented GO categories, such as other binding, DNA or RNA binding, hydrolase activity, nucleotide binding, other enzyme activity, transferase activity, protein binding, structural molecular activity and others. Many genes encoded ribosomal proteins, binding proteins and enzyme activity-related genes, all of which showed low expression patterns.

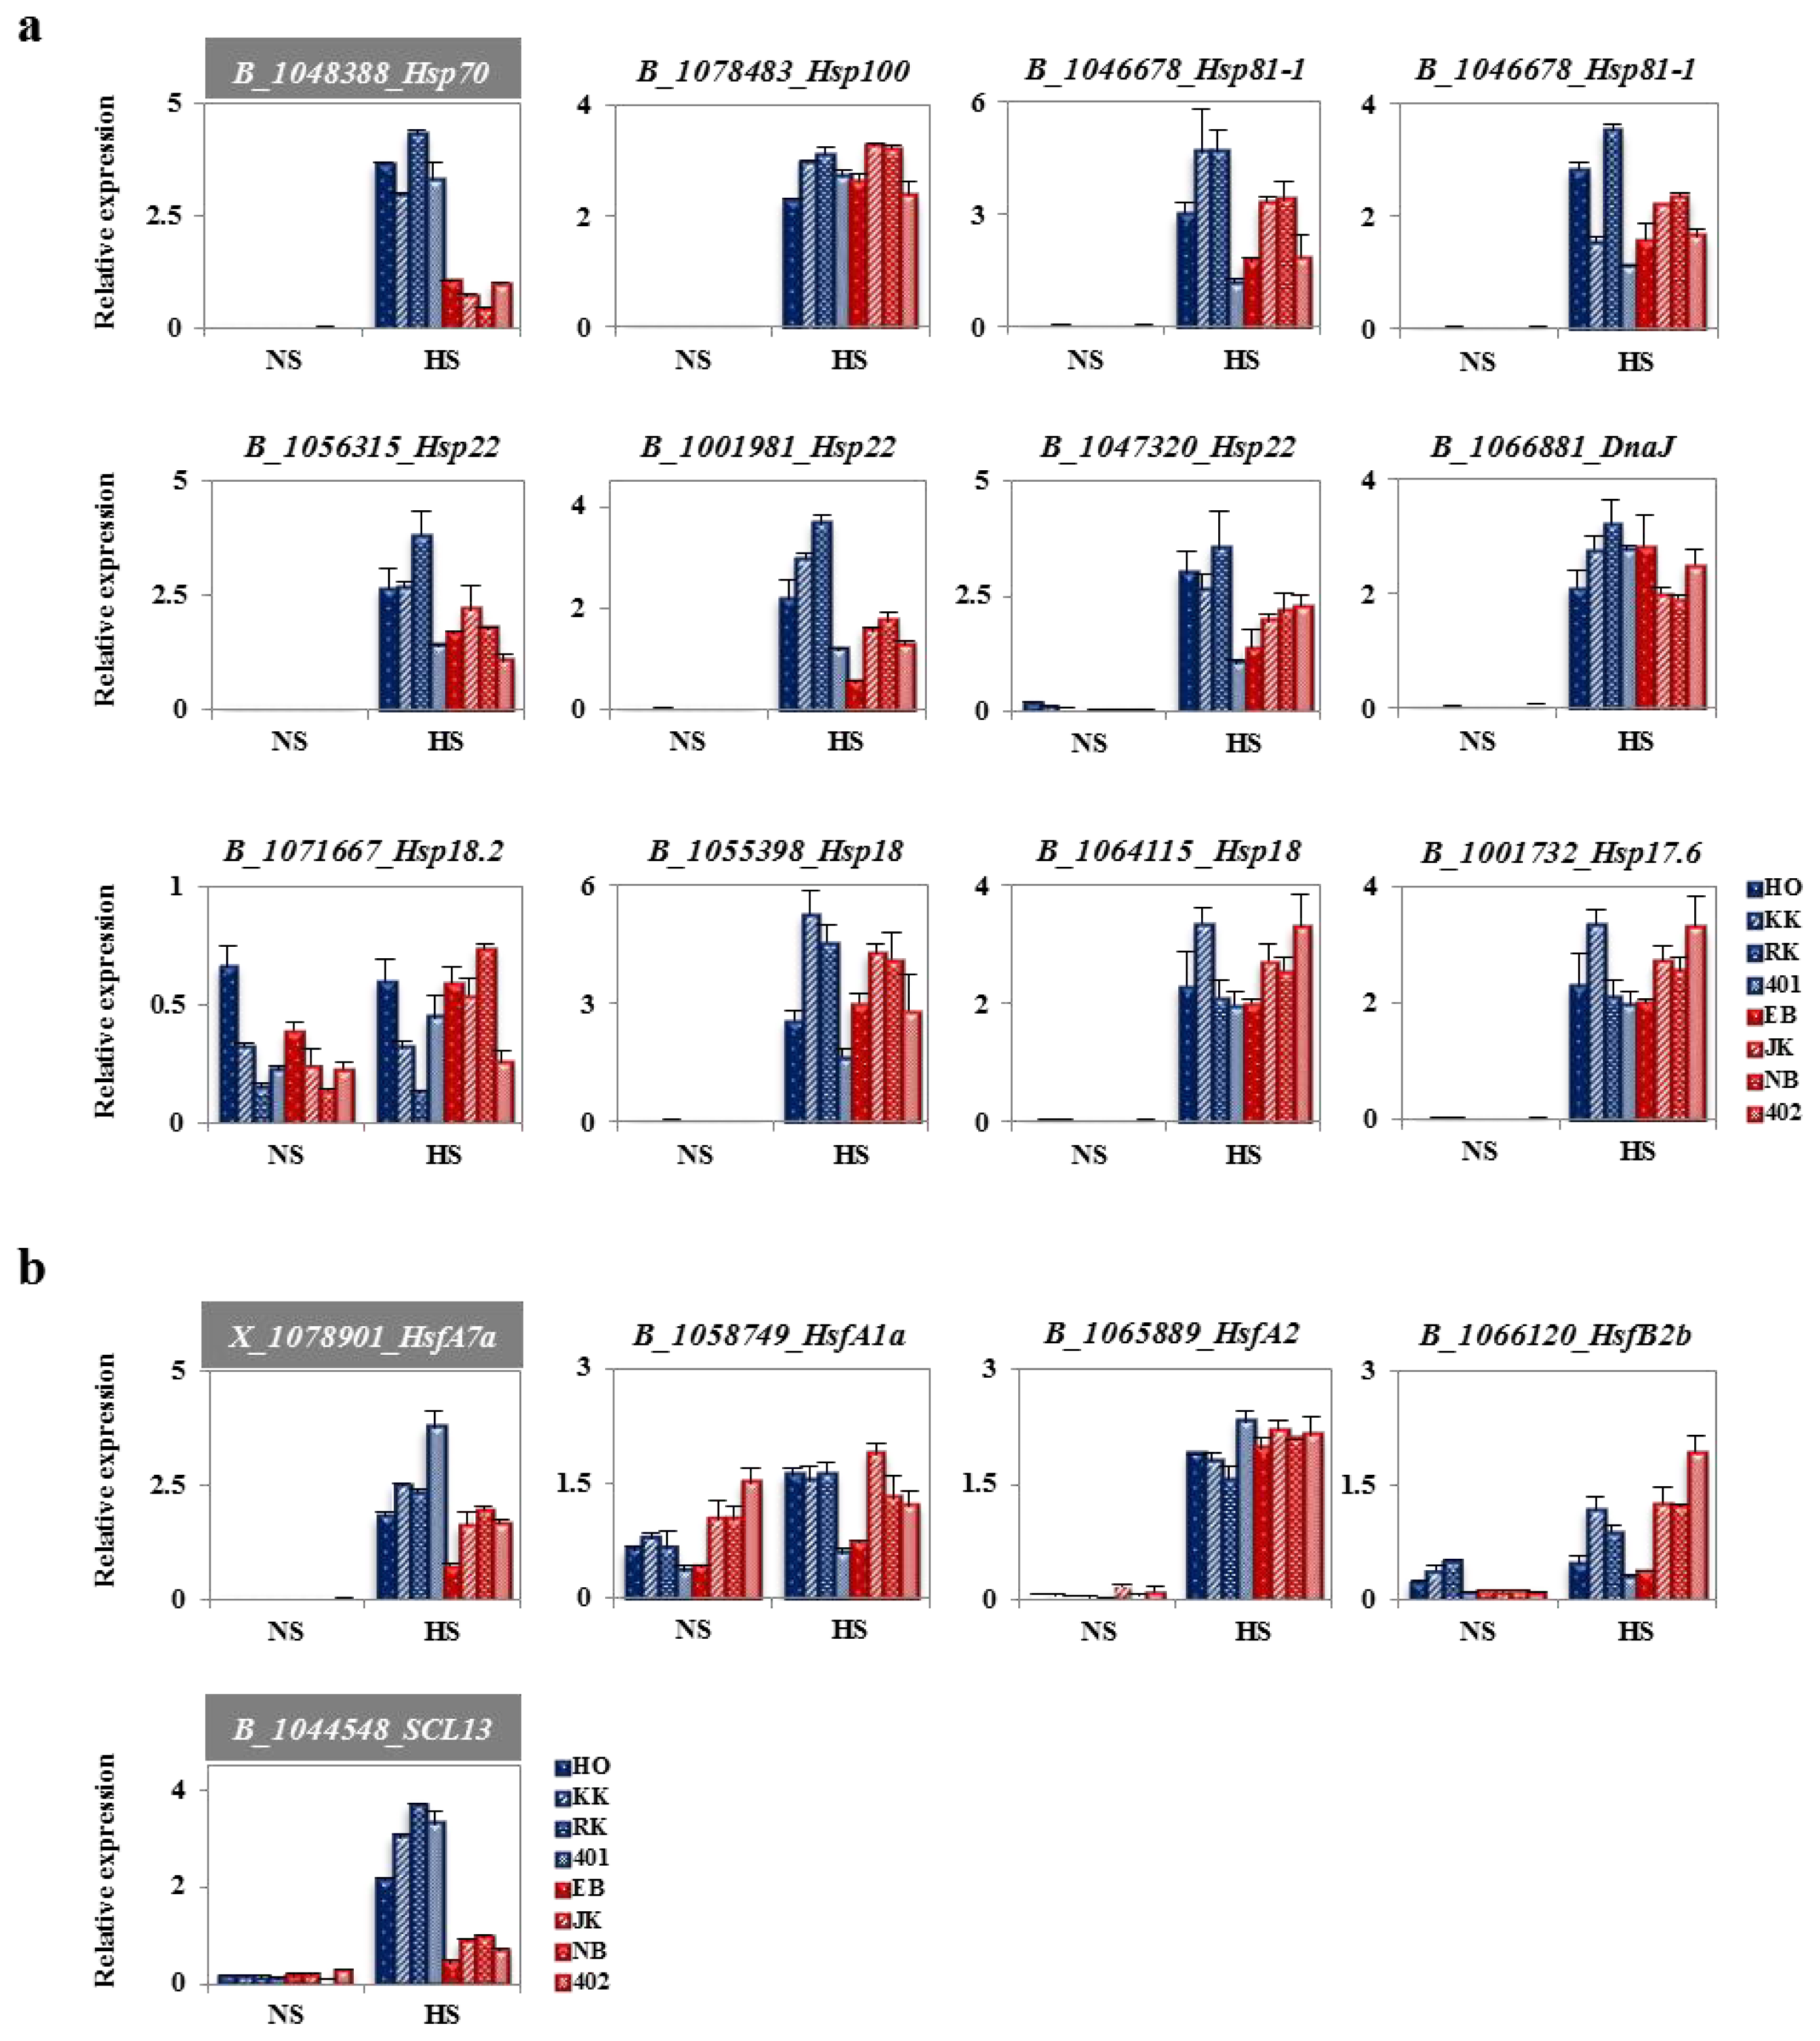
2.4. Heat-Responsive HSPs and HSFs from Genechip Analysis

HSPs play important roles in response to environmental conditions and in various developmental processes. To identify heat stress-responsive Hsp genes, we identified Hsp genes that showed very high expression patterns in inbred cabbage lines by microarray analysis. Only 40 genes (24 Arabidopsis orthologs) were identified from the 103,748 Brassica unigenes (Table 1). Thirty-eight genes were upregulated in both lines. Two genes were downregulated in both lines. These 40 Hsp genes were classified as hsp100, hsp90, hsp70, small-hsp and unclassified. Seven HSP genes were identified as being differentially upregulated with FC ≥ 50, and 12 genes had greater than 10-fold changes in expression levels. Furthermore, we found that most of HSPs were upregulated by HS. Eleven HSF genes (five Arabidopsis orthologs) were identified from the unigenes (Table 2) and were significantly upregulated by heat stress response. These genes were induced by more than ten-fold in HS compared to NS in both HTCLs and HSCLs. However, BoHsfB1, BoHdfA7b and BoHsfA4c were excluded from this study, because their expression levels did not change more than four-fold (data not shown). Before identifying heat shock-related genes, we carried out qRT-PCR analyses to verify the Genechip data. The first group of upregulated genes in the HS condition, B_1087048, B_1044548 and B_1048388 (probe from Brassica unigene), were increased in HS compared to NS, whereas the downregulated genes in the HS condition, B_102942, B_1036869 and B_1081233, were decreased in HS compared to NS (Figure 3a,b). These results demonstrate that Genechip analysis can select heat shock response genes.

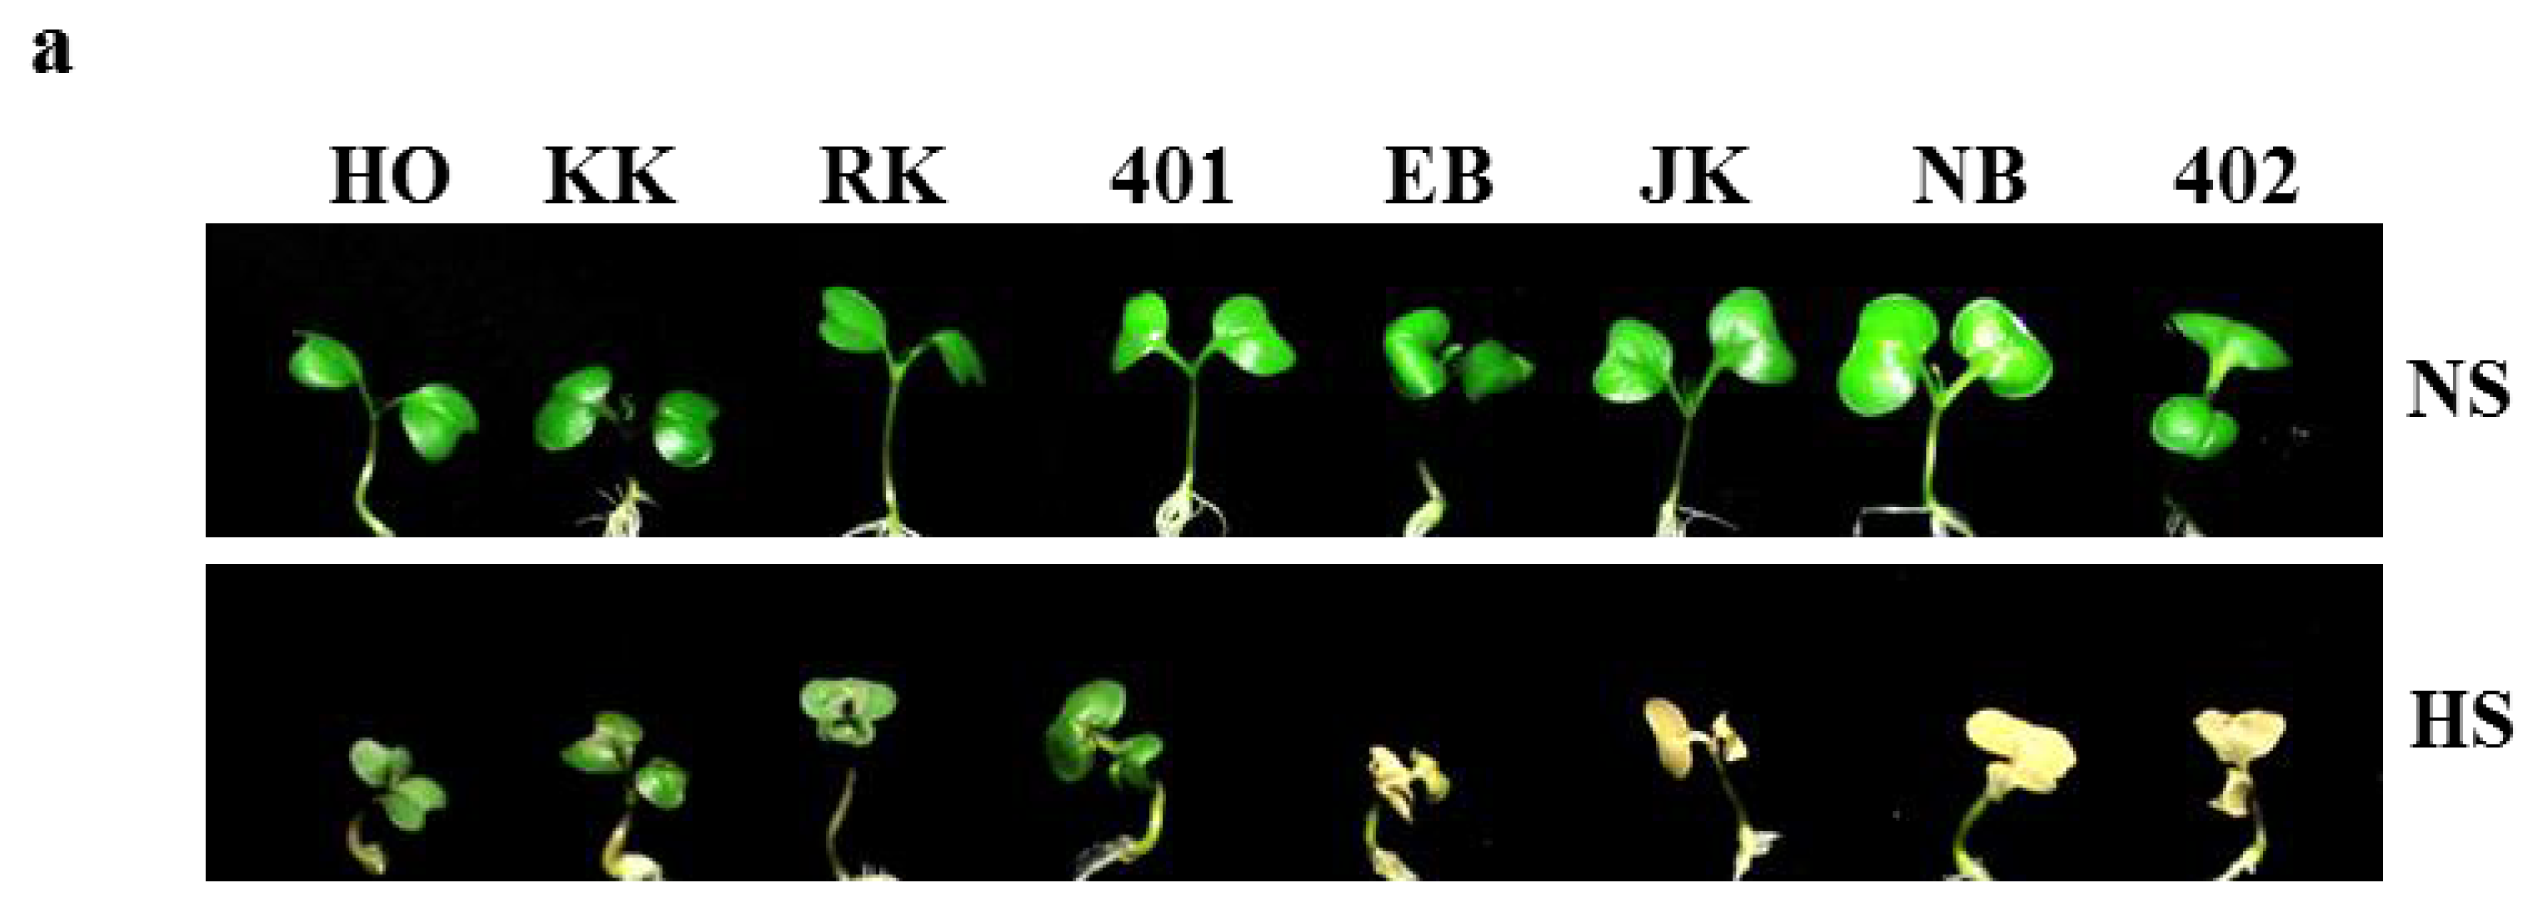
2.5. Heat Shock Phenotypes of HTCLs and HSCLs in Vitro

To evaluate the phenotype of HTCLs, “HO”, “KK”, “RK” and “401”, and HSCLs, “EB”, “JK”, “NB” and “402”, one-week-old seedlings were treated in a 42 °C incubator for 5 h followed by recovery to normal temperature (24 °C). All of the HTCLs showed obvious heat-tolerant phenotypes in the HS stress condition compared to all of the HSCLs (Figure 4a). However, no differences were observed between HTCLs and HSCLs at the seedling stage in the NS condition. Cotyledon expansion and emergence of new leaves were normal and not much different in all eight plant lines at 24 °C. However, HS exposure had a considerable impact on seedlings. The effects revealed significant differences between HTCLs and HSCLs. The green cotyledon was maintained in both NS and HS conditions. However, the HSCLs, “EB”, “JK”, “NB” and “402”, showed a necrotic phenotype with yellowish stems and leaves and eventually died (Figure 4a) at the HS condition. Next, in soil-planted conditions, two-week-old, young HTCL “401” and HSCL “402” plants were heat-shocked at 42 °C for 4 h and then recovered at 24 °C. HTCL “401” showed minor growth retardation on the third day after heat stress, but HSCL “402” showed severe leaf-bending, wilting and senescence at the HS condition. These data are consistent with the results presented in Figure 1a (Figure 4b). Similar to “401” and “402”, differences in heat stress phenotypes were observed between other young HTCLs and HSCLs grown on soil conditions (data not shown). From these results, we confirmed that there is a correlation between field test results for heat shock phenotype and in vitro culture conditions in HTCLs and HSCLs. Thus, these inbred lines provide resource material for studying the heat stress-tolerant trait in cabbage crops. We compared the expression levels of heat shock response genes in these inbred lines.

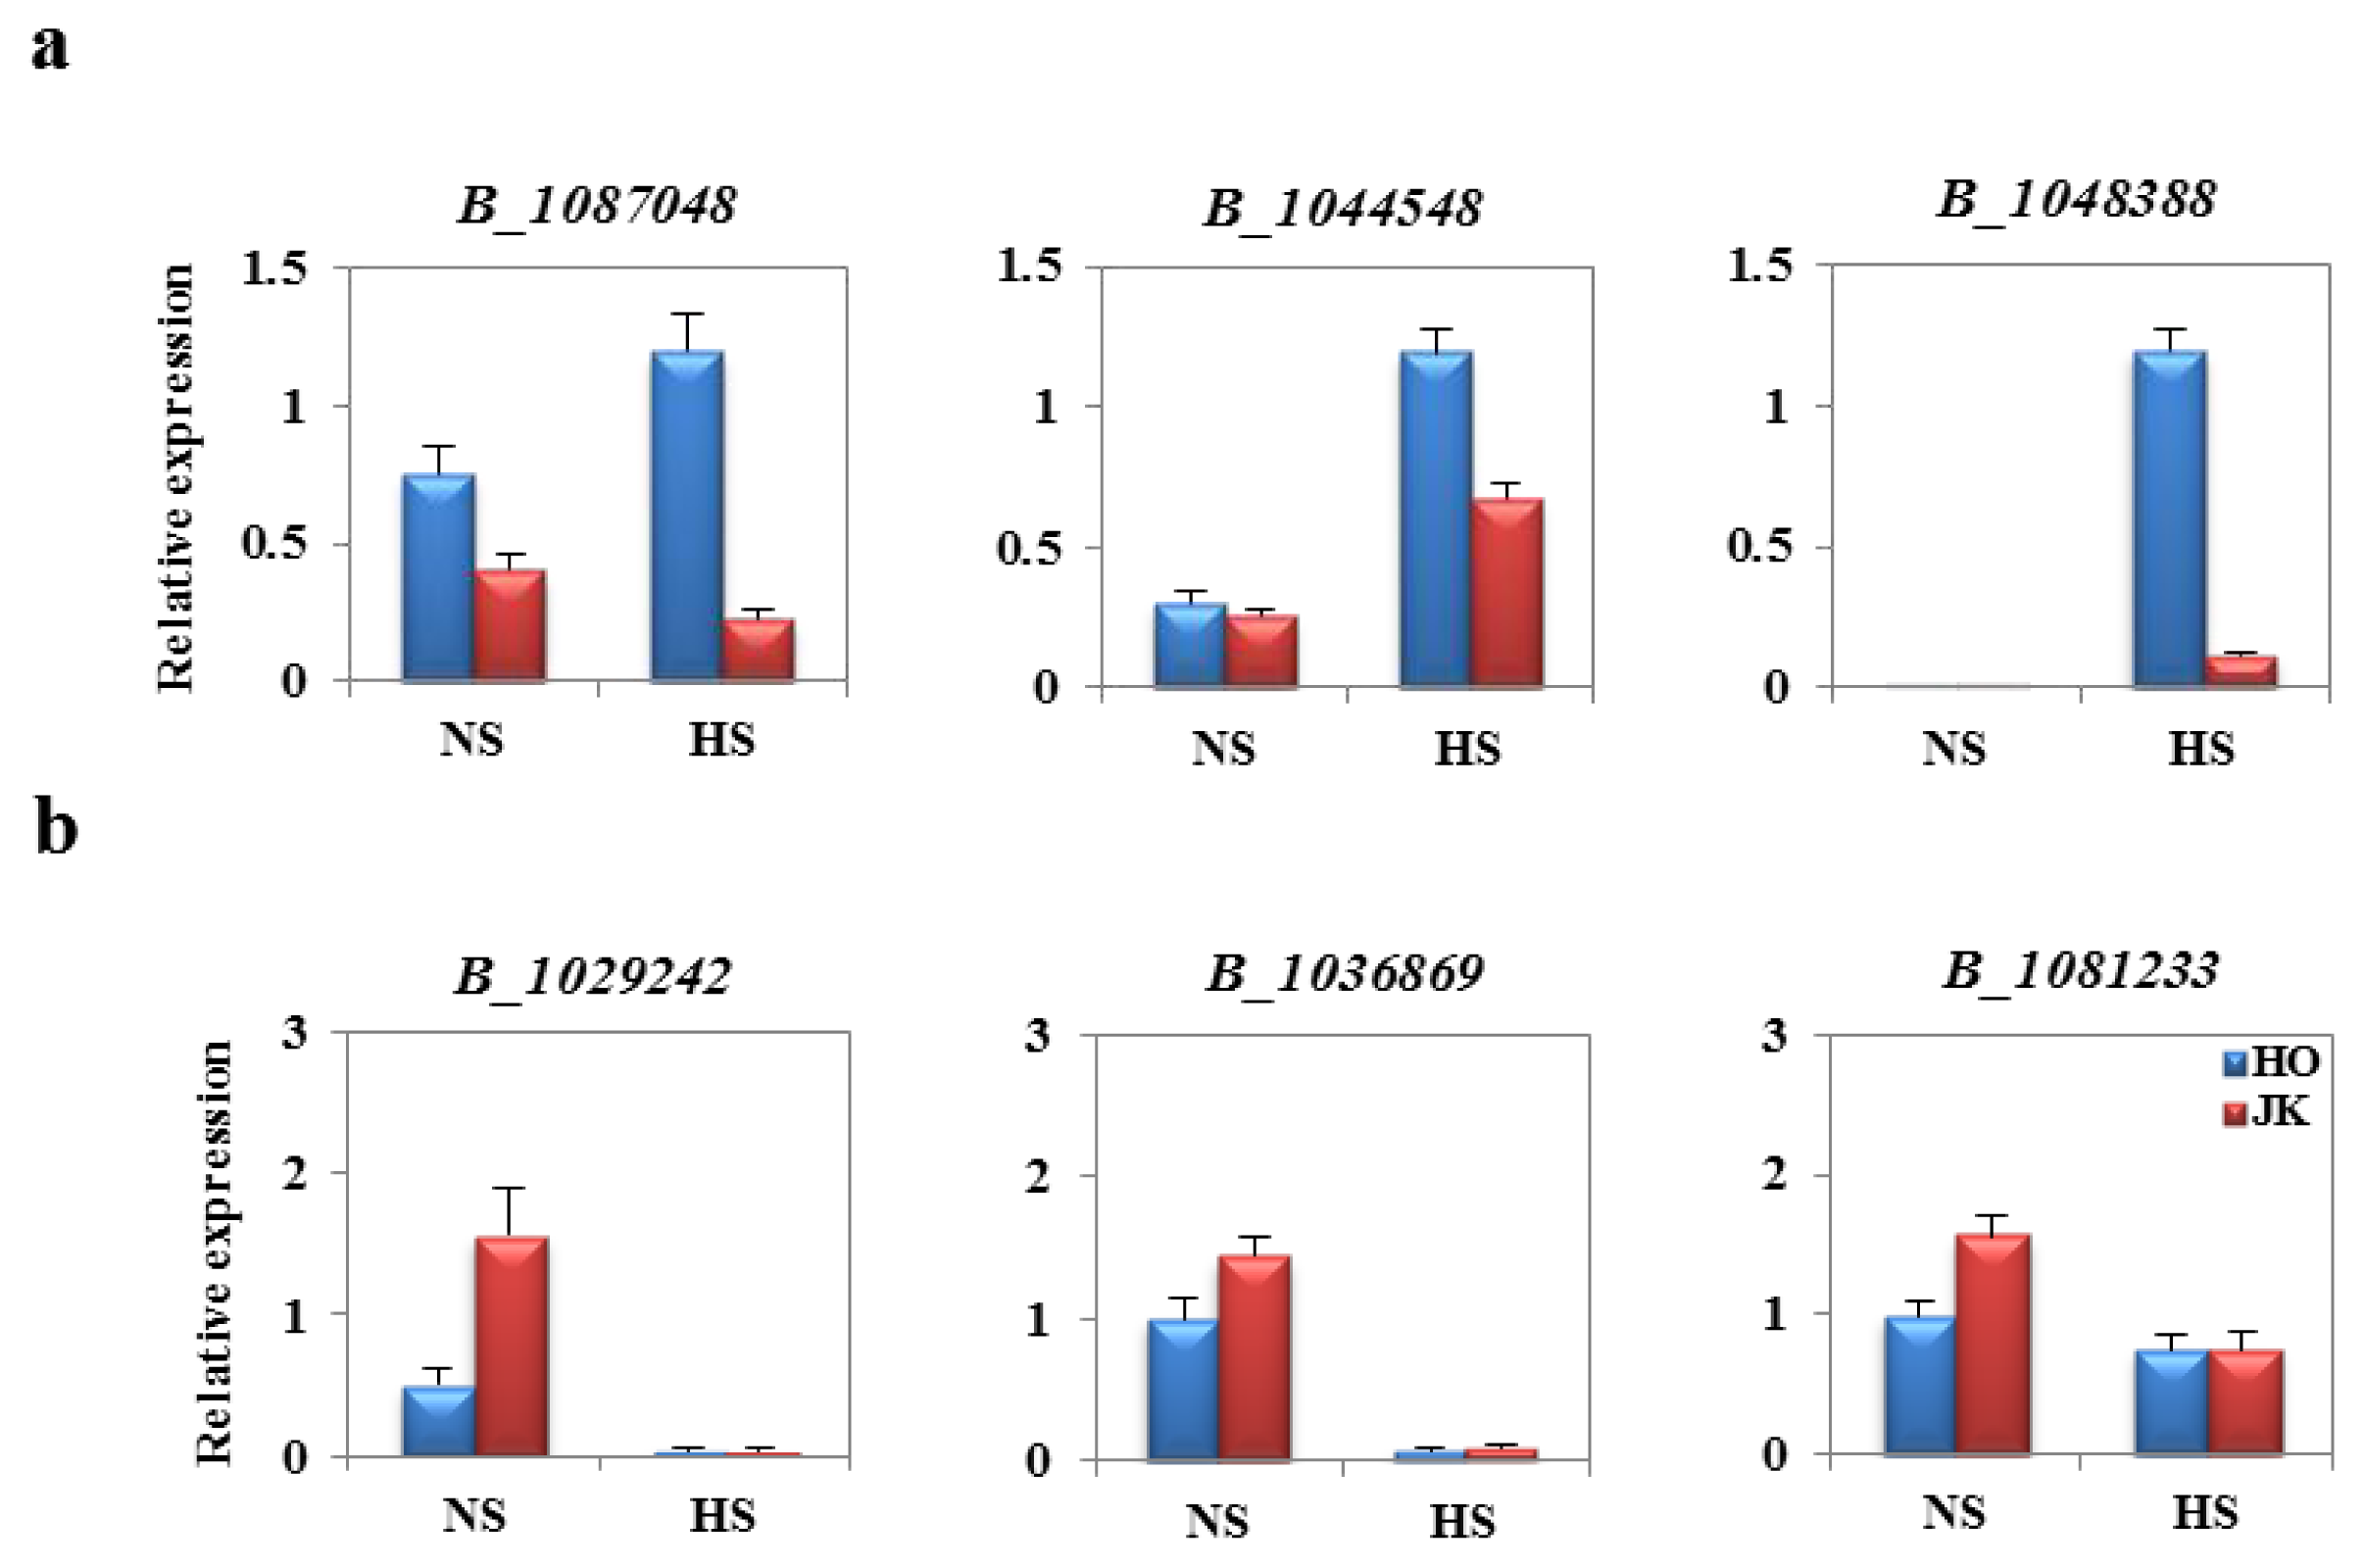
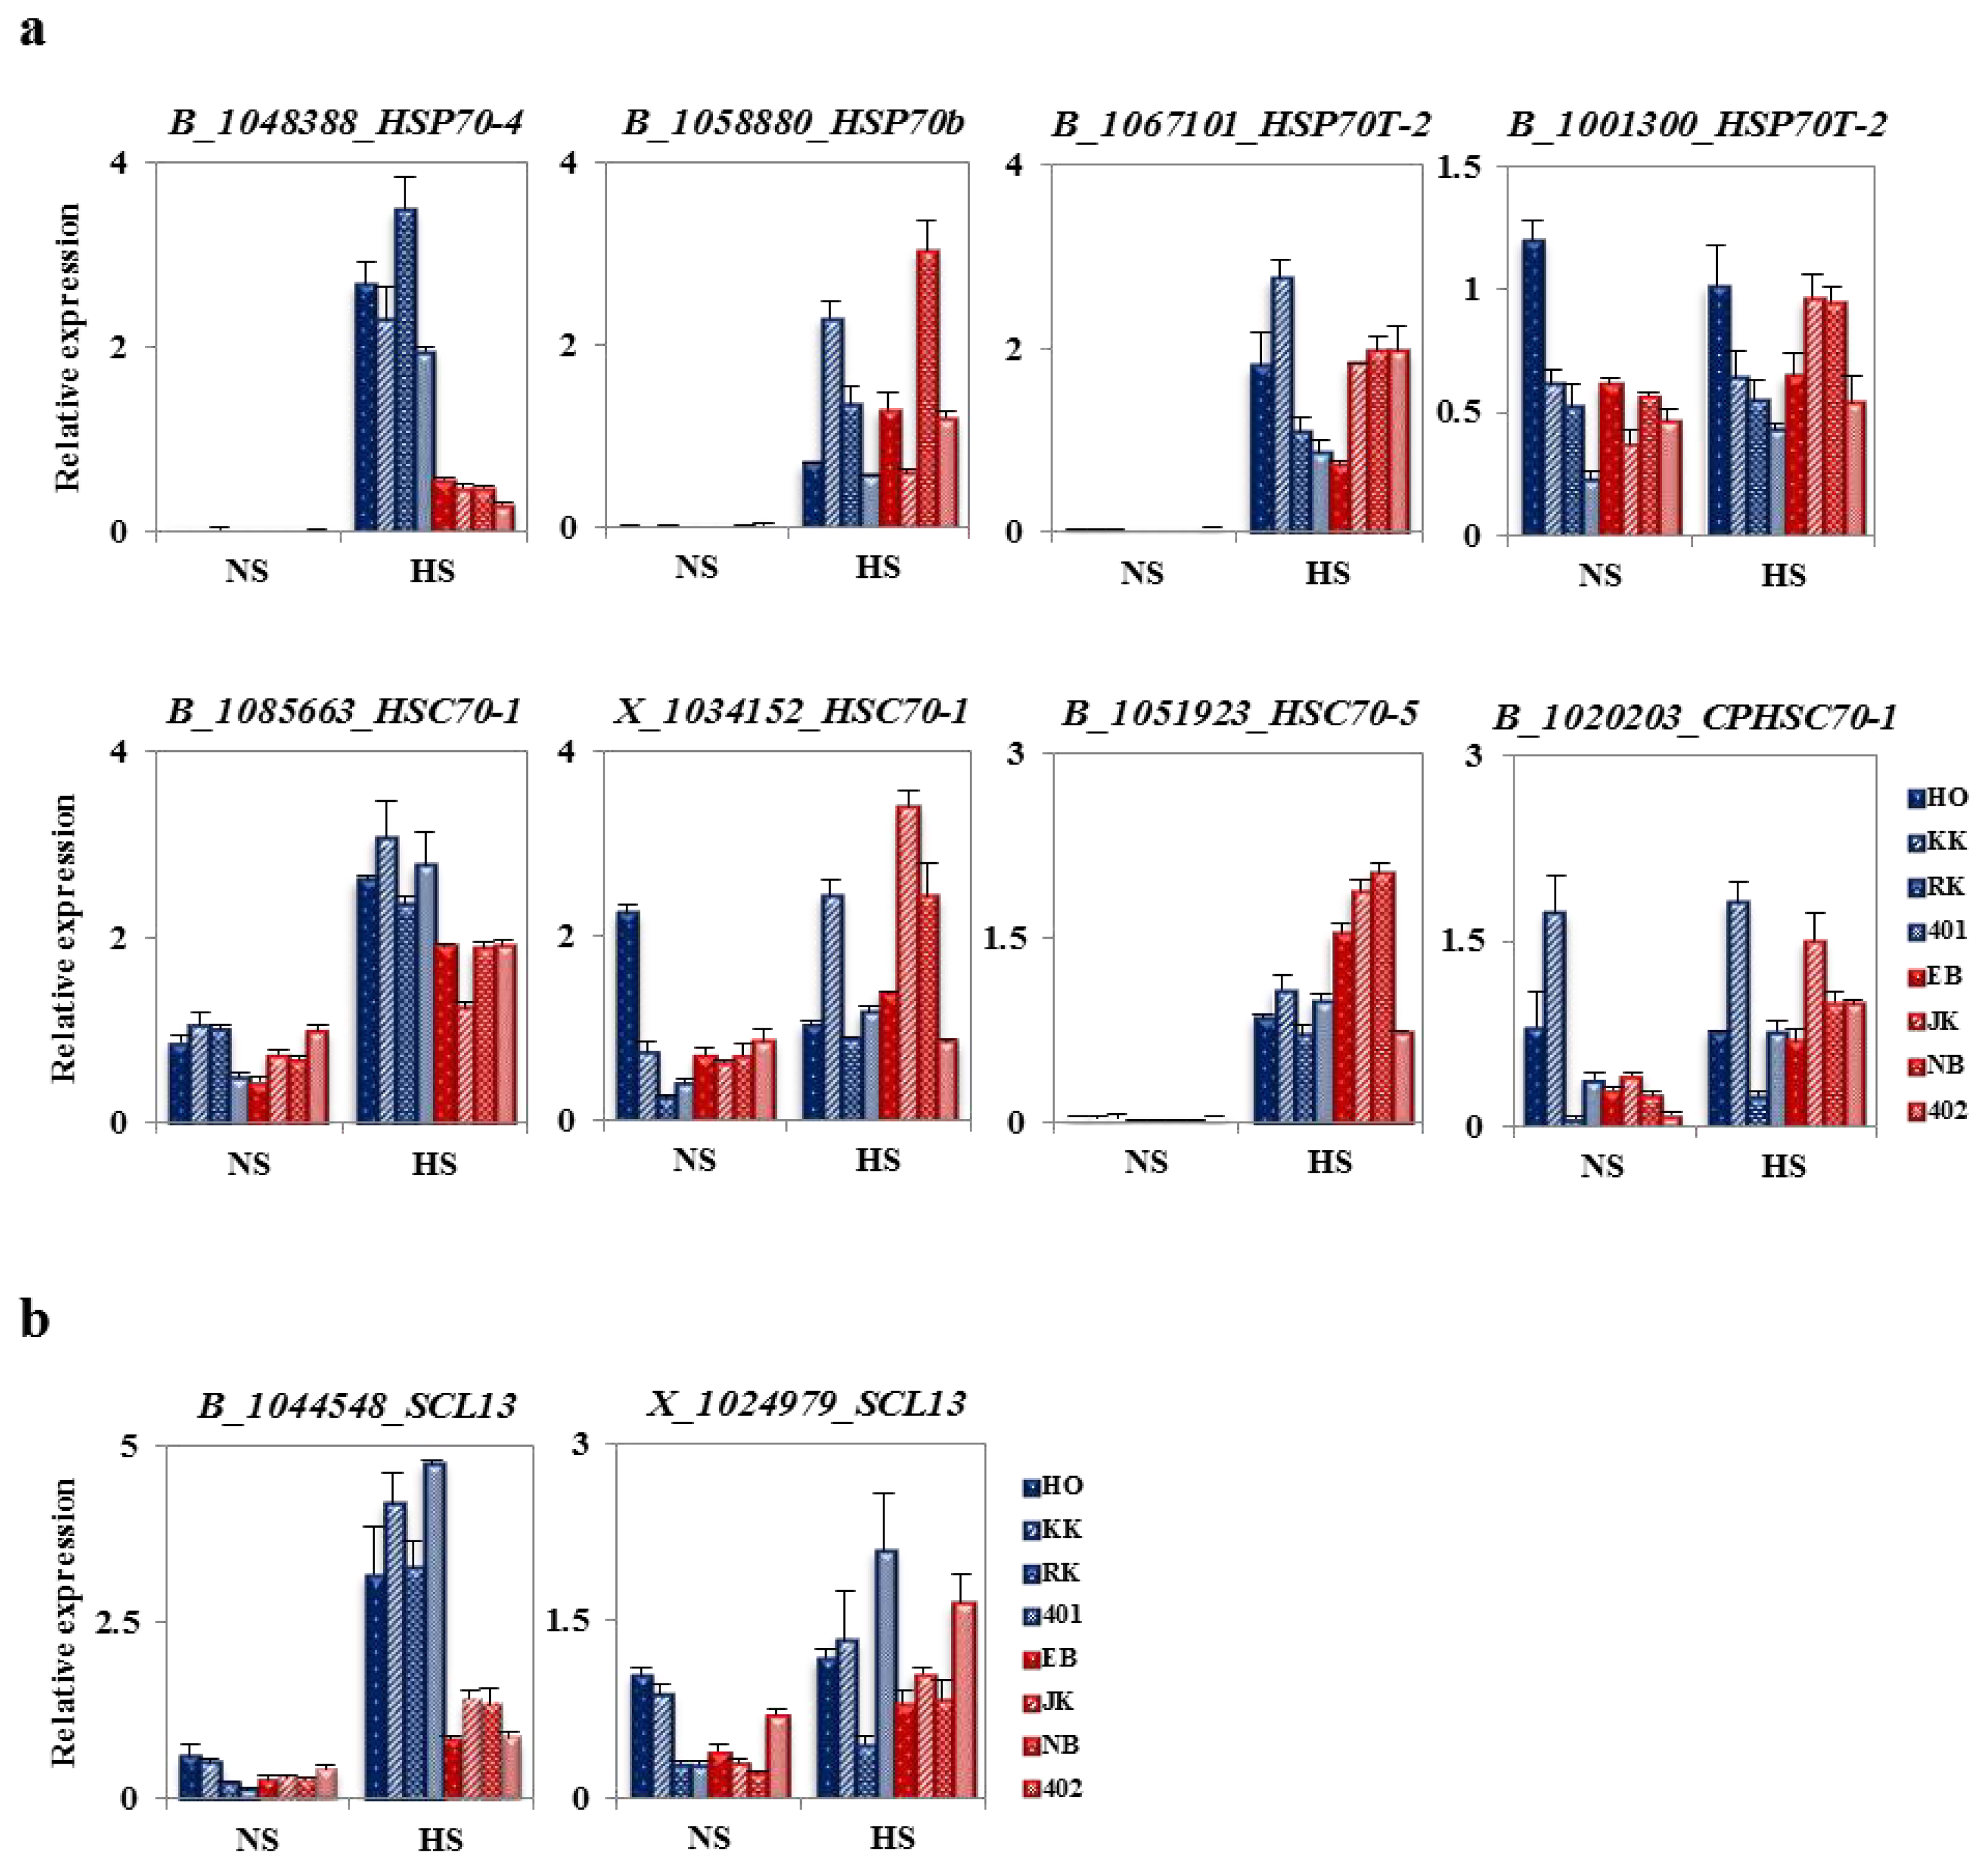
2.6. Analysis of Fold Change in Expression of Heat Stress-Related Genes between HTCLs and HSCLs

Heat-shock proteins play crucial roles in protecting cells against stress. They also function in developmental processes in the NS condition and as molecular chaperones in heat stress [14,20]. HSPs are highly conserved amongst organisms. In the previous Genechip analysis, a large number of HSP genes were upregulated at the HS condition in both HTCL and HSCL. In addition, several Hsps were highly expressed in inbred heat-tolerant Chinese cabbage lines [38]. Thus, to compare typical heat-induced expression of HSPs between four HTCLs and four HSCLs, qRT-PCR analyses were performed at NS and HS conditions in two-week-old, young plants. As a result, expression of BoHsp100, BoHsp81s, BoHsp70, BoHsp22s, BoHsp18.2, BoHsp18s, BoHsp17.6 and putative BoHsp (BoDnaJ) were evaluated in the HTCLs and HSCLs (Figure 5a). Most BoHsps were barely expressed at the NS condition, whereas they were greatly induced at the HS condition in all HTCLs and HSCLs. The exception was BoHsp18.2, which showed significant expression, even in the absence of stress. The transcript levels of BoHSP100 in the HTCLs and HSCLs were dramatically induced at HS compared to NS, but there was no difference between HTCLs and HSCLs. Transcript levels of BoHSP81s were tested with two different primers against two BoHsp81 genes. Although HTCLs and HSCLs showed some differences in expression of one of the BoHsp81 (B_1046678) at the HS condition, this difference did not extend to all of the HTCLs or HSCLs. In the case of BoHsp22, three different cabbage genes were reexamined by qRT-PCR analysis. However, no clear information was gained, due to some inconsistencies between lines. Nevertheless, three BoHsp22s showed positive results, suggesting that this family has a potential impact on the heat-tolerant trait. Expression levels of the putative BoHsp (B_1066881_DnaJ), BoHsp18.2, BoHsp17.6 and BoHsp18s did not differ between HTCLs and HSCLs at the HS condition. In contrast, the expression pattern of BoHSP70 was increased by about three-fold in all HTCLs compared to the pattern of expression in HSCLs at the HS condition. Therefore, expression of BoHSP70 may provide a marker for distinguishing heat-tolerant cabbage lines for breeding.
Many heat-inducible genes are regulated by heat shock transcription factors (Hsfs). Hsfs are distal mediators of the cellular signaling response to chemical and environmental stressors [39]. The Arabidopsis genome has a very complex Hsf family with 21 members. Because cabbage is also in the Brassicaceae family, it may have a similar number of Hsfs. However, only a limited number of Hsfs have a known role in the heat shock response (HR). Most Hsfs are expressed at very low levels and have not yet been shown to have functions in HR. Therefore, we compared expression patterns of Hsfs with known roles in HR by Genechip analysis (Table 2). Expression patterns of BoHsfA1a, BoHsfA7a, BoHsfA2, BoHsfB2b and a BoGRAS transcription factor, BoSCL13, were analyzed in two-week-old, young HTCLs and HSCLs cultured in NS and HS conditions (Figure 5b). BoHsfA1a was constitutively expressed in all HTCLs and HSCLs in both NS and HS conditions. The expression levels were not significantly different in HTCLs and HSCLs at the HS condition, whereas HSCLs showed a slightly increased level relative to HTCLs in the NS condition. BoHsfA7a was induced in both HTCLs and HSCLs and showed slightly increased expression in all HTCLs compared to HSCLs at the HS condition. BoHsfA2 was induced at HS in HTCLs and HSCLs. However, there were no differences in BoHsfA2 expression between tolerant or sensitive lines, despite an essential role in heat tolerance [40,41]. BoHsf2b was increased in response to HS in HTCLs and HSCLs, but the expression pattern was very similar between lines at the NS or HS condition, despite differences among the lines. Transcript levels of BoSCL13, a BoGRAS family gene, were induced in both HTCLs and HSCLs at HS; however, the increase was approximately three-fold higher in HTCLs compared to HSCLs. In summary, these results suggested that BoHsp70 and BoSCL13 might be related to heat tolerance and/or proper head formation of cabbage at high temperature. Further, our data suggested that increased expression of these genes might be a marker that distinguishes heat-tolerant cabbage lines.

2.7. The Specificity of BoHsp70 and BoSCL11 for the Heat Tolerance Trait in Cabbage

To evaluate BoHsp70 and BoSCL13 as selective markers for heat tolerance, expression levels of the other genes in this family were analyzed in HTCLs and HSCLs by qRT-PCR. Most BoHsp70-family genes were increased clearly at the HS condition compared to the NS condition in both HTCLs and HSCLs. The exception was BoCPHSC70-1, a chloroplast Hsp70 gene, which was not induced at the HS condition. Other HSP70 family genes showed no differences in gene expression between HTCLs and HSCLs at NS or HS conditions. BoHSC70-1 (B_1085663), an Hsp70 cognate gene, showed slightly enhanced expression in all HTCLs (1.25-fold change) compared to HSCLs at the HS condition. Transcript levels of BoHsp70b, BoHsp70T-2s, BoHSC70-1s, BoHSC70-5 and BoCPHSC70-1 did not correlate between HTCLs or HSCLs, suggesting that their expression patterns were not useful as selection markers. In the meantime, a primer set against a different region of BoHsp70 (B_1048388) confirmed differential expression between HTCLs and HSCLs and the potential of this gene as a selective marker (Figure 6a). Because there were two kinds of BoSCL13 genes on the Genechip analysis, qRT-PCR was performed to determine which of the two genes is specific for the heat stress-tolerant trait. Only BoSCL13 (B_1044548) was highly expressed in all HTCLs, but not in HSCLs at the HS condition (Figure 6b), whereas another BoSCL13 (X_1024979) showed no difference between HTCLs and HSCLs. Further, it showed irregular expression patterns among lines. High BoSCL13 (B_1044548) expression was also confirmed by qRT-PCR with another primer set. These results indicate that expression of BoHsp70 and BoSCL13 (B_1044548) can distinguish heat shock-tolerant lines for cabbage breeding.

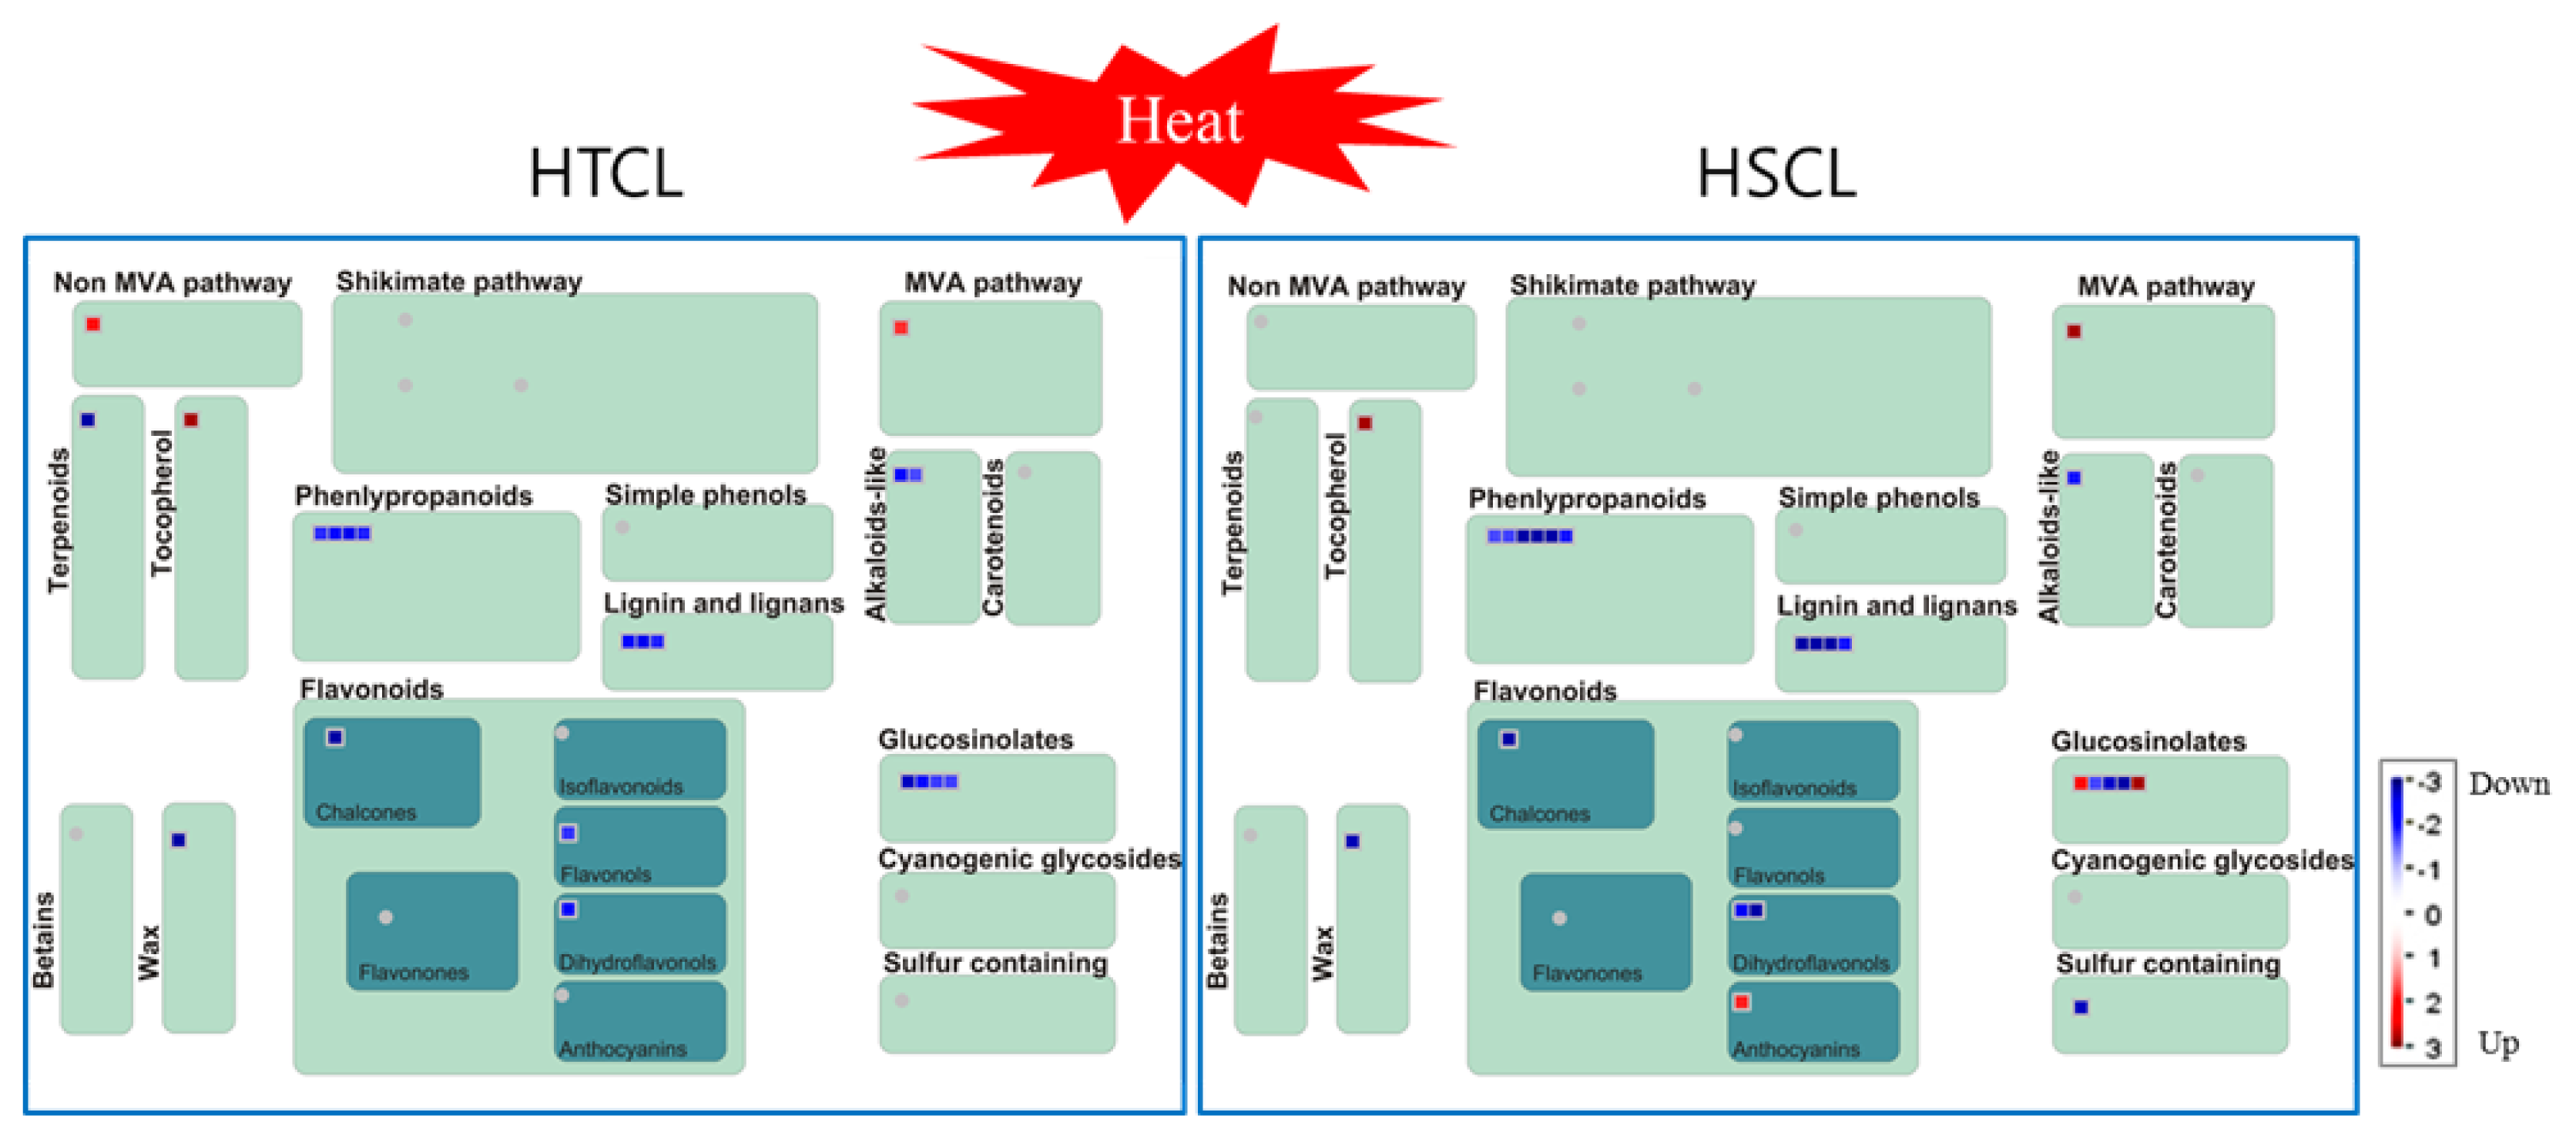
2.8. Comparison of Secondary Metabolite Profiling between HTCL “HO” and HSCL “JK”

Environmental stress causes exchange of secondary metabolites as an adaptation for overcoming the constraints of stress. We compared gene expression profiles of secondary metabolites between HTCL and HSCL at the HS condition with a MapMan program. The MapMan analysis showed that differentially expressed genes in both cabbage lines were associated with secondary metabolites, such as alkaloid-like molecules, flavonoids, glucosinolates, non-mevalonate, phenylpropanoid, sulfur-containing and terpenoids (Figure 7). Specific genes in the HTCL were involved in non-mevalonate, terpenoid and flavonol pathways. Specific genes in the HSCL were encoded anthocyanins, glucosinolates and sulfur-containing molecules. Other genes showed the same expression patterns. Interestingly, three upregulated genes in the HSCL were in the anthocyanin and glucosinolate pathways (Table 3). Thus, several genes involved in the secondary metabolite pathway were differentially regulated in HTCL and HSCL at the heat stress condition. Further studies are needed to understand the mechanism.

3. Discussion

Cabbage shows the most prominent head formation compared to other Brassicaceae plants. The ability to form heads at a high temperature is recognized as a major trait identifying high temperature-resistant varieties of cabbage. HTCLs in this study showed much better head formation compared to HSCLs with green house cultivation at a temporary summer temperature over 40 degrees (Figure 1a,b). Lines selected for heat tolerance showed similar differences in their responses to high temperature in vitro as young plants (Figure 4a,b). Differential gene expression was compared between HTCL, “HO” and HSCL, “JK”, young plants at HS condition. Many genes were up- and down-regulated in both HTCL and HSCL. GO analysis classified genes that were upregulated as involved in stimulus response, signaling, immune response and transcriptional regulation activity. Downregulated genes were classified as being involved in metabolic processes, cellular processes, developmental processes and binding. These results did not differ significantly from other results showing changes in cellular metabolism at the stress condition (Figure 2a,b). Expression of most Hsps is increased if cells are exposed to elevated temperature or other stressful conditions, although some Hsps are expressed even in non-stressful conditions [42]. Further variations in Hsp expression have been observed even within the same species in thermally-contrasting habitats. Variations in Hsp production often correlates with heat tolerance. For example, sHsps are differentially expressed in distinct varieties of common beans according to their heat stress tolerance [43]. Potatoes exhibited genotypic differences in thermotolerance and heat shock responses in four cultivars, two of which were heat-tolerant cultivars and two heat-sensitive cultivars [44]. Two distinct inbred lines of Chinese cabbage, which have different geographic origins and different responses to temperature and vernalization, had different expression levels of some Hsps and Hsfs in short-term HS stress conditions [38]. Variations in expression of Hsps were also observed between HTCLs and HSCLs and within HTCLs and HSCLs (Figures 5 and 6; Tables 1 and 2). Nevertheless, expression levels of many Hsp genes (about 40) were increased by more than four-fold at HS, suggesting that Hsp genes play critical roles in adapting to heat stress. BoHsp70 was increased at the HS condition, as were other Hsps. However, expression of BoHsp70 was increased by approximately three- to four-fold in all HTCL lines, whereas expression was increased by 0.5-fold or equivalent in HSCLs. Expression of BoHsp70 was significantly different between HTCLs and HSCLs. In addition, qRT-PCR analysis with other primers reconfirmed differential expression of BoHsp70 (Figure 6a). Other BoHsp70 family genes were not genetic markers that distinguished HTCLs from HSCLs, due to a high degree of variation between each line and unclear differences between HTCLs and HSCLs (Figure 6a). The Arabidopsis ortholog of BoHsp70, AtHsp70-4 or AtHsp70 (At3g12580) is a member of the Hsp70 family and is localized to the cytoplasm. Expression of AtHsp70 is constitutive and highly heat-inducible [45,46].
The GRAS plant-specific transcription factor family has a major role in the developmental process [47], but its functions in the heat stress response have not been verified. The GRAS name was derived from the first three members to be cloned, which were GAI, RGA and SCR [4852]. The GRAS protein structure consists of divergent N-terminal regions and VHIID, PFYRE and SAW motifs. GRAS proteins share sequence homology at the C-terminal regions [52]. The Arabidopsis and rice genomes encode more than 33 and 60 GRAS genes, respectively [5357]. SCL13 has been identified as a PAT (phytochrome A signal transduction) 1 group GRAS gene and plays a role in red light signal transduction as a positive regulator [58]. Suppression of SCL13 transgenic plants had reduced sensitivity to red light, suggesting that SCL13 functions in hypocotyls elongation during de-etiolation. However, other potential biological functions have not yet been studied, including heat stress tolerance. In this study, expression levels of BoSCL13 were increased with HS in all cabbage lines (Figure 5b). Furthermore, the ortholog of AtSCL13 (At4g17230) was also increased by heat shock at an early time point after heat treatment (data not shown). Therefore, SCL13 may be involved in heat tolerance. BoSCL13 (B_1044548) also showed distinctive differences in HTCLs and HSCLs. There was a three-fold increase in BoSCL13 (B_1044548) in HTCLs compared to HSCLs, even though qRT-PCR analyses were conducted with two different primers at the HS condition (Figures 5b and 6b). In addition, the other BoSCL13 (X_1024979) gene did not show a differential of gene expression between HTCLs and HSCLs at the HS condition, suggesting that the BoSCL13 (B_1044548) is a unique candidate gene for discriminating heat shock tolerance in cabbage breeding. In summary, these results suggested that the BoHsp70 and BoSCL13 (B_1044548) genes might be related to heat tolerance and/or proper head formation of cabbage at high temperature. Further, these data suggested that increased expression of these genes might be markers that distinguish heat-tolerant cabbage lines. Future studies will examine the specific roles of these proteins in heat tolerance and/or heat response.

4. Experimental Procedures

4.1. Plant Materials

Eight inbred lines of cabbage (Brassica oleracea L) were selected as HTCL or HSCL, based on their abilities to form heads after one summer season in a vinyl greenhouse. The “HO”, “KK”, “RK” and “401” showed normal head formation, whereas the “EB”, “JK”, “NB” and “402” showed poor head formation. The eight B. oleracea genotypes were “HO”, “KK”, “RK”, “401”, “EB”, “JK”, “NB” and “402” and were obtained from the Asia Seed Company (Gyeonggi-Do, Korea). The lines, “HO”, “KK”, “RK” and “401”, were determined to be HTCLs, and “EB”, “JK”, “NB” and “402” were HSCLs.

4.2. Plant Growth Conditions

Field experiments were conducted at the Gwangju location in Gyeonggi-Do Province, Korea. Eight lines were grown from May to October to select for heat tolerance. Plants were sown and grown during the last days of May and first days of June with the distance between plants of 60 cm in two rows of 40 cm distance at 25 days post-emergence. After the summer season, heat tolerance was identified by head formation in each inbred line. Seeds were surface-sterilized with 70% ethanol for 5 minutes (min) and with 10% chlorax for 30 min in the growth chamber. Seeds were then rinsed with sterilized distilled water five times for 5 min. Seeds were germinated on Murashige and Skoog (MS) media containing 1% sucrose for 7 to 10 days in an 8 × 150 mm petri dish. Seeds of soil-grown plants were directly germinated in sterilized soil and grown for 2 to 4 weeks. Plants were maintained at controlled growth conditions of 16-hour day/8-hour night cycles at 24 °C with 150 μE m−2s−1 in a growth chamber.

4.3. Heat Treatments

Two-week-old, young soil-grown plants were heat-shocked at 42 °C for 24 h and then transferred to 24 °C for recovery and phenotypic analyses. One-week-old plate-grown sterilized seedlings were heat-shocked in petri dishes at 42 °C for 5 h in an incubator and then recovered at 24 °C in a growth chamber. Phenotypic characteristics appeared approximately 3 days after transfer to room temperature. For Genechip analysis, 2-week-old, young soil-grown HTCL, “HO”, and HSCL, “JK”, plants were heat-shocked at 42 °C for 2 h (HS) or continuously grown at 24 °C (NS).

4.4. Genechip Analysis

Cyanine 3-labeled and cyanine 5-labeled cRNA were produced from total RNA with the Low Input Quick Amp Labeling Kit (Agilent Technology, Santa Clara, CA, USA), according to the manufacturer’s instructions. The amounts and qualities of labeled cRNAs were assessed with a NanoDrop ND-1000 spectrophotometer and an Agilent Bioanalyzer. Expression profile analysis was performed on a Brassica 105k oligo microarray (2 × 10⁵k format; Agilent Technologies, SurePrint™ Technology) [56]. Hybridization images were analyzed on an Agilent DNA microarray Scanner (Agilent Technology), and quantification was performed with Agilent Feature Extraction software 10.7 (Agilent Technology). The average fluorescence intensity for each spot was calculated and local background was subtracted. Data normalization and selection of genes showing changes in expression were performed with GeneSpringGX 7.3.1 (Agilent Technology). Genes were filtered and flag-out genes were removed. LOWESS normalization of data was performed [59]. Spots that did not meet the minimum signal intensity were removed. The remaining signal data were analyzed with the student’s t-test (p-value ≤ 0.05), assuming normality, but not equal variances, with a Benjamini-Hochberg correction for multiple comparisons and was calculated as the log2-transformed signal ratio. The GeneSpring cross-gene error model, which was considered present in two biological replicate experiments and was determined to have a 2-fold change, was active during this study.

4.5. Identifying Biological Functions of Differentially Expressed Genes

BLASTN hits were found in Arabidopsis for 44,881 (HTCL, “HO”) and 47,352 (HSCL, “JK”) of the 103,748 Brassica unigenes [56]. The top Arabidopsis hit corresponding to each Brassica unigene was analyzed for function. Functional classification was carried out with the agriGO web-based GO analysis toolkit [45]. Arabidopsis genes were put into the Singular Enrichment Analysis (SEA) with the suggested reference background (TAIR release 10). The Fisher’s Exact Test with Yekutieli-adjusted p-values was employed in the SEA analysis with the “complete GO” ontology.

4.6. Quantitative Real-Time PCR (qRT-PCR) Analysis

Total RNA was isolated from leaf tissue with RNAiso Plus (TaKaRa Bio Inc., Otsu, Japan). The cDNAs were synthesized with M-MLV reverse transcriptase and oligo (dT) primer in a 20 μL volume, according to the manufacturer’s instructions (Invitrogen, Grand Island, NY, USA). Quantitative PCR was performed in 10 μL reactions with gene-specific primers (Table S1), 1 μL of cDNA as template and SYBR Premix Ex Taq (TaKaRa Bio Inc., Otsu, Japan). Reactions were performed on the CFX96 Real-Time PCR system (BioRad, Hercules, CA, USA). The thermal profile for qPCR was 3 min at 95 °C, followed by 40 cycles each of 95 °C for 20 s, 60 °C for 20 s and 72 °C for 20 s. Primer specificity and formation of primer-dimers were monitored by dissociation curve analysis. The expression level of Brassica oleracea actin1 (BoActin1) served as an internal standard for normalization of cDNA template quantity and was measured with actin-specific primers (Table S1). The qRT-PCR reactions were performed as three biological and three technical repeat. Furthermore, we showed a representative data in the figures, because the different biological experiments showed a similar expression pattern. For the qRT-PCR analysis, a pooling of 5 young plants in each inbred line were used in the figures.

4.7. Heat Shock-Related Gene Expression

First-strand cDNA products were analyzed by qRT-PCR with each set of heat responsive gene-specific primers. Expression of the BoActin1 gene was the internal control. Primers specific to B. oleracea were designed with sequences obtained from the NCBI/TAIR/CsCG B. oleracea EST internal database ( http://cgc.kribb.re.kr:8080/brdb/; in preparation). Primers were designed to amplify conserved regions of each gene, which was determined by alignments with Arabidopsis orthologs. Gene-specific primers are described in the supplemental table (Table S1). The identities of B. oleracea heat-responsive genes were confirmed by sequence analysis.

4.8. MapMan Analysis

Differential gene expression changes between HTLC and HSCL in the HS condition were constructed with MapMan (v. 3.5.1. R2), which was generated by MapCave analysis with gene identifiers corresponding to 105k-probe sets of the Brassica DNA chip. Data were organized and displayed at specific locations on diagrams of secondary metabolism based on the SCAVENGER and IMAGEANNOTATOR modules of the MAPMAN tool [60].

5. Conclusions

Detailed information for all cabbage Hsfs and Hsps is not yet available. However, constitutive or strong expression of several heat stress-related genes may contribute to proper cabbage head formation at normal growing temperatures or high-stress temperatures. Expression levels of these genes may serve as markers for faster and easier HTCL selection in cabbage breeding.

Supplementary Information

ijms-14-11871-s001.pdf

Acknowledgments

This work was supported by The Cabbage Genomics assisted breeding supporting center (CGC) research programs funded by the Ministry for Food, Agriculture, Forestry and Fisheries of the Korean Government, The Next Generation of Bio Green 21 Project, The National Center for GM Crops (PJ009043) from RDA and the KRIBB Initiative Program to HS Cho and by the Center for Women In Science, Engineering and Technology (WISET) commissioned by the Ministry of Science ICT & Future Planning and the National Research Foundation of Korea to SS Lee.

Conflict of Interest

The authors declare no conflict of interest.

References

  1. Caunii, A.; Cuciureanu, R.; Zakar, A.M.; Tonea, E.; Giuchici, C. Chemical composition of common leafy vegetables. Studia Universitatis Vasile Goldiş 2010, 20, 45–48. [Google Scholar]
  2. Kang, J.; Zai, Y.; Zhang, J. Study on high temperature injury and identification method of heat tolerance in cabbage. China Vegetables 2002, 1, 001. [Google Scholar]
  3. Hendrick, J.P.; Hartl, F. Molecular chaperone functions of heat-shock proteins. Ann. Rev. Biochem 1993, 62, 349–384. [Google Scholar]
  4. Beck, F.X.; Grunbein, R.; Lugmayr, K.; Neuhofer, W. Heat shock proteins and the cellular response to osmotic stress. Cell Physiol. Biochem 2000, 10, 303–306. [Google Scholar]
  5. Iba, K. Acclimative response to temperature stress in higher plants: Approach of genetic engineering for temperature tolerance. Annu. Rev. Plant. Biol 2002, 53, 225–245. [Google Scholar]
  6. Ledesma, N.A.; Kawabata, S.; Sugiyama, N. Effect of high temperature on protein expression in strawberry plants. Biol. Plant 2004, 48, 73–79. [Google Scholar]
  7. Lee, U.; Rioflorido, I.; Hong, S.W.; Lurkindale, J.; Waters, E.R.; Vierling, E. The Arabidopsis ClpB/Hsp100 family of proteins: Chaperones for stress and chloroplast development. Plant J 2007, 49, 115–127. [Google Scholar]
  8. Timperio, A.M.; Eqidi, M.G.; Zolla, L. Proteomics applied on plant abiotic stresses: Role of heat shock proteins(HSP). J. Proteomics 2008, 71, 391–411. [Google Scholar]
  9. Kalmar, B.; Greensmith, L. Induction of heat shock proteins for protection against oxidative stress. Adv. Drug Deliv. Rev 2009, 61, 310–318. [Google Scholar]
  10. Li, Q.; Guy, C.L. Evidence for non-circadian light/dark-regulated expression of Hsp70s in spinach leaves. Plant Physiol 2001, 125, 1633–1642. [Google Scholar]
  11. Giorno, F.; Wolters-Arts, M.; Grillo, S.; Scharf, K.; Vriezen, W.H.; Mariani, C. Developmental and heat stress-regulated expression of HsfA2 and small heat shock proteins in tomato anthers. J. Exp. Bot 2010, 61, 453–462. [Google Scholar]
  12. Richter, K.; Buchner, J. Hsp90: Chaperoning signal transduction. J. Cell Physiol 2001, 188, 281–290. [Google Scholar]
  13. Bukau, B.; Weisman, J.; Horwich, A. Molecular chaperones and protein quality control. Cell 2006, 125, 443–451. [Google Scholar]
  14. Frydman, J. Folding of newly translocated proteins in vivo: The role of molecular chaperones. Annu. Rev. Biochem 2001, 70, 603–647. [Google Scholar]
  15. Wang, W.; Vinocur, B.; Shoseyov, O.; Altman, A. Role of plant heat shock proteins and molecular chaperones in the abiotic stress response. Trends Plant Sci 2004, 9, 244–252. [Google Scholar]
  16. Alvim, F.C.; Carolino, S.M.; Cascardo, J.C.; Nunes, C.C.; Martinez, C.A.; Otoni, W.C.; Fontes, E.P. Enhanced accumulation of Bip in transgenic plants confers tolerance to water stress. Plant Physiol 2001, 126, 1042–1054. [Google Scholar]
  17. Ono, K.; Hibino, T.; Kohinata, T.; Suzuki, S.; Tanaka, Y.; Nakamura, T.; Takabe, T.; Takabe, T. Overexpression of DnaK from a halotolerant cyanobacterium Aphanothece halophytica enhances the high-temperature tolerance of tobacco during germination and early growth. Plant Sci 2001, 160, 455–461. [Google Scholar]
  18. Silver, J.T.; Noble, E.G. Regulation of survival gene hsp70. Cell Stress Chaperones 2012, 17, 1–9. [Google Scholar]
  19. Young, J.C.; Moarefi, I.; Hartl, F.U. Hsp90: A specialized but essential protein-folding tool. J. Cell Biol 2001, 154, 267–273. [Google Scholar]
  20. Pratt, W.B.; Krishna, P.; Olsen, L.J. Hsp90-binding immunophilins in plants: The protein movers. Trends Plant Sci 2001, 6, 54–58. [Google Scholar]
  21. Queitsch, C.; Sangster, T.A.; Lindquist, S. Hsp90 as a capacitor phenotypic variation. Nature 2002, 417, 618–624. [Google Scholar]
  22. Patel, S.; Latterich, M. The AAA team: Related ATPases with diverse function. Trends Cell Biol 1998, 8, 65–71. [Google Scholar]
  23. Burch, E.M.; Rosano, G.; Ceccarelli, E.A. Chloroplastic Hsp100 chaperones ClpC2 and ClpD interact in vitro with a transit peptide only when it is located at the N-terminus of a protein. BMC Plant Biol 2012, 12, 57. [Google Scholar]
  24. Keeler, S.; Boettger, C.M.; Haynes, J.G.; Kuches, K.A.; Johnson, M.M.; Thureen, D.L.; Keeler, C.L., Jr; Kitto, S.L. Acquired thermotolerance and expression of the HSP100/ClpB genes of Lima bean. Plant Physiol 2000, 123, 1121–1132. [Google Scholar]
  25. Queitsch, C.; Hong, S.W.; Vierling, E.; Lindquist, S. Heat stress protein 101 plays a crucial role in thermotolerance in Arabidopsis. Plant Cell 2000, 12, 479–492. [Google Scholar]
  26. Agarwal, M.; Katiyar-Agarwal, S.; Sahi, C.; Gallie, D.R.; Grover, A. Arabidopsis thaliana Hsp100 proteins: Kith and kin. Cell Stress Chaperones 2001, 6, 219–224. [Google Scholar]
  27. Adams, Z.; Clarke, A.K. Cutting edge of chloroplast proteolysis. Trends Plant Sci 2002, 7, 451–456. [Google Scholar]
  28. Veinger, L.; Diamant, S.; Buchner, J.; Goloubinoff, P. The small heat-shock protein IbpB from E. coli stabilizes stress-denatured proteins for subsequent refolding by a multichaperones network. J. Biol. Chem 1998, 273, 11032–11037. [Google Scholar]
  29. Lee, G.J.; Vierling, E. A small heat shock protein cooperates with heat shock protein 70 systems to reactive a heat-denatured protein. Plant Physiol 2000, 122, 189–198. [Google Scholar]
  30. Basha, E.; O’Neill, H.; Vierling, E. Small heat shock proteins and α-crystallins: Dynamic proteins with flexible functions. Trends Biochem. Sci 2012, 37, 106–117. [Google Scholar]
  31. Baniwal, S.K.; Bharti, K.; Chan, K.Y.; Fauth, M.; Ganguli, A.; Kotak, S.; Mishra, S.K.; Nover, L.; Port, M.; Scharf, K.D.; et al. Heat stress response in plants: A complex game with chaperone and more than twenty heat transcription factors. J. Biosci 2004, 29, 471–487. [Google Scholar]
  32. Wu, C. Heat stress trnanscription factors. Annu. Rev. Cell Dev. Biol 1995, 11, 441–469. [Google Scholar]
  33. Nover, L.; Bharti, K.; DÖring, P.; Mishra, S.K.; Ganguli, A.; Scharf, K.D. Arabidopsis and the heat stress transcription factor world: How many heat stress transcription factors do we need? Cell Stress Chaperones 2001, 6, 177–189. [Google Scholar]
  34. Wang, F.; Dong, Q.; Jiang, H.; Zhu, S.; Chen, B.; Xiang, Y. Genome-wide analysis of the heat shock transcription factors in Populus trichocarpa and Medicago truncatula. Mol. Biol. Rep 2012, 39, 1877–1886. [Google Scholar]
  35. Miller, G.; Mittler, R. Could heat shock transcription factors function as hydrogen peroxide sensors in plants? Ann. Bot 2006, 98, 279–288. [Google Scholar]
  36. Hirsch, S.; Oldroyd, G.E. GRAS-domain transcription factors that regulate plant development. Plant Signal Behav 2009, 4, 698–700. [Google Scholar]
  37. Di Laurenzio, L.; Wysocka-Diller, J.; Malamy, J.E.; Pysh, L.; Helariutta, Y.; Freshour, G.; Hahn, M.G.; Feldman, K.A.; Benfey, P.N. The SCARECROW gene regulates an asymmetric cell division that is essential for generating the radial organization of the Arabidopsis root. Cell 1996, 86, 423–433. [Google Scholar]
  38. Peng, J.; Carol, P.; Richard, D.E.; King, K.E.; Cowling, R.J.; Murphy, G.P.; Harberd, N.P. The Arabidopsis GAI gene defines a signaling pathway that negatively regulates gibberellin responses. Genes Dev 1997, 11, 3194–3205. [Google Scholar]
  39. Silverstone, A.L.; Ciampaglio, C.N.; Sun, T. The Arabidopsis RGA gene encodes a transcriptional regulator repressing the gibberellin signal transduction pathway. Plant Cell 1998, 10, 155–169. [Google Scholar]
  40. Pysh, L.D.; Wysocka-Diller, J.W.; Camilleri, C.; Bouchez, D.; Benfey, P.N. The GRAS gene family in arabidopsis: Sequence characterization and basic expression analysis of the SCARECROW-LIKE genes. Plant J 1999, 18, 111–119. [Google Scholar]
  41. Bolle, C. The role of GRAS proteins in plant signal transduction and development. Planta 2004, 218, 683–692. [Google Scholar]
  42. Itoh, H.; Shimada, A.; Ueguchi-Tanaka, M.; Kamiya, N.; Hasegawa, Y.; Ashikari, M.; Matsuoka, M. Overexpression of GRAS protein lacking the DELLA domain confers altered gibberellins responses in rice. Plant J 2005, 44, 669–679. [Google Scholar]
  43. Lee, M.H.; Kim, B.; Song, S.K.; Heo, J.O.; Yu, N.I.; Lee, S.; Kim, M.; Kim, D.G.; Sohn, S.O.; Lim, C.E.; et al. Large-scale analysis of the GRAS gene family in Arabidopsis thaliana. Plant Mol. Biol 2008, 67, 659–670. [Google Scholar]
  44. Tian, C.; Wan, P.; Sun, S.; Li, J.; Chen, M. Genome-wide analysis of the GRAS gene family in rice and Arabidopsis. Plant Mol. Biol 2004, 54, 519–532. [Google Scholar]
  45. Tong, H.; Jin, Y.; Liu, W.; Li, F.; Fang, J.; Yin, Y.; Qian, Q.; Zhu, L.; Chu, C. DWARF AND LOW-TILLERING, a new member of the GRAS family, plays positive roles in brassinosteroid signaling in rice. Plant J 2009, 58, 803–816. [Google Scholar]
  46. Tanaka, N.; Niikura, S.; Takeda, K. Relationship between earliness of head formation and developmental characteristics of cabbage (Brassica oleracea L.) in two different growing seasons, autumn and spring. Breed Sci 2008, 58, 31–37. [Google Scholar]
  47. Du, Z.; Zhou, X.; Ling, Y.; Zhang, Z.; Su, Z. agriGO: A GO analysis toolkit for the agricultural community. Nucleic Acids Res 2010, 38, 64–70. [Google Scholar]
  48. Lee, J.; Song, H.; Han, C.T.; Lim, Y.P.; Chung, S.M.; Hur, Y. Expression characteristics of heat shock protein genes in two comparable inbred lines of Chinese cabbage, Chiifu and Kenshin. Genes Genom 2010, 32, 247–257. [Google Scholar]
  49. Mishra, S.K.; Tripp, J.; Winkelhaus, S.; Tschiersch, B.; Theres, K.; Nover, L.; Scharf, K.D. In the complex family of heat stress transcription factors, HsfA1 has a unique role as master regulator of thermotoloerance in tomato. Genes Dev 2002, 16, 1555–1567. [Google Scholar]
  50. Charng, Y.Y; Liu, H.C.; Liu, N.Y.; Chi, W.T.; Wang, C.N.; Chang, S.H.; Wang, T.T. A heat-inducible transcription factor, HsfA2, is required for extension of acquired thermotolerance in Arabidopsis. Plant Physiol 2007, 143, 251–262. [Google Scholar]
  51. Ogawa, D.; Yamaguchi, K.; Nishiuchi, T. High-level overexpression of the Arabidopsis HsfA2 gene confers not only increased thermotolerance but also salt/osmotic stress tolerance and enhanced callus growth. J. Exp. Bot 2007, 58, 3373–3383. [Google Scholar]
  52. De Maio, A. Heat shock proteins: Facts, thoughts, and dreams. Shock 1999, 11, 1–12. [Google Scholar]
  53. Simões-Araújo, J.L.; Rumjanek, N.G.; Margis-Pinheiro, M. Small heat shock proteins genes are differentially expressed in distinct varieties of common bean. Braz. J. Plant Physiol 2003, 15, 33–41. [Google Scholar]
  54. Ahn, Y.J.; Claussen, K.; Zimmerman, J.L. Genotypic differences in the heat-shock response and thermotolerance in four potato cultivars. Plant Sci 2004, 166, 901–911. [Google Scholar]
  55. Lin, B.L.; Wang, J.S.; Liu, H.C.; Chen, R.W.; Meyer, Y.; Barakat, A.; Delseny, M. Genomic analysis of the hsp70 superfamily in Arabidopsis thaliana. Cell Stress Chaperones 2001, 6, 201–208. [Google Scholar]
  56. Sung, D.Y.; Vierling, E.; Guy, C.L. Comprehensive expression profile analysis of the Arabidopsis Hsp70 gene family. Plant Physiol 2001, 126, 789–800. [Google Scholar]
  57. Torres-Galea, P.; Huang, L.F.; Chua, N.H.; Bolle, C. The GRAS protein SCL13 is a positive regulator of phytochrome-dependent red light signaling, but can also modulate phytochrome A responses. Mol. Genet. Genomics 2006, 276, 13–30. [Google Scholar]
  58. Trick, M.; Cheung, F.; Drou, N.; Fraser, F.; Lobenhofer, E.K.; Hurban, P.; Magusin, A.; Town, C.D.; Bancroft, I. A newly-developed community microarray resource for transcriptome profiling in Brassica species enables the confirmation of Brassica-specific expressed sequences. BMC Plant Biol 2009, 9, 50. [Google Scholar]
  59. Draghici, S.; Kulaeva, O.; Hoff, B.; Petrov, A.; Shams, S.; Tainsky, M.A. Noise sampling method: An ANOVA approach allowing robust selection of differentially regulated genes measured by DNA microarrays. Bioinformatics 2003, 19, 1348–1359. [Google Scholar]
  60. Thimm, O.; Bläsing, O.; Gibon, Y.; Nagel, A.; Meyer, S.; Krüger, P.; Selbig, J.; Müller, L.A.; Rhee, S.Y.; Stitt, M. MAPMAN: A user-driven tool to display genomics data sets onto diagrams of metabolic pathways and other biological processes. Plant J 2004, 37, 914–939. [Google Scholar]
Figure 1. Heat stress phenotype of cabbage head formation after summer season. These photos were taken after the summer season had passed. (a) Phenotypes of inbred lines HO, KK, NB, EB and JK (Asia Seed Company). The HO and KK lines showed heat tolerance, whereas the NB, EB and JK lines showed heat-sensitive phenotypes in the field condition. A heat-tolerant cultivar and a heat-sensitive cultivar were used as a positive or negative control of heat shock stress in the field condition. Seeds were sown in May, and young plants were transplanted in June. Photos were taken at the end of October; (b) Temperature changes during cultivation of cabbages in a vinyl house in the field condition are shown. Max, maximum temperature; Mean, average temperature; Min, minimum temperature.
Ijms 14 11871f1
Figure 2. Microarray analysis of transcripts that are differentially expressed between heat stress-tolerant and heat-sensitive cabbage inbred lines exposed to heat stress. (a) Venn diagram showing differentially expressed transcripts of the two cabbage lines in response to heat stress and no heat stress conditions. HO-NS, heat stress-tolerant cabbage “HO” inbred line—no heat stress; HO-HS, heat stress-tolerant cabbage “HO” inbred line—heat stress; JK-NS, heat stress-sensitive cabbage “JK” inbred line—no heat stress; JK-HS, heat stress-sensitive cabbage “JK” inbred line—heat stress. The numbers of upregulated genes are shown in red, whereas the numbers of downregulated genes are shown in blue (fold change ≥2 and ≤−2, p ≤ 0.05); (b) Functional analysis of differentially expressed transcripts during heat stress or no heat stress in two cabbage lines. This chart shows GO terms for biological processes and molecular functions for 414 upregulated genes and 354 downregulated genes in tolerant and sensitive cabbages (fold change ≥2 and ≤−2, p ≤ 0.05). * Over-represented GO terms in the categories.
Ijms 14 11871f2
Figure 3. Validation of microarray data by quantitative real-time PCR. Transcript levels of a subset of up- and down-regulated genes from microarray data. Two-week-old plants were exposed to heat stress at 42 °C for 4 h (HS) or incubated at 24 °C (NS). (a) Transcript levels of upregulated genes in the heat stress condition in HO and JK lines. (B_1087048, Putative splicing factor; B_1044548, GRAS family transcription factor; B_1048388, 70 kDa heat shock protein). HO is a heat-tolerant cabbage inbred line; JK is a heat-sensitive cabbage inbred line; (b) Transcripts levels of downregulated genes in the heat stress condition in HO and JK lines. (B_1029242, Myb-related transcription factor; B_1036869, Pectate lyase 18 precursor; B_1081233, Hydrogen-transporting ATP synthase). Expression levels were normalized to BoActin.
Ijms 14 11871f3
Figure 4. Heat stress phenotypes of heat-tolerant or heat-sensitive inbred cabbages. (a) Heat stress phenotypes of seedling stage cabbages. HO, KK, RK and 401 are heat-tolerant inbred lines. EB, JK, NB and 402 are heat-sensitive inbred lines. One-week-old seedlings were grown on MS media containing 1% sucrose at normal conditions (24 °C). Heat stress was performed in a 42 °C incubator for 5 h with the recovery at 24 °C, normal condition (HS). In contrast, non-heat-treated seedlings were grown continuously at 24 °C (NS). Photos were taken on the fourth day after heat stress exposure; (b) Heat stress phenotypes of young heat-tolerant and heat-sensitive inbred lines. Two-week-old, young plants were grown on sterilized soil at normal growth conditions (24 °C). Heat stress was performed in a 42 °C incubator for 4 h with recovery in normal conditions. Photos were taken before heat stress treatment and on the third day after heat stress treatment.
Ijms 14 11871f4aIjms 14 11871f4b
Figure 5. Analysis of fold change in expression of heat shock proteins and heat shock transcription factors in heat-tolerant and heat-sensitive cabbage lines. (a) Comparative change in fold expression of heat shock proteins in heat-tolerant cabbage lines (HTCLs) and heat-sensitive cabbage lines (HSCLs). BoHsp70, BoHsp100, two BoHsp81s, three BoHsp22s, two BoHsp18s, BoHsp17.6 and Putative BoHsp; (b) Comparative change in fold expression of heat shock transcription factors in HTCLs and HSCLs. BoHsfA1a, BoHsfA7a, BoHsfA2, BoHsfB2b and BoSCL13. HO, KK, RK and 401 are heat-tolerant cabbage inbred lines. EB, JK, NB and 402 are heat-sensitive cabbage inbred lines. Two-week old plants were exposed to heat stress at 42 °C for 4 h (HS) or incubated at 24 °C (NS). Expression levels were normalized to BoActin.
Ijms 14 11871f5
Figure 6. Analysis of fold change in expression of BoHsp70 and BoSCL13 family genes in HTCLs and HSCLs. (a) Change in expression levels of different BoHsp70 protein family genes in HTCLs and HSCLs; BoHsp70, BoHsp70bs, two BoHsp70T-2s, two BoHSC70-1s, BoHSC70-5 and BoCPHSC70-1; (b) Change in expression of two BoSCL13 genes in HTCLs and HSCLs. HO, KK, RK and 401 are heat-tolerant cabbage inbred lines (HTCLs). EB, JK, NB and 402 are heat-sensitive cabbage inbred lines (HSCLs). Two-week-old plants were heat stress-treated at 42 °C for 4 h (HS) or incubated at 24 °C (NS). Expression levels were normalized to BoActin.
Ijms 14 11871f6
Figure 7. Molecular secondary metabolism events in heat stress-tolerant and heat-sensitive cabbage inbred lines in the heat stress condition. Differentially expressed genes are depicted by MapMan format (ver. 3. 5. 1), in which the square represents a gene. Red and blue colors depict up- and down-regulated genes, respectively. Gene data were examined by MapMan analysis, which is provided in Table 3. HO, heat stress-tolerant cabbage inbred line; JK, heat stress-sensitive cabbage inbred line.
Ijms 14 11871f7
Table 1. Differentially expressed heat shock protein genes under heat stress in inbred line HO and JK.
ClassificationProbe name aTAIR_ID bDescriptionHO (HS/NS) cJK (HS/NS) d


FC eFC
Up-regulated
hsp100B_1084558AT1G74310Clp/Hsp100 (Heat shock protein 101)7.906.90
B_1078483AT1G74310Clp/Hsp100 (Heat shock protein 101)6.075.96
X_1024246AT1G74310Clp/Hsp100 (Heat shock protein 101)3.002.77
B_1047985AT1G74310Clp/Hsp100 (Heat shock protein 101)7.057.12
B_1045948AT5G15450ClpB heat shock protein-like4.205.17
B_1026871AT5G15450ClpB heat shock protein-like3.814.10
hsp70B_1058880AT1G16030HSP70b (Heat shock protein Hsp70)5.285.94
B_1067101AT2G32120HSP70T-2 (70 kD heat shock protein)3.614.11
B_1048388AT3G12580HSP70 (70 kDa heat shock protein)7.117.08
B_1047992AT3G12580HSP70 (Heat shock protein 70)6.516.75
B_1071737AT4G24280CPHSC70-1 (Chloroplast HSP70)2.572.52
B_1020203AT4G24280CPHSC70-1 (Hsp 70-like protein)2.472.09
X_1034152AT5G02500HSC70-1 (Heat shock cognate 70 kDa protein 1)3.292.33
B_1085663AT5G02500HSC70-1 (Heat shock cognate protein 70)2.25-
B_1051923AT5G09590HSC70-5 (Heat shock protein 70)4.584.24
B_1002974AT5G09590HSC70-5 (Heat shock protein 70)3.132.69
B_1001993AT5G09590HSC70-5 (Heat shock protein 70)2.632.44
hsp90B_1046678AT5G52640Heat shock protein 81-15.535.88
B_1060380AT5G56030Heat shock protein 81-24.414.32
shspB_1022192AT3G1735017.5 kDa class I heat shock protein3.583.36
X_1001732AT5G1202017.6 kDa class II heat shock protein6.516.72
X_1077107AT5G1202017.6 kDa class II heat shock protein6.296.18
X_1084898AT5G1203017.6 kDa class II heat shock protein5.616.11
B_1055398AT5G59720Hsp18.2 (Heat shock protein 18)7.728.61
X_1064115AT5G59720Hsp18.2 (Heat shock protein 18)7.126.92
B_1071667AT5G59720Hsp18.2 (Heat shock protein 18)6.538.62
B_1052943AT4G27670Putative heat shock protein 218.508.66
B_1001981AT4G1025022.0 kDa class IV heat shock protein precursor6.676.78
B_1047320AT4G10250AtHSP22.0 precursor9.179.08
B_1056315AT4G25200Heat shock 22 kDa protein, mitochondrial precursor6.576.66
B_1015145AT5G51440Mitochondrial heat shock 22 kd protein-like2.292.13
B_1050062AT5G51440Mitochondrial heat shock 22 kd protein-like2.132.09
B_1082795AT2G19310Putative small heat shock protein4.794.50
B_1033013AT2G29500Cytosolic class I small heat shock protein 3B5.115.00
B_1055192AT2G29500Putative small heat shock protein3.262.85
unclassifiedB_1081966AT1G54050Heat-shock protein, putative5.746.07
B_1066881AT2G20560Putative heat shock protein6.786.45
B_1013334AT2G35330Putative heat shock protein2.653.34

Down-regulated
hsp70B_1050323AT4G37910Heat shock protein 70 like protein−3.07−3.31
B_1054152AT4G37910Heat shock protein 70 like protein−3.05−2.98
*Differential expression with fold-change values of ≥2 and ≤−2 at p < 0.05, respectively;
aProbe Name is the probe number of cabbage microarray;
bTAIR_ID showing the best hit when BlastN was performed against the TAIR release 10 database;
cHO (HS/NS) showing the gene expression of the HO cabbage line comparing heat stress with no heat stress condition;
dJK(HS/NS) showing the gene expression of the JK cabbage line comparing heat stress with no heat stress condition;
eFC is fold change values (log2).
Table 2. Differentially expressed heat stress transcription factors genes under heat stress in inbred line HO and JK.
ClassificationProbe name aTAIR_ID bDescriptionHO (HS/NS) cJK (HS/NS) d


FC eFC
Upregulated
B_1065889AT2G26150HsfA2 (Heat stress transcription factor A-2)6.396.09
B_1018750AT2G26150HsfA2 (Heat stress transcription factor A-2)6.046.37
B_1004068AT2G26150HsfA2 (Heat stress transcription factor A-2)5.525.01
B_1019012AT3G51910HsfA7a (Heat stress transcription factor A-7a)2.994.62
B_1024396AT3G51910HsfA7a (Heat stress transcription factor A-7a)5.795.50
B_1023370AT3G51910HsfA7a (Heat stress transcription factor A-7a)4.495.31
X_1078901AT3G51910HsfA7a (Heat stress transcription factor A-7a)4.534.83
X_1062243AT4G36990HsfB1 (Heat stress transcription factor B-1)4.283.79
B_1066120AT4G11660HsfB2b (Heat stress transcription factor B-2b)3.625.42
B_1050506AT4G11660HsfB2b (Heat stress transcription factor B-2b)4.925.16
X_1043486AT3G24520HsfC1 (Heat stress transcription factor C-1)3.843.69
*Differential expression with fold-change values of ≥2 (p < 0.05);
aProbe Name is the probe number of cabbage microarray;
bTAIR_ID showing the best hit when BlastN was performed against the TAIR release 10 database;
cHO (HS/NS) showing the gene expression of the HO cabbage line comparing the heat stress with the no heat stress condition;
dJK (HS/NS) showing the gene expression of the JK cabbage line comparing the heat stress with no heat stress condition;
eFC is fold change values (log2).
Table 3. Differentially expressed genes were involved in secondary metabolisms in the HO and JK inbred line after heat stress treatment.
BinCode aBinName bAt Id cGene descriptionProbe name dFold change


HO eJK fHOJK
16.1.1.10non-mevalonate pathway. geranylgeranyl pyrophosphate synthaseat4g36810GGPS1 (GERANYLGERANYL PYROPHOSPHATE SYNTHASE 1)B_1036920-2.35-

16.1.2.1isoprenoids. mevalonate pathway. acetyl-CoA C-acyltransferaseat5g47720acetyl-CoA C-acyltransferase, putativeB_1048161B_10481612.183.88
B_1000524B_10005242.173.63
-B_1056048-3.64

16.1.5isoprenoids. terpenoidsat1g78970LUP1 (LUPEOL SYNTHASE 1)B_1022598-−3.36-

16.1.3.1isoprenoids. tocopherol biosynthesis. hydroxyphenylpyruvate dioxygenaseat1g06570PDS1 (PHYTOENE DESATURATION 1)B_1070419B_10704193.234.69

16.2phenylpropanoidsat1g77520O-methyltransferase family 2 proteinB_1076342B_1076342−2.20−2.04
at5g07870transferase family protein-B_1070123-−2.09

16.2.1.3phenylpropanoids. lignin biosynthesis.4CLat1g650604CL3 (4-coumarate-CoA ligase)-B_1058738-−3.72
-B_1064185-−2.22
-B_1028095-−2.19

16.2.1.4phenylpropanoids. lignin biosynthesis. HCTat5g48930HCT (HYDROXYCINNAMOYL-COA SHIKIMATE/QUINATE HYDROXYCINNAMOYL TRANSFERASE)-B_1072263-−3.63

16.2.1.6phenylpropanoids. lignin biosynthesis. CCoAOMTat1g24735O-methyltransferaseB_1079441-−2.39-

16.2.1.9phenylpropanoids. lignin biosynthesis. COMTat5g54160ATOMT1 (O-METHYLTRANSFERASE1)X_1039499X_1039499−2.54−3.09

16.2.1.10phenylpropanoids. lignin biosynthesis. CADat2g21730CAD2 (CINNAMYL ALCOHOL DEHYDROGENASE HOMOLOG 2)B_1059602B_1046994−2.25−2.15
B_1046994B_1059602−2.15−2.32

16.4.1N misc. alkaloid-likeat4g28680TYRDC1 (tyrosine decarboxylase, putative)X_1033105-−2.39-
B_1077763-−2.31-
at5g22020strictosidine synthase family proteinB_1063326-−2.03-
at3g57010strictosidine synthase family protein-X_1052064-−2.32

16.7waxat5g57800CER3 (ECERIFERUM 3)B_1062054B_1062054−3.11−2.90
B_1058964B_1058964−2.39−2.36
B_1036813-−2.30-
X_1062146X_1062146−2.28−2.72
X_1073290X_1073290−2.26−2.63

16.8.1.21flavonoids. anthocyanins. anthocyanin 5-aromatic acyltransferaseat3g29670transferase family protein-B_1000057-2.27

16.8.2.1flavonoids. chalcones. naringenin-chalcone synthaseat5g13930TT4 (TRANSPARENT TESTA 4)B_1078676B_1078676−4.08−3.68
B_1049448B_1049448−3.28−3.22
B_1083997B_1083997−3.16−3.62

16.8.3flavonoids. dihydroflavonolsat5g54010glycosyltransferase family proteinB_1048955B_1048955−2.43−2.51

16.8.3.1flavonoids. dihydroflavonols. dihydroflavonol 4-reductaseat5g42800DFR (DIHYDROFLAVONOL 4-REDUCTASE)-B_1047840-−3.85

16.8.4.1flavonoids. flavonols. flavonol synthase (FLS)at5g08640FLS (FLAVONOL SYNTHASE)B_1067180-−2.17-

16.5.1.1.1.2sulfur-containing. glucosinolates. synthesis. aliphatic. methylthioalkylmalate synthase (MAM)at5g23010MAM1 (METHYLTHIOALKYLMALATE SYNTHASE 1)-B_1017825-2.38

16.5.1.1.3.1sulfur-containing. glucosinolates. synthesis. indole. CYP79B2 monooxygenaseat4g39950CYP79B2B_1071664B_1071664−2.84−2.06

16.5.1.1.4.1sulfur-containing. glucosinolates. synthesis. shared. CYP83B1 phenylacetaldoxime monooxygenaseat4g31500CYP83B1 (CYTOCHROME P450 MONOOXYGENASE 83B1)B_1082264B_1082264−2.07−2.58
-B_1046742-−2.78

16.5.1.3.1.1sulfur-containing. glucosinolates. degradation. myrosinase. TGGat5g26000TGG1 (THIOGLUCOSIDE GLUCOHYDROLASE 1)B_1057241B_1057241−2.11−3.30

16.5.1.3.2.1sulfur-containing. glucosinolates. degradation. nitrile-specifier protein. epithio-specifier proteinat1g54040ESP (EPITHIOSPECIFIER PROTEIN)X_1061657-−2.10-

16.5.1.3.2sulfur-containing. glucosinolates. degradation. nitrile-specifier proteinat5g48180NSP5 (NITRILE SPECIFIER PROTEIN 5)-B_1062808-3.25

16.5.99.1sulfur-containing. misc. alliinaseat4g24670TAR2 (TRYPTOPHAN AMINOTRANSFERASE RELATED 2)-B_1048365-−2.85
*Differential expression with fold-change values of ≥2, ≤−2 (p < 0.05), respectively;
aBinCode is the number that is assigned in the measured parameters to hierarchical categories by MapMan;
bBinName is information about the BinCode;
cAt ID showing the best hit when BlastN was performed against the TAIR release 10 database;
dProbe Name is the probe number of the cabbage microarray;
eHO represent heat tolerant cabbage lines of the heat stress condition;
fJK represent heat sensitive cabbage lines of the heat stress condition.

