1. Introduction
Staphylococcus aureus is an invasive pathogen that causes various human illnesses, ranging from skin infections and food poisoning to toxic shock syndrome and endocarditis [
1]. The pathogenicity of
S. aureus is highly complex due to the secretion of virulence factors secreted by the bacteria. The secretion of virulence toxins is controlled by the accessory gene regulator (
agr) quorum sensing system that is composed of an autoinducing peptide (AIP) and a two-component signal transduction system (TCST) [
2,
3]. The TCST is commonly found in prokaryotes, fungi and plants, and it serves to sense and respond to external environment stimuli that are related to survival [
4–
7].
In
S. aureus, the
agr quorum sensing system contains genes of a typical TCST system, which controls many physiological processes. The TCST system in
S. aureus is comprised of the membrane-bound histidine kinase (HK) sensor AgrC, which responds to the AIP signaling molecule, and the cytoplasmic response regulator (RR) AgrA, which gives rise to a cellular response [
8].
S. aureus has four diverse
agr alleles. In general, only the cognate ligand–receptor interaction induces activation, whereas most heterologous interactions inhibit the receptor activation. Recent reports have shown that the first and second extracellular loops of AgrC facilitate AgrC activation [
9–
12]. Additionally, Geisinger
et al. identified amino acid I171 in the third extracellular loop of AgrC to be critical for ligand-receptor recognition [
13]. However, the mechanism in
S. aureus for sensing and responding to AIP and the specific sites of AgrC oligomer formation remain largely unknown. To resolve these issues at the molecular level and gain insight into the structure of the AgrC, it is important to express and purify a sufficient amount of functional full-length AgrC. AgrC is a 430-residue intra-membrane sensor kinase, the topology of which includes an
N-terminal sensor domain (residues 1–204 for AgrC), with six to seven transmembrane helices and a cytoplasmic domain (residues 205–430).
The difficulty of expressing and purifying functional membrane proteins has drastically hindered structural and functional studies of these proteins. A
C-terminal green fluorescent protein (GFP) fusion to a target protein is commonly used as a reporter for monitoring expression and purification [
14–
17]. Therefore, we constructed a recombinant plasmid pET-28-AgrC-GFP to express AgrC in
Escherichia coli. In addition, we optimized the quantity of correctly folded protein by adjusting several parameters, including the host cells, growth culture medium, inducer concentration, and induction temperature.
Here, we describe, for the first time, a GFP fluorescence-based approach to assess the expression, purification, and detergent solubility of full-length AgrC from the agr-I allele. In addition, we also describe the effect of different detergents on AgrC kinase activity. Stabilization of AgrC secondary structure after purification was assessed by CD spectroscopy. Although our primary model system is based on the production of the S. aureus AgrC, a similar approach can be used to overexpress other recombinant proteins. This study provides a basis for designing rational strategies to improve the yields of membrane protein preparations, and these findings also provide the first biochemical data on AgrC.
3. Experimental Section
3.1. Plasmid Construction
Before inserting AgrC into the expression vector, the location of the
C-terminus was confirmed to be in the cytoplasm using the online programs TMHMM and TOPCONS, which are common methods for predicting membrane protein topology [
29–
31].
The
agrC gene was amplified using primers containing
NcoI (Forward: 5′-
GGGGGCCATGGAATTATTAAATAGT-3′) and
BamHI (Reverse: 5′-
GGTGGATCCTTTGTTTAGTATTAG-3′) restriction endonuclease recognition site with
S. aureus chromosomal DNA used as the template. Restriction sites for
NcoI and
BamHI are underlined in the forward and reverse primers, respectively. The thermal cycling procedure included one cycle at 95 °C for 5 min, 30 repeated cycles at 95 °C for 30 s, 50 °C for 30 s, and 72 °C for 1 min, and 1 cycle at 72 °C for 10 min. The resulting PCR product was cloned into the pMD19-T vector (Takara, Shiga, Japan), and then the AgrC fragment was subcloned into the pET-28a vector using the restriction sites for
NcoI and
BamHI, whereas the
GFP gene was amplified from the pEGFP plasmid (Clontech, Mountain View, CA, USA). The
GFP gene fragment was then cloned into pET-28a-AgrC using the restriction endonucleases
BamHI and
HindIII, generating the expression plasmid pET-28a-AgrC-GFP (
Figure S1). The fusion protein carried a
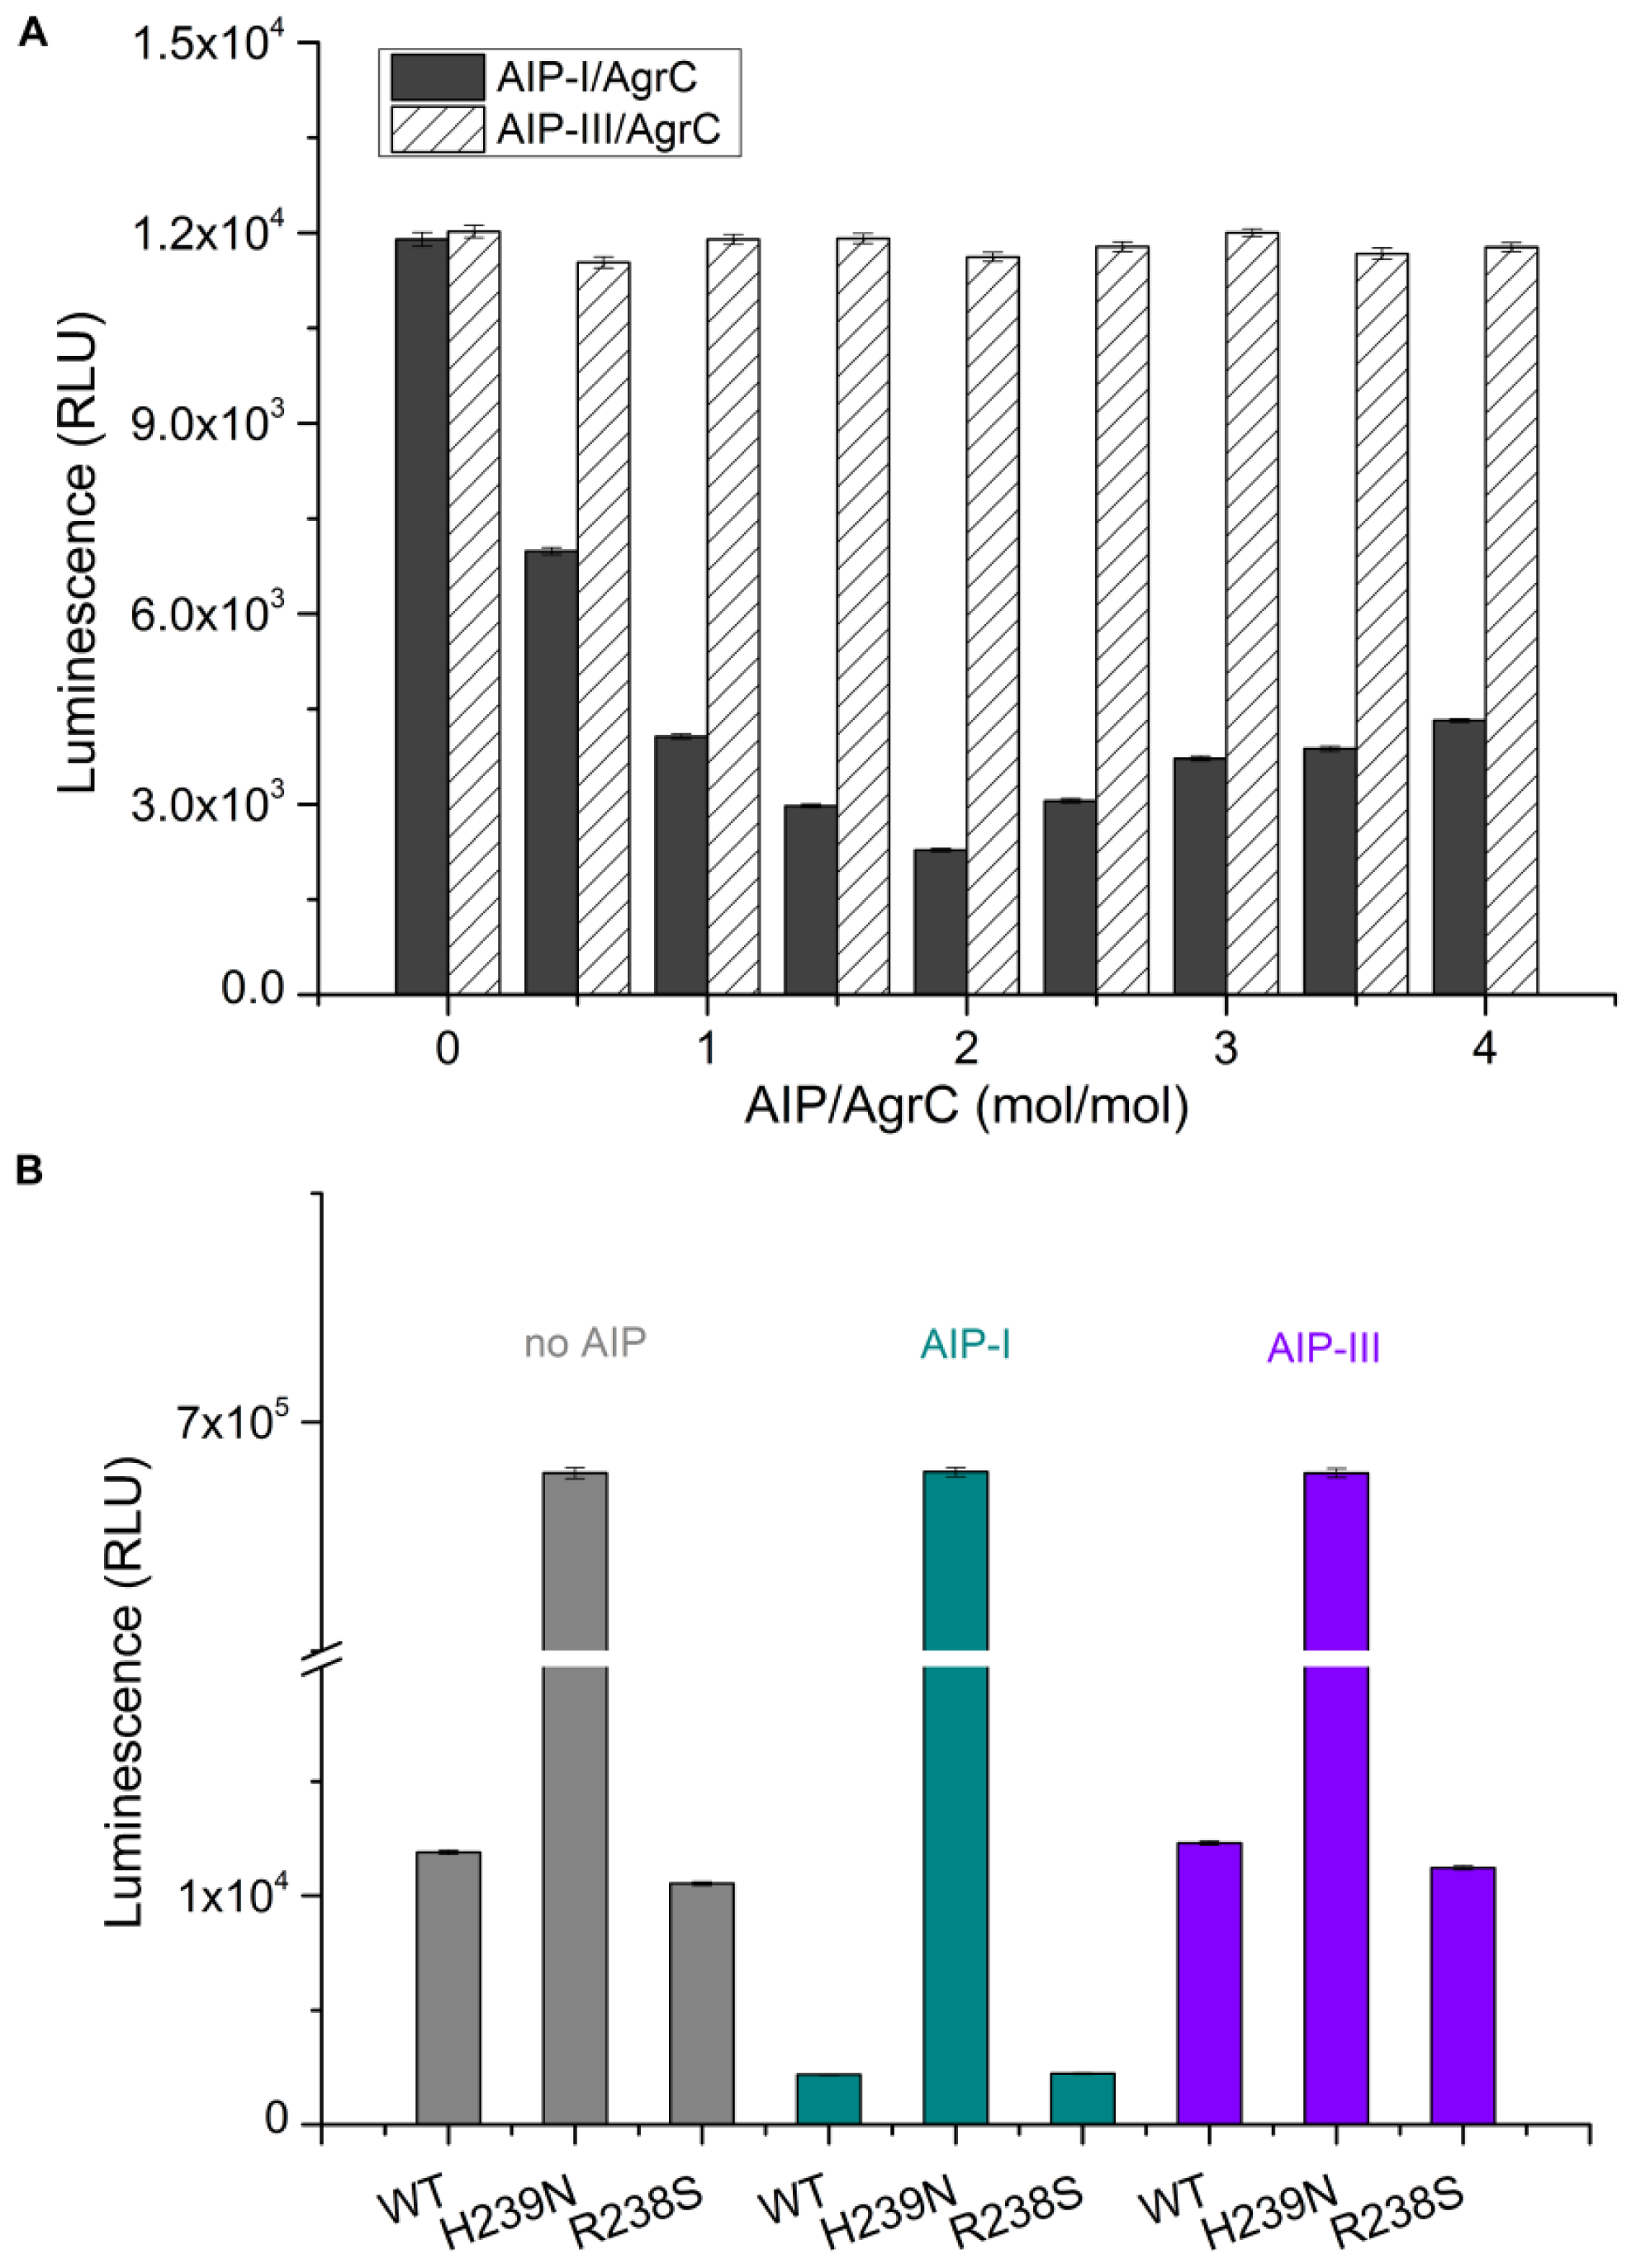
C-terminal 6× His tag. The AgrC mutants (R238S and H239N) were constructed by PCR using the QuickChange Site-Directed Mutagenesis Kit (Stratagene, La Jolla, CA, USA). DNA sequencing was used to verify the sequences of the constructed vectors.
3.2. Expression Screening of AgrC–GFP
To produce the AgrC–GFP fusion protein, the expression vector was introduced into the
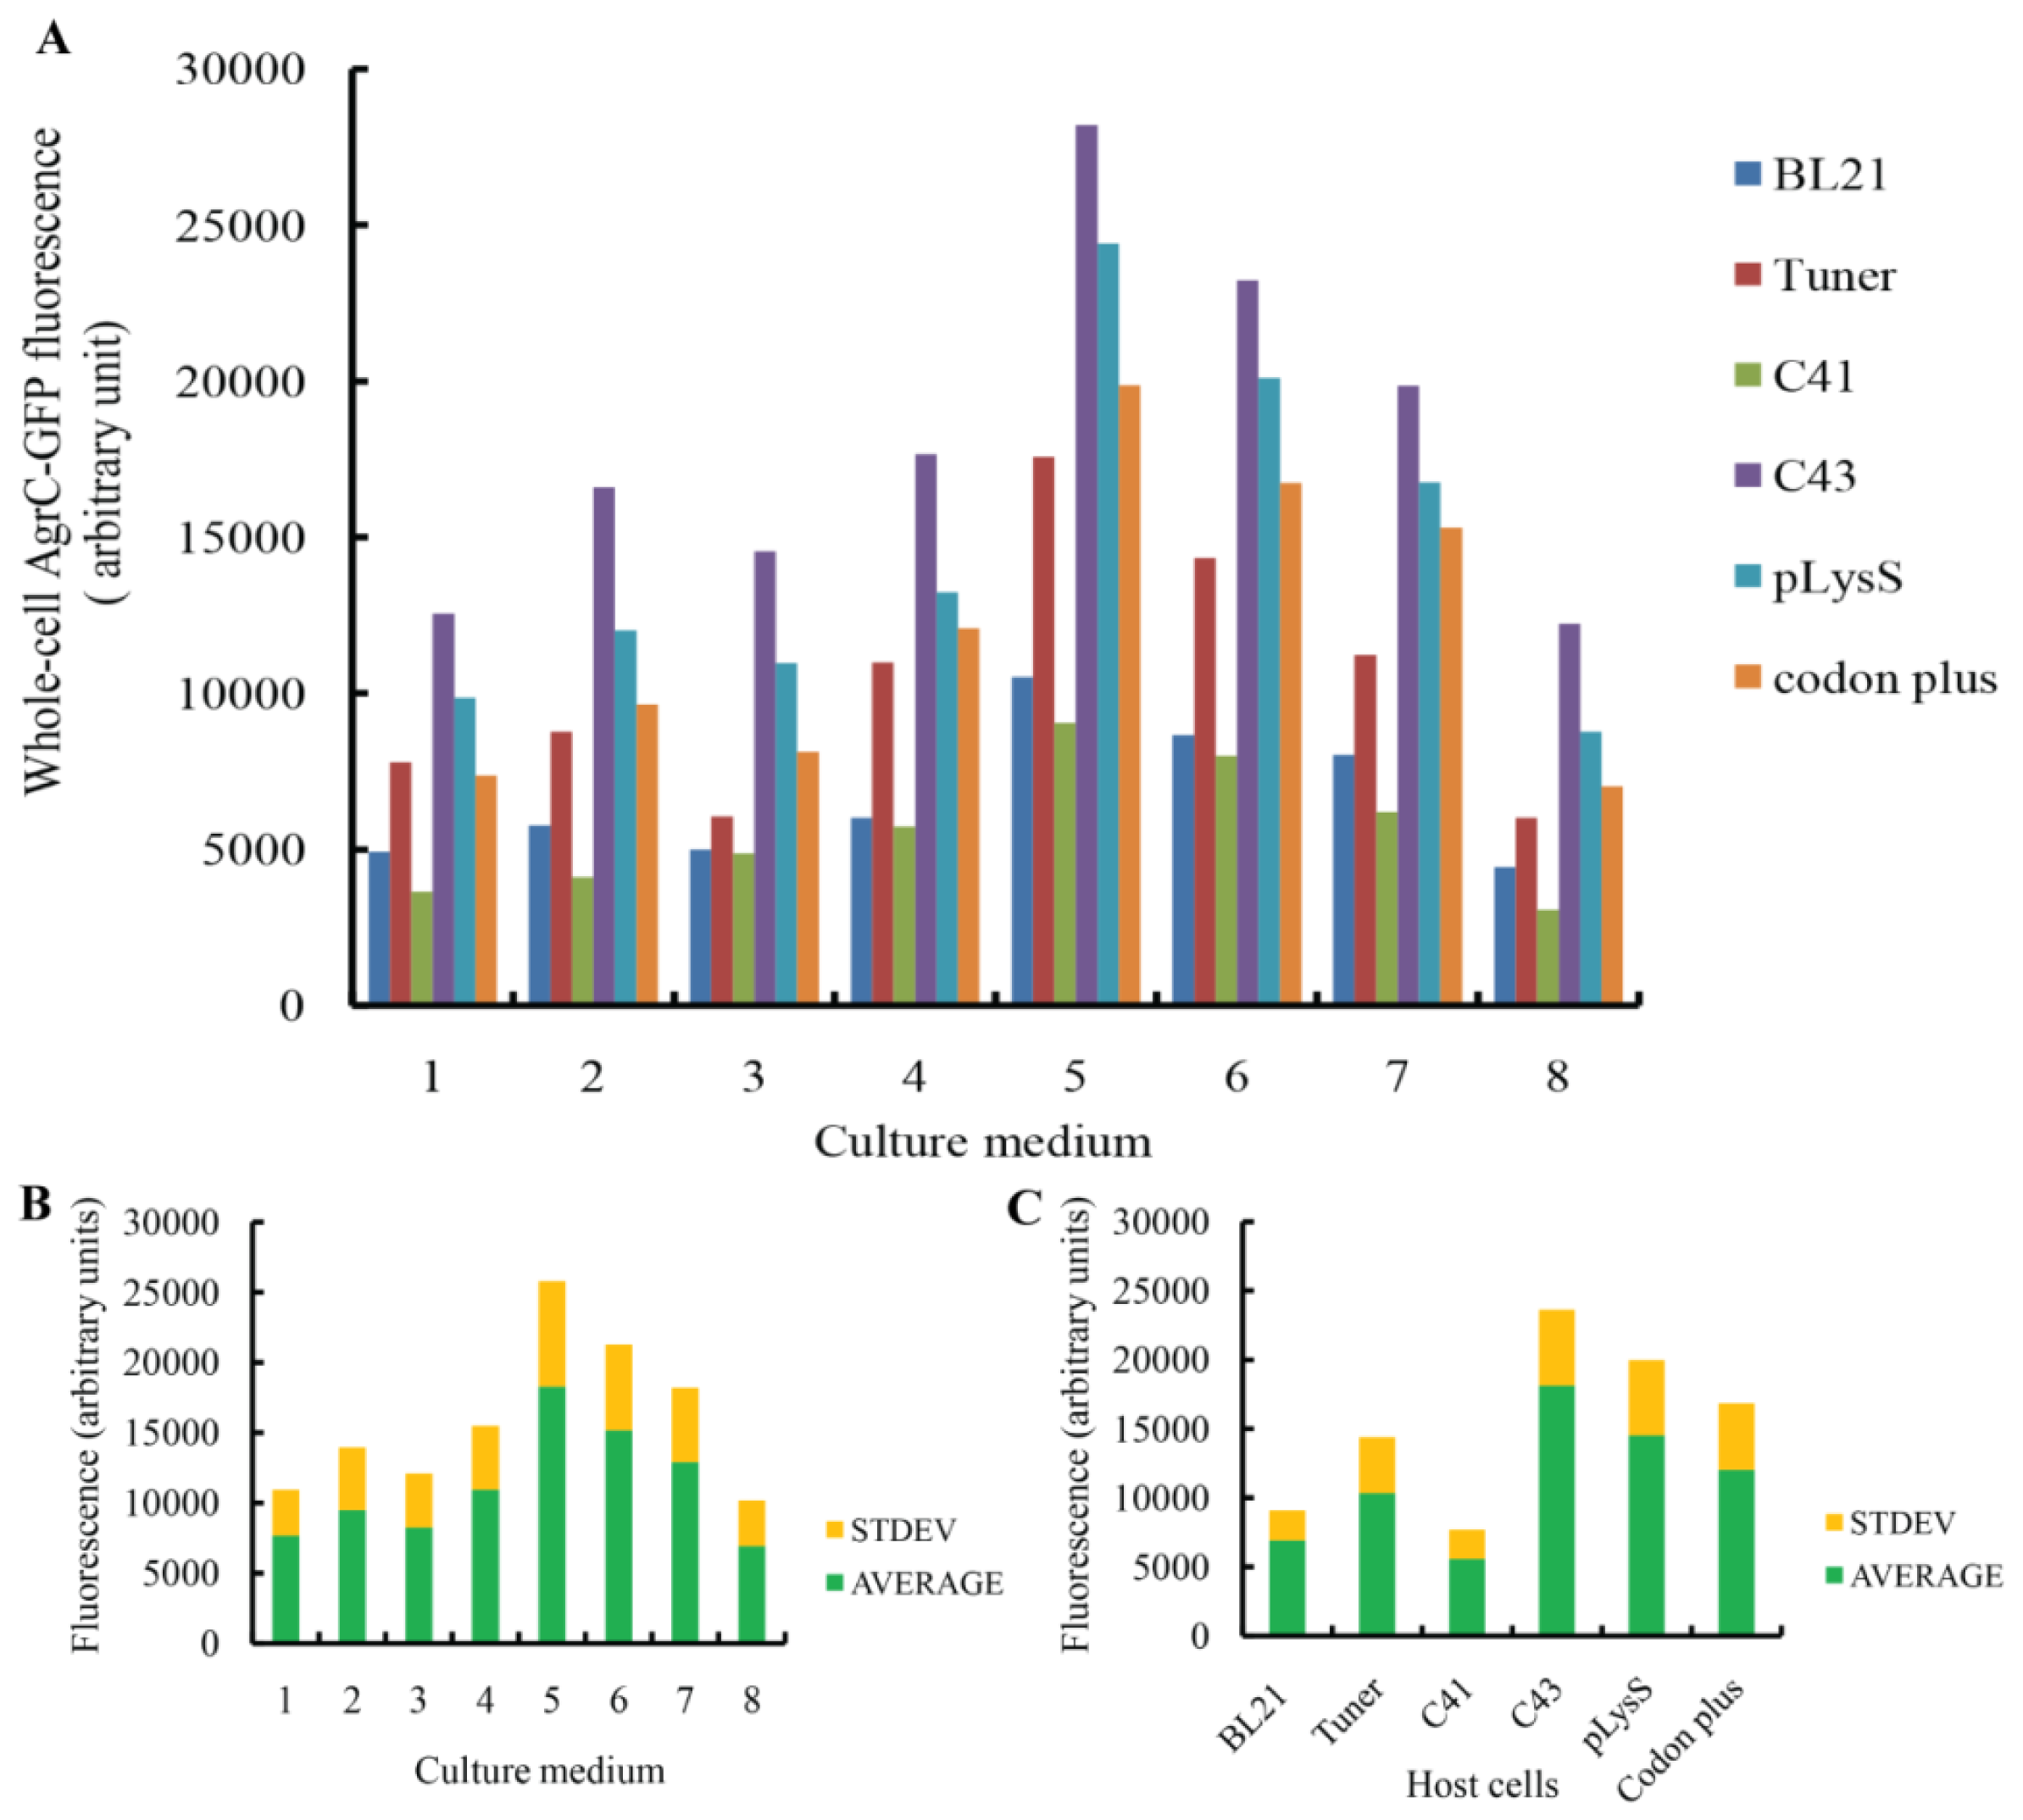
E. coli strains BL21(DE3), Tuner(DE3), C41(DE3), C43 (DE3), BL21 (DE3)-pLysS, and BL21-CodonPlus (DE3)-RIL. These host cells were grown in the nutrient-rich medium 32Y and several modified media, including LBE, LBE-LP, LBE-MP, 2× TYE, TBE, TB, and 4× TY (
Table 1) [
17,
21–
31]. Forty-eight different conditions were designed to screen for optimal combinations of medium and host strain. All combinations were cultured at 30 °C. For BL21 (DE3), Tuner (DE3), BL21 (DE3)-pLysS, and BL21-CodonPlus (DE3)-RIL cells, protein expression was induced with 0.1 mM IPTG at 20 °C after the cells reached an OD600 of ~0.5. For C41 (DE3) and C43 (DE3) cells, protein expression was induced at OD600 of 0.25–0.35 [
16]. Induced host cells containing an empty expression plasmid were used as negative controls.
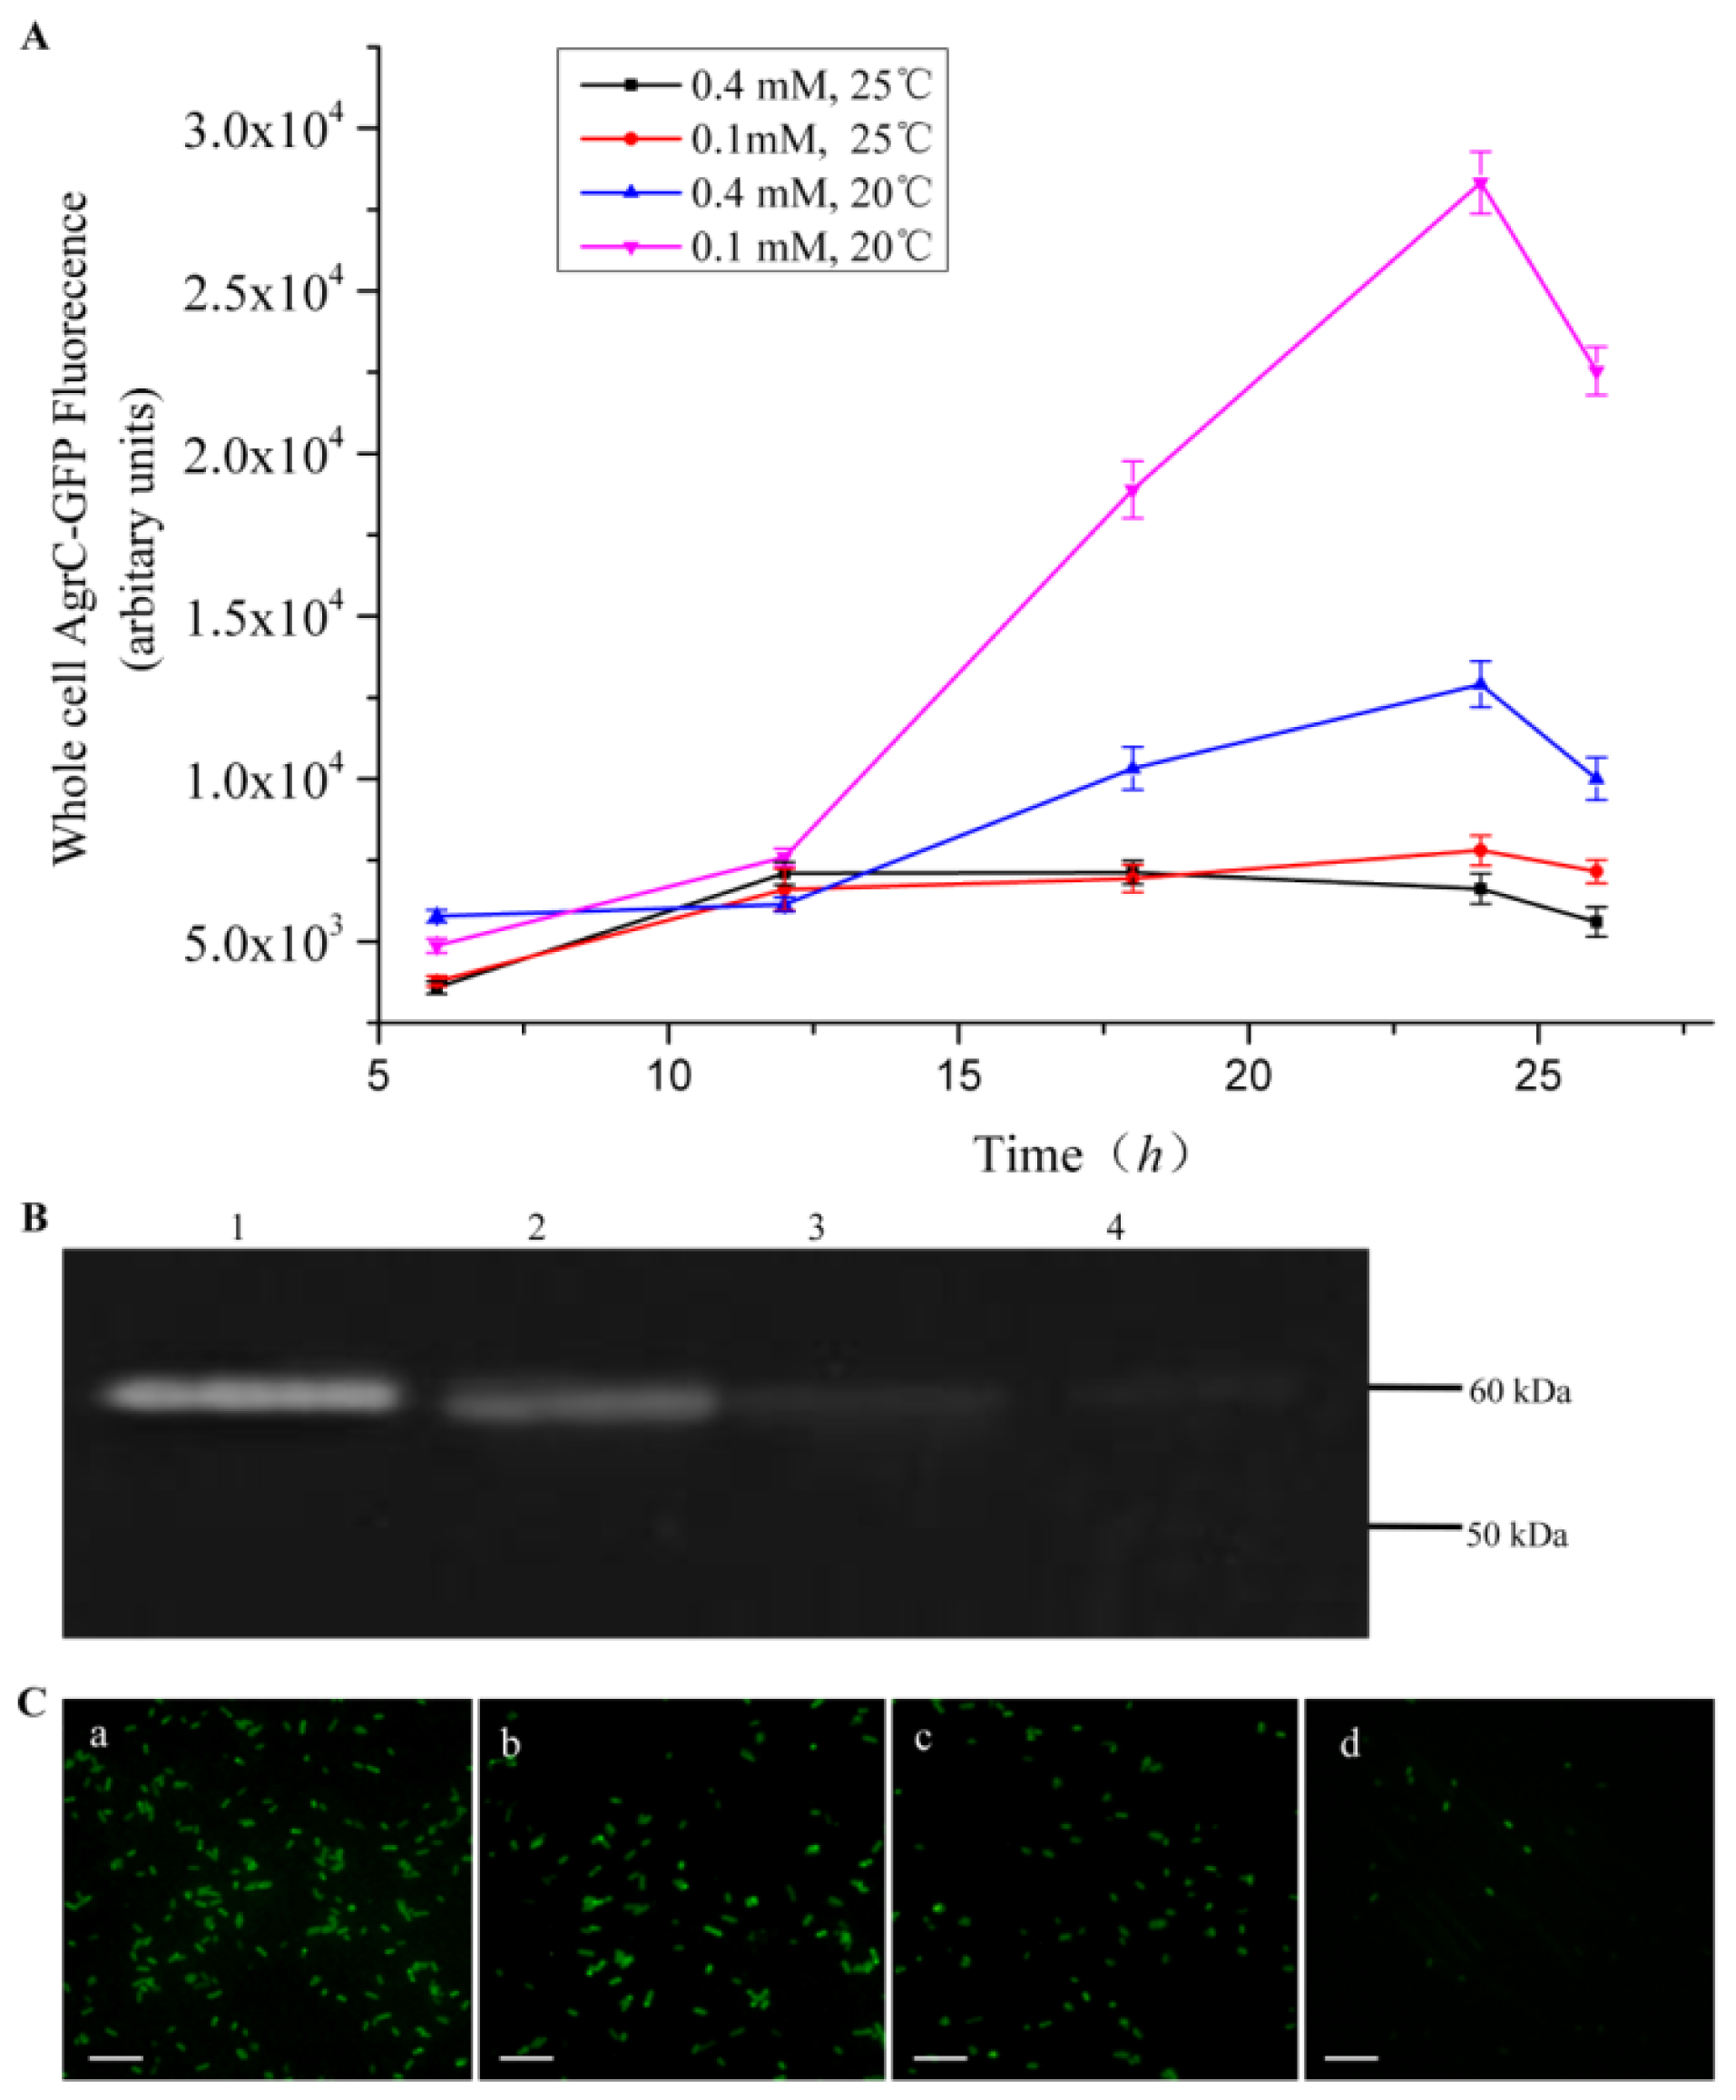
Comprehensive screening methods were developed to optimize protein expression levels. Specifically, we modified the inducer concentration and temperature. Duplicate cultures were grown at 20 °C or 25 °C, and protein expression was induced with 0.1 mM or 0.4 mM IPTG. We selected the combination of C43 and TBE for this screen because it produced the highest amount of AgrC among all the combinations of host cells and culture media. All cells were grown aerobically in 500-mL baffled shake flasks, each containing a 50-mL working volume with appropriate antibiotics. To monitor protein expression levels in real-time, we removed 200 μL of culture for whole-cell fluorescence measurements every 6 h.
3.3. Fluorescence Measurement
The fluorescence intensity of cultured cells was measured at regular intervals throughout the experiment using a fluorescence spectrophotometer (BioTeK, Winooski, VT, USA). Accumulation of the fusion protein AgrC-GFP was detected using an excitation wavelength of 485 nm and an emission wavelength of 510 nm. For fluorescence microscopy, cultures were diluted in ice-cold phosphate-buffered saline (PBS) to an OD600 of approximately 1.0 and then were mounted on a slide. Images were processed using DPcontroller ver. 2.2.1.227 software (Olympus, Tokyo, Japan).
3.4. Cell Disruption
After protein expression, cells were harvested by centrifugation at 8000× g for 10 min at 4 °C and washed twice with ice-cold PBS. Collected cells were resuspended in PBS (approximately 1.5 g of wet weight cells per 10 mL of PBS) containing MgCl2, imidazole, pefabloc SC, protease inhibitor cocktail, and DNase at final concentrations of 1 mM, 20 mM, 1 mg/mL, 1 tablet/50 mL, and 100 U/mL, respectively. Resuspended cells were rocked for 2 h on ice, followed by lysis through a High Pressure Homogenizer (JN-3000 PLUS) at a pressure of 800 bar at least three times at 4 °C. Lysed cells were subjected to centrifugated at 24,000× g for 20 min at 4 °C to remove unbroken cells and debris. The membranes were pelleted by ultracentrifugation at 300,000× g for 1 h and then solubilized by agitation in PBS buffer with the addition of detergent at 10× CMC and 10 mM imidazole for 1 h. Insoluble material was removed by ultracentrifugation at 200,000× g for 1 h.
3.5. SDS-PAGE and Western Blotting Analysis
Expressed proteins were subjected to SDS-PAGE, and then the SDS gel was rinsed with deionized H2O. Fluorescent bands were detected using a CCD camera system. Proteins were transferred from the gel onto a polyvinylidene difluoride (PVDF) membrane with a constant current of 90 mA for 1 h. The membrane was blocked with 1% non-fat milk powder in PBS buffer containing 0.05% (v/v) Tween-20. Mouse anti-His-tag antibody (SangonBiotech, Shanghai, China) was used as the primary antibody at a 1:2000 dilution in blocking solution. Rabbit-anti-Mouse horseradish peroxidase (HRP)-conjugated secondary antibody (SangonBiotech, Shanghai, China) was used at a dilution of 1:3000. Protein bands were detected on photographic films using an enhanced chemiluminescent substrate. Experiments were conducted with independent triplicate samples.
3.6. Detergent Selection
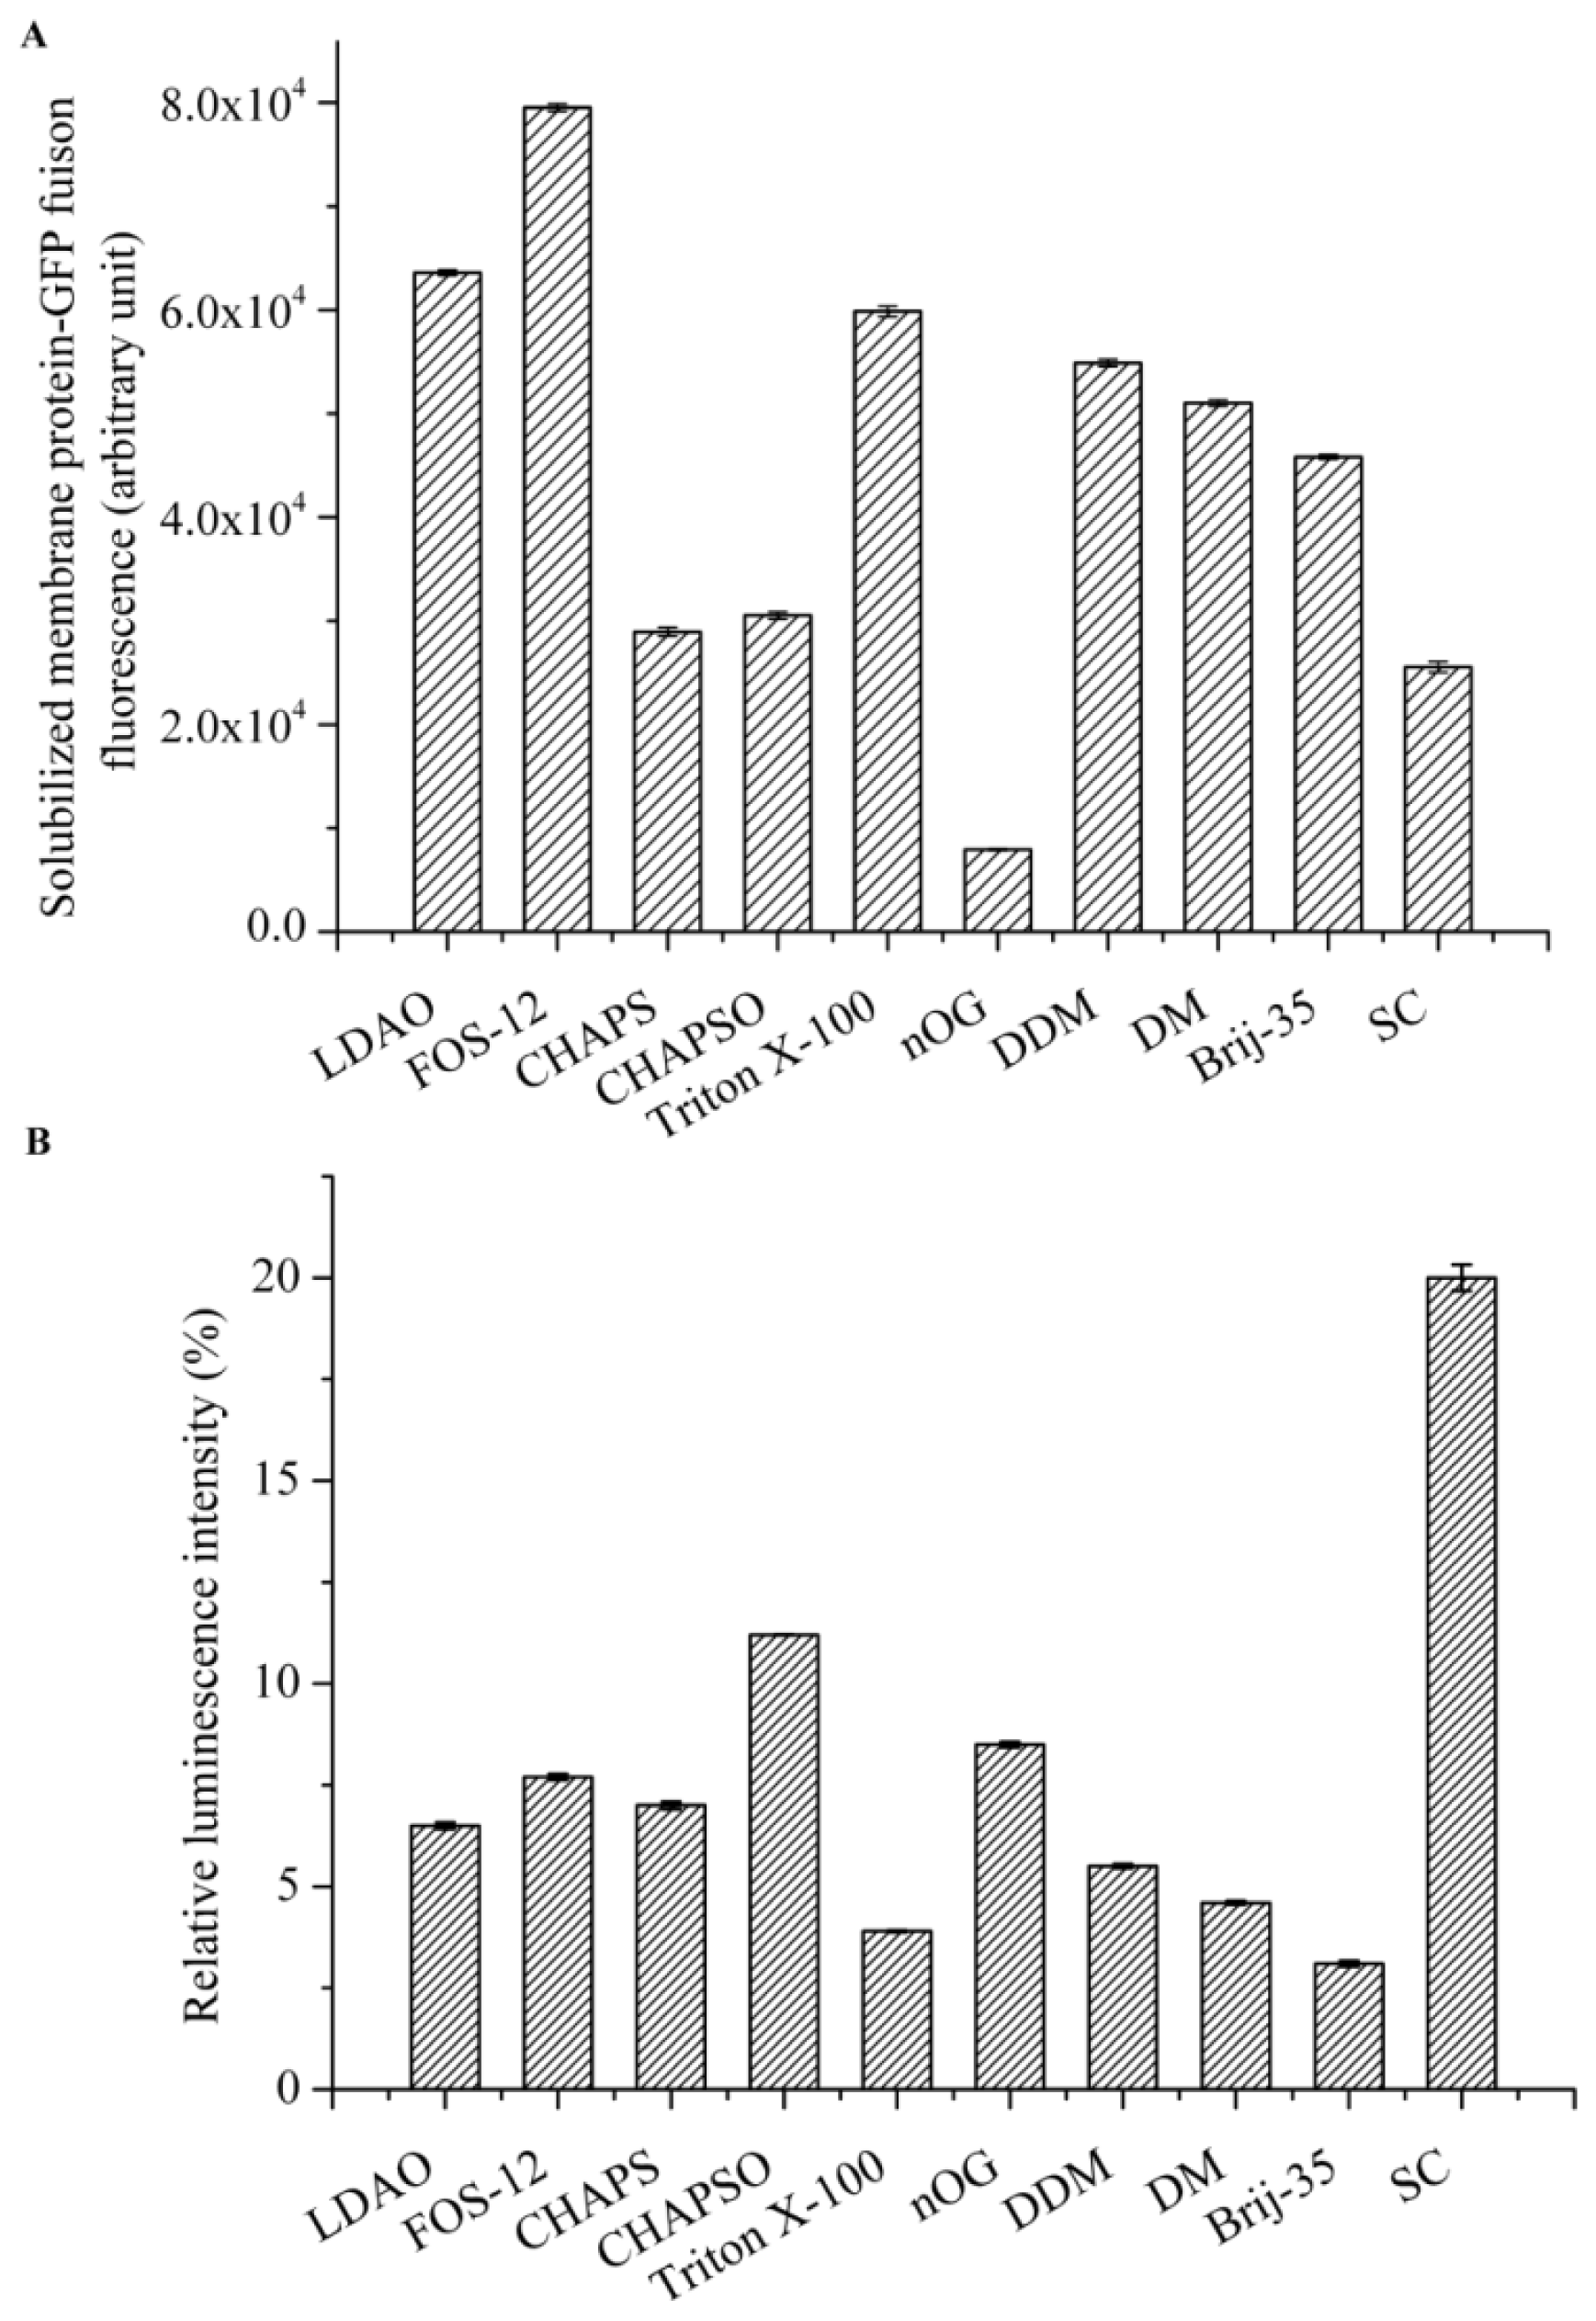
Detergent screening is vital for the effective solubilization of membrane proteins from the native membrane. We focused on detergents that are commonly used for the solubilization, purification, and crystallization of membrane proteins, including n-octyl-d-glucopyranoside (nOG), n-decyl-β-d-maltopyranoside (DM), n-dodecyl-β-d-maltopyranoside (DDM), Fos-Choline-12(Fos-12), C12E23 (Brij-35), 3-[(3-cholamidopropyl)-dimethylammonio]-1-propane sulfonate (CHAPS), 3-[(3-cholamidopropyl) dimethylammonio]-2-Hydroxy-1-Propanesulfonate (CHAPSO), N,N-dimethyldode-cylamine N-oxide (LDAO), sodium cholate (SC), and Triton X-100. All detergents were purchased from Sigma (St. Louis, MO, USA) at the highest purities available.
Cell membranes that were suspended in PBS were adjusted to a protein concentration of 10 mg/mL and the following detergents were evaluated: Fos-12, LDAO, CHAPS, CHAPSO, DDM, DM, nOG, Brij-35, Triton X-100, and SC typically at 10× CMC. Solubilization was carried out by gentle agitation for 2 h on ice. After centrifugation at 200,000× g for 50 min at 4 °C, the supernatant containing the solubilized AgrC-GFP was collected, and the best detergent for membrane solubilization was determined by measuring GFP fluorescence in 200 μL of the supernatant.
The intrinsic kinase activity of AgrC in various detergent micelles was measured by quantitating the amount of ATP remaining in solution following a kinase reaction using Kinase-Glo® Luminescent Kinase Assay Kit (Promega, Fitchburg, WI, USA). The assay was performed in 96-well white plates in 50 μL kinase reaction volumes containing 100 μg AgrC and 5 μM ATP in assay buffer consisting of 10 mM HEPES (pH 7.4), 10 mM MgCl2, 50 mM KCl, and 10× CMC detergent. Negative controls were reaction mixtures containing no AgrC. The kinase reaction mixture was incubated at 37 °C for 20 min. Following incubation, 50 μL of ATP detection reagent was added to the assay plates. The plates were incubated at 37 °C for another 10 min, and relative light unit (RLU) signal was collected using the Synergy2 Multi-Mode Microplate Reader (BioTek, Winooski, VT, USA). The luminescent signal was positively correlated with the amount of ATP present and is inversely correlated with the amount of kinase activity.
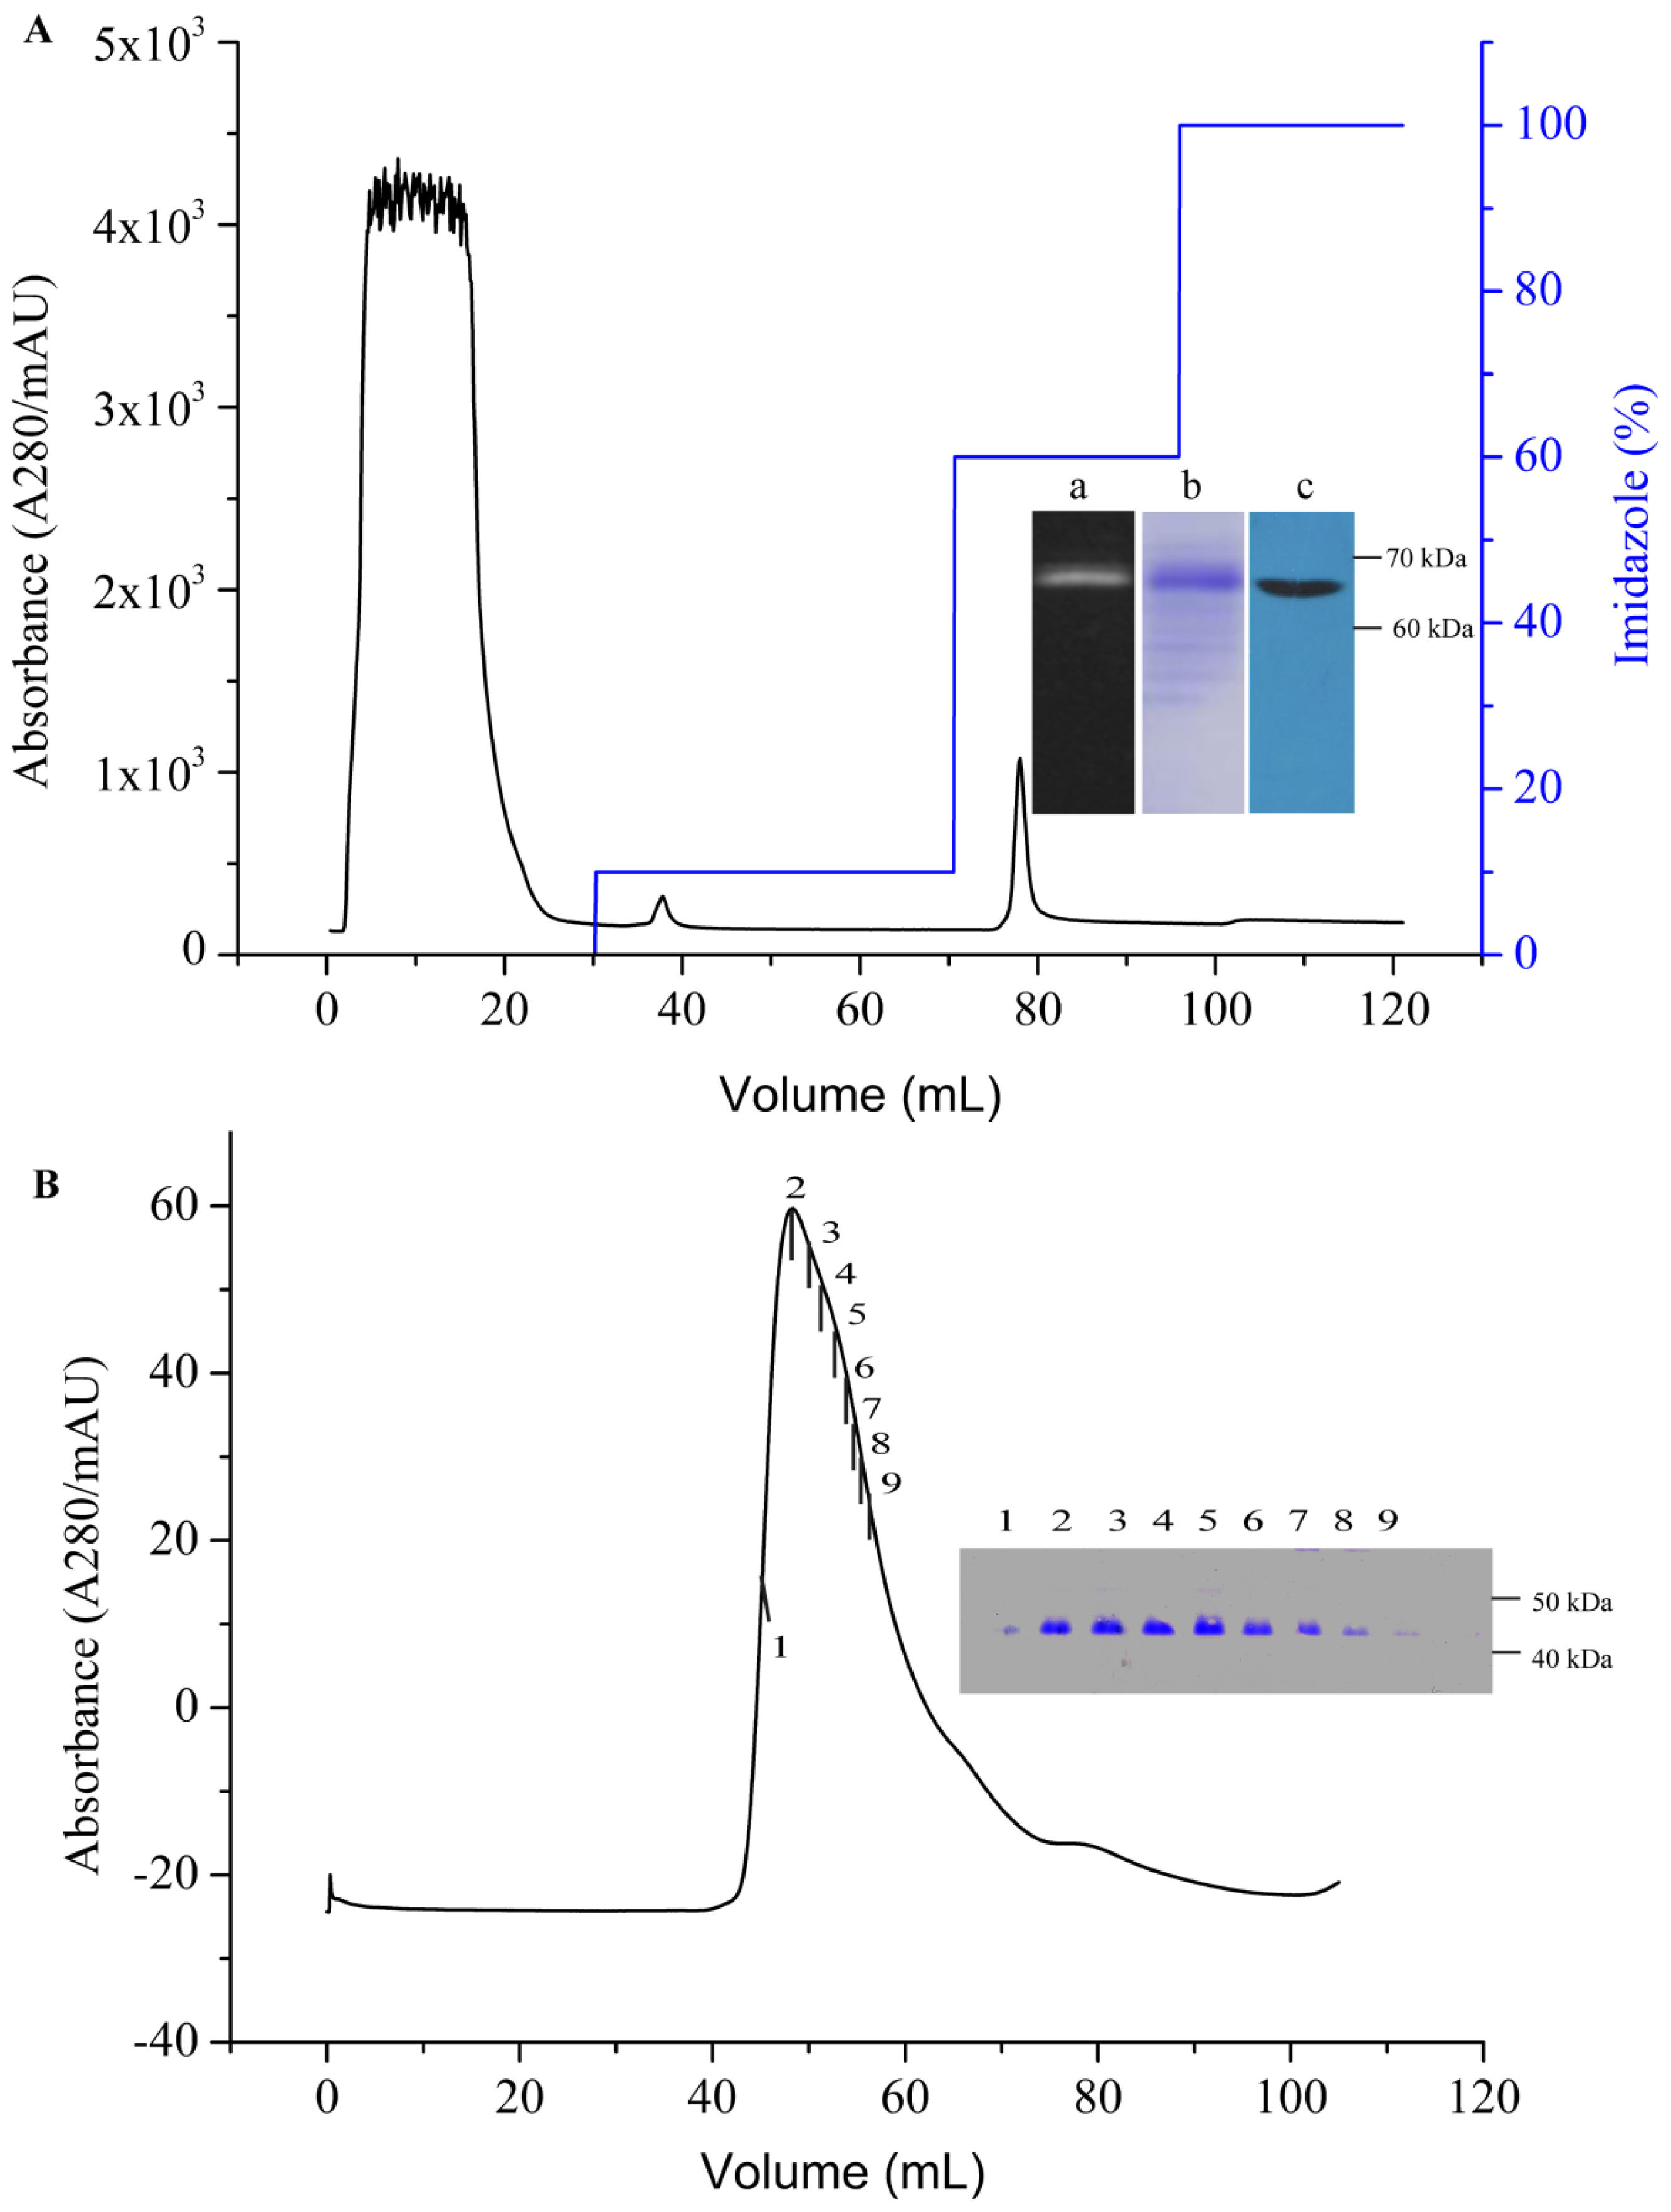
3.7. Purification of AgrC–GFP
An immobilized metal affinity chromatography (IMAC) column (HisTrap HP, 5 mL) was first equilibrated with five column volumes (CV) of binding buffer (PBS containing 10% (v/v) glycerol, 10× CMC detergent, and 20 mM imidazole, pH 7.6) at a flow rate of 1 mL/min. The supernatant containing AgrC–GFP was then loaded onto the column at a reduced flow rate of 0.5 mL/min to maximize the binding of the protein to the resin. The resins were then washed with the binding buffer to remove non-specifically bound proteins. The target protein was eluted using elution buffer (binding buffer containing 500 mM imidazole) through gradient elution. Purified AgrC–GFP was concentrated using an Amicon Ultrafree centrifugal filter (Millipore Corporation, Billerica, MA, USA) with a cutoff of 10 kDa, which simultaneously removed imidazole from the protein. The TEV digestion was performed at 16 °C for 5 h with a 10:1 TEV protease to fusion protein molar ratio. The digested sample was incubated with IMAC nickel resin and binding Buffer for 30 min. The flow-through containing the AgrC was subjected to size-exclusion chromatography at a flow rate of 1.0 mL/min on a Superdex-200 HiLoad 10/600 column (GE Healthcare, New York, NY, USA) that had been equilibrated with 10 mM HEPES buffer (pH 7.4) containing 100 mM NaCl, 10% glycerol and 10× CMC detergent. Protein concentration was determined using the BCA assay according to manufacturer’s instructions (Pierce, Rockland, IL, USA). The fractions containing the GFP-His6 tag in nickel resin were eluted.
3.8. Circular Dichroism (CD) Spectroscopy
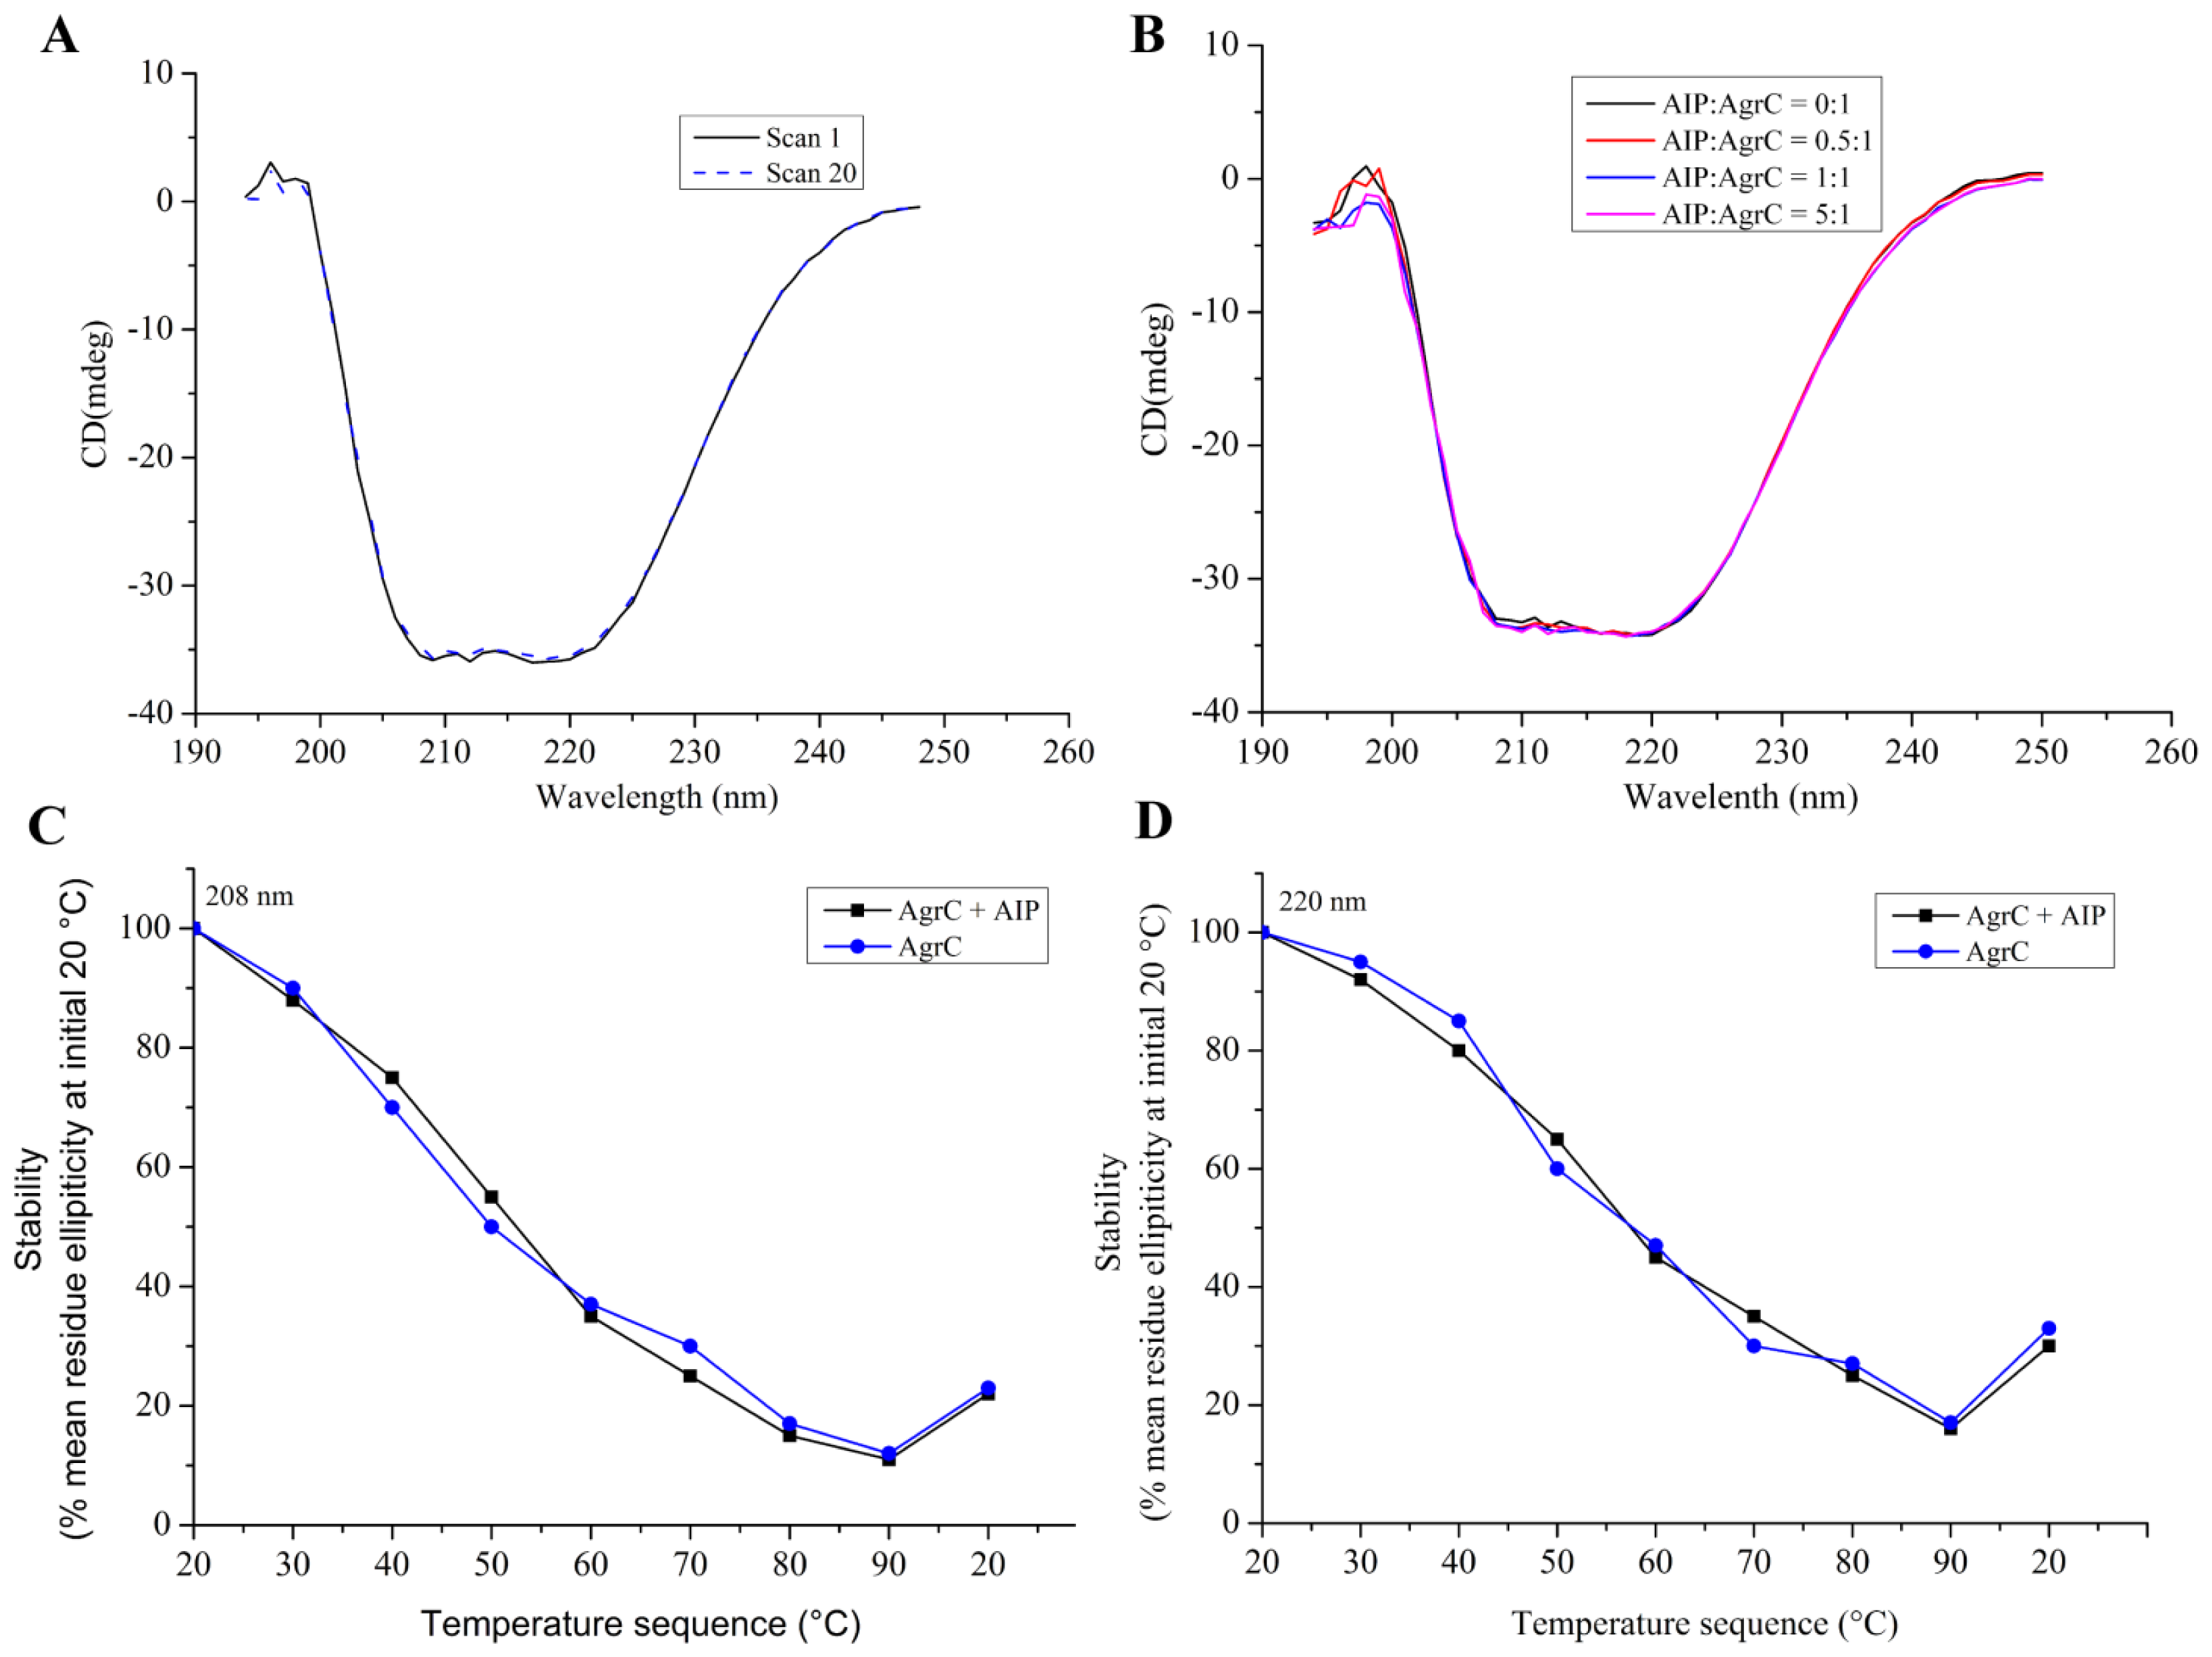
CD was performed on a MOS-450 spectrometer (Bio-Logic, Alpes, France) with a 0.1 cm path length quartz cuvette. Samples were typically prepared in 10 mM HEPES pH 7.4 containing detergent at 10× CMC, 100 mM NaCl, and 10% glycerol. Spectra were obtained routinely at 20 °C. For measurements in the far UV range (190–250 nm) the concentration of AgrC was 0.5 mg/mL. Using sample volumes of 200 μL, 20 scans were acquired at standard sensitivity using an integration time of 1 s, a path length of 0.02 cm and a slit width of 0.5 mm that was equivalent to a 3 nm bandwidth. To determine the effects of AIP-I on the AgrC spectrum in this region, AIP-I (dissolved in 0.01% dimethylsulfoxide (DMSO)) was added at molar ratios of 0:1, 0.5:1, 1:1, and 5:1 AIP: AgrC with a 10-min incubation period following each addition of the samples before acquiring the spectra. DMSO exerted no significant effect on the AgrC spectrum, which was verified by subtraction of the spectrum that was obtained from a control sample that contained the maximum DMSO concentration. To investigate if AIP-I binding affects the thermal stability of AgrC, stabilized AgrC was incubated in the presence or absence of five-fold AIP-I at 20 °C, and spectra (208 nm and 220 nm) were obtained over a range of temperatures starting at 20 °C and increasing incrementally to 90 °C, with a 5-min equilibration period followed by a return to 20 °C at each step of the 20-min equilibration time.
4. Conclusions
Overexpression of membrane proteins remains a major challenge for biochemical and structural studies due to their partially hydrophobic surfaces and lack of stability. In this study, we assessed whether a GFP-containing fusion protein can be used to expedite the screening of protein expression systems. As our experimental model, we synthesized the membrane protein AgrC that was C-terminally fused to GFP. The GFP-moiety allowed for real-time monitoring of protein expression level using fluorescence detection. With whole-cell fluorescence measurements combined with in-gel fluorescence, western blot, and fluorescence microscopy methods, we screened multiple expression systems and identified the optimal combination to be that of C43 host cells, TEB culture medium, 20 °C assay temperature, and 0.1 mM IPTG for induction. More importantly, our results suggest that the use of the whole-cell fluorescence detection method provides a rapid evaluation of membrane protein expression levels with a limited investment in labor, which is in strong contrast to the traditional labor-intensive methods for overexpression screening using SDS-PAGE and western blot.
Detergents are an essential component for any membrane protein purification procedure and constitute a complicated variable that needs to be extensively investigated [
23,
32]. Detergent screening has important implications for protein stability, homogeneity, and activity. However, it is impossible to predict which detergent will be suitable for the extraction, purification, and retention of activity of a given membrane protein. We assessed the effect of different detergents on AgrC protein kinase activity and membrane solubilization. These experiments aimed to assess whether the overexpressed protein would be of suitable quality for further biophysical and biochemical analyses. We determined that the detergent Brij-35 was the optimal choice. In addition, we demonstrated that the level of AgrC autophosphorylation was significantly increased by five-fold in response to a two-fold molar excess of AIP-I. These results not only demonstrate a direct and specific interaction between the sensor kinase AgrC and its signaling molecule AIP-I but also confirm the potential of such an approach in future
in vitro studies of signal recognition using other sensor kinases.
Far-UV CD analysis showed that AgrC in the presence of Brij-35 maintained its secondary structure. The CD spectra that we obtained were characteristic of a typical α-helical membrane protein (
Figure 6A). Therefore, the purification method that we selected was suitable for obtaining correctly-folded protein with good structural integrity. Moreover,
Figure 6B demonstrated that AIP-I exerted little effect on the secondary structural composition of AgrC.
Figure 6C,D indicated that there was also no detectable effect of AIP-I on the thermal stability of AgrC. Further evaluation of the effect of different detergents on AgrC secondary structure is recommended.
The methods in this paper may be applied to the studies of other membrane proteins. Our data may serve as a strong basis for developing rational strategies to improve the quality and quantity of membrane protein preparations.


