
Comprehensive DNA Adduct Analysis Reveals Pulmonary Inflammatory Response Contributes to Genotoxic Action of Magnetite Nanoparticles

Abstract
:
1. Introduction
2. Results and Discussion
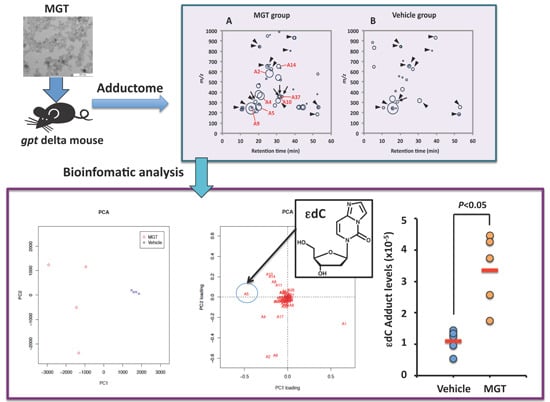
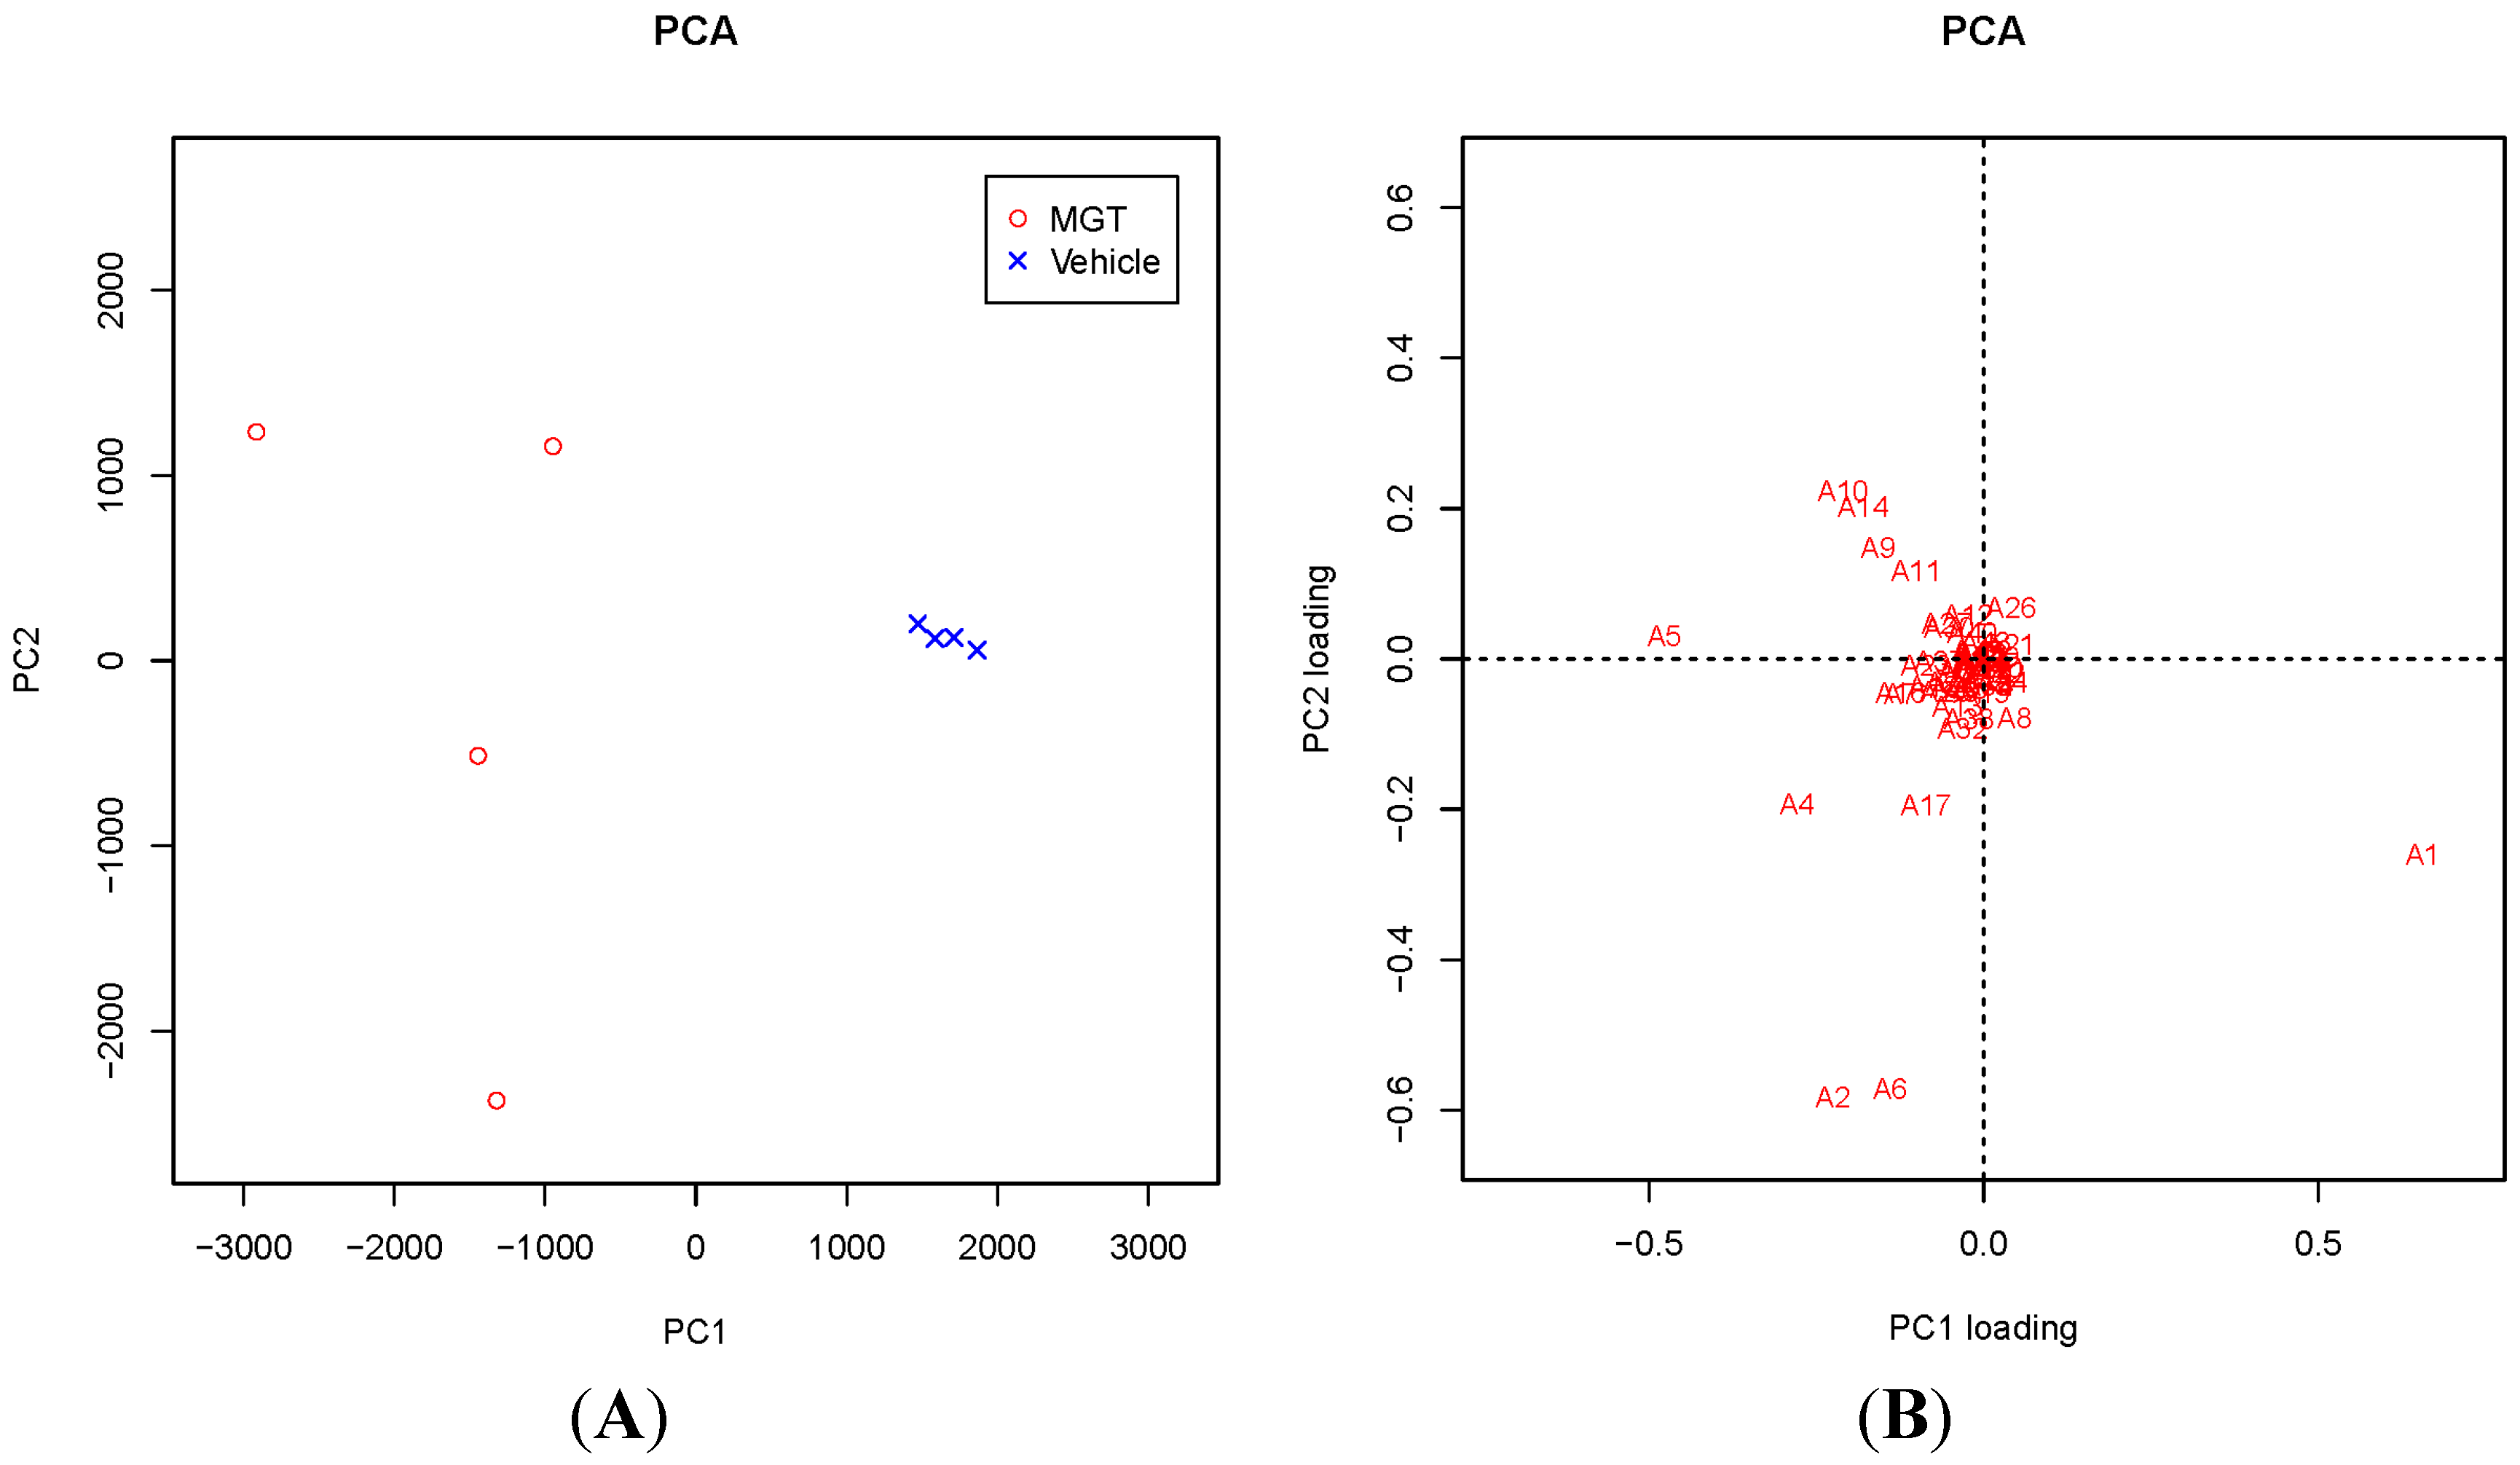
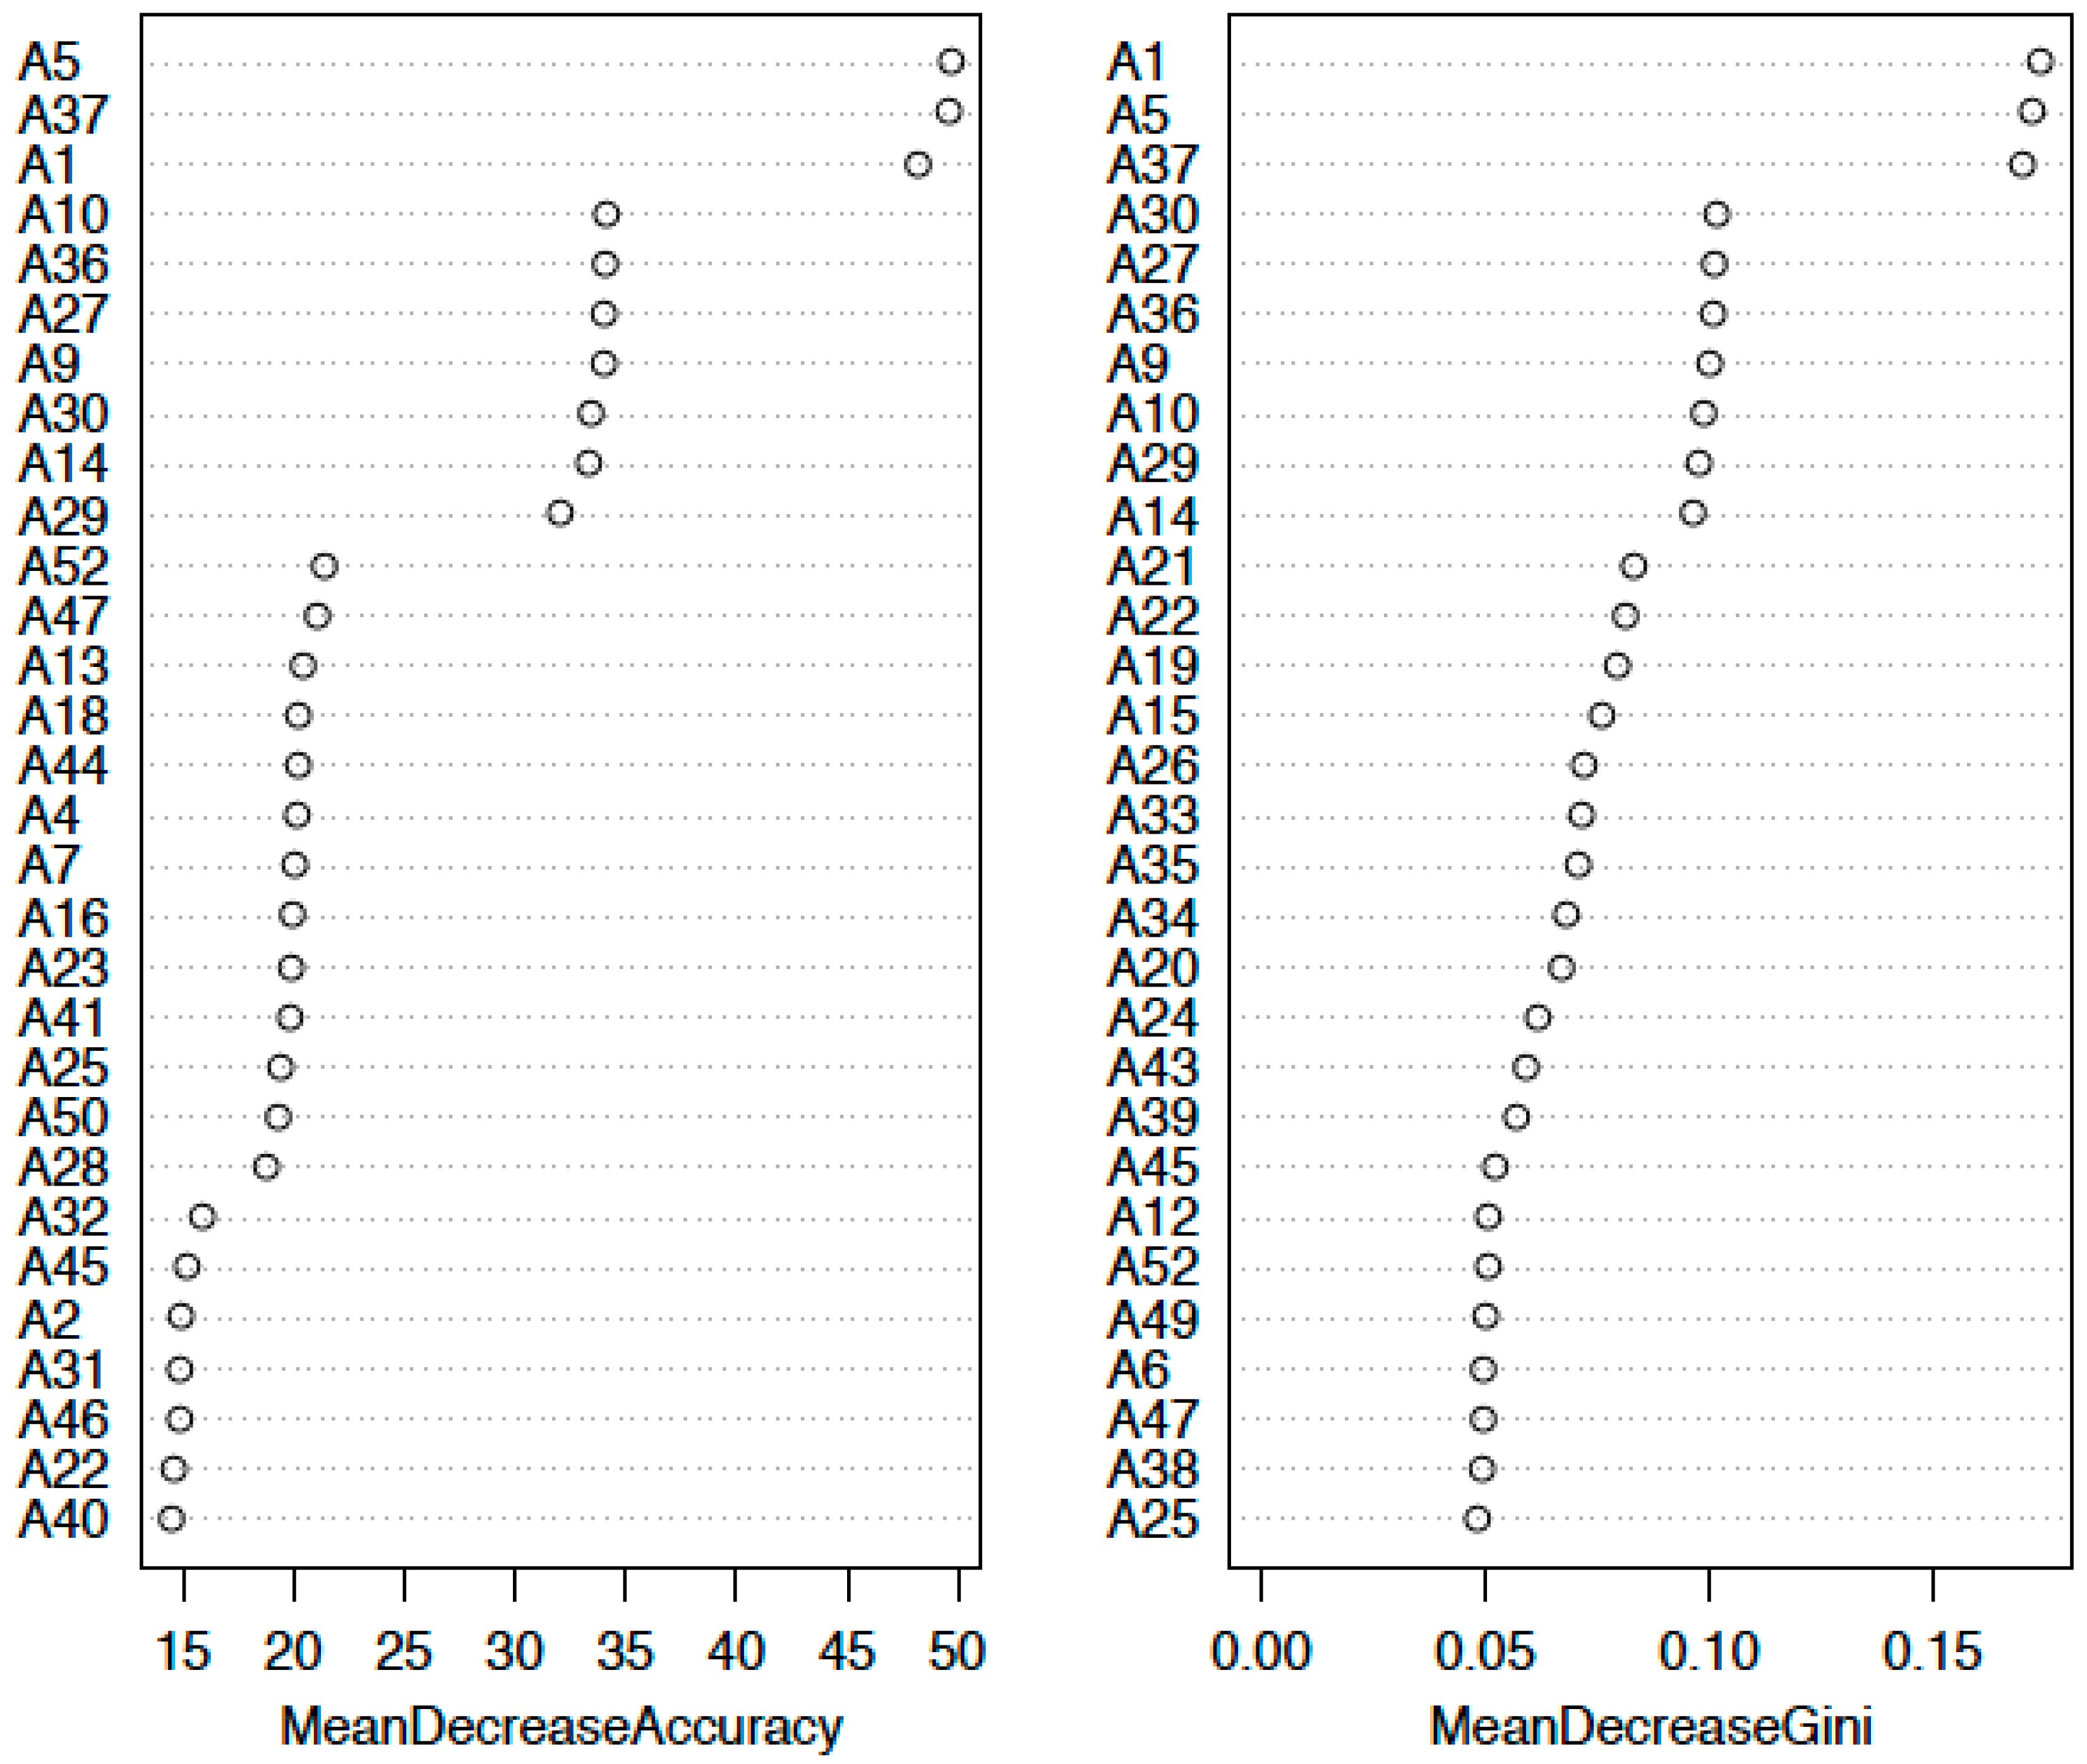
2.1. Comprehensive Analysis of DNA Adducts Induced by MGT (Nanosized-Magnetite) Treatment


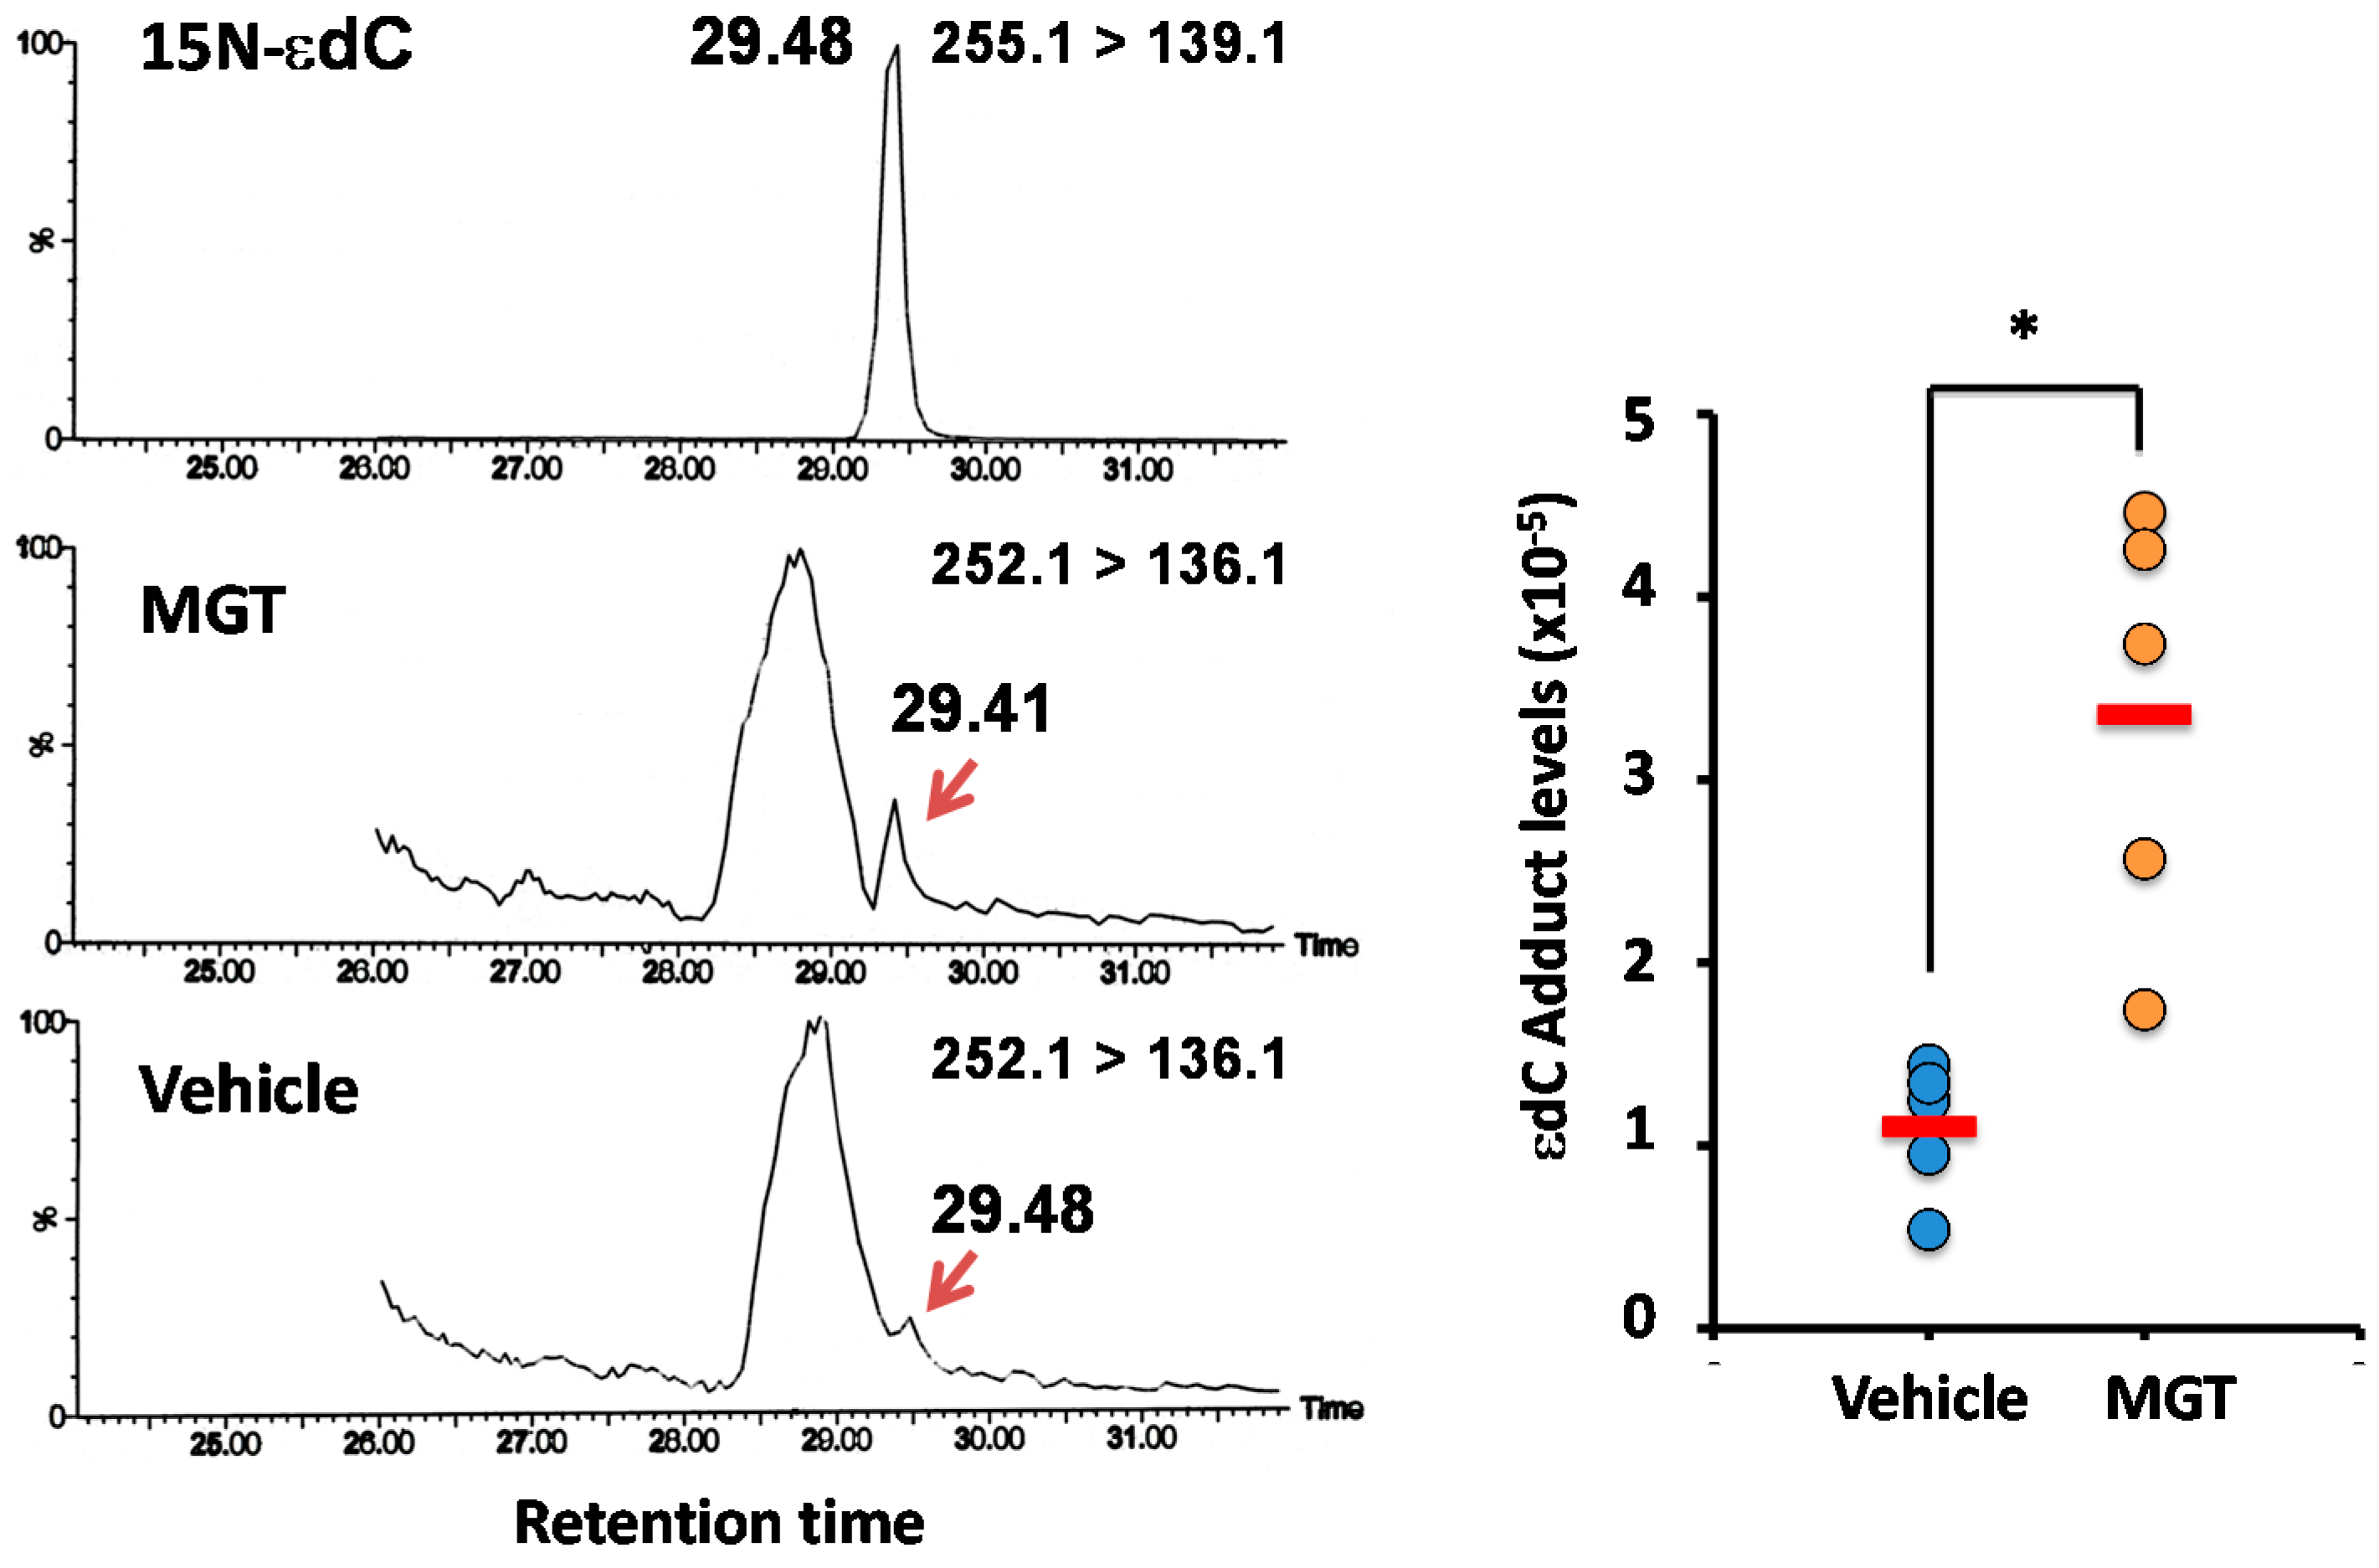
2.3. Confirmation of DNA Adducts Correlated with MGT Treatment

3. Experimental Section
3.1. Materials
3.2. Chemicals
3.3. Animals
3.4. Analysis of DNA Adducts
3.4.1. Comprehensive Analysis of DNA Adducts (DNA Adductome Analysis)
3.4.2. Data Processing
3.4.3. In Vitro Modification of DNA
3.4.4. Confirmation of εdC
3.5. Statistical Analysis
4. Conclusions
Acknowledgments
Author Contributions
Appendix

| Peak No. | RT (min) | m/z | Area Mean ± SD | p-Value (t Test) | Fold Change | |
|---|---|---|---|---|---|---|
| MGT | Vehicle | |||||
| 1 | 16.0 | 242.11 | 4867 ± 722 | 4938 ± 2414 | 0.485 | 0.99 |
| 2 | 25.9 | 580.79 | 2389 ± 837 | - | - | - |
| 3 | 21.4 | 363.17 | 2016 ± 850 | - | - | - |
| 4 | 20.1 | 252.11 | 1543 ± 375 | - | - | - |
| 5 | 31.0 | 543.33 | 1273 ± 732 | - | - | - |
| 6 | 44.4 | 252.11 | 1099 ± 669 | - | - | - |
| 7 | 30.9 | 317.17 | 957 ± 125 | 676 ± 363 | 0.294 | 1.41 |
| 8 | 16.0 | 243.12 | 775 ± 112 | - | - | - |
| 9 a | 31.5 | 355.23 | 758 ± 221 | - | - | - |
| 10 | 18.8 | 219.11 | 703 ± 819 | - | - | - |
| 11 | 20.0 | 463.73 | 677 ± 504 | - | - | - |
| 12 | 31.0 | 652.37 | 632 ± 249 | - | - | - |
| 13 | 25.0 | 655.40 | 591 ± 188 | 493 ± 39 | 0.106 | 1.20 |
| 14 | 28.9 | 273.18 | 491 ± 205 | - | - | - |
| 15 | 41.8 | 252.11 | 471 ± 111 | - | - | - |
| 16 c | 18.4 | 308.13 | 468 ± 129 | 293 ± 27 | 0.010 | 1.59 |
| 17 | 53.0 | 252.11 | 458 ± 182 | 455 ± 162 | 0.447 | 1.03 |
| 18 | 52.5 | 181.98 | 415 ± 167 | 387 ± 156 | 0.425 | 1.07 |
| 19 | 26.9 | 622.79 | 411 ± 132 | 349 ± 110 | 0.287 | 1.18 |
| 20 | 39.7 | 928.61 | 379 ± 137 | 384 ± 83 | 0.490 | 0.99 |
| 21 | 20.2 | 841.27 | 317 ± 310 | 259 ± 179 | 0.452 | 1.23 |
| 22 | 11.0 | 230.11 | 295 ± 82 | - | - | - |
| 23 b | 32.9 | 360.21 | 269 ± 98 | - | - | - |
| 24 | 25.0 | 946.44 | 265 ± 154 | - | - | - |
| 25 | 20.2 | 284.13 | 252 ± 34 | - | - | - |
| 26 | 10.9 | 250.08 | 252 ± 70 | 264 ± 135 | 0.176 | 0.95 |
| 27 | 52.5 | 575.30 | 213 ± 49 | - | - | - |
| 28 a | 31.4 | 356.24 | 207 ± 50 | - | - | - |
| 29 | 32.0 | 517.69 | 174 ± 79 | - | - | - |
| 30 | 25.0 | 656.40 | 136 ± 33 | 115 ± 11 | 0.393 | 1.19 |
| 31 | 24.2 | 530.75 | 117 ± 38 | - | - | - |
| 32 | 52.8 | 253.11 | 108 ± 83 | - | - | - |
| 33 | 31.4 | 988.64 | 98 ± 23 | - | - | - |
| 34 | 37.5 | 800.44 | 70 ± 27 | 61 ± 13 | 0.451 | 1.14 |
| 35 | 39.1 | 429.25 | 58 ± 10 | - | - | - |
| 36 | 16.0 | 245.23 | 53 ± 27 | - | - | - |
| 37 | 52.4 | 382.20 | 50 ± 10 | - | - | - |
| 38 | 20.4 | 842.28 | 47 ± 41 | 123 ± 56 | 0.367 | 0.38 |
| 39 | 32.1 | 633.74 | 33 ± 25 | - | - | - |
| 40 | 32.1 | 634.10 | 33 ± 4 | - | - | - |
| 41 | 26.3 | 961.47 | 26 ± 14 | - | - | - |
| 42 | 26.4 | 667.80 | 19 ± 9 | - | - | - |

| Adduct | Precurser (M + H) | Product (Deoxyribose Loss) | Ref. | Na 22.9898 | K 39.0983 | NH3 18.0379 |
|---|---|---|---|---|---|---|
| 5-MedC | 242.1140 | 126.0666 | - | 264.0960 | 280.2045 | 259.1441 |
| dU | 229.0824 | 113.0350 | [36] | 251.0644 | 267.1729 | 246.1125 |
| dI | 253.0936 | 137.0462 | [36] | 275.0756 | 291.1841 | 270.1237 |
| dX | 269.0886 | 153.0412 | [36] | 291.0706 | 307.1791 | 286.1187 |
| dO | 269.0886 | 153.0412 | [36] | 291.0706 | 307.1791 | 286.1187 |
| 8-Oxo-dG | 284.0994 | 168.0520 | [37] | 306.0814 | 322.1899 | 301.1295 |
| Sp | 300.0944 | 184.0470 | [38] | 322.0764 | 338.1849 | 317.1245 |
| Gh | 274.1151 | 158.0677 | [38] | 296.0971 | 312.2056 | 291.1452 |
| Iz | 229.0937 | 113.0463 | [38] | 251.0757 | 267.1842 | 246.1238 |
| Oz | 247.1042 | 131.0568 | [39] | 269.0862 | 285.1947 | 264.1343 |
| FapyG | 286.1151 | 170.0677 | [39] | 308.0971 | 324.2056 | 303.1452 |
| Oxa | 249.0723 | 133.0249 | [38] | 271.0543 | 287.1628 | 266.1024 |
| Cyclo-dG | 266.0889 | 150.0415 | [40] | 288.0709 | 304.1794 | 283.1190 |
| Cyanuric acid | 246.0726 | 130.0252 | [38] | 268.0546 | 284.1631 | 263.1027 |
| CAC | 288.0944 | 172.0470 | [41] | 310.0764 | 326.1849 | 305.1245 |
| HICA | 277.0672 | 161.0198 | [41] | 299.0492 | 315.1577 | 294.0973 |
| 8-OH-dA | 268.1046 | 152.0572 | [39] | 290.0866 | 306.1951 | 285.1347 |
| 2-OH-dA | 268.1046 | 152.0572 | [42] | 290.0866 | 306.1951 | 285.1347 |
| FapydA | 270.1202 | 154.0728 | [39] | 292.1022 | 308.2107 | 287.1503 |
| Cyclo-dA | 250.0940 | 134.0466 | [39] | 272.0760 | 288.1845 | 267.1241 |
| 5-OHdC | 244.0933 | 128.0459 | [39] | 266.0753 | 282.1838 | 261.1234 |
| 5-HmdU | 259.0930 | 143.0456 | [39] | 281.0750 | 297.1835 | 276.1231 |
| FodU | 257.0773 | 141.0299 | [39] | 279.0593 | 295.1678 | 274.1074 |
| Tg | 277.1036 | 161.0562 | [39] | 299.0856 | 315.1941 | 294.1337 |
| d(G[8–5]C) | 555.1353 | 439.0879 | [43] | 515.1615 | 531.2700 | 510.2096 |
| d(G[8–3]T) | 508.1792 | 392.1318 | [44] | 530.1612 | 546.2697 | 525.2093 |
| d(G[8–5m]T) | 508.1792 | 392.1318 | [45] | 530.1612 | 546.2697 | 525.2093 |
| εdA | 276.1096 | 160.0622 | [39] | 298.0916 | 314.2001 | 293.1397 |
| εdC | 252.0984 | 136.0510 | [39] | 274.0804 | 290.1889 | 269.1285 |
| ε5mdC | 266.1100 | 150.0626 | [46] | 288.0920 | 304.2005 | 283.1401 |
| εdG | 292.1046 | 176.0572 | [39] | 314.0866 | 330.1951 | 309.1347 |
| M1dG | 304.1046 | 188.0572 | [39] | 326.0866 | 342.1951 | 321.1347 |
| 5,6-dihydro-M1dG | 306.1202 | 190.0728 | [47] | 328.1022 | 344.2107 | 323.1503 |
| PdG | 308.1359 | 192.0885 | [39] | 330.1179 | 346.2264 | 325.1660 |
| 6-oxo-M1dG | 320.0995 | 204.0521 | [48] | 342.0815 | 358.1900 | 337.1296 |
| MDA-dA | 306.1202 | 190.0728 | [49] | 328.1022 | 344.2107 | 323.1503 |
| MDA-dC | 282.1090 | 166.0616 | [49] | 304.0910 | 320.1995 | 299.1391 |
| 8-OH-PdG | 324.1307 | 208.0833 | [50] | 346.1127 | 362.2212 | 341.1608 |
| 6-OH-PdG | 324.1307 | 208.0833 | [50] | 346.1127 | 362.2212 | 341.1608 |
| propano-dA | 308.1359 | 192.0885 | [51] | 330.1179 | 346.2264 | 325.1660 |
| propano-dC | 286.1403 | 170.0929 | [51] * | 308.1223 | 324.2308 | 303.1704 |
| propano-5MedC | 300.1560 | 184.1086 | [51] * | 322.1380 | 338.2465 | 317.1861 |
| FDP-dG | 362.1465 | 246.0991 | [52] * | 384.1285 | 400.2370 | 379.1766 |
| α-Me-γ-OH-PdG (R- or S-α-Me-γ-OH-CRA-dG) | 338.1464 | 222.0990 | [50] | 360.1284 | 376.2369 | 355.1765 |
| Croton-dA | 322.1516 | 206.1042 | [50] * | 344.1336 | 360.2421 | 339.1817 |
| Croton-dC | 300.1560 | 184.1086 | [50] * | 322.1380 | 338.2465 | 317.1861 |
| Croton-5MedC | 314.1717 | 198.1243 | [50] * | 336.1537 | 352.2622 | 331.2018 |
| ICL-RD | 589.2483 | 473.2009 | [53] | 611.2303 | 627.3388 | 606.2784 |
| ICL-R | 587.2326 | 471.1852 | [53] | 609.2146 | 625.3231 | 604.2627 |
| ICL-S | 587.2326 | 471.1852 | [53] | 609.2146 | 625.3231 | 604.2627 |
| Hexanoyl-dG | 366.1777 | 250.1303 | [54] * | 388.1597 | 404.2682 | 383.2078 |
| Hexenal-dG | 366.1777 | 250.1303 | [55] | 388.1597 | 404.2682 | 383.2078 |
| HNE-dG | 424.2196 | 308.1722 | [56] | 446.2016 | 462.3101 | 441.2497 |
| HNE-dA | 408.2248 | 292.1774 | [56] * | 430.2068 | 446.3153 | 425.2549 |
| HNE-dC | 386.2292 | 270.1818 | [56] * | 408.2112 | 424.3197 | 403.2593 |
| HNE-5MedC | 400.2449 | 284.1975 | [56] * | 422.2269 | 438.3354 | 417.2750 |
| HεdG | 404.1933 | 288.1459 | [57] | 426.1753 | 442.2838 | 421.2234 |
| HεdA | 388.1984 | 272.1510 | [57] | 410.1804 | 426.2889 | 405.2285 |
| HεdC | 364.1872 | 248.1398 | [57] | 386.1692 | 402.2777 | 381.2173 |
| HεMedC | 378.2029 | 262.1555 | [57] * | 400.1849 | 416.2934 | 395.2330 |
| BεdG | 362.1464 | 246.0990 | [58] | 384.1284 | 400.2369 | 379.1765 |
| BεdA | 346.1515 | 230.1041 | [58] * | 368.1335 | 384.2420 | 363.1816 |
| BεdC | 322.1402 | 206.0928 | [58] | 344.1222 | 360.2307 | 339.1703 |
| BεMedC | 336.1559 | 220.1085 | [58] | 358.1379 | 374.2464 | 353.1860 |
| CHPdG | 460.2196 | 344.1722 | [59] * | 482.2016 | 498.3101 | 477.2497 |
| CHPdA | 444.2247 | 328.1773 | [59] * | 466.2067 | 482.3152 | 461.2548 |
| CHPdC | 420.2134 | 304.1660 | [59] * | 442.1954 | 458.3039 | 437.2435 |
| CPPdG | 404.1570 | 288.1096 | [59] * | 426.1390 | 442.2475 | 421.1871 |
| CPPdA | 388.1621 | 272.1147 | [59] * | 410.1441 | 426.2526 | 405.1922 |
| CPPdC | 364.1508 | 248.1034 | [59] * | 386.1328 | 402.2413 | 381.1809 |
| CEPdG | 390.1413 | 274.0939 | [59] * | 412.1233 | 428.2318 | 407.1714 |
| CEPdA | 374.1464 | 258.0990 | [59] * | 396.1284 | 412.2369 | 391.1765 |
| CEPdC | 350.1352 | 234.0878 | [59] * | 372.1172 | 388.2257 | 367.1653 |
| N6-HmdA | 282.1202 | 166.0728 | [60] | 304.1022 | 320.2107 | 299.1503 |
| N6-MedA | 266.1253 | 150.0779 | [61] | 288.1073 | 304.2158 | 283.1554 |
| N2-Ethylidene-dG | 294.1202 | 178.0728 | [62] | 316.1022 | 332.2107 | 311.1503 |
| N2-ethyl-dG | 296.1359 | 180.0885 | [62] | 318.1179 | 334.2264 | 313.1660 |
| 1-medA | 268.1409 | 152.0935 | [38] | 290.1229 | 306.2314 | 285.1710 |
| 3-medC | 243.1213 | 127.0739 | [38] | 265.1033 | 281.2118 | 260.1514 |
| N2-CMdG | 326.1100 | 210.0626 | [63] | 348.0920 | 364.2005 | 343.1401 |
| Glyoxal-dA | 310.1152 | 194.0678 | [63] | 332.0972 | 348.2057 | 327.1453 |
| Glyoxal-dC | 288.1196 | 172.0722 | [63] | 310.1016 | 326.2101 | 305.1497 |
| Glyoxal-5MedC | 302.1353 | 186.0879 | [63] * | 324.1173 | 340.2258 | 319.1654 |
| N2-CEdG | 340.1257 | 224.0783 | [64] | 362.1077 | 378.2162 | 357.1558 |
| 8-Cl-dG | 302.0656 | 186.01824 | [65] | 324.0476 | 340.1561 | 319.0957 |
| 8-Cl-dA | 286.0707 | 170.02334 | [65] | 308.0527 | 324.1612 | 303.1008 |
| 5-Cl-dC | 262.0594 | 146.01204 | [65] | 284.0414 | 300.1499 | 279.0895 |
| 8-Br-dG | 346.0151 | 229.96774 | [66] | 367.9971 | 384.1056 | 363.0452 |
| 8-Br-dA | 330.0202 | 213.97284 | [66] * | 352.0022 | 368.1107 | 347.0503 |
| 5-Br-dC | 306.0089 | 189.96154 | [67] | 327.9909 | 344.0994 | 323.039 |
Conflicts of Interest
References
- Cabreraa, L.; Gutierreza, S.; Menendezb, N.; Moralesc, M.P.; Herrasti, P. Magnetite nanoparticles: Electrochemical synthesis and characterization. Electrochim. Acta 2008, 53, 3436–3441. [Google Scholar] [CrossRef]
- Jin, R.; Lin, B.; Li, D.; Ai, H. Superparamagnetic iron oxide nanoparticles for MR imaging and therapy: Design considerations and clinical applications. Curr. Opin. Pharmacol. 2014, 18C, 18–27. [Google Scholar] [CrossRef] [PubMed]
- Felton, C.; Karmakar, A.; Gartia, Y.; Ramidi, P.; Biris, A.S.; Ghosh, A. Magnetic nanoparticles as contrast agents in biomedical imaging: Recent advances in iron- and manganese-based magnetic nanoparticles. Drug Metab. Rev. 2014, 46, 142–154. [Google Scholar] [CrossRef]
- Guichard, Y.; Schmit, J.; Darne, C.; Gaté, L.; Goutet, M.; Rousset, D.; Rastoix, O.; Wrobel, R.; Witschger, O.; Martin, A.; et al. Cytotoxicity and genotoxicity of nanosized and microsized titanium dioxide and iron oxide particles in Syrian hamster embryo cells. Ann. Occup. Hyg. 2012, 56, 631–644. [Google Scholar] [PubMed]
- Aranda, A.; Sequedo, L.; Tolosa, L.; Quintas, G.; Burello, E.; Castell, J.V.; Gombau, L. Dichloro-dihydro-fluorescein diacetate (DCFH-DA) assay. A quantitative method for oxidative stress assessment of nanoparticle-treated cells. Toxicol. Vitro 2013, 27, 954–963. [Google Scholar] [CrossRef]
- Singh, N.; Jenkins, G.J.; Asadi, R.; Doak, S.H. Potential toxicity of superparamagnetic iron oxide nanoparticles (SPION). Nano Rev. 2010, 1, 5358–5373. [Google Scholar] [CrossRef]
- Ramesh, V.; Ravichandran, P.; Copeland, C.L.; Gopikrishnan, R.; Biradar, S.; Goornavar, V.; Ramesh, G.T.; Hall, J.C. Magnetite induces oxidative stress and apoptosis in lung epithelial cells. Mol. Cell Biochem. 2012, 363, 225–234. [Google Scholar] [CrossRef] [PubMed]
- Könczöl, M.; Ebeling, S.; Goldenberg, E.; Treude, F.; Gminski, R.; Gieré, R.; Grobéty, B.; Rothen-Rutishauser, B.; Merfort, I.; Mersch-Sundermann, V. Cytotoxicity and genotoxicity of size-fractionated iron oxide (magnetite) in A549 human lung epithelial cells: Role of ROS, JNK, and NF-κB. Chem. Res. Toxicol. 2011, 24, 1460–1475. [Google Scholar] [CrossRef] [PubMed]
- Karlsson, H.L.; Gustafsson, J.; Cronholm, P.; Möller, L. Size-dependent toxicity of metal oxide particles—A comparison between nano- and micrometer size. Toxicol. Lett. 2009, 188, 112–118. [Google Scholar] [CrossRef] [PubMed]
- Ma, P.; Luo, Q.; Chen, J.; Gan, Y.; Du, J.; Ding, S.; Xi, Z.; Yang, X. Intraperitoneal injection of magnetic Fe3O4-nanoparticle induces hepatic and renal tissue injury via oxidative stress in mice. Int. J. Nanomed. 2012, 7, 4809–4818. [Google Scholar]
- Weissleder, R.; Stark, D.D.; Engelstad, B.L.; Bacon, B.R.; Compton, C.C.; White, D.L.; Jacobs, P.; Lewis, J. Superparamagnetic iron oxide: Pharmacokinetics and toxicity. Am. J. Roentgenol. 1989, 152, 167–173. [Google Scholar] [CrossRef]
- Singh, N.; Jenkins, G.J.; Nelson, B.C.; Marquis, B.J.; Maffeis, T.G.; Brown, A.P.; Williams, P.M.; Wright, C.J.; Doak, S.H. The role of iron redox state in the genotoxicity of ultrafine superparamagnetic iron oxide nanoparticles. Biomaterials 2012, 33, 163–170. [Google Scholar] [CrossRef] [PubMed]
- Szalay, B.; Tátrai, E.; Nyírő, G.; Vezér, T.; Dura, G. Potential toxic effects of iron oxide nanoparticles in in vivo and in vitro experiments. J. Appl. Toxicol. 2012, 32, 446–453. [Google Scholar] [CrossRef] [PubMed]
- Watanabe, M.; Yoneda, M.; Morohashi, A.; Okamoto, D.; Sato, A.; Kurioka, D.; Hirokawa, H.; Shiraishi, T.; Kawai, K.; Kasai, K.; et al. Effects of Fe3O4-based magnetic nanoparticles on A549 cells. Int. J. Mol. Sci. 2013, 14, 15546–15560. [Google Scholar] [CrossRef] [PubMed]
- Kawanishi, M.; Ogo, S.; Ikemoto, M.; Totsuka, Y.; Ishino, K.; Wakabayahsi, K.; Yagi, T. Genotoxicity and reactive oxygen species production induced by magnetite nanoparticles in mammalian cells. J. Toxicol. Sci. 2013, 38, 503–511. [Google Scholar] [CrossRef] [PubMed]
- Totsuka, Y.; Ishino, K.; Kato, T.; Goto, S.; Tada, Y.; Nakae, D.; Watanabe, M.; Wakabayashi, K. Magnetite nanoparticles induce genotoxicity in the lungs of mice via inflammatory response. Nanomaterials 2014, 4, 175–188. [Google Scholar] [CrossRef]
- Kew, M.C. Aflatoxins as a cause of hepatocellular carcinoma. J. Gastrointest. Liver Dis. 2013, 22, 305–310. [Google Scholar]
- Hollstein, M.; Moriya, M.; Grollman, A.P.; Olivier, M. Analysis of TP53 mutation spectra reveals the fingerprint of the potent environmental carcinogen, aristolochic acid. Mutat. Res. 2013, 753, 41–49. [Google Scholar] [CrossRef] [PubMed]
- Hecht, S.S. Lung carcinogenesis by tobacco smoke. Int. J. Cancer 2012, 131, 2724–2732. [Google Scholar] [CrossRef] [PubMed]
- Khalili, H.; Zhang, F.J.; Harvey, R.G.; Dipple, A. Mutagenicity of benzo[a]pyrene-deoxyadenosine adducts in a sequence context derived from the p53 gene. Mutat. Res. 2000, 465, 39–44. [Google Scholar] [CrossRef] [PubMed]
- Scholdberg, T.A.; Nechev, L.V.; Merritt, W.K.; Harris, T.M.; Harris, C.M.; Lloyd, R.S.; Stone, M.P. Mispairing of a site specific major groove (2S,3S)-N6-(2,3,4-trihydroxybutyl)-2'-deoxyadenosyl DNA Adduct of butadiene diol epoxide with deoxyguanosine: Formation of a dA(anti)·dG(anti) pairing interaction. Chem. Res. Toxicol. 2005, 18, 145–153. [Google Scholar] [CrossRef] [PubMed]
- Pollack, M.; Yang, I.Y.; Kim, H.Y.; Blair, I.A.; Moriya, M. Translesion DNA Synthesis across the heptanone-etheno-2'-deoxycytidine adduct in cells. Chem. Res. Toxicol. 2006, 19, 1074–1079. [Google Scholar] [CrossRef] [PubMed]
- Yang, I.Y.; Hashimoto, K.; de Wind, N.; Blair, I.A.; Moriya, M. Two distinct translesion synthesis pathways across a lipid peroxidation-derived DNA adduct in mammalian cells. J. Biol. Chem. 2009, 284, 191–198. [Google Scholar] [CrossRef] [PubMed]
- Kanaly, R.A.; Hanaoka, T.; Sugimura, H.; Toda, H.; Matsui, S.; Matsuda, T. Development of the adductome approach to detect DNA damage in humans. Antioxid. Redox Signal. 2006, 8, 993–1001. [Google Scholar] [CrossRef] [PubMed]
- Matsuda, T.; Tao, H.; Goto, M.; Yamada, H.; Suzuki, M.; Wu, Y.; Xiao, N.; He, Q.; Guo, W.; Cai, Z.; et al. Lipid peroxidation-induced DNA adducts in human gastric mucosa. Carcinogenesis 2013, 34, 121–127. [Google Scholar] [CrossRef] [PubMed]
- Park, E.J.; Kim, H.; Kim, Y.; Yi, J.; Choi, K.; Park, K. Inflammatory responses may be induced by a single intratracheal instillation of iron nanoparticles in mice. Toxicology 2010, 275, 65–71. [Google Scholar] [CrossRef] [PubMed]
- Hsiao, J.K.; Weng, T.I.; Tai, M.F.; Chen, Y.F.; Wang, Y.H.; Yang, C.Y.; Wang, J.L.; Liu, H.M. Cellular behavior change of macrophage after exposure to nanoparticles. J. Nanosci. Nanotechnol. 2009, 9, 1388–1393. [Google Scholar] [CrossRef] [PubMed]
- Xia, T.; Kovochich, M.; Liong, M.; Zink, J.I.; Nel, A.E. Cationic polystyrene nanosphere toxicity depends on cell-specific endocytic and mitochondrial injury pathways. ACS Nano 2008, 2, 85–96. [Google Scholar] [CrossRef] [PubMed]
- He, X.; Young, S.H.; Schwegler-Berry, D.; Chisholm, W.P.; Fernback, J.E.; Ma, Q. Multiwalled carbon nanotubes induce a fibrogenic response by stimulating reactive oxygen species production, activating NF-κB signaling, and promoting fibroblast-to-myofibroblast transformation. Chem. Res. Toxicol. 2011, 24, 2237–2248. [Google Scholar] [CrossRef] [PubMed]
- Kasper, J.L.; Hermanns, M.I.; Bantz, C.; Maskos, M.; Stauber, R.; Pohl, C.; Unger, R.E.; Kirkpatrick, J.C. Inflammatory and cytotoxic responses of an alveolar-capillary coculture model to silica nanoparticles: Comparison with conventional monocultures. Part. Fibre Toxicol. 2011, 8, 6. [Google Scholar] [CrossRef] [PubMed]
- Dostert, C.; Pétrilli, V.; van Bruggen, R.; Steele, C.; Mossman, B.T.; Tschopp, J. Innate immune activation through Nalp3 inflammasome sensing of asbestos and silica. Science 2008, 320, 674–677. [Google Scholar] [CrossRef] [PubMed]
- Cassel, S.L.; Eisenbarth, S.C.; Iyer, S.S.; Sadler, J.J.; Colegio, O.R.; Tephly, L.A.; Carter, A.B.; Rothman, P.B.; Flavell, R.A.; Sutterwala, F.S. The Nalp3 inflammasome is essential for the development of silicosis. Proc. Natl. Acad. Sci. USA 2008, 105, 9035–9040. [Google Scholar] [CrossRef] [PubMed]
- Matsuda, T.; Yabushita, H.; Kanaly, R.A.; Shibutani, S.; Yokoyama, A. Increased DNA damage in ALDH2-deficient alcoholics. Chem. Res. Toxicol. 2006, 19, 1374–1378. [Google Scholar] [CrossRef] [PubMed]
- Roberts, D.W.; Churchwell, M.I.; Beland, F.A.; Fang, J.L.; Doerge, D.R. Quantitative analysis of etheno-2'-deoxycytidine DNA adducts using on-line immunoaffinity chromatography coupled with LC/ES-MS/MS detection. Anal. Chem. 2001, 73, 303–309. [Google Scholar] [CrossRef] [PubMed]
- Raboisson, P; Baurand, A; Cazenave, J.P.; Gachet, C.; Retat, M.; Spiess, B.; Bourguignon, J.J. Novel antagonist sactingat the P2Y(1) purinergicreceptor: Synthesis and conformation alanalysis using potentiometric and nuclear magnetic resonance titration techniques. J. Med. Chem. 2002, 45, 962–972. [Google Scholar] [CrossRef] [PubMed]
- Taghizadeh, K.; McFaline, J.L.; Pang, B.; Sullivan, M.; Dong, M.; Plummer, E.; Dedon, P.C. Quantification of DNA damage products resulting from deamination, oxidation and reaction with products of lipid peroxidation by liquid chromatography isotope dilution tandem mass spectrometry. Nat. Protoc. 2008, 3, 1287–1298. [Google Scholar] [CrossRef] [PubMed]
- Kasai, H.; Nishimura, S. Hydroxylation of deoxyguanosine at the C-8 position by ascorbic acid and other reducing agents. Nucleic Acids Res. 1984, 12, 2137–2145. [Google Scholar] [CrossRef] [PubMed]
- Delaney, J.C.; Essigmann, J.M. Biological properties of single chemical-DNA adducts: A twenty year perspective. Chem. Res. Toxicol. 2008, 21, 232–252. [Google Scholar] [CrossRef] [PubMed]
- Cadet, J.; Loft, S.; Olinski, R.; Evans, M.D.; Bialkowski, K.; Richard Wagner, J.; Dedon, P.C.; Møller, P.; Greenberg, M.M.; Cooke, M.S. Biologically relevant oxidants and terminology, classification and nomenclature of oxidatively generated damage to nucleobases and 2-deoxyribose in nucleic acids. Free Radic. Res. 2012, 46, 367–381. [Google Scholar] [CrossRef] [PubMed]
- Berquist, B.R.; Wilson, D.M., 3rd. Pathways for repairing and tolerating the spectrum of oxidative DNA lesions. Cancer Lett. 2012, 327, 61–72. [Google Scholar] [CrossRef] [PubMed]
- 41Niles, J.C.; Wishnok, J.S.; Tannenbaum, S.R. Peroxynitrite-induced oxidation and nitration products of guanine and 8-oxoguanine: Structures and mechanisms of product formation. Nitric Oxide 2006, 14, 109–121. [Google Scholar] [CrossRef] [PubMed]
- Kamiya, H. Mutagenic potentials of damaged nucleic acids produced by reactive oxygen/nitrogen species: Approaches using synthetic oligonucleotides and nucleotides: Survey and summary. Nucleic Acids Res. 2003, 31, 517–531. [Google Scholar] [CrossRef] [PubMed]
- Box, H.C.; Budzinski, E.E.; Dawidzik, J.B.; Wallace, J.C.; Iijima, H. Tandem lesions and other products in X-irradiated DNA oligomers. Radiat. Res. 1998, 149, 433–439. [Google Scholar] [CrossRef] [PubMed]
- Crean, C.; Uvaydov, Y.; Geacintov, N.E.; Shafirovich, V. Oxidation of single-stranded oligonucleotides by carbonate radical anions: Generating intrastrand cross-links between guanine and thymine bases separated by cytosines. Nucleic Acids Res. 2008, 36, 742–755. [Google Scholar] [CrossRef] [PubMed]
- Hong, H.; Cao, H.; Wang, Y.; Wang, Y. Identification and quantification of a guanine-thymine intrastrand cross-link lesion induced by Cu(II)/H2O2/ascorbate. Chem. Res. Toxicol. 2006, 19, 614–621. [Google Scholar] [CrossRef] [PubMed]
- Nair, J.; Godschalk, R.W.; Nair, U.; Owen, R.W.; Hull, W.E.; Bartsch, H. Identification of 3,N(4)-etheno-5-methyl-2'-deoxycytidine in human DNA: A new modified nucleoside which may perturb genome methylation. Chem. Res. Toxicol. 2012, 25, 162–169. [Google Scholar] [CrossRef] [PubMed]
- Knutson, C.G.; Rubinson, E.H.; Akingbade, D.; Anderson, C.S.; Stec, D.F.; Petrova, K.V.; Kozekov, I.D.; Guengerich, F.P.; Rizzo, C.J.; Marnett, L.J. Oxidation and glycolytic cleavage of etheno and propano DNA base adducts. Biochemistry 2009, 48, 800–809. [Google Scholar] [CrossRef] [PubMed]
- Otteneder, M.B.; Knutson, C.G.; Daniels, J.S.; Hashim, M.; Crews, B.C.; Remmel, R.P.; Wang, H.; Rizzo, C.; Marnett, L.J. In vivo oxidative metabolism of a major peroxidation-derived DNA adduct, M1dG. Proc. Natl. Acad. Sci. USA 2006, 103, 6665–6669. [Google Scholar] [CrossRef] [PubMed]
- Wang, H.; Marnett, L.J.; Harris, T.M.; Rizzo, C.J. A novel synthesis of malondialdehyde adducts of deoxyguanosine, deoxyadenosine, and deoxycytidine. Chem. Res. Toxicol. 2004, 17, 144–149. [Google Scholar] [CrossRef] [PubMed]
- Minko, I.G.; Kozekov, I.D.; Harris, T.M.; Rizzo, C.J.; Lloyd, R.S.; Stone, M.P. Chemistry and biology of DNA containing 1,N(2)-deoxyguanosine adducts of the alpha,beta-unsaturated aldehydes acrolein, crotonaldehyde, and 4-hydroxynonenal. Chem. Res. Toxicol. 2009, 22, 759–778. [Google Scholar] [CrossRef] [PubMed]
- Kawai, Y.; Furuhata, A.; Toyokuni, S.; Aratani, Y.; Uchida, K. Formation of acrolein-derived 2'-deoxyadenosine adduct in an iron-induced carcinogenesis model. J. Biol. Chem. 2003, 278, 50346–50354. [Google Scholar] [CrossRef] [PubMed]
- Uchida, K.; Kanematsu, M.; Sakai, K.; Matsuda, T.; Hattori, N.; Mizuno, Y.; Suzuki, D.; Miyata, T.; Noguchi, N.; Niki, E.; et al. Protein-bound acrolein: Potential markers for oxidative stress. Proc. Natl. Acad. Sci. USA 1998, 95, 4882–4887. [Google Scholar] [CrossRef] [PubMed]
- Liu, X.; Lao, Y.; Yang, I.Y.; Hecht, S.S.; Moriya, M. Replication-coupled repair of crotonaldehyde/acetaldehyde-induced guanine-guanine interstrand cross-links and their mutagenicity. Biochemistry 2006, 45, 12898–12905. [Google Scholar] [CrossRef] [PubMed]
- Ishino, K.; Shibata, T.; Ishii, T.; Liu, Y.T.; Toyokuni, S.; Zhu, X.; Sayre, L.M.; Uchida, K. Protein N-acylation: H2O2-mediated covalent modification of protein by lipid peroxidation-derived saturated aldehydes. Chem. Res. Toxicol. 2008, 21, 1261–1270. [Google Scholar] [CrossRef] [PubMed]
- Eder, E.; Hoffman, C. Identification and characterization of deoxyguanosine adducts of mutagenic beta-alkyl-substituted acrolein congeners. Chem. Res. Toxicol. 1993, 6, 486–494. [Google Scholar] [CrossRef] [PubMed]
- Nair, U.; Bartsch, H.; Nair, J. Lipid peroxidation-induced DNA damage in cancer-prone inflammatory diseases: A review of published adduct types and levels in humans. Free Radic. Biol. Med. 2007, 43, 1109–1120. [Google Scholar] [CrossRef] [PubMed]
- Blair, I.A. DNA adducts with lipid peroxidation products. J. Biol. Chem. 2008, 283, 15545–15549. [Google Scholar] [CrossRef] [PubMed]
- Kasai, H.; Kawai, K. 4-oxo-2-hexenal, a mutagen formed by omega-3 fat peroxidation: Occurrence, detection and adduct formation. Mutat. Res. 2008, 659, 56–59. [Google Scholar] [CrossRef] [PubMed]
- Salomon, R.G.; Hong, L.; Hollyfield, J.G. Discovery of carboxyethylpyrroles (CEPs): Critical insights into AMD, autism, cancer, and wound healing from basic research on the chemistry of oxidized phospholipids. Chem. Res. Toxicol. 2011, 24, 1803–1816. [Google Scholar] [CrossRef] [PubMed]
- Zhong, W.; Hee, S.Q. Quantitation of normal and formaldehyde-modified deoxynucleosides by high-performance liquid chromatography/UV detection. Biomed. Chromatogr. 2004, 18, 462–469. [Google Scholar] [CrossRef] [PubMed]
- Wang, M.; Cheng, G.; Balbo, S.; Carmella, S.G.; Villalta, P.W.; Hecht, S.S. Clear differences in levels of a formaldehyde-DNA adduct in leukocytes of smokers and nonsmokers. Cancer Res. 2009, 69, 7170–7174. [Google Scholar] [CrossRef] [PubMed]
- Matsuda, T.; Matsumoto, A.; Uchida, M.; Kanaly, R.A.; Misaki, K.; Shibutani, S.; Kawamoto, T.; Kitagawa, K.; Nakayama, K.I.; Tomokuni, K.; et al. Increased formation of hepatic N2-ethylidene-2'-deoxyguanosine DNA adducts in aldehyde dehydrogenase 2-knockout mice treated with ethanol. Carcinogenesis 2007, 28, 2363–2366. [Google Scholar] [CrossRef] [PubMed]
- Olsen, R.; Molander, P.; Øvrebø, S.; Ellingsen, D.G.; Thorud, S.; Thomassen, Y.; Lundanes, E.; Greibrokk, T.; Backman, J.; Sjöholm, R.; et al. Reaction of glyoxal with 2'-deoxyguanosine, 2'-deoxyadenosine, 2'-deoxycytidine, cytidine, thymidine, and calf thymus DNA: Identification of DNA adducts. Chem. Res. Toxicol. 2005, 18, 730–739. [Google Scholar] [CrossRef] [PubMed]
- Frischmann, M.; Bidmon, C.; Angerer, J.; Pischetsrieder, M. Identification of DNA adducts of methylglyoxal. Chem. Res. Toxicol. 2005, 18, 1586–1592. [Google Scholar] [CrossRef] [PubMed]
- Masuda, M.; Suzuki, T.; Friesen, M.D.; Ravanat, J.L.; Cadet, J.; Pignatelli, B.; Nishino, H.; Ohshima, H. Chlorination of guanosine and other nucleosides by hypochlorous acid and myeloperoxidase of activated human neutrophils. Catalysis by nicotine and trimethylamine. J. Biol. Chem. 2001, 276, 40486–40496. [Google Scholar] [CrossRef] [PubMed]
- Asahi, T.; Kondo, H.; Masuda, M.; Nishino, H.; Aratani, Y.; Naito, Y.; Yoshikawa, T.; Hisaka, S.; Kato, Y.; Osawa, T. Chemical and immunochemical detection of 8-halogenated deoxyguanosines at early stage inflammation. J. Biol. Chem. 2010, 285, 9282–9291. [Google Scholar] [CrossRef] [PubMed]
- Byun, J.; Henderson, J.P.; Heinecke, J.W. Identification and quantification of mutagenic halogenated cytosines by gas chromatography, fast atom bombardment, and electrospray ionization tandem mass spectrometry. Anal. Biochem. 2003, 317, 201–209. [Google Scholar] [CrossRef] [PubMed]
© 2015 by the authors; licensee MDPI, Basel, Switzerland. This article is an open access article distributed under the terms and conditions of the Creative Commons Attribution license (http://creativecommons.org/licenses/by/4.0/).
Share and Cite
Ishino, K.; Kato, T.; Kato, M.; Shibata, T.; Watanabe, M.; Wakabayashi, K.; Nakagama, H.; Totsuka, Y. Comprehensive DNA Adduct Analysis Reveals Pulmonary Inflammatory Response Contributes to Genotoxic Action of Magnetite Nanoparticles. Int. J. Mol. Sci. 2015, 16, 3474-3492. https://doi.org/10.3390/ijms16023474
Ishino K, Kato T, Kato M, Shibata T, Watanabe M, Wakabayashi K, Nakagama H, Totsuka Y. Comprehensive DNA Adduct Analysis Reveals Pulmonary Inflammatory Response Contributes to Genotoxic Action of Magnetite Nanoparticles. International Journal of Molecular Sciences. 2015; 16(2):3474-3492. https://doi.org/10.3390/ijms16023474
Chicago/Turabian StyleIshino, Kousuke, Tatsuya Kato, Mamoru Kato, Tatsuhiro Shibata, Masatoshi Watanabe, Keiji Wakabayashi, Hitoshi Nakagama, and Yukari Totsuka. 2015. "Comprehensive DNA Adduct Analysis Reveals Pulmonary Inflammatory Response Contributes to Genotoxic Action of Magnetite Nanoparticles" International Journal of Molecular Sciences 16, no. 2: 3474-3492. https://doi.org/10.3390/ijms16023474