Article

Elevated Levels of Endocannabinoids in Chronic Hepatitis C May Modulate Cellular Immune Response and Hepatic Stellate Cell Activation

1
Department of Clinical Research, University of Bern, Bern 3010, Switzerland
2
Institute of Biochemistry and Molecular Medicine, University of Bern, Bern 3012, Switzerland
3
Department of Clinical Research, Laboratory of Phytopharmacology, Bioanalytics and Pharmacokinetics, University of Bern, Bern 3010, Switzerland
4
Department of Visceral Surgery and Medicine, Inselspital, University of Bern, Bern 3010, Switzerland
5
Department of Nephrology, Inselspital, University of Bern, Bern 3010, Switzerland
6
Department of Medicine II, Division of Gastroenterology, University of Dresden, Dresden 01307, Germany
7
Department of Visceral Surgery, University of Schleswig-Holstein, Campus Kiel, Kiel 24105, Germany
*
Author to whom correspondence should be addressed.
These authors contributed equally to this work.
Int. J. Mol. Sci. 2015, 16(4), 7057-7076; https://doi.org/10.3390/ijms16047057
Submission received: 20 January 2015 / Revised: 6 March 2015 / Accepted: 23 March 2015 / Published: 27 March 2015
(This article belongs to the Special Issue Viral Hepatitis Research)

Abstract

:
The endocannabinoid (EC) system is implicated in many chronic liver diseases, including hepatitis C viral (HCV) infection. Cannabis consumption is associated with fibrosis progression in patients with chronic hepatitis C (CHC), however, the role of ECs in the development of CHC has never been explored. To study this question, anandamide (AEA) and 2-arachidonoyl glycerol (2-AG) were quantified in samples of HCV patients and healthy controls by gas and liquid chromatography mass spectrometry. Fatty acid amide hydrolase (FAAH) and monoaclyglycerol lipase (MAGL) activity was assessed by [3H]AEA and [3H]2-AG hydrolysis, respectively. Gene expression and cytokine release were assayed by TaqMan PCR and ELISpot, respectively. AEA and 2-AG levels were increased in plasma of HCV patients, but not in liver tissues. Hepatic FAAH and MAGL activity was not changed. In peripheral blood mononuclear cells (PBMC), ECs inhibited IFN-γ, TNF-α, and IL-2 secretion. Inhibition of IL-2 by endogenous AEA was stronger in PBMC from HCV patients. In hepatocytes, 2-AG induced the expression of IL-6, -17A, -32 and COX-2, and enhanced activation of hepatic stellate cells (HSC) co-cultivated with PBMC from subjects with CHC. In conclusion, ECs are increased in plasma of patients with CHC and might reveal immunosuppressive and profibrogenic effects.

1. Introduction

The endocannabinoid system comprises endocannabinoids (ECs), with arachidonoyl ethanolamide (anandamide, AEA) and 2-arachidonoyl glycerol (2-AG) as prominent examples, cannabinoid receptors CB1 and CB2, and EC degradation enzymes fatty acid amide hydrolase (FAAH) and monoacylglycerol lipase (MAGL). AEA and 2-AG are derivatives of arachidonic acid (AA) conjugated with either ethanolamine or glycerol, respectively, and are synthesized on demand from phospholipid precursors residing in the cell membrane in response to a rise of intracellular calcium levels. Inside the cells, AEA is hydrolyzed by FAAH into AA and ethanolamine while 2-AG is hydrolyzed by MAGL into AA and glycerol [1]. The EC system is involved in many physiological and pathophysiological processes, mainly of the CNS, but it also exerts numerous regulatory effects on inflammation, metabolism and vascular tone. Regarding liver diseases, CB1 and CB2 seem to play opposite roles, with CB2 exerting protective effects against the evolution of steatosis, inflammation, and fibrosis [2,3,4], and CB1 promoting these events instead [5]. EC formation is faint in patients without liver disease, whereas in cirrhosis, fatty liver, acute hepatitis or bile duct obstruction, hepatic and plasma levels of AEA and 2-AG are reported to be increased, with AEA being mainly produced by Kupffer cells and lymphocytes and 2-AG derived from hepatic stellate cells (HSC) and hepatocytes [6,7,8,9,10,11]. Multiple effects of ECs were described, including potent anti-inflammatory activity, apoptosis induction, inhibition of cell proliferation, suppression of cytokine production, and induction of T-regulatory cells (Tregs) [1,12,13,14,15,16]. Accordingly, significant suppression of IL-2 production by 2-AG was observed in leukocytes via activation of PPAR-γ [17], whereas the stimulation of CB2 in Kupffer cells prevented the switch to a pro-inflammatory M1 phenotype and enhanced transition towards the anti-inflammatory M2 phenotype [18].
Hepatitis C virus (HCV) infection is among the most frequent causes of chronic liver injury leading to cirrhosis. Recent experimental and clinical data in humans demonstrate an association of ECs and cannabinoid receptors with liver disease progression, including chronic hepatitis C (CHC) and non-alcoholic fatty liver disease (NAFLD) [19,20]. Patients with CHC and daily cannabis consumption showed more severe fibrosis than non- or occasional consumers [21,22,23]. In vitro, HCV-transfected hepatocytes showed a strong upregulation of CB1 [24]. However, the particular role and effects of ECs in viral-induced liver damage is still incompletely defined. Therefore, we aim to explore the levels of ECs in healthy and diseased cohort of HCV patients and to evaluate whether and how possible alterations could affect immune and fibrogenic responses.

2. Results

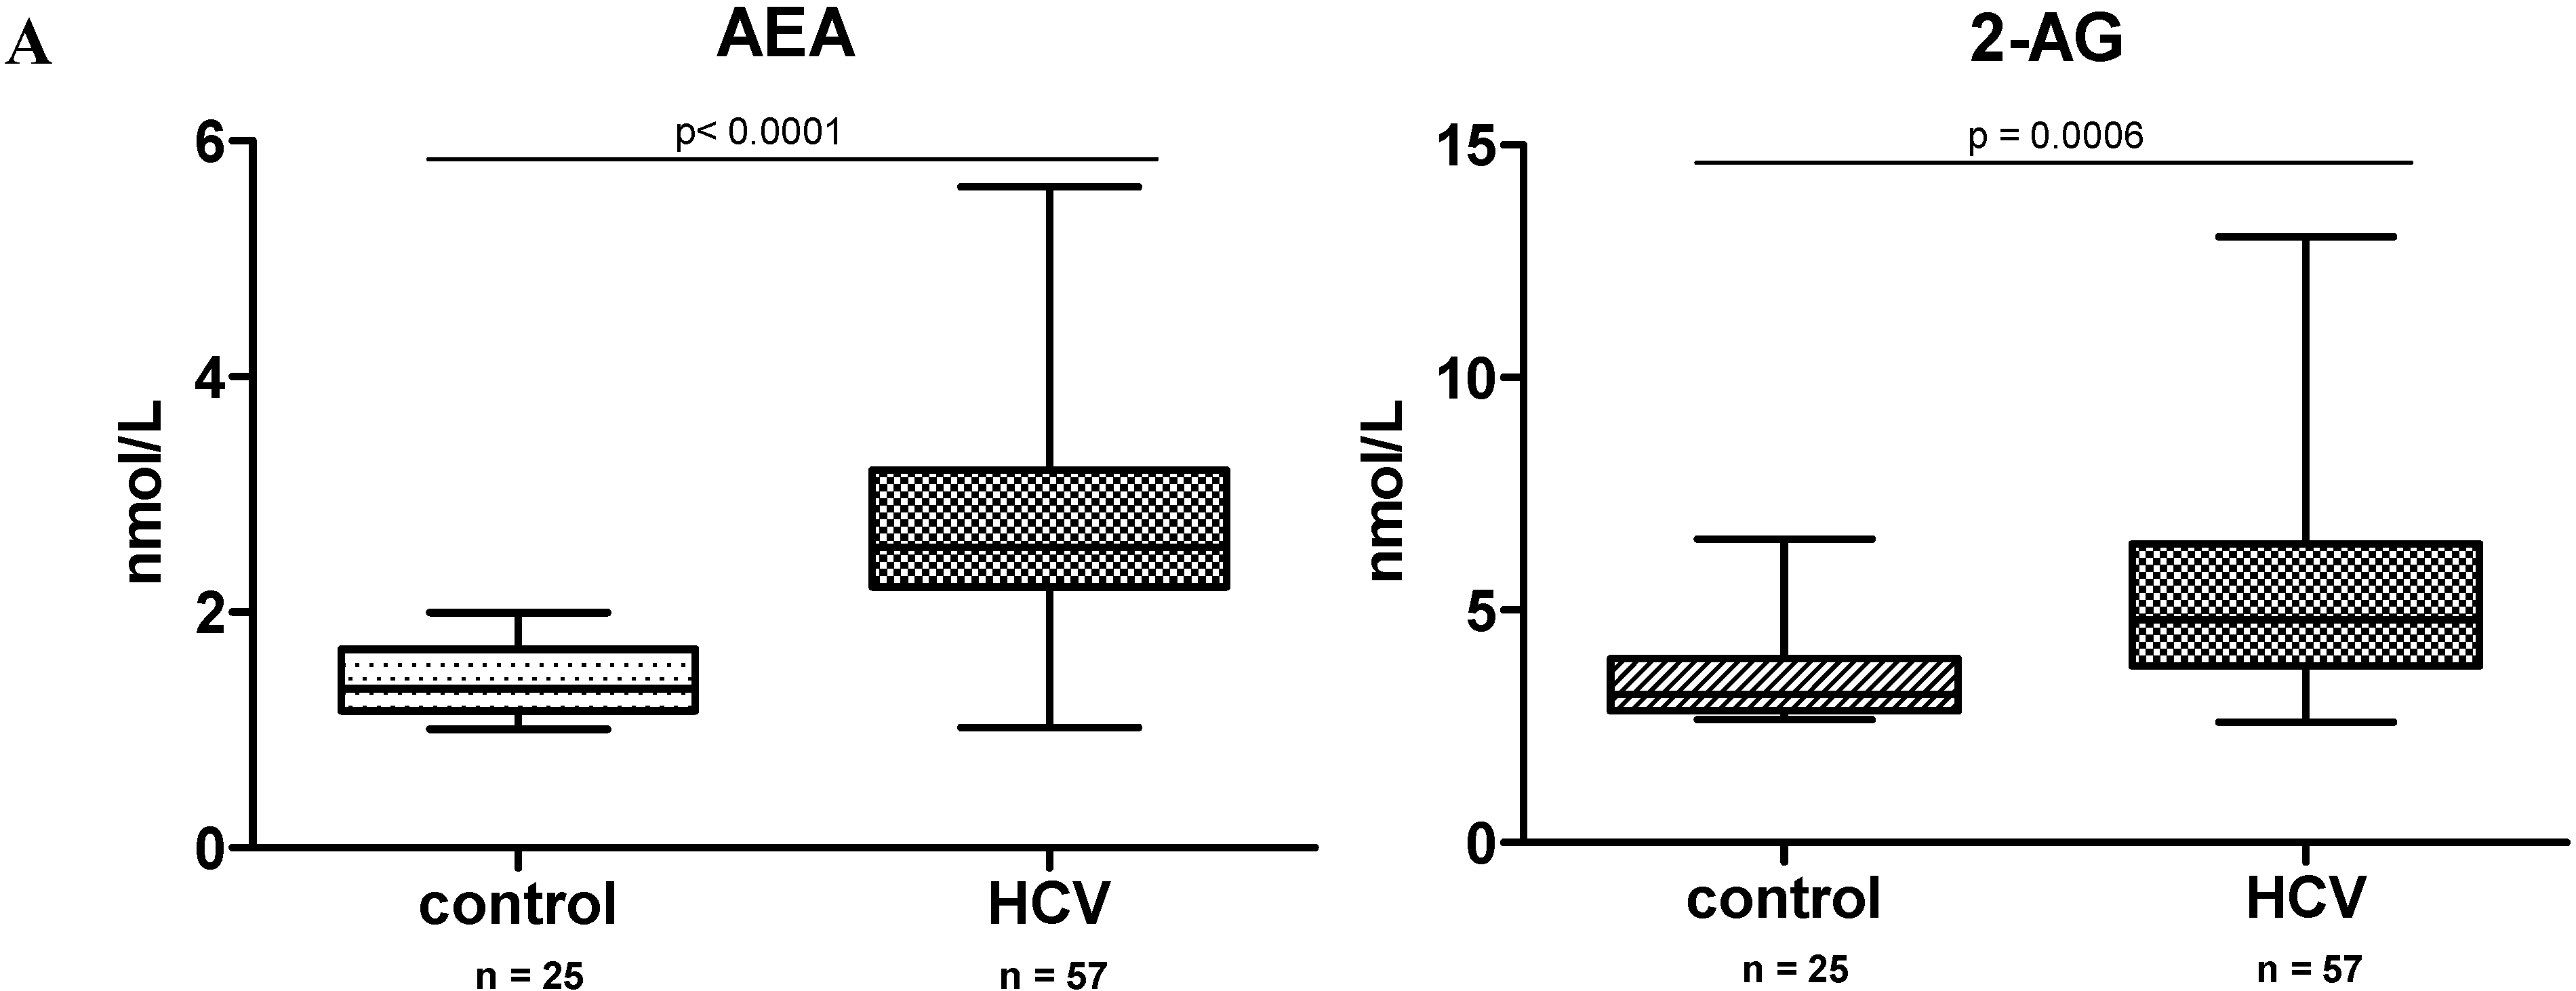
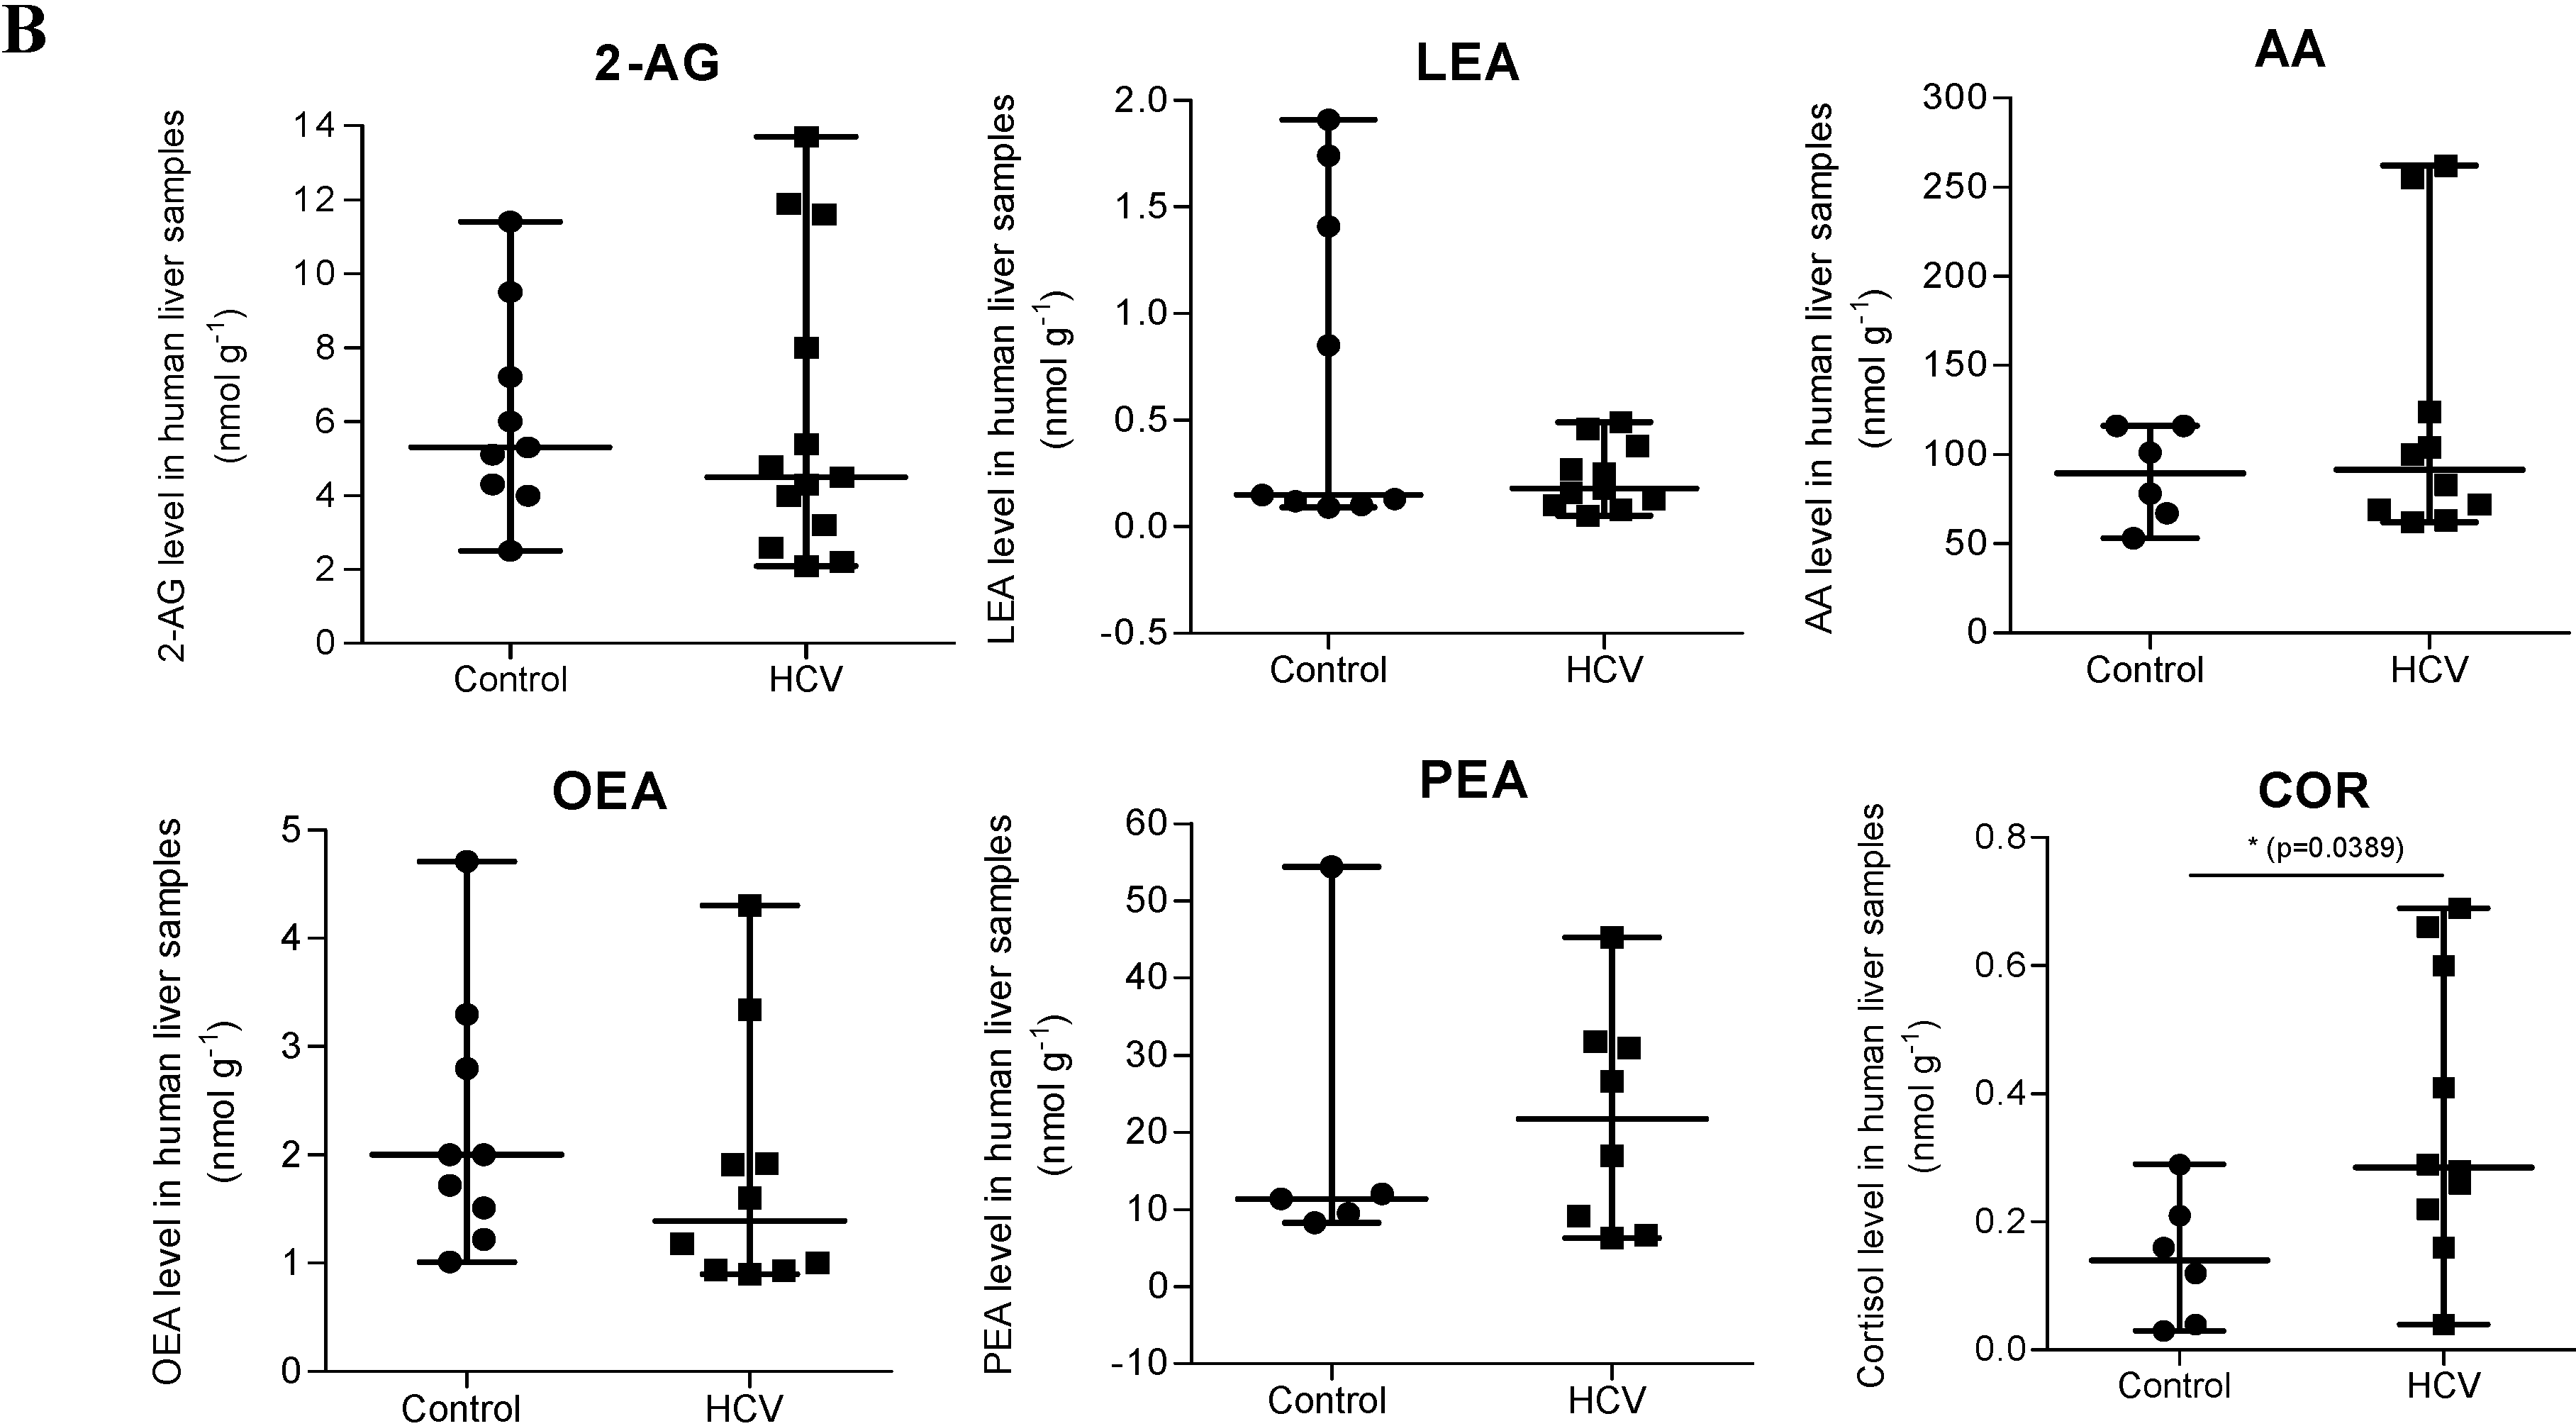
2.1. Endocannabinoid (EC) Levels Are Increased in Plasma of Patients with Chronic Hepatitis C (CHC)

The levels of ECs AEA and 2-AG were approximately twofold higher in plasma of patients with HCV compared to healthy controls (p < 0.005) (Figure 1A), whereas in the liver 2-AG was not changed significantly (Figure 1B) and AEA was below detection limits (not shown). A panel of other related primary fatty acid amides was measured in parallel (linoleoylethanolamide (LEA), palmitoylethanolamide (PEA), oleoylethanolamide (OEA), arachidonic acid (AA)) and, again, no significant differences between HCV and controls groups were observed, except of a stress response marker cortisol, which was induced twofold in the HCV group (Figure 1B).
Figure 1. Endocannabinoid (ECs) and related fatty acid amides expression in hepatitis C. (A) Levels of ECs in plasma from patients with chronic hepatitis C (CHC) (n = 57) and healthy controls (n = 25); (B) levels of ECs, fatty acids amides and cortisol in control (n = 9) and hepatitis C virus (HCV)-infected (n = 17) liver tissues. * p = 0.0389 vs. control.
Ijms 16 07057 g001aIjms 16 07057 g001b
Interestingly, there was no significant correlation found between plasma EC levels and liver inflammation or fibrosis stages in HCV patients (Table 1).
Table 1. Predictors of high endocannabinoids among hepatitis C virus (HCV) patients.
Anandamide
ParameterUnadjusted Coefficients95% CIp-ValueAdjusted Coefficients95% CIp-Value
Age−0.00066−0.009–0.0070.87−0.00360.013–0.00570.45
Female0.075−0.08–0.230.350.14−0.04–0.330.13
BMI0.011−0.009–0.0320.270.018−0.0045–0.0410.12
Diabetes0.16 −0.12–0.430.260.14−0.16–0.450.35
Alcohol0.046−0.18–0.270.690.056−0.21–0.320.68
ALT0.0006−0.0003–0.0020.200.001−0.0005–0.00260.18
AST0.00064−0.0007–0.0020.35−0.0003−0.0025–0.00190.81
Fibrosis grade (0–2 vs. 3/4)−0.30−0.20–0.240.73−0.09−0.28–0.100.36
Fibrosis grade cont.−0.0034−0.063–0.0560.91
Genotype (1 vs. 2–4)0.087−0.071–0.250.28
Activity grade (1 vs. 2, 1 vs. 3)0.082 −0.27−0.16–0.33 −0.98–0.430.51 0.45
Steatosis−0.092−0.33–0.140.44
2-AG0.012−0.069–0.0920.78
2-AG
ParameterUnadjusted Coefficients95% CIp-ValueAdjusted Coefficients95% CIp-Value
Age0.0330.009–0.0580.0070.0430.014–0.0720.004
Female−0.069−0.59–0.450.80−0.14−0.72–0.440.64
BMI0.018−0.049–0.0850.590.029−0.042–0.100.42
Diabetes −0.15−1.05–0.750.75−0.54−1.49–0.410.27
Alcohol −0.33−1.06–0.400.38−0.07−0.91–0.770.87
ALT0.003−0.002–0.0070.23−0.00008−0.005–0.0050.97
AST0.002−0.0009–0.0050.170.0027−0.004–0.010.44
Fibrosis grade (0–2 vs. 3/4)−0.03−0.58–0.510.90−0.25−0.85–0.350.41
Fibrosis grade cont.0.009−0.18–0.200.93
Genotype (1 vs. 2–4)0.087−0.071–0.250.28
Activity grade (1 vs. 2, 1 vs. 3)0.15 −0.43−0.56–0.86
−2.50–1.63
0.69 0.68
Steatosis−0.52−1.21–0.180.14
Adjustment performed for: age, gender, BMI, diabetes, alcohol, alanine aminotransferase (ALT), aspartate aminotransferase (AST), and fibrosis grade.

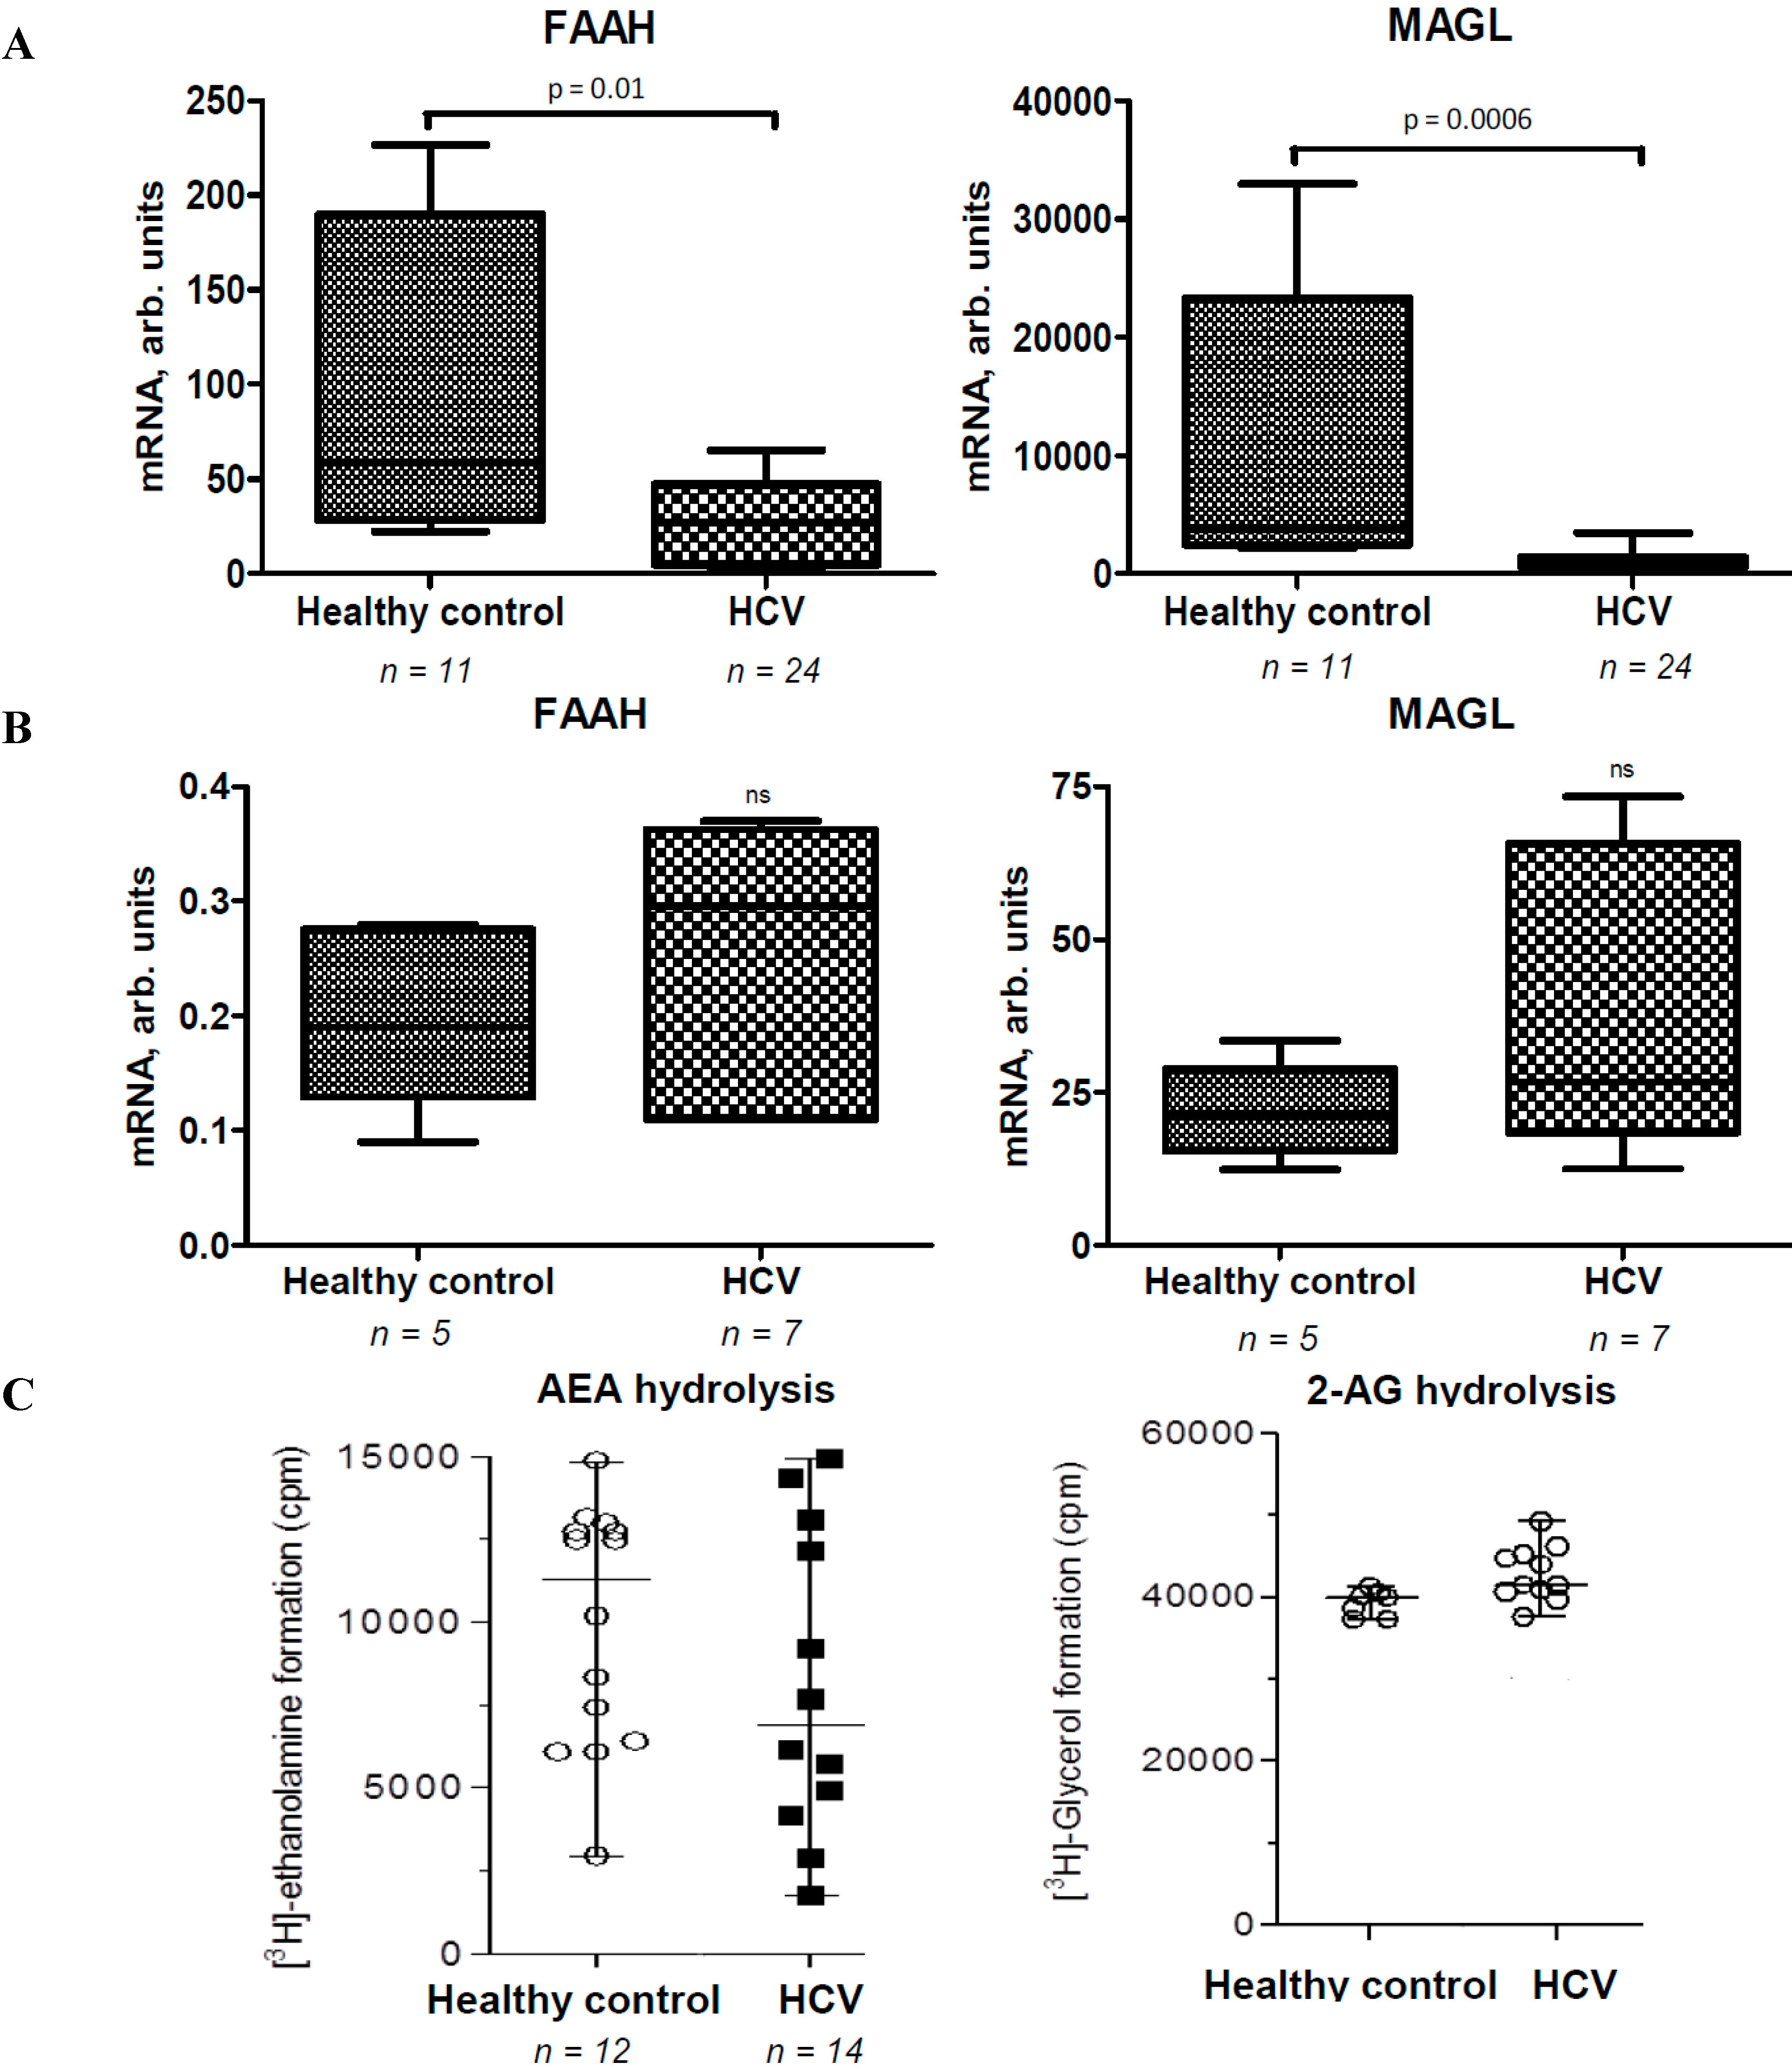
2.2. Activities of EC Degradation Enzymes Are not Affected in CHC Patients

The expression of corresponding EC degradation enzymes was measured in parallel in peripheral blood mononuclear cells and liver tissues from healthy controls and HCV patients. Surprisingly, FAAH and MAGL mRNA was not changed significantly in PBMC from HCV-infected patients, but strongly downregulated in liver tissues compared to controls (p < 0.05) (Figure 2A,B). In spite of significant mRNA changes, the enzyme activities of FAAH and MAGL in the liver were not altered significantly in the CHC group (Figure 2C).

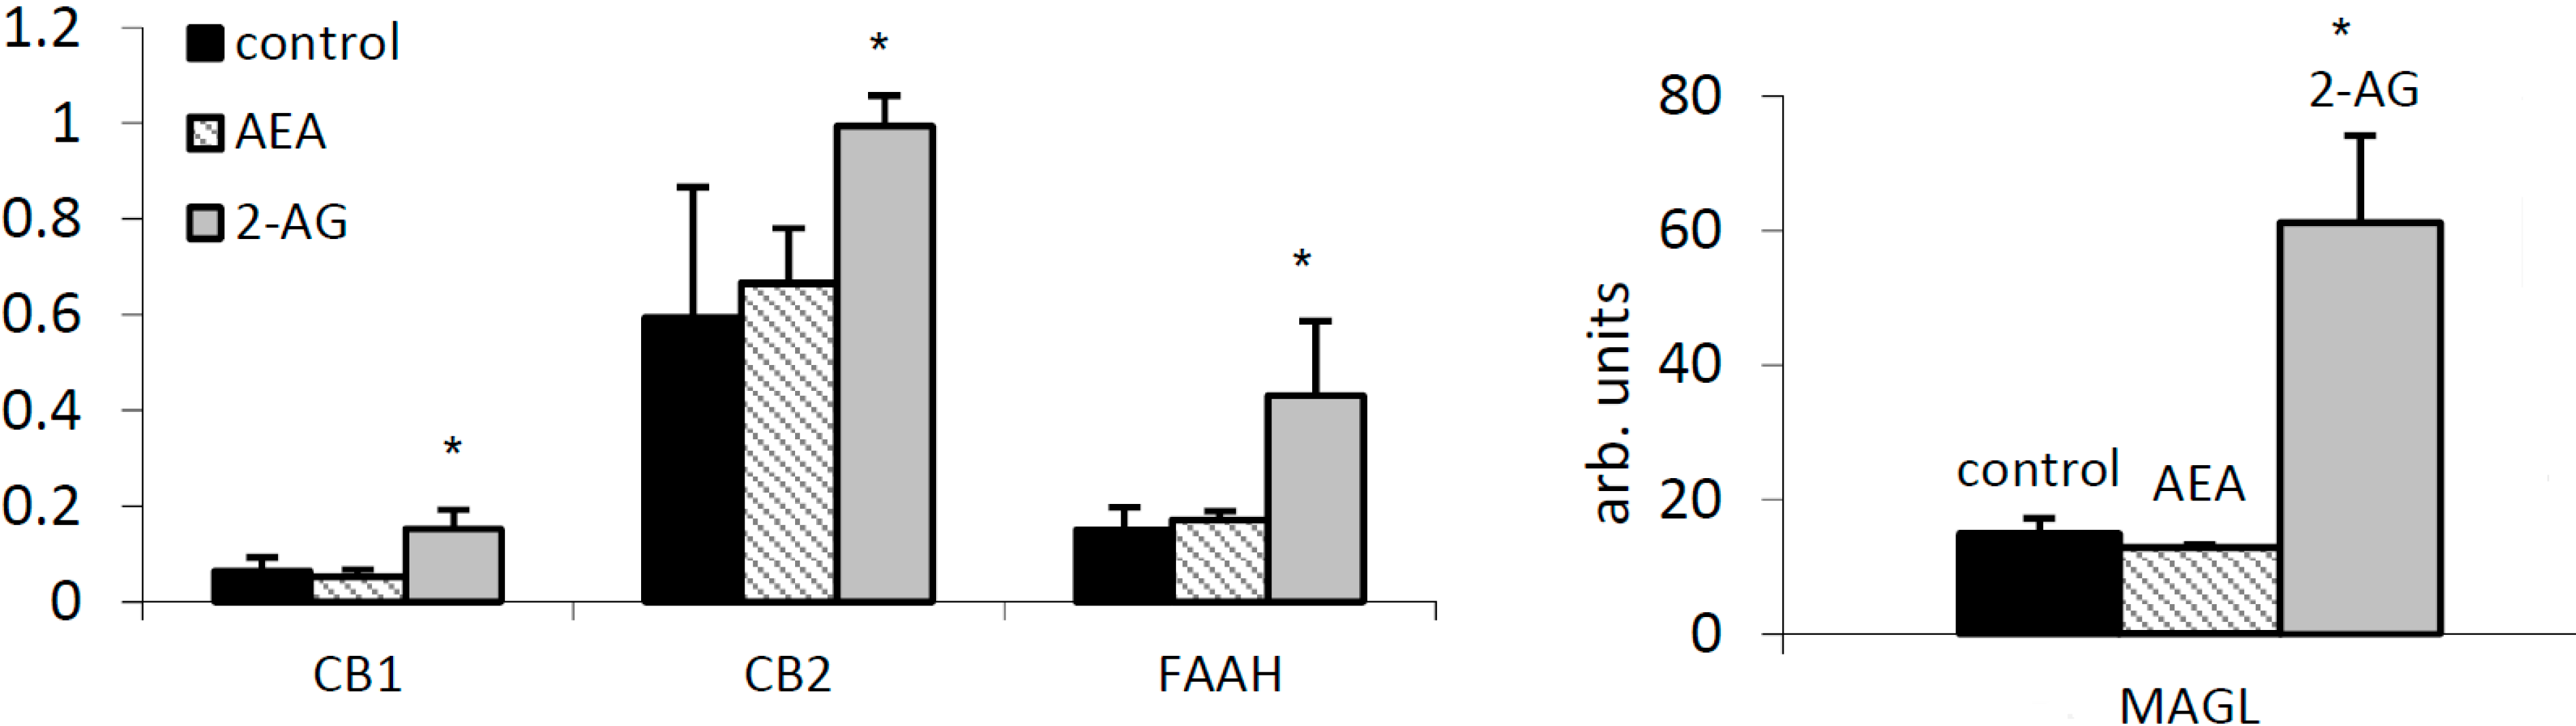
2.3. 2-AG Has a Major Impact on Expression of Components of the EC System in PBMC

The basal gene expression levels for FAAH, MAGL, CB1, and CB2 were measured in peripheral blood mononuclear cells (PBMC) from healthy controls to evaluate the possible mechanisms and regulation. The expression of MAGL was more than 100-fold higher when compared to FAAH mRNA, and CB2 mRNA was 10-fold higher than that for CB1 (Figure 3). Upon treatment with ECs, 20 µM 2-AG caused significant expression of CB1, as well as both degradation enzymes FAAH and MAGL after 24 h of incubation in culture, whereas 2.5 µM AEA was not effective (Figure 3).
Figure 2. Fatty acid amide hydrolase (FAAH) and monoaclyglycerol lipase (MAGL) mRNA and activity in CHC patients and healthy controls. (A) FAAH mRNA and MAGL mRNA in liver biopsies from CHC patients and control livers; (B) FAAH mRNA and MAGL mRNA in PBMC from CHC patients and healthy controls; (C) FAAH and MAGL enzymatic activity in liver biopsies from CHC patients and control livers. ns—not significant.
Ijms 16 07057 g002
Figure 3. Internal regulation of the EC system by arachidonoyl ethanolamide (AEA) and 2-arachidonoyl glycerol (2-AG). Cannabinoid receptors CB1, CB2, FAAH and MAGL mRNA expression in peripheral blood mononuclear cells (PBMC) by AEA (2.5 µM) and 2-AG (20 µM) was measured by TaqMan PCR and normalized to 18S RNA. * p < 0.05 vs. untreated control.
Ijms 16 07057 g003

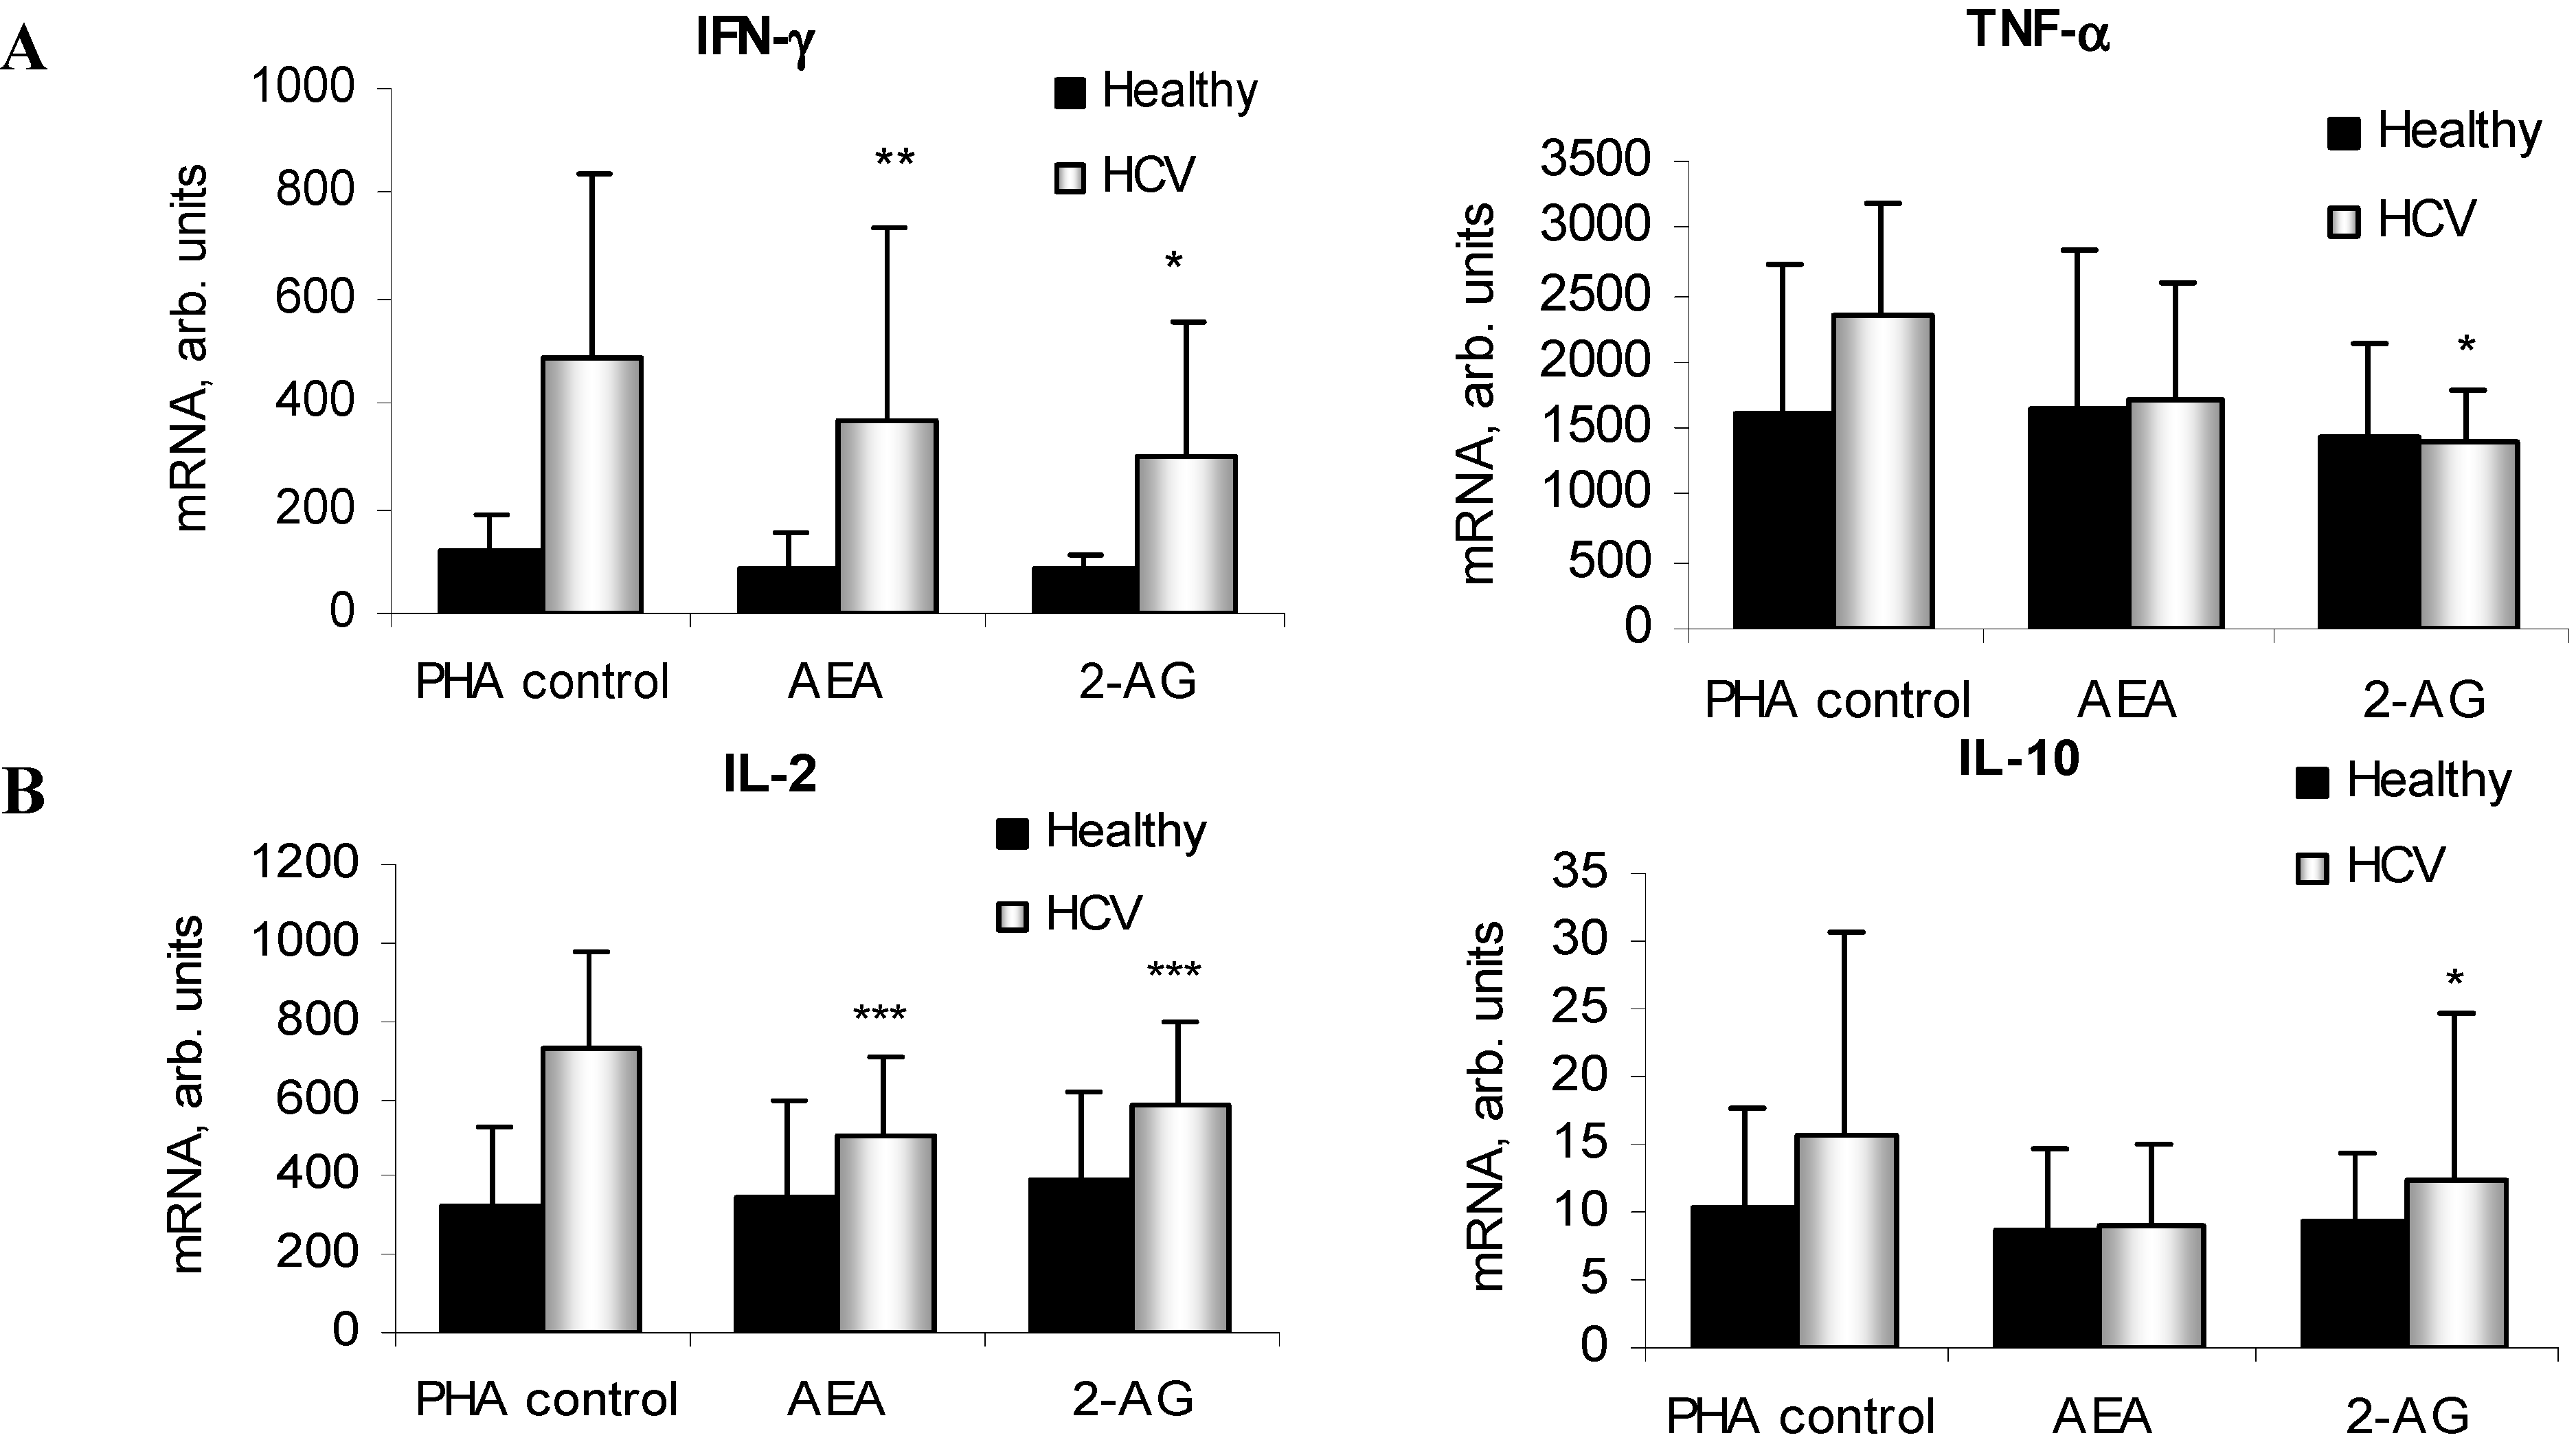
2.4. ECs Suppress Inflammatory Cytokine Production in PBMC

Treatment with AEA and 2-AG led to a downregulation of IFN-γ, TNF-α, I2, and IL-10 mRNA in PBMC from subjects with CHC but not from healthy controls (Figure 4A). At the protein level, ECs significantly reduced the release of all cytokines in both groups, except for IL-10 by 2-AG (Figure 4B). Furthermore, specific inhibition of the AEA degrading enzyme FAAH by PF-622 at 1 µM resulted in a decrease of IL-2 production in both healthy subjects and in HCV patients, and this suppression was much stronger in the latter (Figure 4C). These effects were cell death-independent, as confirmed by FACS analysis (Figure S1).
Figure 4. Inflammatory cytokines expression after EC treatment in PBMC. IFN-γ, TNF-α, IL-2 and IL-10 mRNA (A) and protein secretion (B) in phytohaemagglutinin (PHA)-stimulated PBMC isolated from healthy controls and HCV patients (n ≥ 10 each group); (C) IL-2 production after FAAH inhibition with PF-622 (1 µM). Results are expressed as arbitrary units or spot-forming cells (SFC) per 1 × 10⁶ cells. * p < 0.05; ** p < 0.005; *** p < 0.0005 vs. corresponding controls.
Ijms 16 07057 g004aIjms 16 07057 g004b

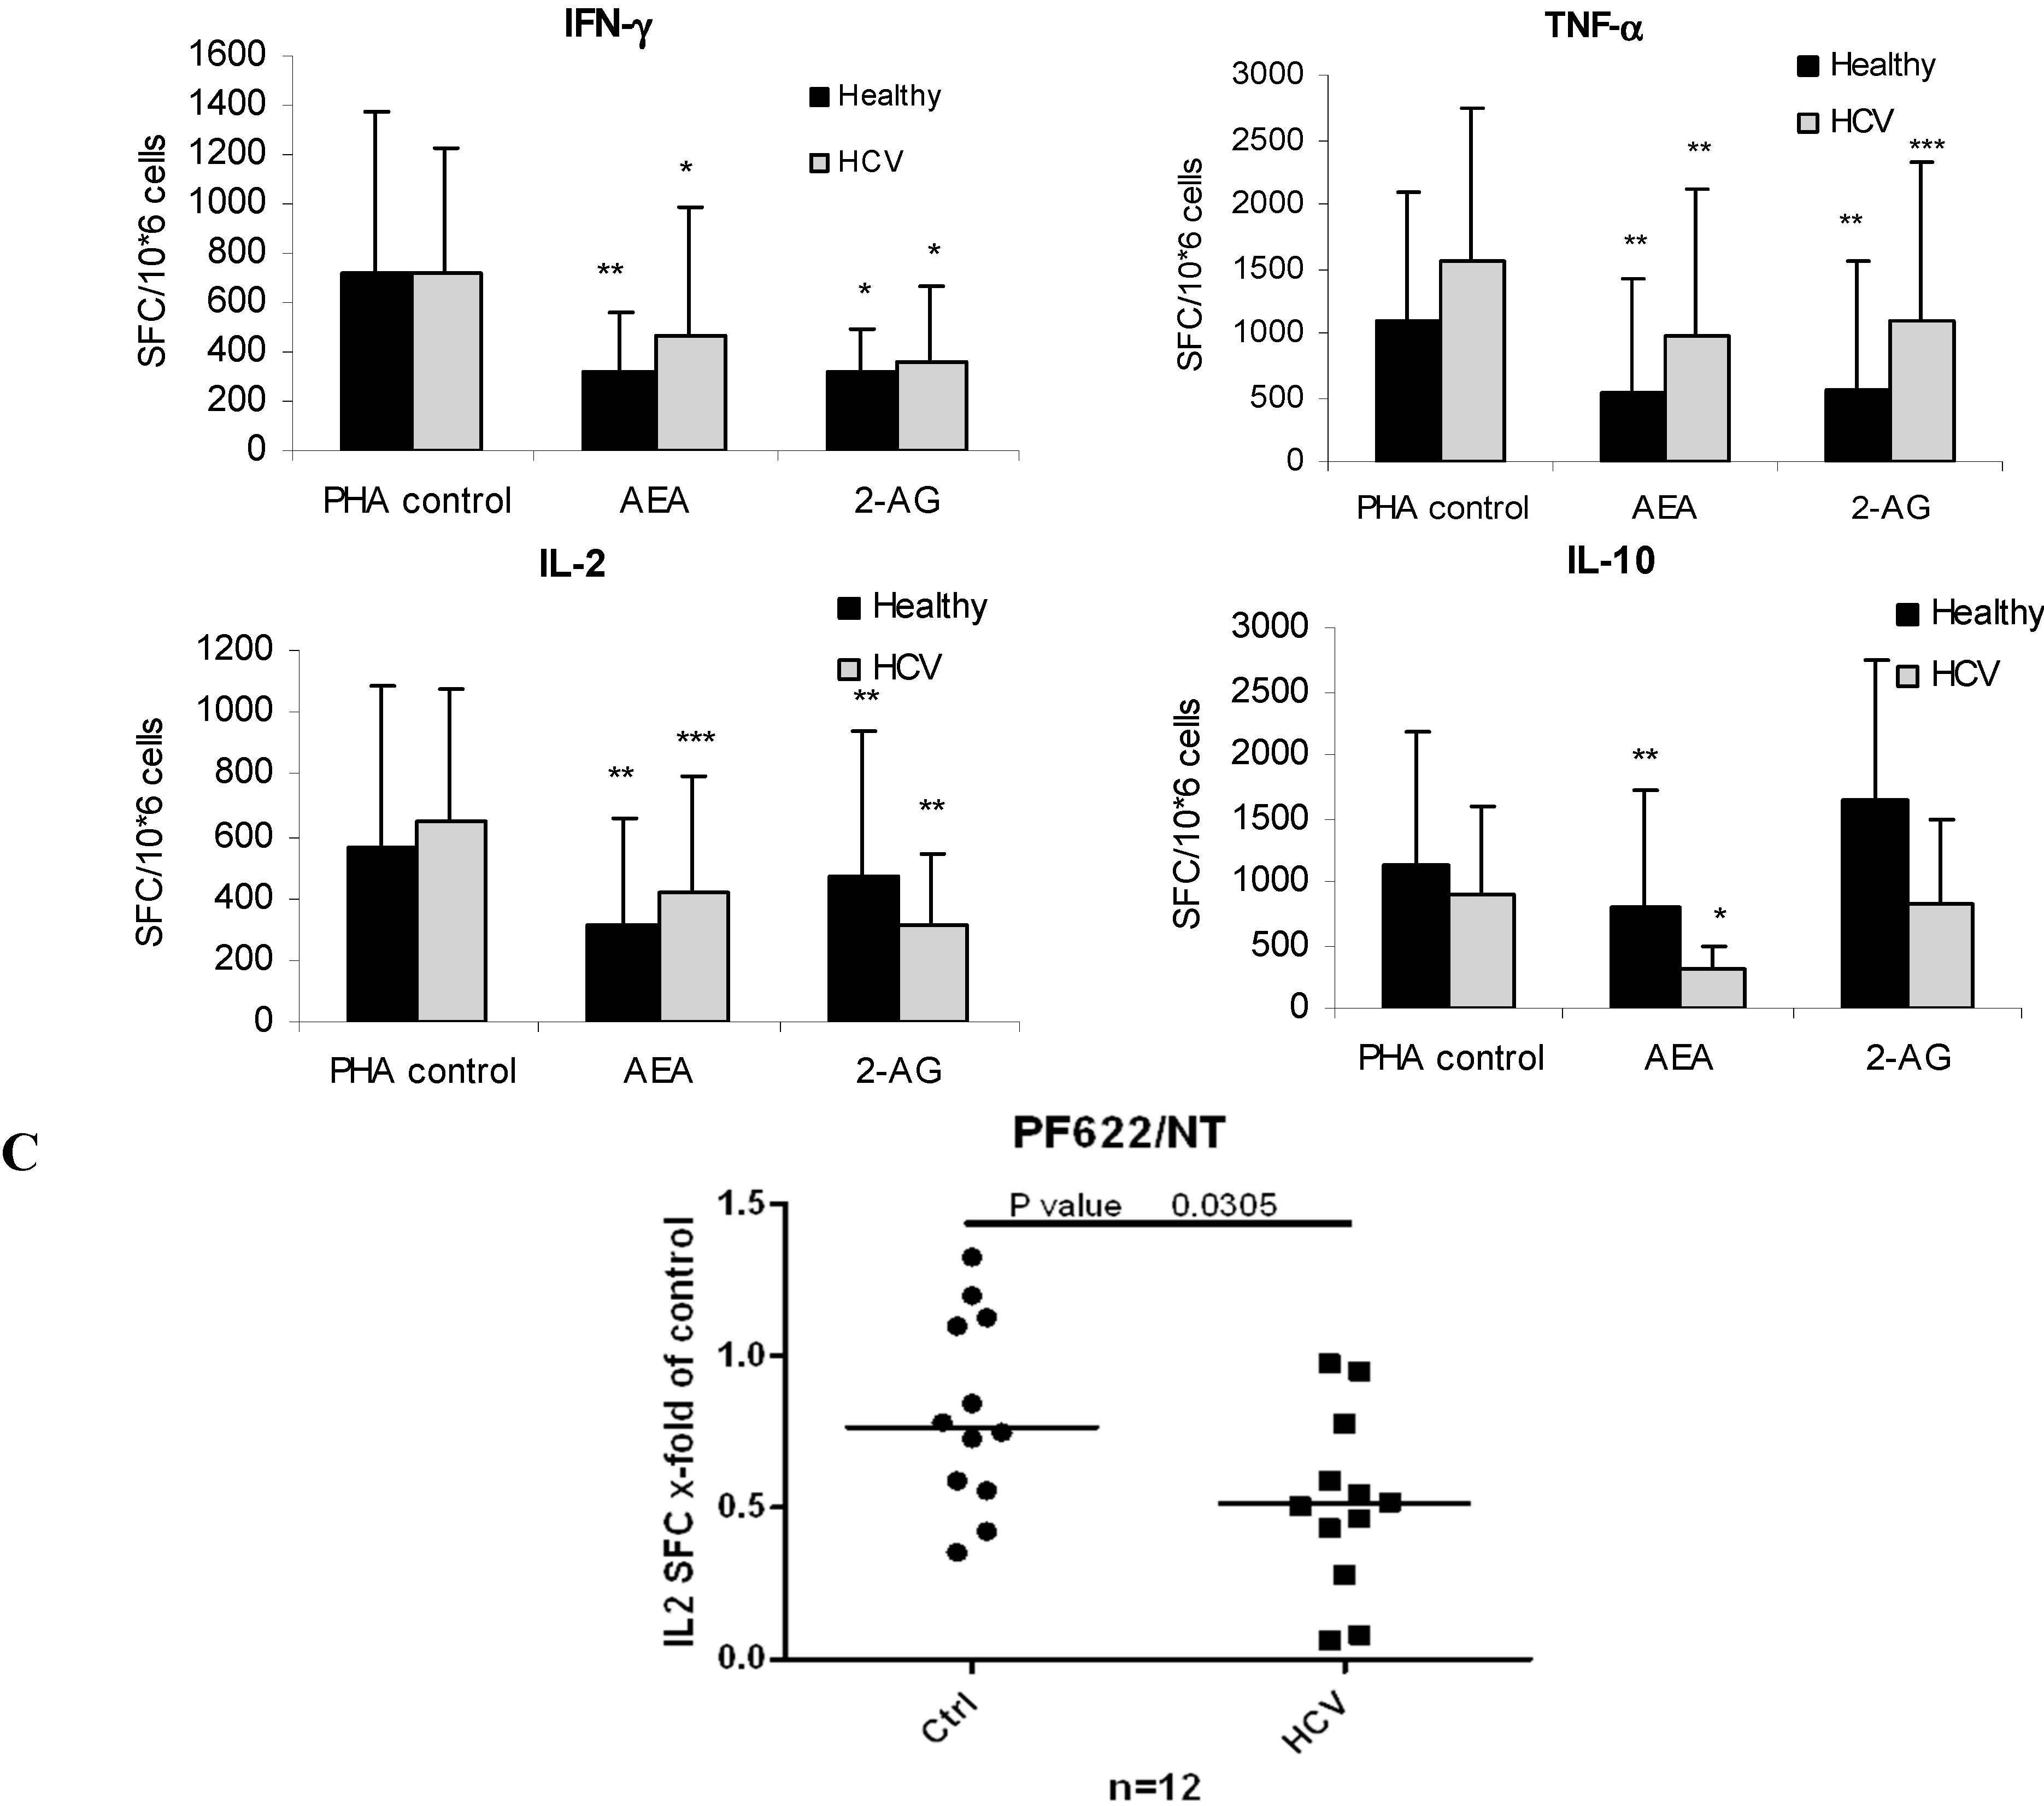
2.5. ECs Reduce Inflammatory Response from HCV-Activated PBMC

Different peptide pools covering the major part of the HCV genome were applied to PBMC isolated from HCV patients. Sufficient induction of IFN-γ was obtained from e1, e2, NS3-1 and NS3-2 pools, which was significantly reduced by AEA at 2.5 µM from 20 to more than 50% in some cases (Figure 5A). Furthermore, NS3 peptides significantly upregulated CB1 mRNA in PBMC, whereas CB2, FAAH and MAGL remained unchanged (Figure 5B).
Figure 5. AEA suppresses HCV-induced IFN-γ release in PBMC. (A) IFN-γ production in PBMC (n = 6) by HCV peptide pools (5 µg/mL) and 2.5 µM AEA. Results are expressed as spot-forming cells (SFC) per 1 × 10⁶ cells; (B) FAAH, MAGL, CB1 and CB2 mRNA in PBMC by the NS3 HCV pool. * p < 0.05 vs. corresponding non-treated control.
Ijms 16 07057 g005

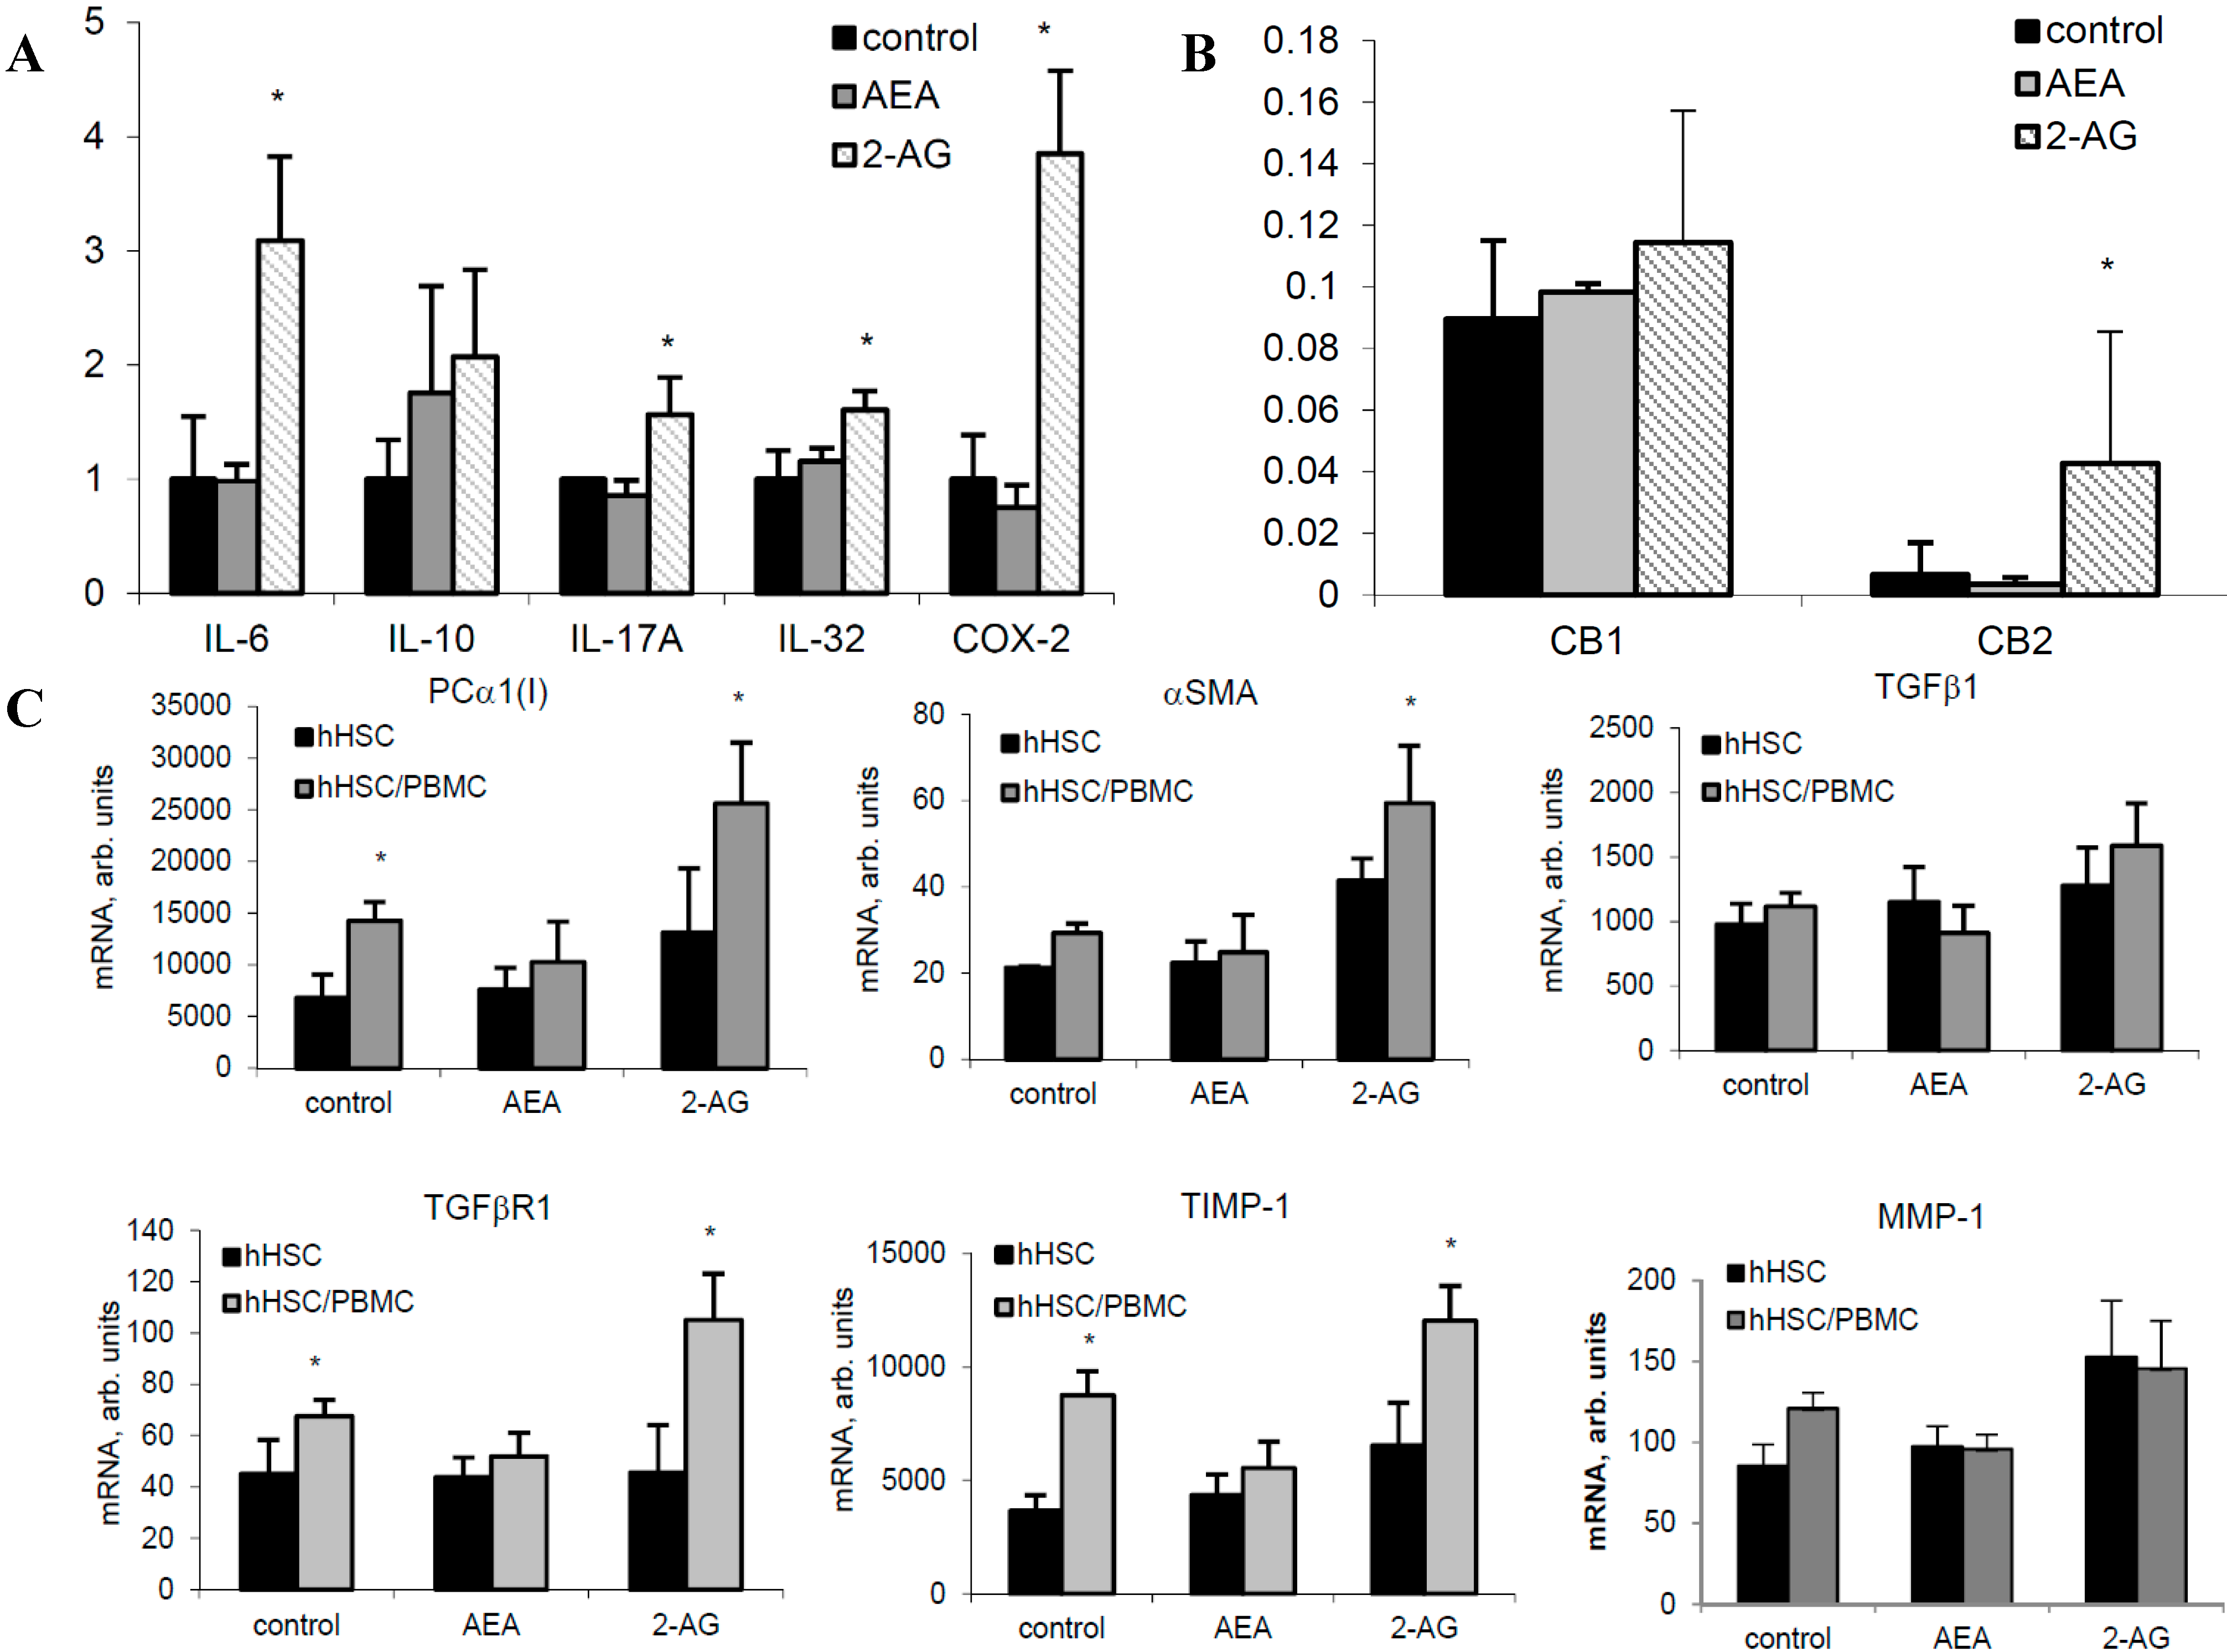
2.6. 2-AG Induces Inflammatory Cytokine Expression in Primary Hepatocytes and Fibrogenic Activation of HSC

In hHep, 2-AG induced the expression of IL-6, IL-10, IL-17A, IL-32, and COX-2 mRNA, whereas no significant changes occurred after AEA treatment (Figure 6A). TNFα and TGFβ1 mRNA were not changed by the EC treatment and IFN-γ and IL-2 mRNA were not detectable in primary hHep (not shown). Notably, here the expression of CB1 mRNA was much higher than of CB2, opposing to that of the CB receptors’ expression in PBMC (Figure 6B). Stimulation with 2-AG led to further upregulation of CB2 mRNA by fivefold (p < 0.05) but not of CB1 mRNA (Figure 6B).
Co-cultivation of primary hHSC with PHA-stimulated PBMC revealed a strong induction of PCα1(I), TGFβR1 and TIMP-1 mRNA in hHSC (Figure 6C). 2-AG further upregulated PCα1(I), αSMA, TGFβR1, and TIMP-1 mRNA, whereas TGFβ1 and MMP-1 remained non-significantly changed (Figure 6C).
Figure 6. ECs affect inflammatory and fibrogenic hepatic cells activities. (A) Inflammatory cytokines mRNA and (B) CB1 and CB2 mRNA in human hepatocytes by 2.5 µM AEA and 20 µM 2-AG; (C) Fibrosis-related mRNA in hHSC and hHSC co-cultivated with PBMC from CHC patients by 2.5 µM AEA and 20 µM 2-AG. * p < 0.05 vs corresponding non-treated control.
Ijms 16 07057 g006

3. Discussion

The involvement of CB1 and CB2 in modulating liver fibrosis, steatosis and cell regeneration has been repeatedly demonstrated [3,25,26]; however, the particular role of AEA and 2-AG, as well as EC degrading enzymes FAAH and MAGL in the development of CHC is not well known. Few studies showed that regular cannabis consumption may promote liver fibrosis and steatosis in CHC patients [21,22,23], but the involvement of EC system in HCV-induced injury has not been well described.
In the present study we show that AEA and 2-AG are increased in plasma from CHC patients compared to healthy controls. In the liver, AEA levels were below detection limits, whereas 2-AG were not different between groups. Clugston et al. [27] reported a concomitant reduction of hepatic FAAH expression paralleled by an increase of AEA but not of 2-AG in livers of alcohol-fed mice. Therefore, we hypothesized that in our study the increase of EC levels might be explained by reduced EC degradation enzymes activity. But in spite of a strong downregulation of FAAH and MAGL mRNA expression in the liver, the activity of corresponding enzymes was not changed. Comparable FAAH and MAGL activities between groups may be explained by the large interindividual variability, preventing significance due to the relatively low numbers of patients. Thus, an increase of ECs in plasma could be explained by enhanced EC synthesis in the liver or immune cells or reduced FAAH and MAGL activities from immune cells due to the stress from inflammation or tissue injury, as previously suggested by others [3,28,29,30].
As reported previously, the EC system can modulate inflammatory and immune responses [1,3,15,16,29]; however, its effects on HCV-specific immune reactions has not been delineated. Here we show that ECs suppress inflammatory cytokine secretion in PBMC from non-infected and HCV-infected patients. Accordingly, a rise of the endogenously produced AEA in PBMC induced by selective FAAH inhibition reduced the release of IL-2 to a much higher extent in HCV samples, thus potentially compromising the immune response.
To elucidate whether HCV directly affects the EC system, we applied various HCV peptides to PBMC and found that it markedly induced CB1 mRNA expression. It has been demonstrated that HCV stimulates CB1 and 2-AG production in hepatocytes, resulting in a changed expression profile of glucose metabolism-related genes and increased steatosis [24,31] and, most interestingly, CB1 antagonists inhibit hepatitis C virus production [32] but whether the increase of CB1 impairs PBMC functions still remains to be investigated.
Next, we explored the effects of ECs on inflammation- and fibrosis-related genes in hepatocytes and hHSC, in an attempt to extend our previous work showing 2-AG as an inducer of CB1 and αSMA in hHSC [33]. Although we were not able to detect a significant difference in 2-AG expression in the livers of HCV-infected patients here, it may still be possible that ECs contribute to ongoing liver damage via activated and sensitized liver cells. Thus, in primary hepatocytes, and opposite to that in PBMC, 2-AG strongly upregulated the expression of IL-6, -10, -17A, -32, and, especially, of COX-2 mRNA, the converting enzyme for the main precursor of ECs, arachidonic acid. This observation suggests differential and site-specific regulation of EC system, with higher CB1 expression on hepatocytes, rendering them more susceptible to the pro-inflammatory effects of ECs, and higher CB2 expression on PBMC, making them amenable to the immunosuppressive effects from ECs. Even though CB2 was likewise induced to some extent by 2-AG in hepatocytes, this effect did not seem to be sufficient to overcome the CB1-mediated induction of inflammatory genes. However, this will unlikely lead to increased hepatic inflammation in general, as hepatocytes are not the major contributors to the immune response, and ECs-induced immunomodulatory effects are mostly mediated via CB2 on locally residing Kupffer cells or hepatic or peripheral T-lymphocytes [12,18,34]. This highlights a careful interpretation of the results from in vitro studies performed in single cell types before translating obtained findings to the situation in humans.
To explore this further, we studied the impact of ECs on hepatic fibrogenesis by performing a co-cultivation experiment of hHSC with PBMC from HCV-infected subjects. Co-cultivation of PBMC with hHSC per se induced a pro-fibrogenic phenotype of hHSC via upregulation of key fibrosis genes PCα1(I), TGFβR1 and TIMP-1 mRNA, and 2-AG further enhanced this effect strongly. Nattermann and colleagues convincingly demonstrated that the ineffective immune response during HCV infection may be directly linked to aggravation of hepatic fibrogenesis, as CD4(+) T cells were shown to stimulate anti-fibrotic NK cell activity via IL-2 mediated upregulation of NKG2D, and an impaired activity of CD4(+) T cells contribute to acceleration of liver fibrosis [35].
Thus, the question of whether increased ECs in CHC promote liver disease progression due to impaired systemic immune response and stimulated fibrogenesis, or alleviate these processes via CB2 activation still remains an open question, as effects are at least in part counteractive [36,37]. Immunosuppressive effects of tetrahydrocannabinol and other cannabinoids have been shown in B-, T-, NK-cells, and macrophages via CB1 and CB2-dependent and -independent mechanisms [15,16], whereas in the liver, direct favorable effects of ECs on inflammation and oxidative stress have been shown in ischemia reperfusion experimental models in rodents [38].
In conclusion, we found that AEA and 2-AG are increased in patients with CHC, and that HCV may directly affect the EC system via regulation of CB receptor expression. Increased EC levels during HCV infection might suppress inflammatory cytokines production, thereby weakening the immune response towards HCV infection. In addition, ECs may aggravate liver fibrosis via direct HSC activation. Whether the EC system halts or perpetuates chronic liver damage, and can thus be a therapeutic target in chronic HCV infection, still remains to be elucidated in more details in vivo to account for various confounding factors such as disease stage, viral load, immune status, presence of fibrosis or degree of hepatic inflammation, steatosis, and probably others, calling for a note of caution in targeting the EC system in the treatment of CHC [37].

4. Material and Methods

4.1. Human Tissues and Patients’ Characteristics

EC levels and EC degradation enzymes activity were measured in liver tissues and plasma samples from patients with CHC and from healthy controls. Plasma samples were obtained from HCV patients (n = 57) (Inselspital, Bern) and healthy volunteers (n = 25) according to a strict standard operating procedure (SOP) (Supporting Information). Snap-frozen liver tissues were obtained from consecutive HCV patients (Inselspital Bern, Switzerland) who underwent percutaneous liver biopsies for diagnostic reasons (n = 17). All biopsies were evaluated for fibrosis and inflammatory activity according to the standard METAVIR scoring system. Histologically normal liver biopsies from patients who underwent bariatric surgery (Department of Visceral Surgery, University of Schleswig-Holstein, Kiel, Germany) (n = 6) [39] and cholecystectomy (Inselspital, Bern) (n = 3) served as controls. The human study was approved by the ethical committees of the two participating centers. All patients and volunteers gave written informed consent to have their biological materials assayed in a retrospective study. Patients’ characteristics are summarized in Table 2 and Table 3.
Table 2. Patients’ characteristics (plasma samples).
ControlHCV
Number of patients2557
Female (n, %)15 (60)22 (38.6)
Age (mean, SD)44.2 (11.4)52.7 (10.0)
Diabetes (n, %)05 (8.8)
BMI (mean, SD)NA24.7 (3.8)
ALT (mean, SD)NA115.8 (84.4)
AST (mean, SD)NA91.1 (58.8)
INR (mean, SD)NANA
Albumin (mean, SD)NANA
CHILD
A 14 (24.6)
B 2 (3.5)
C 0
Unknown/NA25 (100.0)41 (71.9)
Fibrosis stage
0 4 (7.0)
1 21 (36.8)
2 11 (19.3)
3 5 (8.8)
4 15 (26.3)
Unknown/NA25 (100.0)1 (1.8)
Activity grade
19 (33.3)
14 (24.6)
1 (1.8)
Unknown/NA25 (100.0)23 (40.4)
Steatosis
No 15 (26.3)
Yes 16 (28.1)
Unknown25 (100.0)26 (45.6)
Genotype
1 2 (3.5)
1A 11 (19.3)
1B 18 (31.6)
2 8 (14.0)
3 14 (24.6)
4 3 (5.3)
Negative 1 (1.8)
Unknown/NA100 (100.0)0 (0.0)
Viral load (mean/SD) MissingNA2,182,222 (2,705,243) 1 (1.8)
Table 3. Patients’ characteristics (liver biopsies).
Control (Bariatric Surgery)HCV
Number of patients617
Female (n, %)4 (66)6 (35.3)
Age (mean, SD)34 (8.4)57.5 (12.7)
Diabetes (n, %)6 (100)NA
BMI (mean, SD)49.5 (7.3)NA
ALT (mean, SD)NANA
AST (mean, SD)NANA
INR (mean, SD)NANA
Albumin (mean, SD)NANA
CHILD
A 5 (29.4)
B 0 (0.0)
C 0 (0.0)
Unknown/NA
Fibrosis stage
06 (100.0) 1 (5.9)
1 0 (0.0)
2 3 (17.6)
3 8 (47)
4 5 (29.4)
Unknown/NA
Activity grade
1 6 (35.3)
2 10 (58.8)
3 1 (5.9)
Unknown/NA
Steatosis
No6 (100.0)5 (29.4)
Yes 12 (70.5)
Unknown
Genotype6 (100.0)
1
1A 12 (70.5)
1B NA
2 NA
3 1 (5.9)
4 2 (11.7)
Negative Unknown/NA6 (100.0)2 (11.7)
Viral load (mean/SD)NA2,530,938 (3,483,784)

4.2. Materials

Human peripheral blood mononuclear cells (PBMC) were obtained from whole blood via density-gradient centrifugation as previously described [40]. Primary human hepatic stellate cells (hHSC) and primary human hepatocytes (hHep) were obtained from ScienCellTM Research Laboratories (Carlsbad, CA, USA). AEA and 2-AG were obtained from Sigma-Aldrich, Germany; PF-622, URB-597 and JZL184 from Cayman Chemical, USA; HCV peptide pools from BEI Resources, Manassas, VA, USA. Overlapping peptides derived from the HCV strain H77 (genotype 1a) spanning the complete HCV polyprotein (18 amino acids each, overlapping by 11 amino acids) were used at a final concentration of 5 μg/mL [34]. The composition of the peptide pools is provided in Supporting Information (Table S1).

4.3. Analysis of ECs in Human Plasma Samples and Liver Biopsies

Plasma levels of ECs were measured by GC-MS, as will be published in detail elsewhere, while in the liver, ECs were measured by LC-MS, as described in Supporting Information (Table S2).

4.3.1. FAAH and MAGL Activity Assay

Enzyme activities were measured as described previously [41]. Briefly, 1 µM of URB597, JZL-184 or vehicle was pre-incubated for 30 min at 37 °C with 490 μL of diluted liver tissue homogenates (1 mg total protein/sample) in 10 mM Tris-HCl, 1mM EDTA (pH8.0). A mixture of 100 nM AEA plus 1 nM [3H]-AEA or 1 µM 2-AG plus 1nM [3H]-2-AG was added and incubated for 15 min at 37 °C. The reaction was stopped by transferring the samples to a new tube containing 1 mL of CHCl3/CH3OH mixture (1:1, v/v). The solution was vigorously vortexed and then centrifuged at 4 °C for 10 min at 10,000 rpm to separate aqueous and organic phase. The amount of [3H]ethanolamine (AEA degradation) or [3H]glycerol (2-AG degradation) formed upon enzymatic hydrolysis was quantified by adding 3 mL of Ultima Gold scintillation liquid (PerkinElmer Life Sciences, Long Island, NY, USA) to the aqueous phases and measuring the radioactivity with the Packard Tri-Carb 2100 TR β-counter.

4.3.2. In Vitro Experiments

PBMC, hHSC and hHep were cultured in Roswell Park Memorial Institute medium (RPMI), Dulbecco’s modified Eagle's medium (DMEM) or hepatocyte medium (HM; ScienCell, Carlsbad, CA, USA), respectively, containing 10% FBS, 2 mM glutamine, 100 U/mL penicillin and 100 U/mL streptomycin. Cells were maintained at 37 °C in 5% CO2 humidified atmosphere.
hHSC and hHep were seeded onto 12-well plates and, after reaching semi-confluent state, starved in serum-free medium for next 24 h. Treatment with 2.5 µM AEA and 20 µM 2-AG, 1 µM PF-622, 5 µg/mL phytohemagglutinin (PHA) or 5 μg/mL HCV peptides pools was performed for 6–24 h in complete medium containing 0.1% FBS.
Co-cultivation of hHSC and PBMC was performed using 0.4 µm polycarbonate membrane 12 mm inserts (Corning Incorporated, Lifesciences, Lausen, Switzerland).

4.3.3. Quantitative Real-Time PCR

Total RNA was isolated from snap frozen tissues or cultured cells using the RNeasy kit (Qiagen, Basel, Switzerland) and 1 µg transcribed to cDNA as described [42]. Quantitative real-time PCR was performed on the ABI 7700 Sequence Detector (Applied Biosystems, Rotkreuz, Switzerland) using ready-to-use primers and probes sets (Applied Biosystems, Rotkreuz, Switzerland). For normalization, the housekeeping gene 18SRNA was amplified in a parallel reaction.

4.3.4. ELISpot

Cytokine production was determined by ELISpot assay (MABTECH, Stockholm, Sweden) according to the manufacturer’s instructions as previously described [34,40,43,44]. Briefly, PBMC were seeded at 1 × 10⁶ cells/mL and pre-incubated in RPMI with or without ECs for 3 h at 37 °C before stimulation with PHA or HCV peptides, where applicable. The vehicle alone was used as a negative control.

4.4. Statistical Analysis

Statistical analyses were performed using Microsoft Excel and GraphPad Prism software. Data are expressed as means ± SD. The statistical significance of differences was evaluated using paired or unpaired Student’s t-test or nonparametric ANOVA Kruskal-Wallis test. Predictions were performed using multiple regression analysis.

Supplementary Materials

Supplementary materials can be found at https://www.mdpi.com/1422-0067/16/04/7057/s1.

Acknowledgments

The study was funded in part by a grant from the Swiss Foundation for Alcohol Research to Eleonora Patsenker and Nasser Semmo and by a grant 3100 A0–122114/1 from the Swiss National Science Foundation (to Felix Stickel). Nasser Semmo was supported by unrestricted research grants from Roche and Merck Sharp & Dohme (MSD) and received funding from the Gertrud and Walter Siegenthaler Foundation, Zurich, Switzerland.

Author Contributions

Conceived and designed the experiments: Eleonora Patsenker, Philip Sachse, Nasser Semmo and Felix Stickel. Performed the experiments: Eleonora Patsenker, Philip Sachse, Andrea Chicca, Maria Salome Gachet, Vreni Schneider, Jochan Mattsson and Christian Lanz. Analyzed the data: Eleonora Patsenker, Philip Sachse, Andrea Chicca, Maria Salome Gachet, Jochan Mattsson, Mathias Worni and Christian Lanz. Contributed reagents/materials/analysis tools: Andrea de Gottardi, Mariam Semmo, Jochen Hampe, Clemens Schafmayer, Rudolf Brenneisen and Jürg Gertsch. Wrote the paper: Eleonora Patsenker, Jürg Gertsch, Andrea Chicca, Felix Stickel and Nasser Semmo.

Abbreviations

AEA
anandamide
2-AG
2-arachidonoyl glycerol
CHC
chronic hepatitis C
FAAH
fatty acid amid hydrolase
MAGL
monoacylglycerol lipase
hHep
human hepatocytes
hHSC
human hepatic stellate cells

Conflicts of Interest

The authors declare no conflict of interest.

References

  1. Nagarkatti, P.; Pandey, R.; Rieder, S.A.; Hegde, V.L.; Nagarkatti, M. Cannabinoids as novel anti-inflammatory drugs. Future Med. Chem. 2009, 1, 1333–1349. [Google Scholar] [CrossRef] [PubMed]
  2. Julien, B.; Grenard, P.; Teixeira-Clerc, F.; van Nhieu, J.T.; Li, L.; Karsak, M.; Zimmer, A.; Mallat, A.; Lotersztajn, S. Antifibrogenic role of the cannabinoid receptor CB2 in the liver. Gastroenterology 2005, 128, 742–755. [Google Scholar] [CrossRef] [PubMed]
  3. Pacher, P.; Gao, B. Endocannabinoids and liver disease. III. Endocannabinoid effects on immune cells: Implications for inflammatory liver diseases. Am. J. Physiol. Gastrointest. Liver Physiol. 2008, 294, G850–G854. [Google Scholar]
  4. Guillot, A.; Hamdaoui, N.; Bizy, A.; Zoltani, K.; Souktani, R.; Zafrani, E.S.; Mallat, A.; Lotersztajn, S.; Lafdil, F. Cannabinoid receptor 2 counteracts interleukin-17-induced immune and fibrogenic responses in mouse liver. Hepatology 2014, 59, 296–306. [Google Scholar] [CrossRef] [PubMed]
  5. Teixeira-Clerc, F.; Julien, B.; Grenard, P.; Tran Van Nhieu, J.; Deveaux, V.; Li, L.; Serriere-Lanneau, V.; Ledent, C.; Mallat, A.; Lotersztajn, S. CB1 cannabinoid receptor antagonism: A new strategy for the treatment of liver fibrosis. Nat. Med. 2006, 12, 671–676. [Google Scholar] [CrossRef] [PubMed]
  6. Mallat, A.; Teixeira-Clerc, F.; Deveaux, V.; Manin, S.; Lotersztajn, S. The endocannabinoid system as a key mediator during liver diseases: New insights and therapeutic openings. Br. J. Pharmacol. 2011, 163, 1432–1440. [Google Scholar] [CrossRef] [PubMed]
  7. Caraceni, P.; Viola, A.; Piscitelli, F.; Giannone, F.; Berzigotti, A.; Cescon, M.; Domenicali, M.; Petrosino, S.; Giampalma, E.; Riili, A.; et al. Circulating and hepatic endocannabinoids and endocannabinoid-related molecules in patients with cirrhosis. Liver Int. 2009, 30, 816–825. [Google Scholar]
  8. Biswas, K.K.; Sarker, K.P.; Abeyama, K.; Kawahara, K.; Iino, S.; Otsubo, Y.; Saigo, K.; Izumi, H.; Hashiguchi, T.; Yamakuchi, M.; et al. Membrane cholesterol but not putative receptors mediates anandamide-induced hepatocyte apoptosis. Hepatology 2003, 38, 1167–1177. [Google Scholar] [PubMed]
  9. Osei-Hyiaman, D.; DePetrillo, M.; Pacher, P.; Liu, J.; Radaeva, S.; Batkai, S.; Harvey-White, J.; Mackie, K.; Offertaler, L.; Wang, L.; et al. Endocannabinoid activation at hepatic cb1 receptors stimulates fatty acid synthesis and contributes to diet-induced obesity. J. Clin. Investig. 2005, 115, 1298–1305. [Google Scholar]
  10. Siegmund, S.V.; Seki, E.; Osawa, Y.; Uchinami, H.; Cravatt, B.F.; Schwabe, R.F. Fatty acid amide hydrolase determines anandamide-induced cell death in the liver. J. Biol. Chem. 2006, 281, 10431–10438. [Google Scholar] [CrossRef] [PubMed]
  11. Baldassarre, M.; Giannone, F.A.; Napoli, L.; Tovoli, A.; Ricci, C.S.; Tufoni, M.; Caraceni, P. The endocannabinoid system in advanced liver cirrhosis: Pathophysiological implication and future perspectives. Liver Int. 2013, 33, 1298–1308. [Google Scholar] [CrossRef] [PubMed]
  12. Cencioni, M.T.; Chiurchiu, V.; Catanzaro, G.; Borsellino, G.; Bernardi, G.; Battistini, L.; Maccarrone, M. Anandamide suppresses proliferation and cytokine release from primary human t-lymphocytes mainly via CB2 receptors. PLoS ONE 2010, 5, e8688. [Google Scholar] [CrossRef] [PubMed]
  13. Pandey, R.; Hegde, V.L.; Singh, N.P.; Hofseth, L.; Singh, U.; Ray, S.; Nagarkatti, M.; Nagarkatti, P.S. Use of cannabinoids as a novel therapeutic modality against autoimmune hepatitis. Vitam. Horm. 2009, 81, 487–504. [Google Scholar] [PubMed]
  14. Hegde, V.L.; Hegde, S.; Cravatt, B.F.; Hofseth, L.J.; Nagarkatti, M.; Nagarkatti, P.S. Attenuation of experimental autoimmune hepatitis by exogenous and endogenous cannabinoids: Involvement of regulatory t cells. Mol. Pharmacol. 2008, 74, 20–33. [Google Scholar] [CrossRef] [PubMed]
  15. Klein, T.W.; Newton, C.; Larsen, K.; Chou, J.; Perkins, I.; Lu, L.; Nong, L.; Friedman, H. Cannabinoid receptors and T helper cells. J. Neuroimmunol. 2004, 147, 91–94. [Google Scholar] [CrossRef] [PubMed]
  16. Klein, T.W.; Newton, C.; Larsen, K.; Lu, L.; Perkins, I.; Nong, L.; Friedman, H. The cannabinoid system and immune modulation. J. Leukoc. Biol. 2003, 74, 486–496. [Google Scholar] [CrossRef] [PubMed]
  17. Rockwell, C.E.; Snider, N.T.; Thompson, J.T.; Vanden Heuvel, J.P.; Kaminski, N.E. Interleukin-2 suppression by 2-arachidonyl glycerol is mediated through peroxisome proliferator-activated receptor γ independently of cannabinoid receptors 1 and 2. Mol. Pharmacol. 2006, 70, 101–111. [Google Scholar] [PubMed]
  18. Louvet, A.; Teixeira-Clerc, F.; Chobert, M.N.; Deveaux, V.; Pavoine, C.; Zimmer, A.; Pecker, F.; Mallat, A.; Lotersztajn, S. Cannabinoid CB2 receptors protect against alcoholic liver disease by regulating kupffer cell polarization in mice. Hepatology 2011, 54, 1217–1226. [Google Scholar] [CrossRef] [PubMed]
  19. Zhou, L.; Ding, L.; Yin, P.; Lu, X.; Wang, X.; Niu, J.; Gao, P.; Xu, G. Serum metabolic profiling study of hepatocellular carcinoma infected with hepatitis B or hepatitis C virus by using liquid chromatography-mass spectrometry. J. Proteome Res. 2012, 11, 5433–5442. [Google Scholar] [CrossRef] [PubMed]
  20. Mallat, A.; Teixeira-Clerc, F.; Lotersztajn, S. Cannabinoid signaling and liver therapeutics. J. Hepatol. 2013, 59, 891–896. [Google Scholar] [CrossRef] [PubMed]
  21. Ishida, J.H.; Peters, M.G.; Jin, C.; Louie, K.; Tan, V.; Bacchetti, P.; Terrault, N.A. Influence of cannabis use on severity of hepatitis c disease. Clin. Gastroenterol. Hepatol. 2008, 6, 69–75. [Google Scholar] [CrossRef] [PubMed]
  22. Hezode, C.; Roudot-Thoraval, F.; Nguyen, S.; Grenard, P.; Julien, B.; Zafrani, E.S.; Pawlotsky, J.M.; Dhumeaux, D.; Lotersztajn, S.; Mallat, A. Daily cannabis smoking as a risk factor for progression of fibrosis in chronic hepatitis c. Hepatology 2005, 42, 63–71. [Google Scholar] [CrossRef] [PubMed]
  23. Hezode, C.; Zafrani, E.S.; Roudot-Thoraval, F.; Costentin, C.; Hessami, A.; Bouvier-Alias, M.; Medkour, F.; Pawlostky, J.M.; Lotersztajn, S.; Mallat, A. Daily cannabis use: A novel risk factor of steatosis severity in patients with chronic hepatitis c. Gastroenterology 2008, 134, 432–439. [Google Scholar] [CrossRef] [PubMed]
  24. Van der Poorten, D.; Shahidi, M.; Tay, E.; Sesha, J.; Tran, K.; McLeod, D.; Milliken, J.S.; Ho, V.; Hebbard, L.W.; Douglas, M.W.; et al. Hepatitis C virus induces the cannabinoid receptor 1. PLoS ONE 2010, 5, e12841. [Google Scholar]
  25. Parfieniuk, A.; Flisiak, R. Role of cannabinoids in chronic liver diseases. World J. Gastroenterol. 2008, 14, 6109–6114. [Google Scholar] [CrossRef] [PubMed]
  26. Siegmund, S.V.; Schwabe, R.F. Endocannabinoids and liver disease. II. Endocannabinoids in the pathogenesis and treatment of liver fibrosis. Am. J. Physiol. Gastrointest. Liver Physiol. 2008, 294, G357–G362. [Google Scholar] [CrossRef]
  27. Clugston, R.D.; Jiang, H.; Lee, M.X.; Piantedosi, R.; Yuen, J.J.; Ramakrishnan, R.; Lewis, M.J.; Gottesman, M.E.; Huang, L.S.; Goldberg, I.J.; et al. Altered hepatic lipid metabolism in c57bl/6 mice fed alcohol: A targeted lipidomic and gene expression study. J. Lipid Res. 2011, 52, 2021–2031. [Google Scholar]
  28. Balvers, M.G.; Verhoeckx, K.C.; Meijerink, J.; Bijlsma, S.; Rubingh, C.M.; Wortelboer, H.M.; Witkamp, R.F. Time-dependent effect of in vivo inflammation on eicosanoid and endocannabinoid levels in plasma, liver, ileum and adipose tissue in c57bl/6 mice fed a fish-oil diet. Int. Immunopharmacol. 2012, 13, 204–214. [Google Scholar] [CrossRef] [PubMed]
  29. Di Marzo, V.; Petrosino, S. Endocannabinoids and the regulation of their levels in health and disease. Curr. Opin. Lipidol. 2007, 18, 129–140. [Google Scholar] [CrossRef] [PubMed]
  30. Hauer, D.; Schelling, G.; Gola, H.; Campolongo, P.; Morath, J.; Roozendaal, B.; Hamuni, G.; Karabatsiakis, A.; Atsak, P.; Vogeser, M.; et al. Plasma concentrations of endocannabinoids and related primary fatty acid amides in patients with post-traumatic stress disorder. PLoS ONE 2013, 8, e62741. [Google Scholar]
  31. Sun, L.J.; Yu, J.W.; Wan, L.; Zhang, X.Y.; Shi, Y.G.; Chen, M.Y. Endocannabinoid system activation contributes to glucose metabolism disorders of hepatocytes and promotes hepatitis C virus replication. Int. J. Infect. Dis. 2014, 23, 75–81. [Google Scholar] [CrossRef] [PubMed]
  32. Shahidi, M.; Tay, E.S.; Read, S.A.; Ramezani-Moghadam, M.; Chayama, K.; George, J.; Douglas, M.W. Endocannabinoid CB1 antagonists inhibit hepatitis C virus production, providing a novel class of antiviral host targeting agents. J. Gen. Virol. 2014, 95, 2468–2479. [Google Scholar] [CrossRef] [PubMed]
  33. Patsenker, E.; Stoll, M.; Millonig, G.; Agaimy, A.; Wissniowski, T.; Schneider, V.; Mueller, S.; Brenneisen, R.; Seitz, H.K.; Ocker, M.; et al. Cannabinoid receptor type I modulates alcohol-induced liver fibrosis. Mol. Med. 2011, 17, 1285–1294. [Google Scholar]
  34. Mueller, M.; Spangenberg, H.C.; Kersting, N.; Altay, T.; Blum, H.E.; Klenerman, P.; Thimme, R.; Semmo, N. Virus-specific cd4+ T cell responses in chronic hcv infection in blood and liver identified by antigen-specific upregulation of cd154. J. Hepatol. 2010, 52, 800–811. [Google Scholar] [CrossRef] [PubMed]
  35. Glassner, A.; Eisenhardt, M.; Kokordelis, P.; Kramer, B.; Wolter, F.; Nischalke, H.D.; Boesecke, C.; Sauerbruch, T.; Rockstroh, J.K.; Spengler, U.; et al. Impaired CD4+ T cell stimulation of nk cell anti-fibrotic activity may contribute to accelerated liver fibrosis progression in HIV/HCV patients. J. Hepatol. 2013, 59, 427–433. [Google Scholar]
  36. Schwabe, R.F.; Siegmund, S.V. Potential role of CB2 receptors in cannabis smokers with chronic hepatitis C. Hepatology 2005, 42, 975–976; author reply 976–977. [Google Scholar] [CrossRef] [PubMed]
  37. Di Marzo, V. Targeting the endocannabinoid system: To enhance or reduce? Nat. Rev. Drug Discov. 2008, 7, 438–455. [Google Scholar] [CrossRef] [PubMed]
  38. Cao, Z.; Mulvihill, M.M.; Mukhopadhyay, P.; Xu, H.; Erdelyi, K.; Hao, E.; Holovac, E.; Hasko, G.; Cravatt, B.F.; Nomura, D.K.; et al. Monoacylglycerol lipase controls endocannabinoid and eicosanoid signaling and hepatic injury in mice. Gastroenterology 2013, 144, 808–817. [Google Scholar]
  39. Von Schonfels, W.; Patsenker, E.; Fahrner, R.; Itzel, T.; Hinrichsen, H.; Brosch, M.; Erhart, W.; Gruodyte, A.; Vollnberg, B.; Richter, K.; et al. Metabolomic tissue signature in human non-alcoholic fatty liver disease identifies protective candidate metabolites. Liver Int. 2014, 35, 207–214. [Google Scholar]
  40. Semmo, N.; Krashias, G.; Willberg, C.; Klenerman, P. Analysis of the relationship between cytokine secretion and proliferative capacity in hepatitis C virus infection. J. Viral Hepat. 2007, 14, 492–502. [Google Scholar] [CrossRef] [PubMed]
  41. Chicca, A.; Marazzi, J.; Nicolussi, S.; Gertsch, J. Evidence for bidirectional endocannabinoid transport across cell membranes. J. Biol. Chem. 2012, 287, 34660–34682. [Google Scholar] [CrossRef] [PubMed]
  42. Patsenker, E.; Popov, Y.; Stickel, F.; Jonczyk, A.; Goodman, S.L.; Schuppan, D. Inhibition of integrin αvβ6 on cholangiocytes blocks transforming growth factor-β activation and retards biliary fibrosis progression. Gastroenterology 2008, 135, 660–670. [Google Scholar] [CrossRef] [PubMed]
  43. Semmo, N.; Barnes, E.; Taylor, C.; Kurtz, J.; Harcourt, G.; Smith, N.; Klenerman, P. T-cell responses and previous exposure to hepatitis c virus in indeterminate blood donors. Lancet 2005, 365, 327–329. [Google Scholar] [CrossRef] [PubMed]
  44. Semmo, N.; Day, C.L.; Ward, S.M.; Lucas, M.; Harcourt, G.; Loughry, A.; Klenerman, P. Preferential loss of IL-2-secreting CD4+ T helper cells in chronic HCV infection. Hepatology 2005, 41, 1019–1028. [Google Scholar] [CrossRef] [PubMed]

