Abstract
The identification of genes under positive selection is a central goal of evolutionary biology. Many legume species, including Phaseolus vulgaris (common bean) and Phaseolus lunatus (lima bean), have important ecological and economic value. In this study, we sequenced and assembled the transcriptome of one Phaseolus species, lima bean. A comparison with the genomes of six other legume species, including the common bean, Medicago, lotus, soybean, chickpea, and pigeonpea, revealed 15 and 4 orthologous groups with signatures of positive selection among the two Phaseolus species and among the seven legume species, respectively. Characterization of these positively selected genes using Non redundant (nr) annotation, gene ontology (GO) classification, GO term enrichment and Kyoto Encyclopedia of Genes and Genomes (KEGG) pathway analyses revealed that these genes are mostly involved in thylakoids, photosynthesis and metabolism. This study identified genes that may be related to the divergence of the Phaseolus and legume species. These detected genes are particularly good candidates for subsequent functional studies.
1. Introduction
The discovery of genes that are influenced by natural selection is a central goal of evolutionary biology. One widely used method for inferring the targets of positive Darwinian selection is to test the ratio, numbers, and patterns of nonsynonymous and synonymous substitutions in homologous protein coding regions. This approach has been widely employed to infer the selection of single genes and functional classes of genes, including on a genome-wide scale [1,2,3,4,5,6,7].
The substitution ratio (ka/ks value, ω) between non-synonymous (ka) and synonymous (ks) substitutions per site is often used to identify evidence for adaptive evolution [8,9]. Generally, ω > 1 is interpreted as an indicator for positive selection, ω < 1 indicates purifying selection, and ω = 1 suggests neutral evolution.
Understanding the adaptive evolution of species has long been limited by the lack of genome sequences. In recent years, advances in next-generation sequencing have made it possible to identify positively selected genes using more extensively sampled species. For example, Backstrom et al. [6] identified genes of house finch undergoing positive selection in passerine birds using house finch transcriptome data. Zhang et al. [3] compared orthologous groups (OGs) between two bamboo species and 14 grass species and identified genes that showed putatively positive selection by combined analysis of transcriptomic and genomic data. They found that the positively selected genes were distributed among several functional classes and include genes involved in biotic and abiotic stress response, reproduction and development and plant metabolism [3]. Moreover, Xia et al. [10] detected 211 positively selected OGs between the tea tree species C. oleifera and C. sinensis by comparative transcriptomics. These OGs were found to be mainly involved in oxidation-reduction processes, integral to the membrane and ATP binding [10]. Because few studies have conducted positive selection analysis using plant genomic datasets [3,11,12], this type of knowledge is still limited in legumes, particularly in Phaseolus.
Legumes play a critical role in maintaining ecosystem nitrogen cycling. Several legume species are precious resources for the production of fibre, bioenergy, medicine and chemicals. Legumes are also regarded as a model for plant biology study [13]. Although they have important ecological and economic value, the evidence of positive selection among the legumes is still not well understood. The genomes of six legume species, barrel medic (Medicago truncatula), birds foot trefoil (Lotus japonicus), soybean (Glycine max), chickpea (Cicer arietinum), pigeonpea (Cajanus cajan) and common bean (Phaseolus vulgaris), have been sequenced [14,15,16,17,18,19]. These sequencing projects provide us with an opportunity to look for evidence of positive selection in Phaseolus and legumes.
Originating in Central and South America, lima bean is the second most important food legume of Phaseolus after the common bean [20]. Lima bean has been cultivated in the Neotropics for at least 6000 years [21], and it is now cultivated in all tropical regions of the world with high genetic diversity and yield potential [22]. Although both common bean and lima bean originated in Neotropical areas, they have evolved in different ecological zones. The common bean has evolved at higher altitudes than the lima bean. It is likely that natural selection under different ecological environments has driven the evolution of both common bean and lima bean and their divergence. However, the genetic basis of their divergence and their environment adaptation remains unknown.
The genome sequence of lima bean is not yet available. In this study, we sequenced and assembled the transcriptome of lima bean. To identify genes possibly related to the divergence and environmental adaptation of Phaseolus, we compared OGs between lima bean and common bean and identified genes subject to positive selection. Following this, we took a broader approach and compared OGs among seven legume species, Medicago, lotus, soybean, chickpea, pigeonpea, common bean and lima bean, and identified positively selected genes in legumes. The genes identified in this study as most likely being under positive selection are good candidates for subsequent functional studies.
2. Results
2.1. Transcriptome Sequencing and De Novo Assembly of the Lima Bean Transcriptome
Four cDNA libraries were prepared and sequenced from samples of lima bean. After filtering out low-quality and adapter sequences from 24.45 Gb of raw sequence data, there were approximately 248.53 million clean reads remaining for transcriptomic analysis with 98.84% Q20 bases (Table S1). These clean reads were assembled de novo by the Trinity method [23], which led to 96,248 unigenes spanning a total of 87.12 Mb of sequence. The mean length and N50 of the final all-unigene set were 949 and 1795 bp, respectively. An overview of the assembly results is shown in Table 1.

Table 1.
Statistics of unigenes of lima bean transcripts obtained from assembly
| Assembly | Statistics |
|---|---|
| Number of unigenes | 96,248 |
| Large unigenes (≥1000 bp) | 29,556 |
| Max unigene length (bp) | 20,020 |
| Mean unigene length (bp) | 949 |
| N50 length (bp) | 1795 |
| Total bases (MB) | 87.12 |
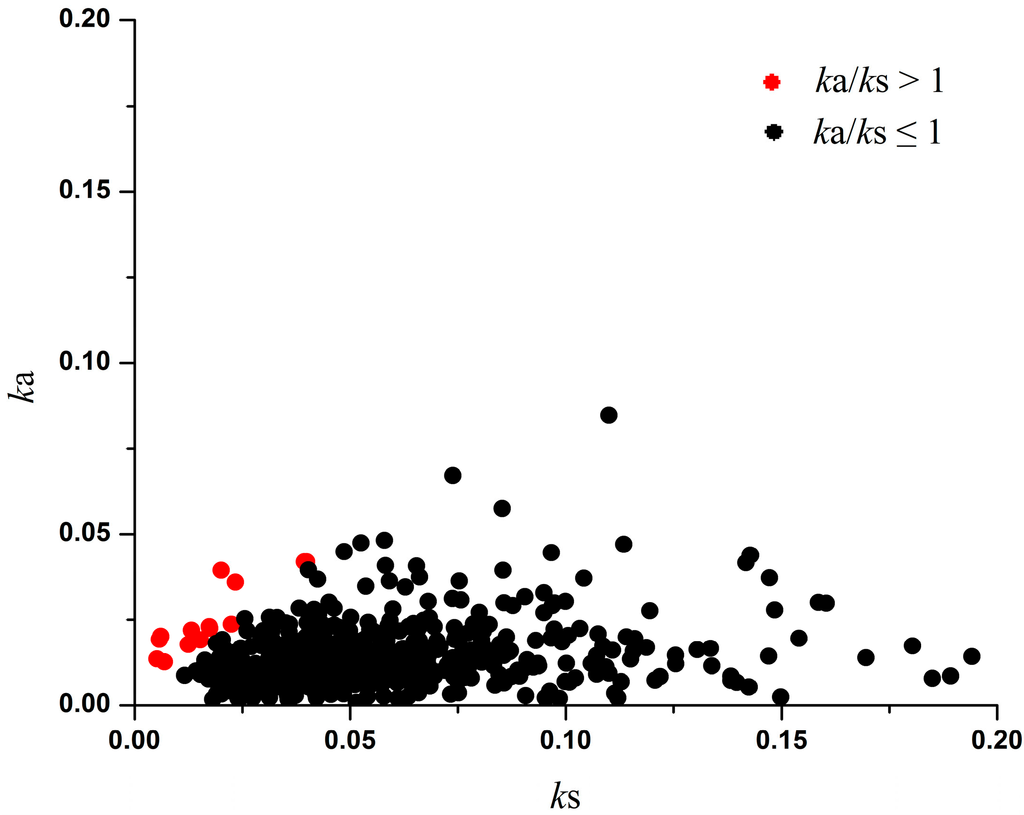
Figure 1.
Distribution of ka and ks in 550 P. vulgaris–P. lunatus OGs. The threshold of ka/ks = 1 indicates positive selection. The analysis was performed using the Yang and Nielsen method [24].
Figure 1.
Distribution of ka and ks in 550 P. vulgaris–P. lunatus OGs. The threshold of ka/ks = 1 indicates positive selection. The analysis was performed using the Yang and Nielsen method [24].
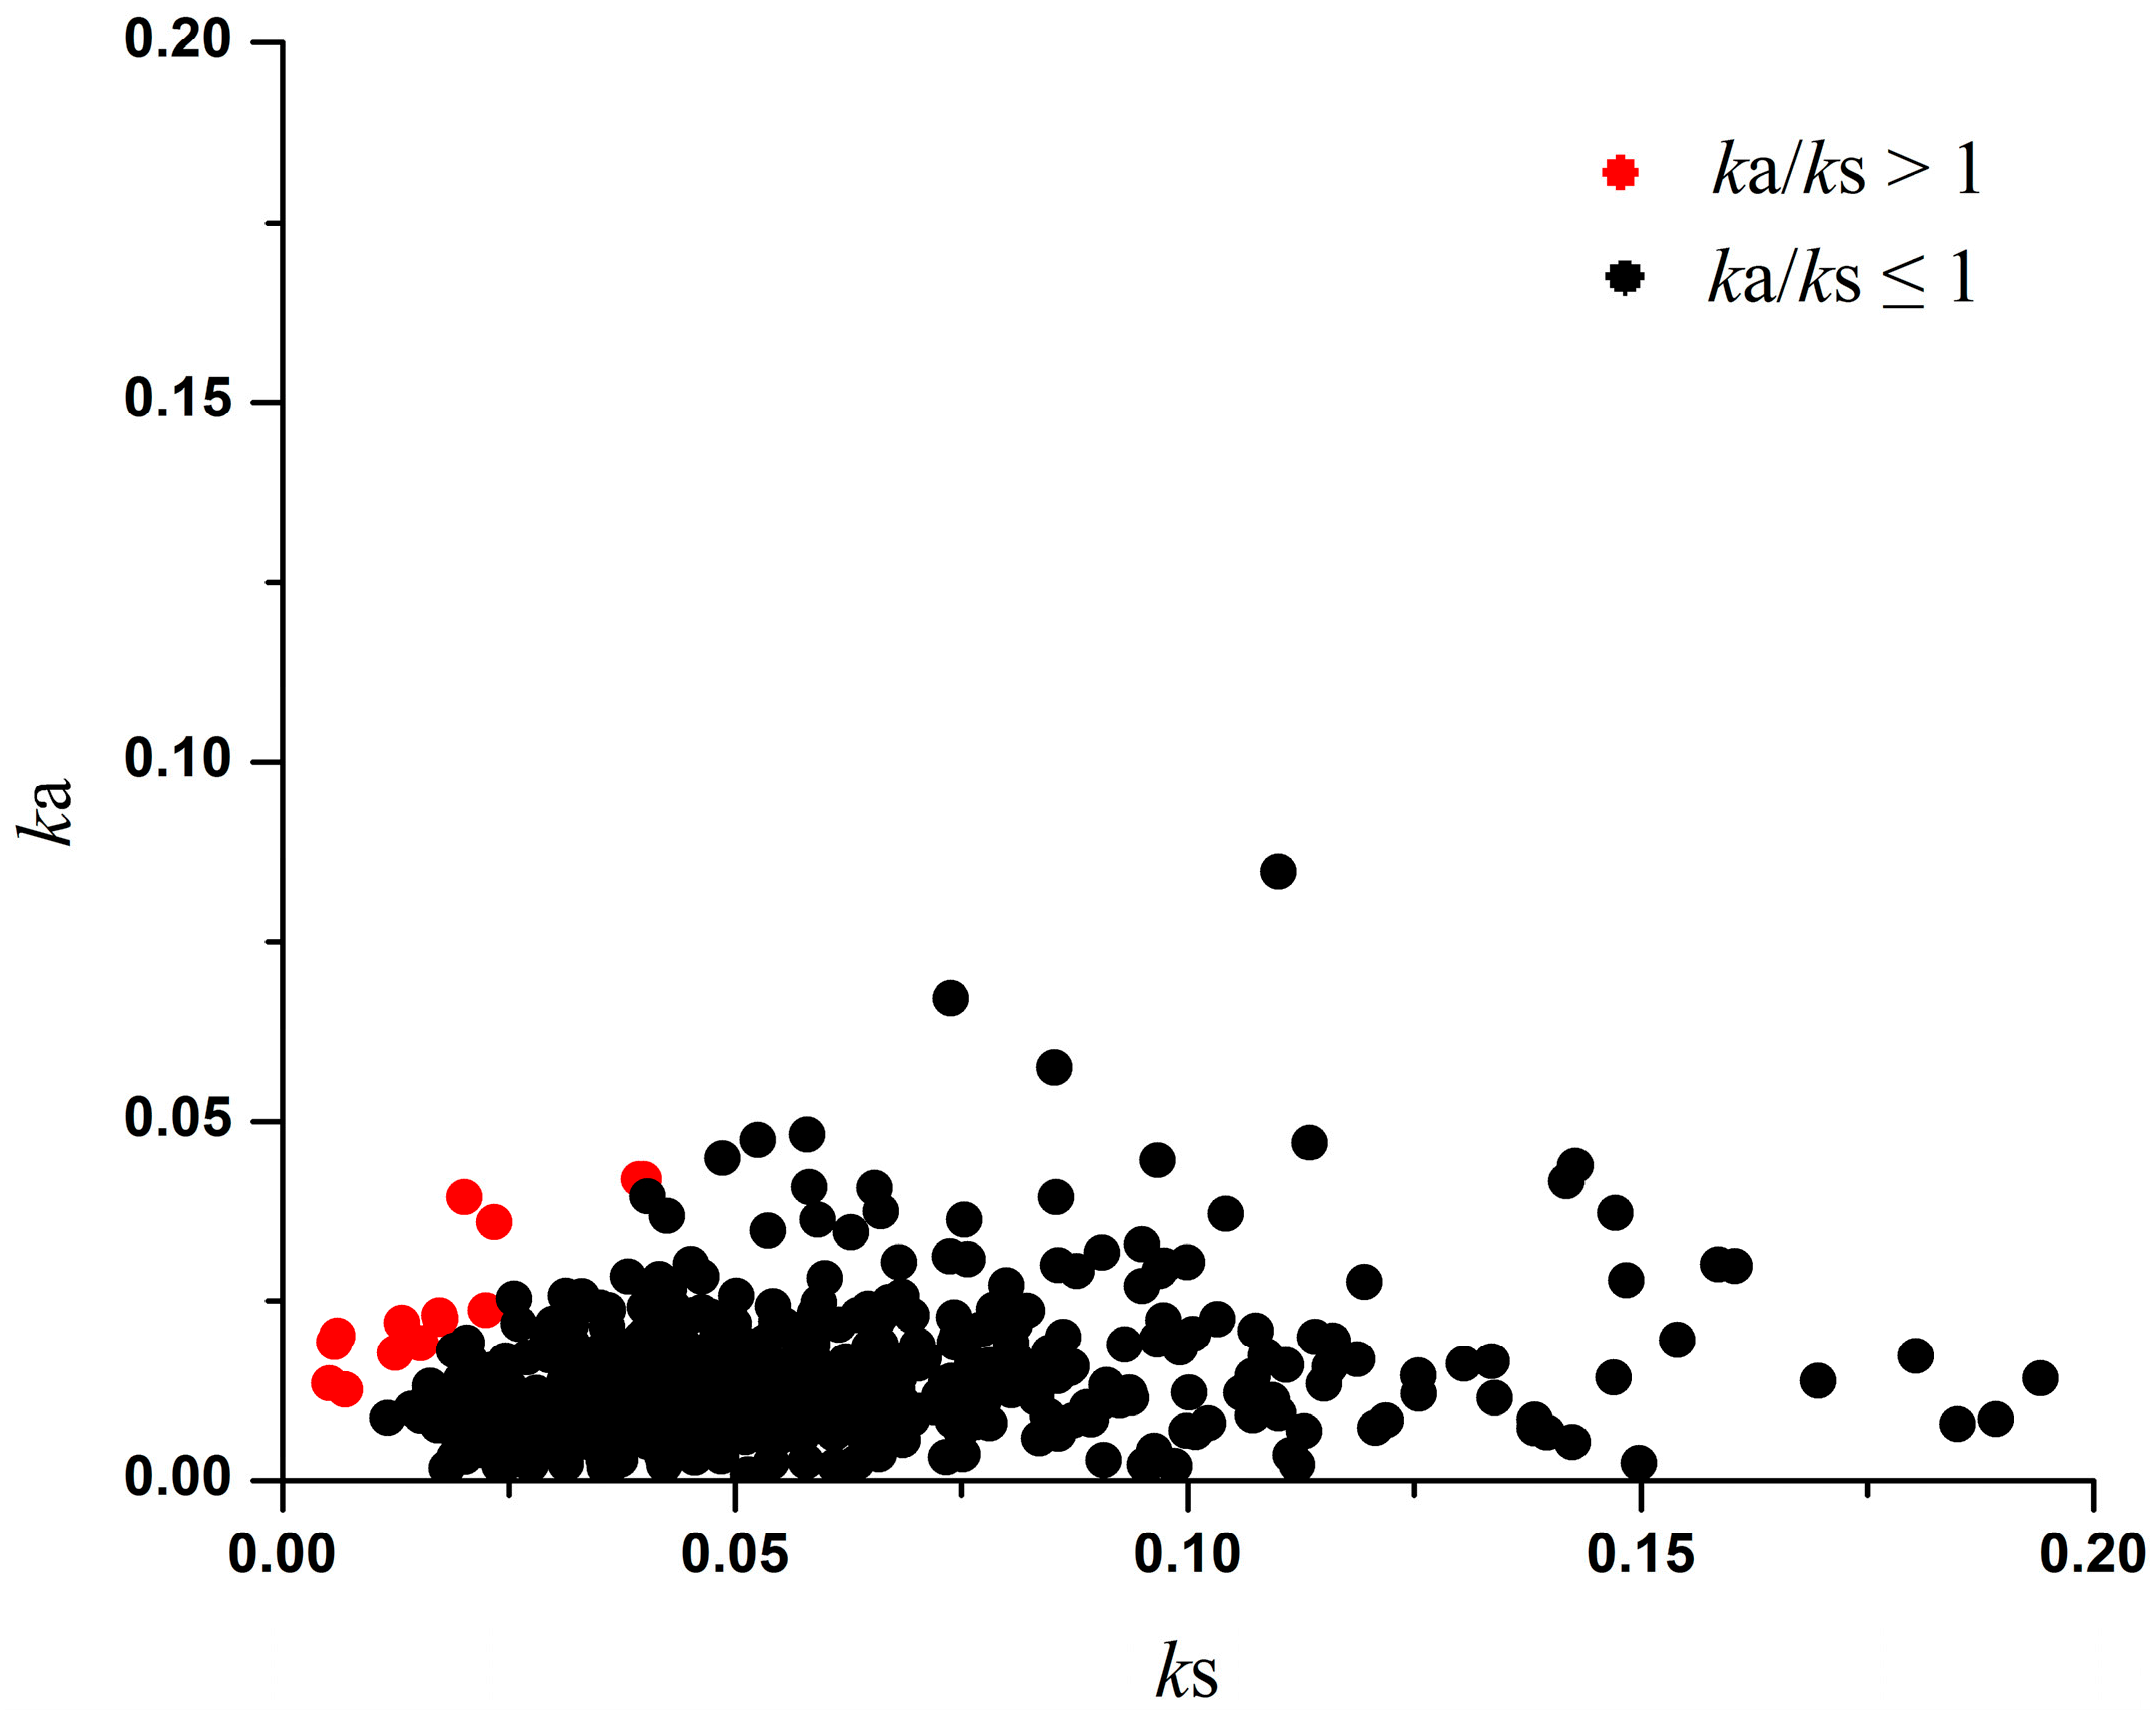
Table 2.
Site Models for positively selected genes in seven legume species.
| OGs_ID | M1a vs. M2a | Sites a | M7 vs. M8 | Sites a | Protein Function | ||
|---|---|---|---|---|---|---|---|
| LRT | p (fdr) | LRT | p (fdr) | ||||
| OG_9805 | 9.03 × 10⁻⁸ | 1.72 × 10⁻⁶ | 62N 89I 96L 128F 138Q | 6.00 × 10⁻¹² | 1.49 × 10⁻¹⁰ | 62N 89I 96L 128F 138Q | Alanine-tRNA ligase |
| OG_9947 | 4.66 × 10⁻⁴ | 0.004 | 320V 483Q | 1.62 × 10⁻⁴ | 0.0013 | 320V 480S 483Q | Ceramide synthase lag1 |
| OG_10941 | 0.005 | 0.021 | 21G | 0.001 | 0.004 | 21G | Acyl-CoA N-acyltransferase-like protein |
| OG_10618 | 0.011 | 0.035 | 75W 106F | 0.003 | 0.0074 | 75W 106F | Pollen Ole e 1 allergen and extension family protein |
| OG_9713 | 0.006 | 0.021 | NS b | 2.28 × 10⁻⁴ | 0.0014 | 92I 177V | Mitochondrial inner membrane translocase, subunit tim44-related protein |
| OG_10037 | 0.003 | 0.019 | NS | 7.34 × 10⁻⁴ | 0.0028 | 17P 127M | Bromodomain transcription factor |
| OG_10186 | 0.022 | 0.058 | 379 A | 8.80 × 10⁻⁵ | 0.0011 | 310V 348K 379A 516S | 2,3-Bisphosphoglycerate-independent, phosphoglycerate mutase |
| OG_10467 | 0.024 | 0.058 | 32 G | 0.01 | 0.016 | 32G | Uncharacterized protein |
| OG_10095 | 0.212 | 0.287 | NS | 0.021 | 0.0298 | 100S | Hnh endonuclease |
| OG_10235 | 0.030 | 0.062 | NS | 6.88 × 10⁻⁴ | 0.0028 | 243D 291H | Golgin candidate 2 |
| OG_10350 | 0.054 | 0.085 | NS | 0.009 | 0.0155 | 180F | Pentatricopeptide repeat-containing protein |
| OG_10623 | 0.270 | 0.342 | NS | 0.006 | 0.0112 | 98P | Dessication-induced 1voc-like protein |
| OG_10631 | 1.000 | 1.000 | NS | 0.013 | 0.0191 | 323A | Endoribonuclease dicer-like 2 |
| OG_10744 | 1.000 | 1.000 | NS | 0.004 | 0.008 | 489L | Transmembrane amino acid transporter family protein |
| OG_9360 | 1.000 | 1.000 | NS | 0.005 | 0.0106 | 772N | Pseudouridine synthase family protein |
| OG_9471 | 0.033 | 0.062 | NS | 0.002 | 0.004 | 28R | DnaJ domain-containing protein |
| OG_9474 | 0.432 | 0.513 | NS | 0.026 | 0.0352 | 309I 327I | Cation calcium exchanger 5 |
| OG_9589 | 0.042 | 0.073 | NS | 8.14 × 10⁻⁴ | 0.0028 | 797D | Histone-lysine N-methyltransferase, H3 lysine-9 specific SUVH4 |
| OG_9889 | 0.100 | 0.147 | NS | 0.039 | 0.0492 | 53M | Uncharacterized protein |
a When p values of LRT and FDR were below 0.05, positively selected sites were estimated by BEB (BEB value > 95%).; b NS, not significant.
2.2. Orthologous Groups among Legume Species and Evolutionary Analysis
Using OrthoMCL5 and HaMStR v13.2.3 with relatively strict filters (-representative, -strict, -eval_limit = 0.00001, -rbh), we identified 550 OGs between Phaseolus species (lima bean and common bean) and 413 OGs among the seven legume species.
We performed maximum likelihood analyses of ka and ks to identify genes that evolved under positive selection in the 550 OGs from the two Phaseolus species. Of these genes, 15 OGs have ka/ks > 1 and 535 OGs have ka/ks < 1 (Figure 1 and Table S2). According to previous reports [10,24], ka/ks above 1 indicates a sign of positive selection, and ka/ks below 1 suggests negative selection.
We also used site models to identify positively selected amino acid sites in the protein coding sequences based on the 413 OGs across seven species in the legume family. In total, we identified four OGs with sites under positive selection by likelihood-ratio tests (LRT), false discovery rate (FDR) and Bayes empirical Bayes (BEB) analyses in both models M1a–M2a and M7–M8 (Table 2 and Table S3). In addition, 13 OGs were subjected to positive selection in the LRT, FDR and BEB analyses of models M7–M8.

Figure 2.
GO classifications for 550 OGs of P. vulgaris–P. lunatus
Figure 2.
GO classifications for 550 OGs of P. vulgaris–P. lunatus
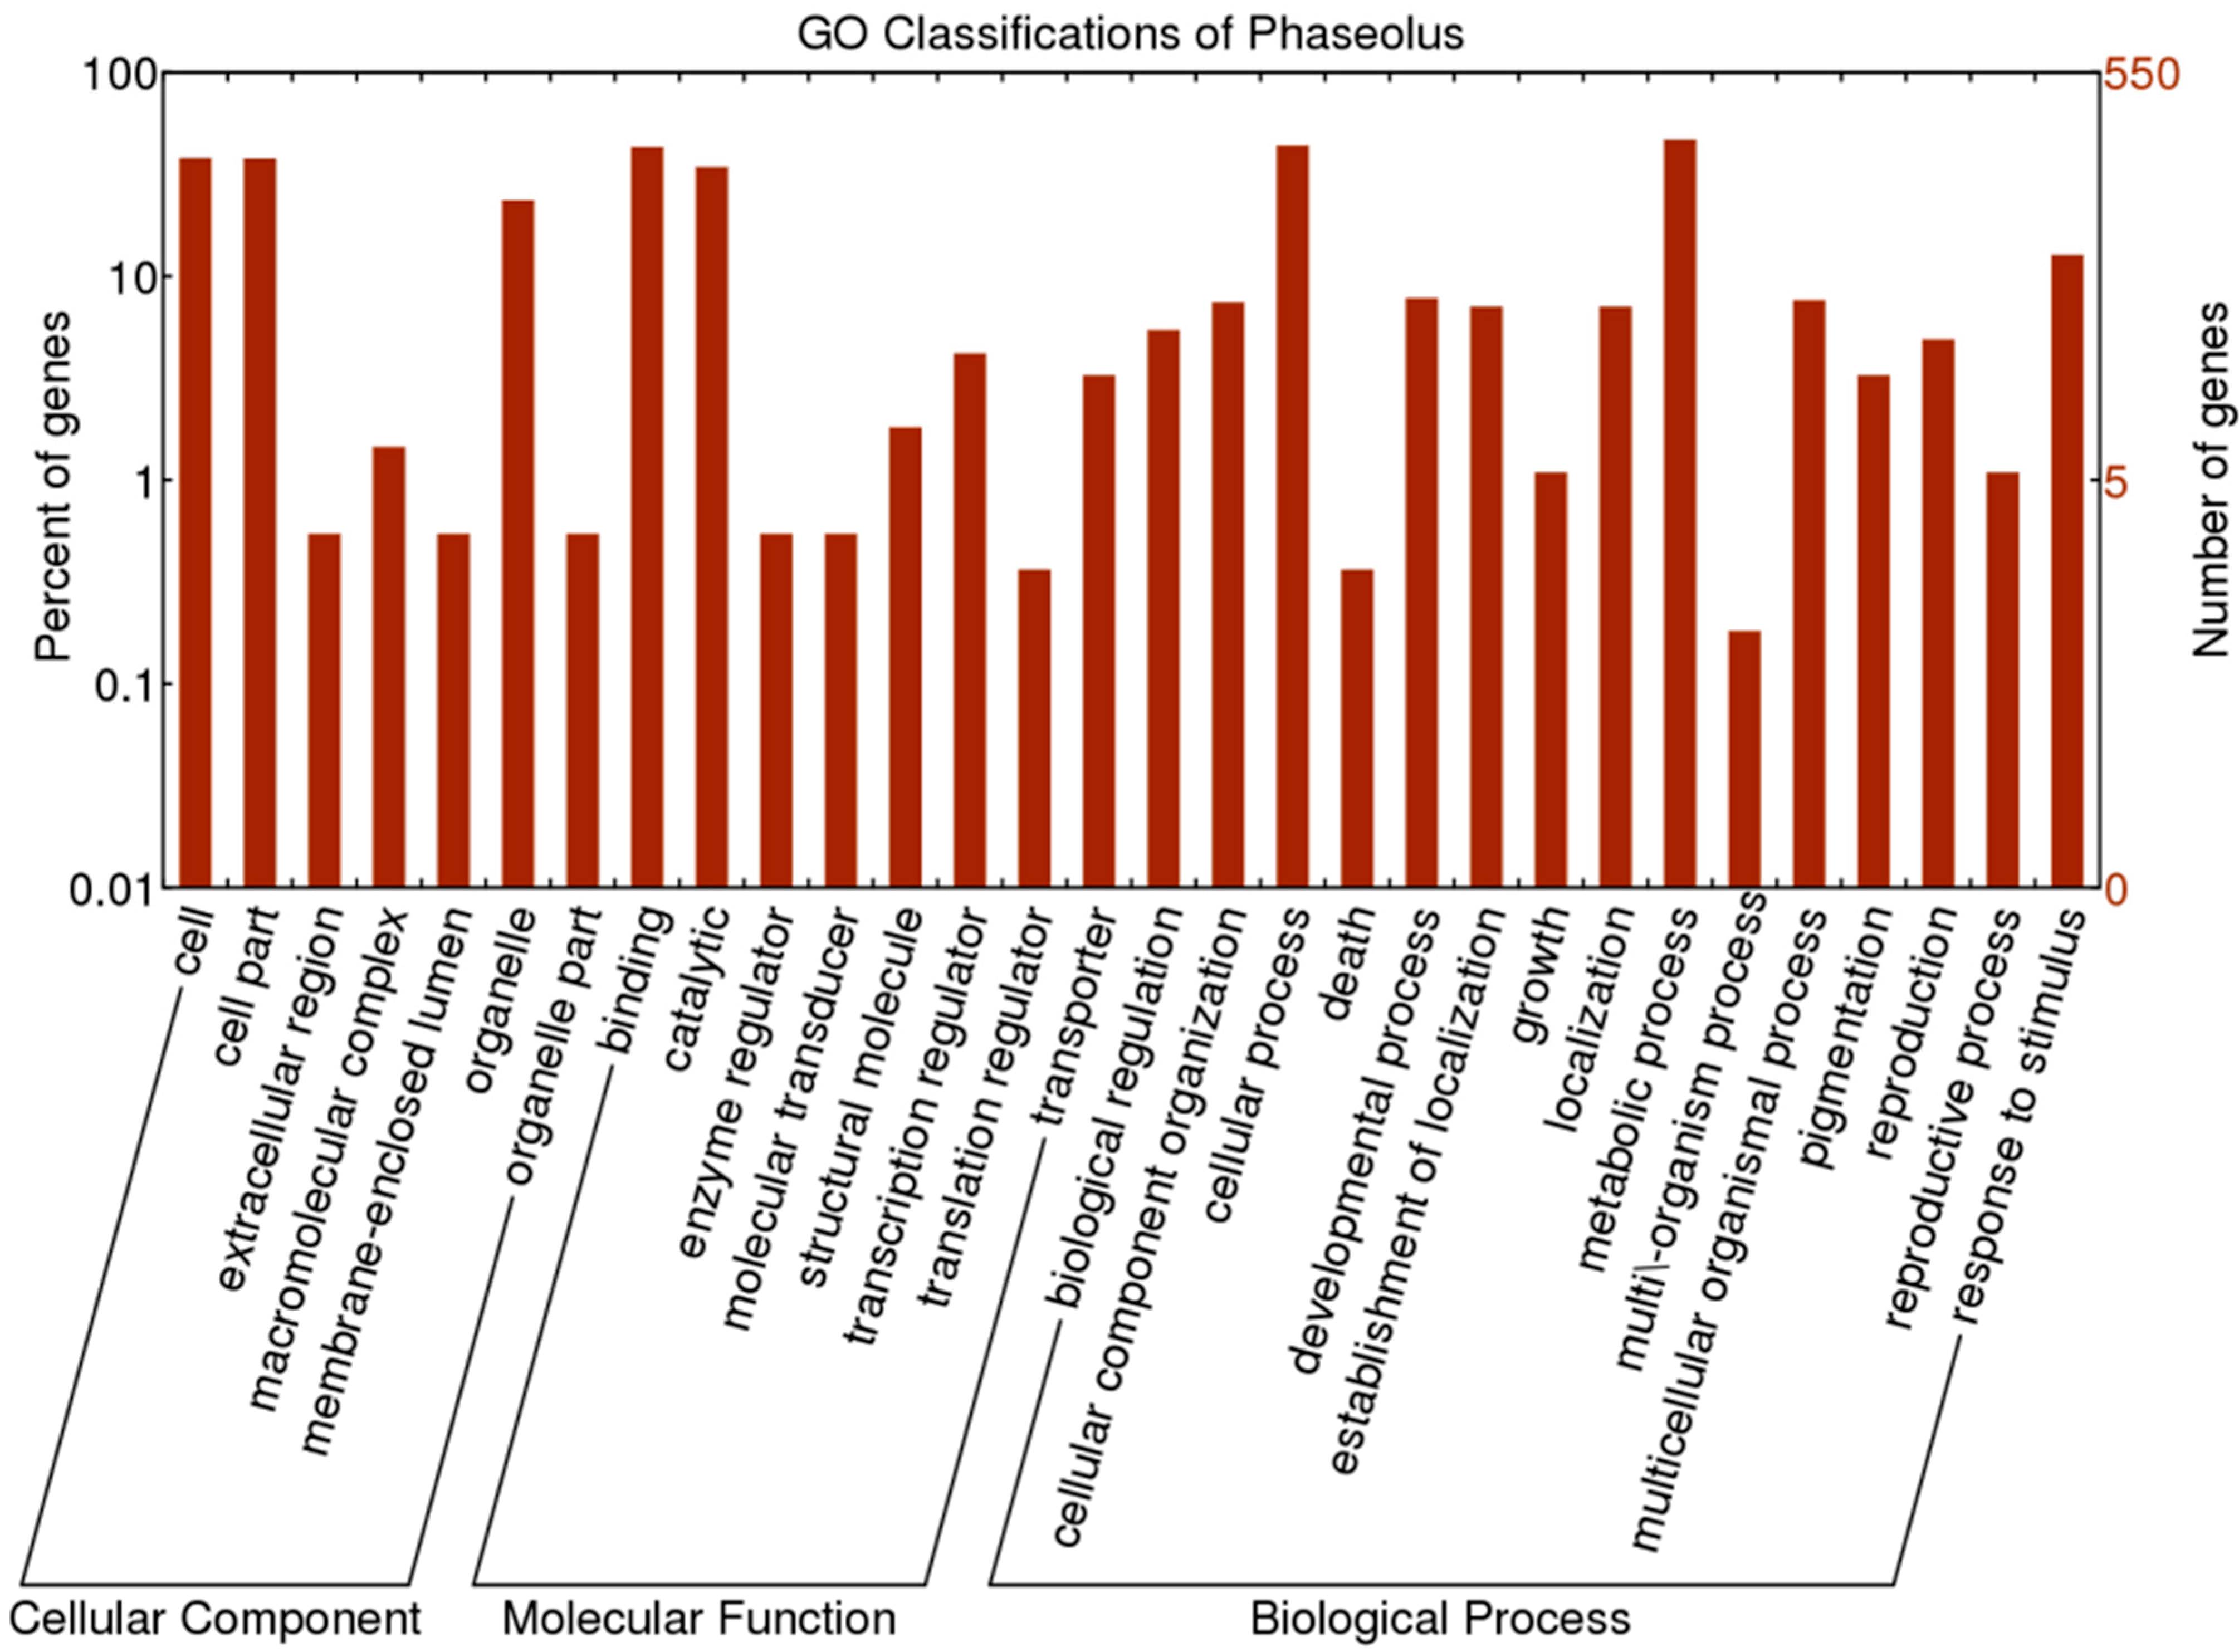
Table 3.
The Over-Represented GO terms enriched in the test dataset compared with the reference dataset.
| Gene Class | GO ID | GO Term | FWER | p (Fisher’s Exact Test) | Frequency a in Test Set | Frequency in Reference Set |
|---|---|---|---|---|---|---|
| Positive OGs between Phaseolus | GO:0009579 | Thylakoid | 0.012326 | 0.001462 | 3/15 | 11/422 |
| Positive OGs between Phaseolus | GO:0015979 | Photosynthesis | 0.174733 | 0.018151 | 2/15 | 10/422 |
| Positive OGs between Phaseolus | GO:0006091 | Generation of precursor metabolites and energy | 0.272852 | 0.0280331 | 2/15 | 13/422 |
| Positive OGs among legumes | GO:0016746 | Transferring acyl groups | 0.0350915 | 0.00329338 | 2/4 | 8/400 |
a The number of times the term was found/the number of OGs that were in the set.
2.3. Functional Categories
Through the use of non redundant (nr) annotation, gene ontology (GO) classification, GO term enrichment and Kyoto Encyclopedia of Genes and Genomes (KEGG) pathway analysis, we investigated the functional classifications for all OGs. Within 550 one-to-one OGs between the two Phaseolus species, protein function for each ortholog was annotated using BLASTX against the NCBI-nr protein database (Table S2). Of the 15 OGs with positive selection (ω > 1), six were related to stress response and photosynthesis, including “cold-regulated 413-plasma membrane 2”, “Seven transmembrane MLO family protein”, “Thioredoxin superfamily protein”, “photosystem I light harvesting complex gene 5 (Lhc5)”, “NAD(P)H dehydrogenase 18 (NDH18)”, and “PsbQ-like 2 (PQL2)”.
For GO annotation of the 550 one-to-one OGs, there were 422 OGs classified into 32 GO terms (Figure 2 and Table S2). Among the 15 positively selected OGs, seven were mainly involved in “cell part” within cellular component category, seven were mainly related to “cellular process” and “metabolic process” within the biological process category, and six were mainly involved in “binding” within the biological process category (Table S2).
Using the 550 OGs as the reference dataset, we detected three GO terms including ‘thylakoid’, “photosynthesis” and “generation of precursor metabolites and energy” that were over-represented using Fisher’s exact test (FWER < 0.27) among the 15 OGs subject to positive selection (ω > 1) at the 0.05 level (Table 3). These three enriched GO terms involve three OGs, Lhc5 (OG_22685), NDH18 (OG_23367), and PQL2 (OG_23464), respectively (Table S2).
The biochemical pathways of all 550 OGs were investigated using KAAS (KEGG Automatic Annotation Server, http://www.genome.jp/tools/kaas/). According to the results of the KEGG pathway mapping, 139 of the 550 one-to-one OGs could be assigned to 81 pathways. Among these pathways, “Biosynthesis of amino acid”, “Spliceosome”, and “RNA degradation” exhibited the highest number of assigned OGs (Table S4). Among the 15 OGs under positive selection (ω > 1), four were associated with “Photosynthesis”, “Purine metabolism”, and “Pyrimidine metabolism” (Table S4), although they are not statistically significant over-representation (data not shown).
Similar analyses were also applied to the 413 one-to-one OGs in the seven legume species. We found that both models identified the proteins of four OGs as carrying positively selected amino acid sites. They include “alanine-tRNA ligase (OG_9805)”, “ceramide synthase lag1 (OG_9947)”, “acyl-CoA N-acyltransferase-like protein (OG_10941)” and “pollen ole e 1 allergen and extensin family protein (OG_10618)” (Table 2 and Table S3).
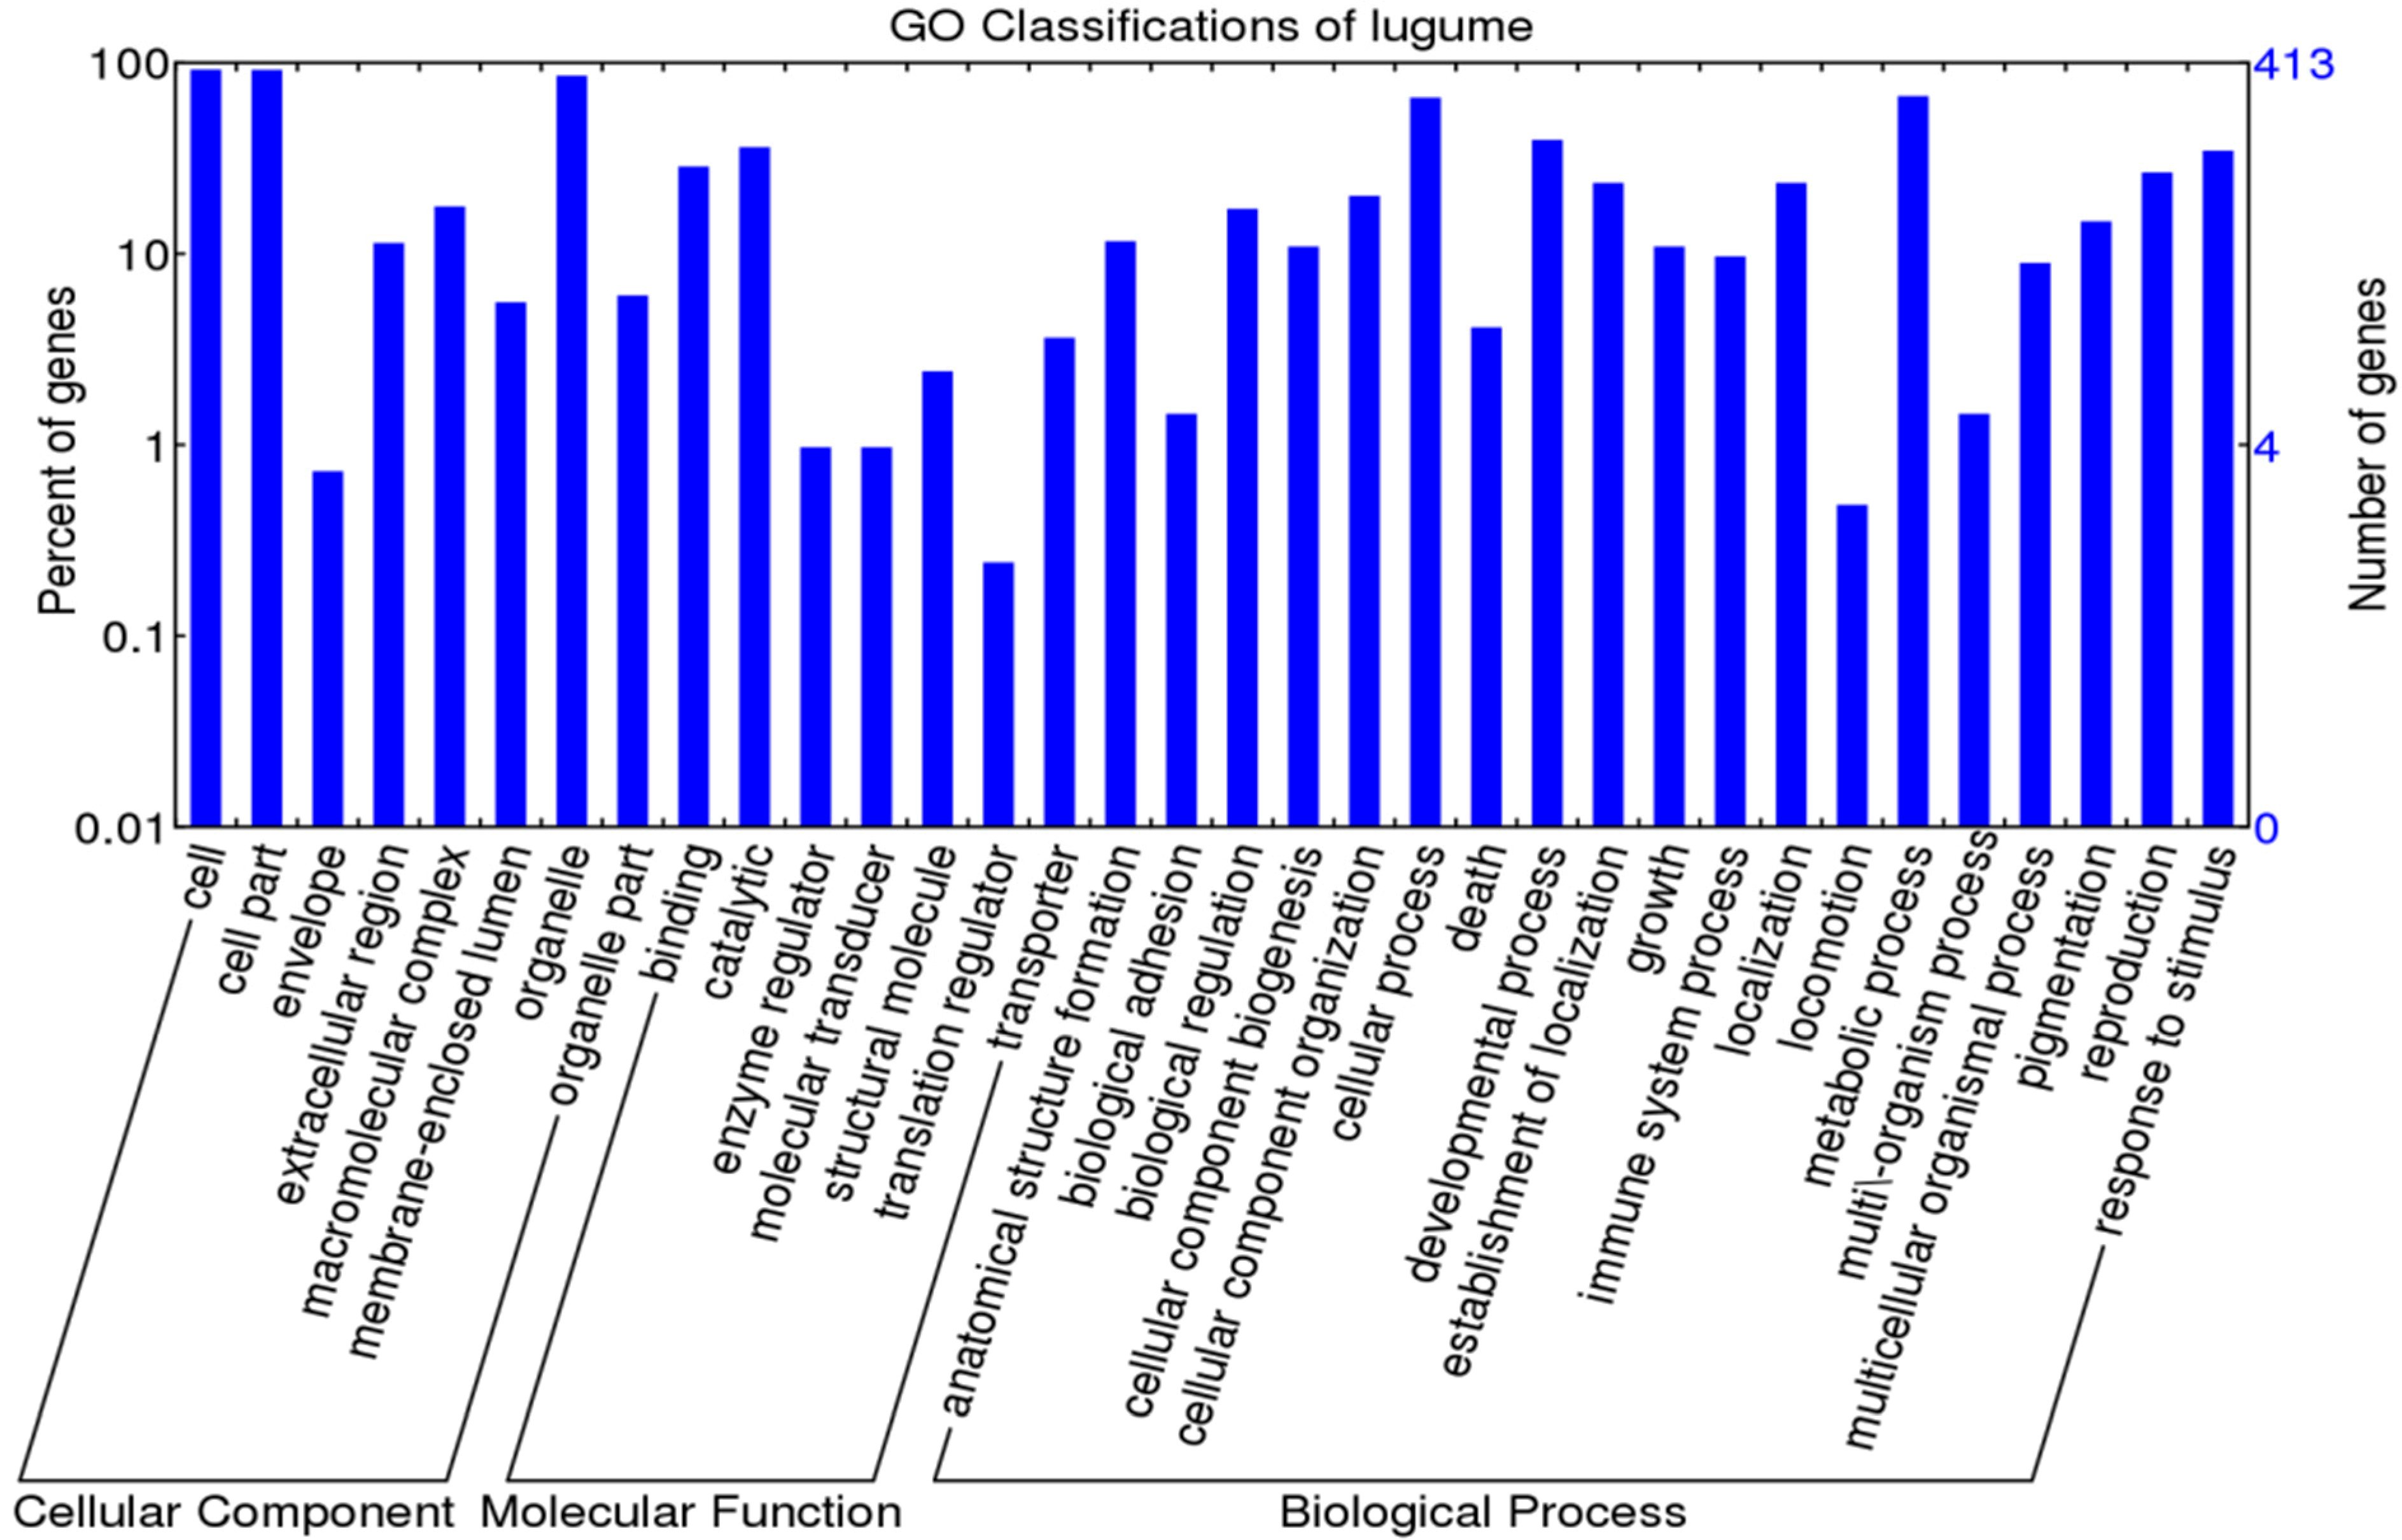
Among the 413 one-to-one OGs, a total of 400 OGs were assigned to 36 GO terms (Figure 3 and Table S5). For cellular components, four OGs with positively selected sites were related to “cell part”, “organelle” and “extracellular region”. Regarding molecular functions, these four OGs were related to “ion binding”, “ligase activity” and ‘transferase activity”. As for biological processes, “biosynthetic process”, “primary metabolic process”, “cellular metabolic process”, and “nitrogen compound metabolic process” were mostly enriched (Figure 3 and Table S5). After GO enrichment analysis and a Fisher’s exact test and family wise error rate (FWER) test, the only over-represented term for the four OGs carrying adaptive selected sites was transferring acyl groups (GO:0016746) (Table 3). Two genes including “acyl-CoA N-acyltransferase-like protein (OG_10941)” and “ceramide synthase lag1 (OG_9947)” are involved in this term (Table S5).

Figure 3.
GO classification for 413 OGs of legumes.
Figure 3.
GO classification for 413 OGs of legumes.
KEGG Automatic Annotation Server (KAAS) predicted a total of 98 pathways for the 413 OGs with “Biosynthesis of amino acids”, “Carbon metabolism”, and “Spliceosome” occupying the highest number of assigned OGs (Table S6). For the four OGs carrying sites under positive selection in legumes, one metabolite pathway was associated with “aminoacyl-tRNA biosynthesis” (Table S6).
3. Discussion
3.1. Transcriptome of Lima Bean
With the advent of high-throughput next generation sequencing technologies, studies based on genomic and transcriptomic data for non-model organisms have been increasingly reported [2,3,6,10,25,26,27,28,29]. In this study, we de novo assembled lima bean RNA-Seq short reads into a hundred thousand unigenes. RNA-Seq is a cost-effective method for characterizing the transcriptome of non-model species [30], and it provided us an effective tool for exploring complex plant evolutionary biology.
3.2. Candidate Adaptive Evolution Genes between Lima Bean and Common Bean
As mentioned previously, the ka/ks ratio is an important index of Darwinian selection. The larger the ka/ks ratio is, the stronger is the positive selection. In our present evolutionary analysis between two Phaseolus species, most of the OGs (97.3%; 535/550) had a ka/ks ratio < 1, and this indicates that the majority of OGs were under negative selection (Figure 1). However, we also detected three OGs undergoing adaptive evolution with ka/ks ratios above 2 and 12 OGs with ratios above 1 (Figure 1 and Table S2).
According to the GO enrichment tests, three positively selected OGs, Lhc5, NDH18, and PQL2 were related to three enriched GO terms, “thylakoid”, “photosynthesis” and “generation of precursor metabolites and energy” between the two Phaseolus species (Table S2). Lhc5, NDH18 and PQL2 code for parts of subunits of the chloroplast NAD(P)H dehydrogenase (NDH) complex in photosynthesis [31]. Photosynthesis is the most intricate and fundamental physiological process in higher plants, which have developed adaptive mechanisms conferring tolerance to abiotic stresses in the photosynthesis system [32]. PQL has been detected to be under positive selection in homologous pairs of Arabidopsis [33]. According to a previous report [34], although lima bean and common bean both originated in tropical and sub-tropical latitudes, they have evolved in different ecological zones; lima bean has evolved at lower altitudes and the common bean at intermediate altitudes. It is likely that the selection pressure of these photosystem-related genes might reflect plant adaptations to different environments.
In addition, a number of OGs under positive selection (ω > 1) between the Phaseolus species are involved in resistance to biotic or abiotic stresses. “OG_23307” was identified as under positive selection in the Phaseolus species, and it encodes “cold-regulated 413-plasma membrane 2 (COR413-PM)” (Table S2). In plant development of cold tolerance, the COR413-PM protein plays a vital role by stabilizing the plasma membrane [35]. This gene has been detected as under positive selection in two bamboo species [3]. “OG_23031” also exhibited positive selection between the two species. This gene encodes “Seven transmembrane MLO family protein” (Table S2). The MLO gene family plays an important role in modulating defence responses and cell death during powdery mildew attack [36,37]. In the evolutionary process, many plants fix favourable mutations to enhance their adaptation ability to various biotic and abiotic stresses including pests, pathogens and environmental signals.
3.3. Candidate Adaptive Evolution Genes among Seven Legume Species
For the seven legume species, we found that four OGs were identified by both models M1a–M2a and M7–M8, and 13 OGs were determined only by models M7–M8. It is possible that the LRT M1a–M2a model was more robust than M7–M8 [5,38].
The GO enrichment analyses revealed that genes related to transferring acyl groups including acyl-CoA N-acyltransferase-like protein (OG_10941) and ceramide synthase lag1 (OG_9947) were probably enriched in legume species (Table 3 and Table S3). The ortholog (OG_10941) encodes an acyl-CoA N-acyltransferase-like (Nat) protein. The A. thaliana gene (AT1G18335.1) in this OG is Naa40p (Nat 4), which is one of the Nat catalytic subunit isoforms [39,40]. The function of this protein has not been explored in plants. According to studies in humans and yeast [41], Nat 4 is responsible for the acetylation of the N-terminal residues of histones H4 and H2A. Protein N-terminal acetylation is a common covalent modification process of eukaryotic proteins. During evolution, NAT genes could have changed their substrate specificity to adapt to environmental stress. Sabbagh et al. [42] have detected positive selection in the NAT gene family during the last 85 million years of primate NAT gene evolution. Another OG (OG_9947) in this enriched term encodes ceramide synthase lag1. Ceramide is the fundamental unit of sphingolipids, which are lipid signalling molecules associated with plant innate immunity [28]. Sphingolipids are associated with plant programmed cell death and plant defence against disease [28]. The adaptive evolution of immune system genes has been detected in many plants [7,43].
Among two other adaptive OGs with sites that had undergone positive selection in seven legume species (Table 2 and Table S3), one OG, Pollen Ole e 1 allergen and extensin family protein (OG_10618), is involved in plant responses to biotic and abiotic stresses. From an evolutionary viewpoint, biotic and abiotic defence genes of plants undergo enhanced positive effects from natural selection under the stress of pathogens, insects and environmental changes. Another OG “OG_9805” encodes alanine-tRNA ligase. The adaptive evolution of alanyl-tRNA synthetase has been reported previously [44].
4. Materials and Methods
4.1. Sample Collection, cDNA Library Construction, and Illumina Sequencing
The seeds of lima bean (P. lunatus cv. Sieva) were provided by Yanhui Lu, Institute of Plant Protection, Chinese Academy of Agricultural Sciences. Lima bean plants (P. lunatus cv. Sieva) were kept in a growth chamber (25 ± 2 °C, 50% to 70% R.H., 16L–8D). Two-week old plants’ primary leaves were treated with Tetranychus cinnabarinus and Alamethicin, which is a mixture of peptides from the fungus Trichoderma viride (Tetranychus cinnabarinus control, Tetranychus cinnabarinus damage, Alamethicin control, Alamethicin treatment), and the treatments were performed as previously described [45,46]. Samples were collected 24 h later for mRNA extraction. Total RNA was extracted using TRIzol reagent (Invitrogen, Darmstadt, Germany) and treated with RNase-free DNase (Promega, Mannheim, Germany) according to the manufacturer’s protocol. The cDNA library construction and Illumina paired-end sequencing were performed as previously described [29]. The clean Illumina RNA-Seq reads were deposited in the NCBI Sequence Read Archive (SRA, http://www.ncbi.nlm.nih.gov/Traces/sra); accession number SRX894594.
The raw reads were cleaned by removing the adapter sequences and low-quality sequences (containing reads with unknown nucleotides more than 5%, and Phred quality scores less than 20). The sequencing reads for each of the four samples were pooled to perform a single de novo transcriptome assembly by Trinity (v. 20140717) [23].
4.2. Identification of OGs and Alignment
We downloaded protein-coding and amino acid sequences for Medicago, lotus, soybean, chickpea, pigeonpea, and common bean from ftp://ftp.jcvi.org/pub/data/m_truncatula/Mt4.0/, ftp://ftp.Kazusa.or.jp/pub/lotus/lotus_r2.5/, ftp://ftp.jgi-psf.org/pub/JGI_data/phytozome/v10.0/Gmax/, http://www.ncbi.nlm.nih.gov/genome/?term=PRJNA175619, http://www.ncbi.nlm.nih.gov/bioproject/?term=PRJNA72815, and http://phytozome.jgi.doe.gov/pz/portal.html#; !info? alias=Org_Pvulgaris V1.0, respectively. Data for the out-group species (Arabidopsis thaliana) were acquired from ftp://ftp.arabidopsis.org/home/tair/Genes/TAIR10_genome_release/.
The OGs of the eight species were determined following the method of Zhao et al. [3]. Briefly, we assigned one-to-one core-orthologs from all “primer taxa” that consist of eight whole-proteome species including Medicago, lotus, soybean, chickpea, Pigeonpea, common bean and A. thaliana by OrthoMCL5 [47]. Then, one-to-one core-orthologs were put into HaMStRv13.2.3 [48] to search for the corresponding OG in the lima bean transcriptome data.
To filter possible paralogs, we searched pairs of sequences against protein sequences in GenBank, and then only those mapping to the identical protein with an E-value cutoff of 1 × 10⁻¹⁵ were assigned as OGs according to methods and criteria adopted in previous studies [10,25,27,49].
For each OG, The BLAST-Like Alignment Tool (BLAT) [50] was used to generate a pair-wise codon-based alignment, and then it was checked with MEGA6 [51] for further Phylogenetic Analysis by Maximum Likelihood (PAML) analysis [52]. We excluded alignments that were shorter than 90 bp from the data set to avoid introducing biases into the analysis due to the low number of substitutions in some genes.
4.3. Detection of Selection Analysis
We used the codeml programme under the F3 × 4 model of the PAML 4.7 package [52] to estimate positive selection OGs between the two Phaseolus species (lima bean and common bean) and across the seven legume species. To estimate selective pressure on the 550 OGs between lima bean and common bean, we performed pairwise maximum likelihood analysis with runmode to −2 and NSsites to 0 in PAML 4.7. According to previous studies [10,24], ω > 1, ω = 1 and ω < 1 suggest positive (adaptive) selection, neutral evolution and negative (purifying) selection, respectively.
To further test amino acid sites that had undergone positive selection, we performed site models using runmode 0 and four models, M1a (nearly neutral), M2a (positive selection), M7 (β) and M8 (β + ω) on the 413 OGs from seven legume species. LRT [38,53] were carried out to identify positive selection sites between M1a and M2a (2 d.f.) and between M7 and M8 (2 d.f.), which were then compared against the χ2 distribution. We next employed FDR to correct multiple testing by the Benjamini and Hochberg method [54]. When the LRT and FDR were significant (<0.05), BEB [55] was then used to examine amino acid sites under positive selection (BEB value > 95%). The tree of every OG used by the CodeML programme was built by maximum likelihood using RAxML-7.2.8-ALPHA.
4.4. Function Annotation
The A. thaliana ortholog of each OG was used to perform Gene Ontology (GO) and KEGG pathway annotation for all the OGs. Functional annotation of the unigenes were achieved by searching against the nr and Swiss-Prot databases using BLASTx with E-value < 1 × 10⁻⁵. The blast output was imported into Blast2GO for GO annotation [56,57]. WEGO software was then used [58] to perform GO functional classification for all the unigenes at the macro level. By setting the original OGs as the reference dataset and the positively selected genes as the test dataset, GO term enrichment between the reference and test datasets was determined using FWER. The analysis was performed by the GOSSIP software package [59]. KEGG pathway mapping was conducted on the Web of KAAS (http://www.genome.jp/tools/Kaas/).
5. Conclusions
In the current study, we observed 15 and four OGs with signatures of positive selection among 550 and 413 OGs in two Phaseolus species and seven legume species, respectively. Functional annotation of these positively selected genes revealed that they are mostly involved in thylakoids, photosynthesis and metabolism. These genes may be related to the divergence of the Phaseolus and legume species. The genes identified in this study as being under positive selection are particularly good candidates for subsequent functional and evolutionary studies. Several genes are interesting candidates to investigate for plant adaptation to biotic and abiotic stresses, and they could serve as gene pool for novel biotic and abiotic resistance that may enhance legume breeding programmes.
Supplementary Materials
Supplementary materials can be found at http://www.mdpi.com/1422-0067/16/07/15172/s1.
Acknowledgments
We thank Yanhui Lu (Institute of Plant Protection, Chinese Academy of Agricultural Sciences) for providing the lima bean seeds. This work was supported by International Science and Technology Cooperation Programme of China (2013DFG32230).
Authors’ Contributions
Guirong Wang designed the experiments; Fengqi Li and Yang Liu performed the transcriptome experiment, Fengqi Li and Depan Cao performed the evolutionary analysis; Fengqi Li wrote the paper; Ting Yang edited the paper for English language.
Conflicts of Interest
The authors declare no conflict of interest.
References
- Kosiol, C.; Vinar, T.; da Fonseca, R.; Hubisz, M.; Bustamante, C.; Schierup, M.H. Patterns of positive selection in six mammalian genomes. PLoS Genet. 2008, 4, e1000144. [Google Scholar] [CrossRef] [PubMed]
- Künstner, A.; Wolf, J.B.; Backström, N.; Whitney, O.; Balakrishnan, C.N.; Day, L.; Edwards, S.V.; Janes, D.E.; Schlinger, B.A.; Wilson, R.K. Comparative genomics based on massive parallel transcriptome sequencing reveals patterns of substitution and selection across 10 bird species. Mol. Ecol. 2010, 19, 266–276. [Google Scholar] [CrossRef] [PubMed]
- Zhao, L.; Zhang, N.; Ma, P.F.; Liu, Q.; Li, D.Z.; Guo, Z.H. Phylogenomic analyses of nuclear genes reveal the evolutionary relationships within the BEP clade and the evidence of positive selection in Poaceae. PLoS ONE 2013, 8, e64642. [Google Scholar] [CrossRef] [PubMed]
- Swanson, W.J.; Wong, A.; Wolfner, M.F.; Aquadro, C.F. Evolutionary expressed sequence tag analysis of Drosophila female reproductive tracts identifies genes subjected to positive selection. Genetics 2004, 168, 1457–1465. [Google Scholar] [CrossRef] [PubMed]
- Studer, R.A.; Robinson-Rechavi, M. Large-scale analyses of positive selection using codon models. In Evolutionary Biology; Springer Berlin Heidelberg: Berlin, Germany, 2009; pp. 217–235. [Google Scholar]
- Backström, N.; Zhang, Q.; Edwards, S.V. Evidence from a house finch (Haemorhous mexicanus) spleen transcriptome for adaptive evolution and biased gene conversion in passerine birds. Mol. Biol. Evol. 2013, 30, 1046–1050. [Google Scholar] [CrossRef] [PubMed]
- Roth, C.; Liberles, D.A. A systematic search for positive selection in higher plants (Embryophytes). BMC Plant Biol. 2006, 6, 12. [Google Scholar] [CrossRef] [PubMed]
- Hurst, L.D. The ka/ks ratio: Diagnosing the form of sequence evolution. Trends Genet. 2002, 18, 486–487. [Google Scholar] [CrossRef]
- Yang, Z.; Bielawski, J.P. Statistical methods for detecting molecular adaptation. Trends Ecol. Evol. 2000, 15, 496–503. [Google Scholar] [CrossRef]
- Xia, E.H.; Jiang, J.J.; Huang, H.; Zhang, L.P.; Zhang, H.B.; Gao, L.Z. Transcriptome analysis of the oil-rich tea plant, Camellia oleifera, reveals candidate genes related to lipid metabolism. PLoS ONE 2014, 9, e104150. [Google Scholar] [CrossRef] [PubMed]
- Lee, E.K.; Cibrian-Jaramillo, A.; Kolokotronis, S.-O.; Katari, M.S.; Stamatakis, A.; Ott, M.; Chiu, J.C.; Little, D.P.; Stevenson, D.W.; McCombie, W.R. A functional phylogenomic view of the seed plants. PLoS Genet. 2011, 7, e1002411. [Google Scholar] [CrossRef] [PubMed]
- Buschiazzo, E.; Ritland, C.; Bohlmann, J.; Ritland, K. Slow but not low: Genomic comparisons reveal slower evolutionary rate and higher dN/dS in conifers compared to angiosperms. BMC Evol. Biol. 2012, 12, 8. [Google Scholar] [CrossRef] [PubMed]
- Li, J.; Dai, X.; Liu, T.; Zhao, P.X. LegumeIP: An integrative database for comparative genomics and transcriptomics of model legumes. Nucleic Acids Res. 2012, 40, D1221–D1229. [Google Scholar] [CrossRef] [PubMed]
- Young, N.D.; Debellé, F.; Oldroyd, G.E.; Geurts, R.; Cannon, S.B.; Udvardi, M.K.; Benedito, V.A.; Mayer, K.F.; Gouzy, J.; Schoof, H. The Medicago genome provides insight into the evolution of rhizobial symbioses. Nature 2011, 480, 520–524. [Google Scholar] [CrossRef] [PubMed]
- Sato, S.; Nakamura, Y.; Kaneko, T.; Asamizu, E.; Kato, T.; Nakao, M.; Sasamoto, S.; Watanabe, A.; Ono, A.; Kawashima, K. Genome structure of the legume, Lotus japonicus. DNA Res. 2008, 15, 227–239. [Google Scholar] [CrossRef] [PubMed]
- Schmutz, J.; Cannon, S.B.; Schlueter, J.; Ma, J.; Mitros, T.; Nelson, W.; Hyten, D.L.; Song, Q.; Thelen, J.J.; Cheng, J. Genome sequence of the palaeopolyploid soybean. Nature 2010, 463, 178–183. [Google Scholar] [CrossRef] [PubMed]
- Schmutz, J.; McClean, P.E.; Mamidi, S.; Wu, G.A.; Cannon, S.B.; Grimwood, J.; Jenkins, J.; Shu, S.; Song, Q.; Chavarro, C. A reference genome for common bean and genome-wide analysis of dual domestications. Nat. Genet. 2014, 46, 707–713. [Google Scholar] [CrossRef] [PubMed]
- Varshney, R.K.; Chen, W.; Li, Y.; Bharti, A.K.; Saxena, R.K.; Schlueter, J.A.; Donoghue, M.T.; Azam, S.; Fan, G.; Whaley, A.M. Draft genome sequence of pigeonpea (Cajanus cajan), an orphan legume crop of resource-poor farmers. Nat. Biotechnol. 2012, 30, 83–89. [Google Scholar] [CrossRef] [PubMed]
- Varshney, R.K.; Song, C.; Saxena, R.K.; Azam, S.; Yu, S.; Sharpe, A.G.; Cannon, S.; Baek, J.; Rosen, B.D.; Tar’an, B. Draft genome sequence of chickpea (Cicer arietinum) provides a resource for trait improvement. Nat. Biotechnol. 2013, 31, 240–246. [Google Scholar] [CrossRef] [PubMed]
- Bonifácio, E.M.; Fonsêca, A.; Almeida, C.; dos Santos, K.G.; Pedrosa-Harand, A. Comparative cytogenetic mapping between the lima bean (Phaseolus lunatus L.) and the common bean (P. vulgaris L.). Theor. Appl. Genet. 2012, 124, 1513–1520. [Google Scholar] [CrossRef] [PubMed]
- Kaplan, L.; Lynch, T.F. Phaseolus (fabaceae) in archaeology: AMS. Econ. Bot. 1999, 53, 261–272. [Google Scholar] [CrossRef]
- Maquet, A.; Vekemans, X.; Baudoin, J.P. Phylogenetic study on wild allies of Lima bean, Phaseolus lunatus (Fabaceae), and implications on its origin. Plant Syst. Evol. 1999, 218, 43–54. [Google Scholar] [CrossRef]
- Grabherr, M.G.; Haas, B.J.; Yassour, M.; Levin, J.Z.; Thompson, D.A.; Amit, I.; Adiconis, X.; Fan, L.; Raychowdhury, R.; Zeng, Q. Full-length transcriptome assembly from RNA-Seq data without a reference genome. Nat. Biotechnol. 2011, 29, 644–652. [Google Scholar] [CrossRef] [PubMed]
- Yang, Z.; Nielsen, R. Estimating synonymous and nonsynonymous substitution rates under realistic evolutionary models. Mol. Biol. Evol. 2000, 17, 32–43. [Google Scholar] [CrossRef] [PubMed]
- Zhang, L.; Yan, H.-F.; Wu, W.; Yu, H.; Ge, X.-J. Comparative transcriptome analysis and marker development of two closely related Primrose species (Primula poissonii and Primula wilsonii). BMC Genomics 2013, 14, 329. [Google Scholar] [CrossRef] [PubMed]
- Geng, L.L.; Duan, X.H.; Liang, C.; Shu, C.L.; Song, F.P.; Zhang, J. Mining tissue-specific contigs from Peanut (Arachis hypogaea L.) for promoter cloning by deep transcriptome sequencing. Plant Cell Physiol. 2014, 55, 1793–1801. [Google Scholar] [CrossRef] [PubMed]
- Wang, X.W.; Zhao, Q.Y.; Luan, J.B.; Wang, Y.J.; Yan, G.H.; Liu, S.S. Analysis of a native whitefly transcriptome and its sequence divergence with two invasive whitefly species. BMC Genomics 2012, 13, 529. [Google Scholar] [CrossRef] [PubMed]
- Berkey, R.; Bendigeri, D.; Xiao, S. Sphingolipids and plant defense/disease: The “death” connection and beyond. Front. Plant Sci. 2012, 3, 60. [Google Scholar] [CrossRef] [PubMed]
- Wang, Z.; Fang, B.; Chen, J.; Zhang, X.; Luo, Z.; Huang, L.; Chen, X.; Li, Y. De novo assembly and characterization of root transcriptome using Illumina paired-end sequencing and development of cSSR markers in sweet potato (Ipomoea batatas). BMC Genomics 2010, 11, 726. [Google Scholar] [CrossRef] [PubMed]
- Wang, Z.; Gerstein, M.; Snyder, M. RNA-Seq: A revolutionary tool for transcriptomics. Nat. Rev. Genet. 2009, 10, 57–63. [Google Scholar] [CrossRef] [PubMed]
- Peng, L.; Yamamoto, H.; Shikanai, T. Structure and biogenesis of the chloroplast NAD(P)H dehydrogenase complex. Biochim. Biophys. Acta 2011, 1807, 945–953. [Google Scholar] [CrossRef] [PubMed]
- Huseynova, I.M.; Suleymanov, S.Y.; Aliyev, J.A. Structural-functional state of thylakoid membranes of wheat genotypes under water stress. Biochim. Biophys. Acta 2007, 1767, 869–875. [Google Scholar] [CrossRef] [PubMed]
- Coate, J.E.; Schlueter, J.A.; Whaley, A.M.; Doyle, J.J. Comparative evolution of photosynthetic genes in response to polyploid and nonpolyploid duplication. Plant Physiol. 2011, 155, 2081–2095. [Google Scholar] [CrossRef] [PubMed]
- Smartt, J. Evolution of grain legumes. IV. Pulses in the genus phaseolus. Exp. Agric. 1985, 21, 193–207. [Google Scholar] [CrossRef]
- Chinnusamy, V.; Zhu, J.; Zhu, J.K. Gene regulation during cold acclimation in plants. Physiol. Plant. 2006, 126, 52–61. [Google Scholar] [CrossRef]
- Büschges, R.; Hollricher, K.; Panstruga, R.; Simons, G.; Wolter, M.; Frijters, A.; van Daelen, R.; van der Lee, T.; Diergaarde, P.; Groenendijk, J. The barley MLO gene: A novel control element of plant pathogen resistance. Cell 1997, 88, 695–705. [Google Scholar] [CrossRef]
- Piffanelli, P.; Zhou, F.; Casais, C.; Orme, J.; Jarosch, B.; Schaffrath, U.; Collins, N.C.; Panstruga, R.; Schulze-Lefert, P. The barley MLO modulator of defense and cell death is responsive to biotic and abiotic stress stimuli. Plant Physiol. 2002, 129, 1076–1085. [Google Scholar] [CrossRef] [PubMed]
- Wong, W.S.; Yang, Z.; Goldman, N.; Nielsen, R. Accuracy and power of statistical methods for detecting adaptive evolution in protein coding sequences and for identifying positively selected sites. Genetics 2004, 168, 1041–1051. [Google Scholar] [CrossRef] [PubMed]
- Zhu, H.Y.; Li, C.M.; Wang, L.F.; Bai, H.; Li, Y.P.; Yu, W.X.; Xia, D.A.; Liu, C.C. In silico identification and characterization of N-terminal acetyltransferase genes of poplar (Populus trichocarpa). Int. J. Mol. Sci. 2014, 15, 1852–1864. [Google Scholar] [CrossRef] [PubMed]
- Liu, C.C.; Zhu, H.Y.; Dong, X.M.; Ning, D.L.; Wang, H.X.; Li, W.H.; Yang, C.P.; Wang, B.C. Identification and analysis of the acetylated status of poplar proteins reveals analogous N-terminal protein processing mechanisms with other eukaryotes. PLoS ONE 2013, 8, e58681. [Google Scholar] [CrossRef] [PubMed]
- Hole, K.; van Damme, P.; Dalva, M.; Aksnes, H.; Glomnes, N.; Varhaug, J.E.; Lillehaug, J.R.; Gevaert, K.; Arnesen, T. The human N-α-acetyltransferase 40 (hNaa40p/hNatD) is conserved from yeast and N-terminally acetylates histones H2A and H4. PLoS ONE 2011, 6, e24713. [Google Scholar] [CrossRef] [PubMed]
- Sabbagh, A.; Marin, J.; Veyssière, C.; Lecompte, E.; Boukouvala, S.; Poloni, E.S.; Darlu, P.; Crouau-Roy, B. Rapid birth-and-death evolution of the xenobiotic metabolizing NAT gene family in vertebrates with evidence of adaptive selection. BMC Evol. Biol. 2013, 13, 62. [Google Scholar] [CrossRef] [PubMed]
- Tiffin, P.; Moeller, D.A. Molecular evolution of plant immune system genes. Trends Genet. 2006, 22, 662–670. [Google Scholar] [CrossRef] [PubMed]
- Swairjo, M.A.; Schimmel, P. Abstracts: Albany 2005, The 14th Conversation. J. Biomol. Struct. Dyn. 2005, 22, 755–874. [Google Scholar]
- Engelberth, J.; Koch, T.; Schuler, G.; Bachmann, N.; Rechtenbach, J.; Boland, W. Ion channel-forming alamethicin is a potent elicitor of volatile biosynthesis and tendril coiling. Cross talk between jasmonate and salicylate signaling in lima bean. Plant Physiol. 2001, 125, 369–377. [Google Scholar] [CrossRef] [PubMed]
- Arimura, G.; Tashiro, K.; Kuhara, S.; Nishioka, T.; Ozawa, R.; Takabayashi, J. Gene responses in bean leaves induced by herbivory and by herbivore-induced volatiles. Biochem. Biophys. Res. Commun. 2000, 277, 305–310. [Google Scholar] [CrossRef] [PubMed]
- Chen, F.; Mackey, A.J.; Stoeckert, C.J.; Roos, D.S. OrthoMCL-DB: Querying a comprehensive multi-species collection of ortholog groups. Nucleic Acids Res. 2006, 34, D363–D368. [Google Scholar] [CrossRef] [PubMed]
- Ebersberger, I.; Strauss, S.; von Haeseler, A. HaMStR: Profile hidden markov model based search for orthologs in ESTs. BMC Evol. Biol. 2009, 9, 157. [Google Scholar] [CrossRef] [PubMed]
- Wang, J.T.; Li, J.T.; Zhang, X.F.; Sun, X.W. Transcriptome analysis reveals the time of the fourth round of genome duplication in common carp (Cyprinus carpio). BMC Genomics 2012, 13, 96. [Google Scholar] [CrossRef] [PubMed]
- Kent, W.J. BLAT—The BLAST-like alignment tool. Genome Res. 2002, 12, 656–664. [Google Scholar] [CrossRef] [PubMed]
- Tamura, K.; Stecher, G.; Peterson, D.; Filipski, A.; Kumar, S. MEGA6: Molecular evolutionary genetics analysis version 6.0. Mol. Biol. Evol. 2013, 30, 2725–2729. [Google Scholar] [CrossRef] [PubMed]
- Yang, Z. PAML 4: Phylogenetic analysis by maximum likelihood. Mol. Biol. Evol. 2007, 24, 1586–1591. [Google Scholar] [CrossRef] [PubMed]
- Yang, Z. Likelihood ratio tests for detecting positive selection and application to primate lysozyme evolution. Mol. Biol. Evol. 1998, 15, 568–573. [Google Scholar] [CrossRef] [PubMed]
- Benjamini, Y.; Hochberg, Y. Controlling the false discovery rate: A practical and powerful approach to multiple testing. J. R. Stat. Soc. Ser. B 1995, 57, 289–300. [Google Scholar]
- Yang, Z.; Wong, W.S.; Nielsen, R. Bayes empirical Bayes inference of amino acid sites under positive selection. Mol. Biol. Evol. 2005, 22, 1107–1118. [Google Scholar] [CrossRef] [PubMed]
- Götz, S.; García-Gómez, J.M.; Terol, J.; Williams, T.D.; Nagaraj, S.H.; Nueda, M.J.; Robles, M.; Talón, M.; Dopazo, J.; Conesa, A. High-throughput functional annotation and data mining with the Blast2GO suite. Nucleic Acids Res. 2008, 36, 3420–3435. [Google Scholar] [CrossRef] [PubMed]
- Conesa, A.; Götz, S.; García-Gómez, J.M.; Terol, J.; Talón, M.; Robles, M. Blast2GO: A universal tool for annotation, visualization and analysis in functional genomics research. Bioinformatics 2005, 21, 3674–3676. [Google Scholar] [CrossRef] [PubMed]
- Ye, J.; Fang, L.; Zheng, H.; Zhang, Y.; Chen, J.; Zhang, Z.; Wang, J.; Li, S.; Li, R.; Bolund, L. WEGO: A web tool for plotting GO annotations. Nucleic Acids Res. 2006, 34, W293–W297. [Google Scholar] [CrossRef] [PubMed]
- Blüthgen, N.; Brand, K.; Cajavec, B.; Swat, M.; Herzel, H.; Beule, D. Biological profiling of gene groups utilizing Gene Ontology. Genome Inform. 2005, 16, 106–115. [Google Scholar] [PubMed]
© 2015 by the authors; licensee MDPI, Basel, Switzerland. This article is an open access article distributed under the terms and conditions of the Creative Commons Attribution license (http://creativecommons.org/licenses/by/4.0/).