
Detection of Interactions between Proteins through Rotation Forest and Local Phase Quantization Descriptors


Abstract
:
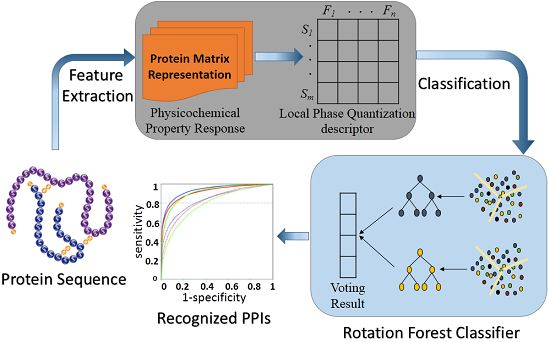
1. Introduction
2. Results and Discussion
2.1. Evaluation Measures
2.2. Parameter Selection

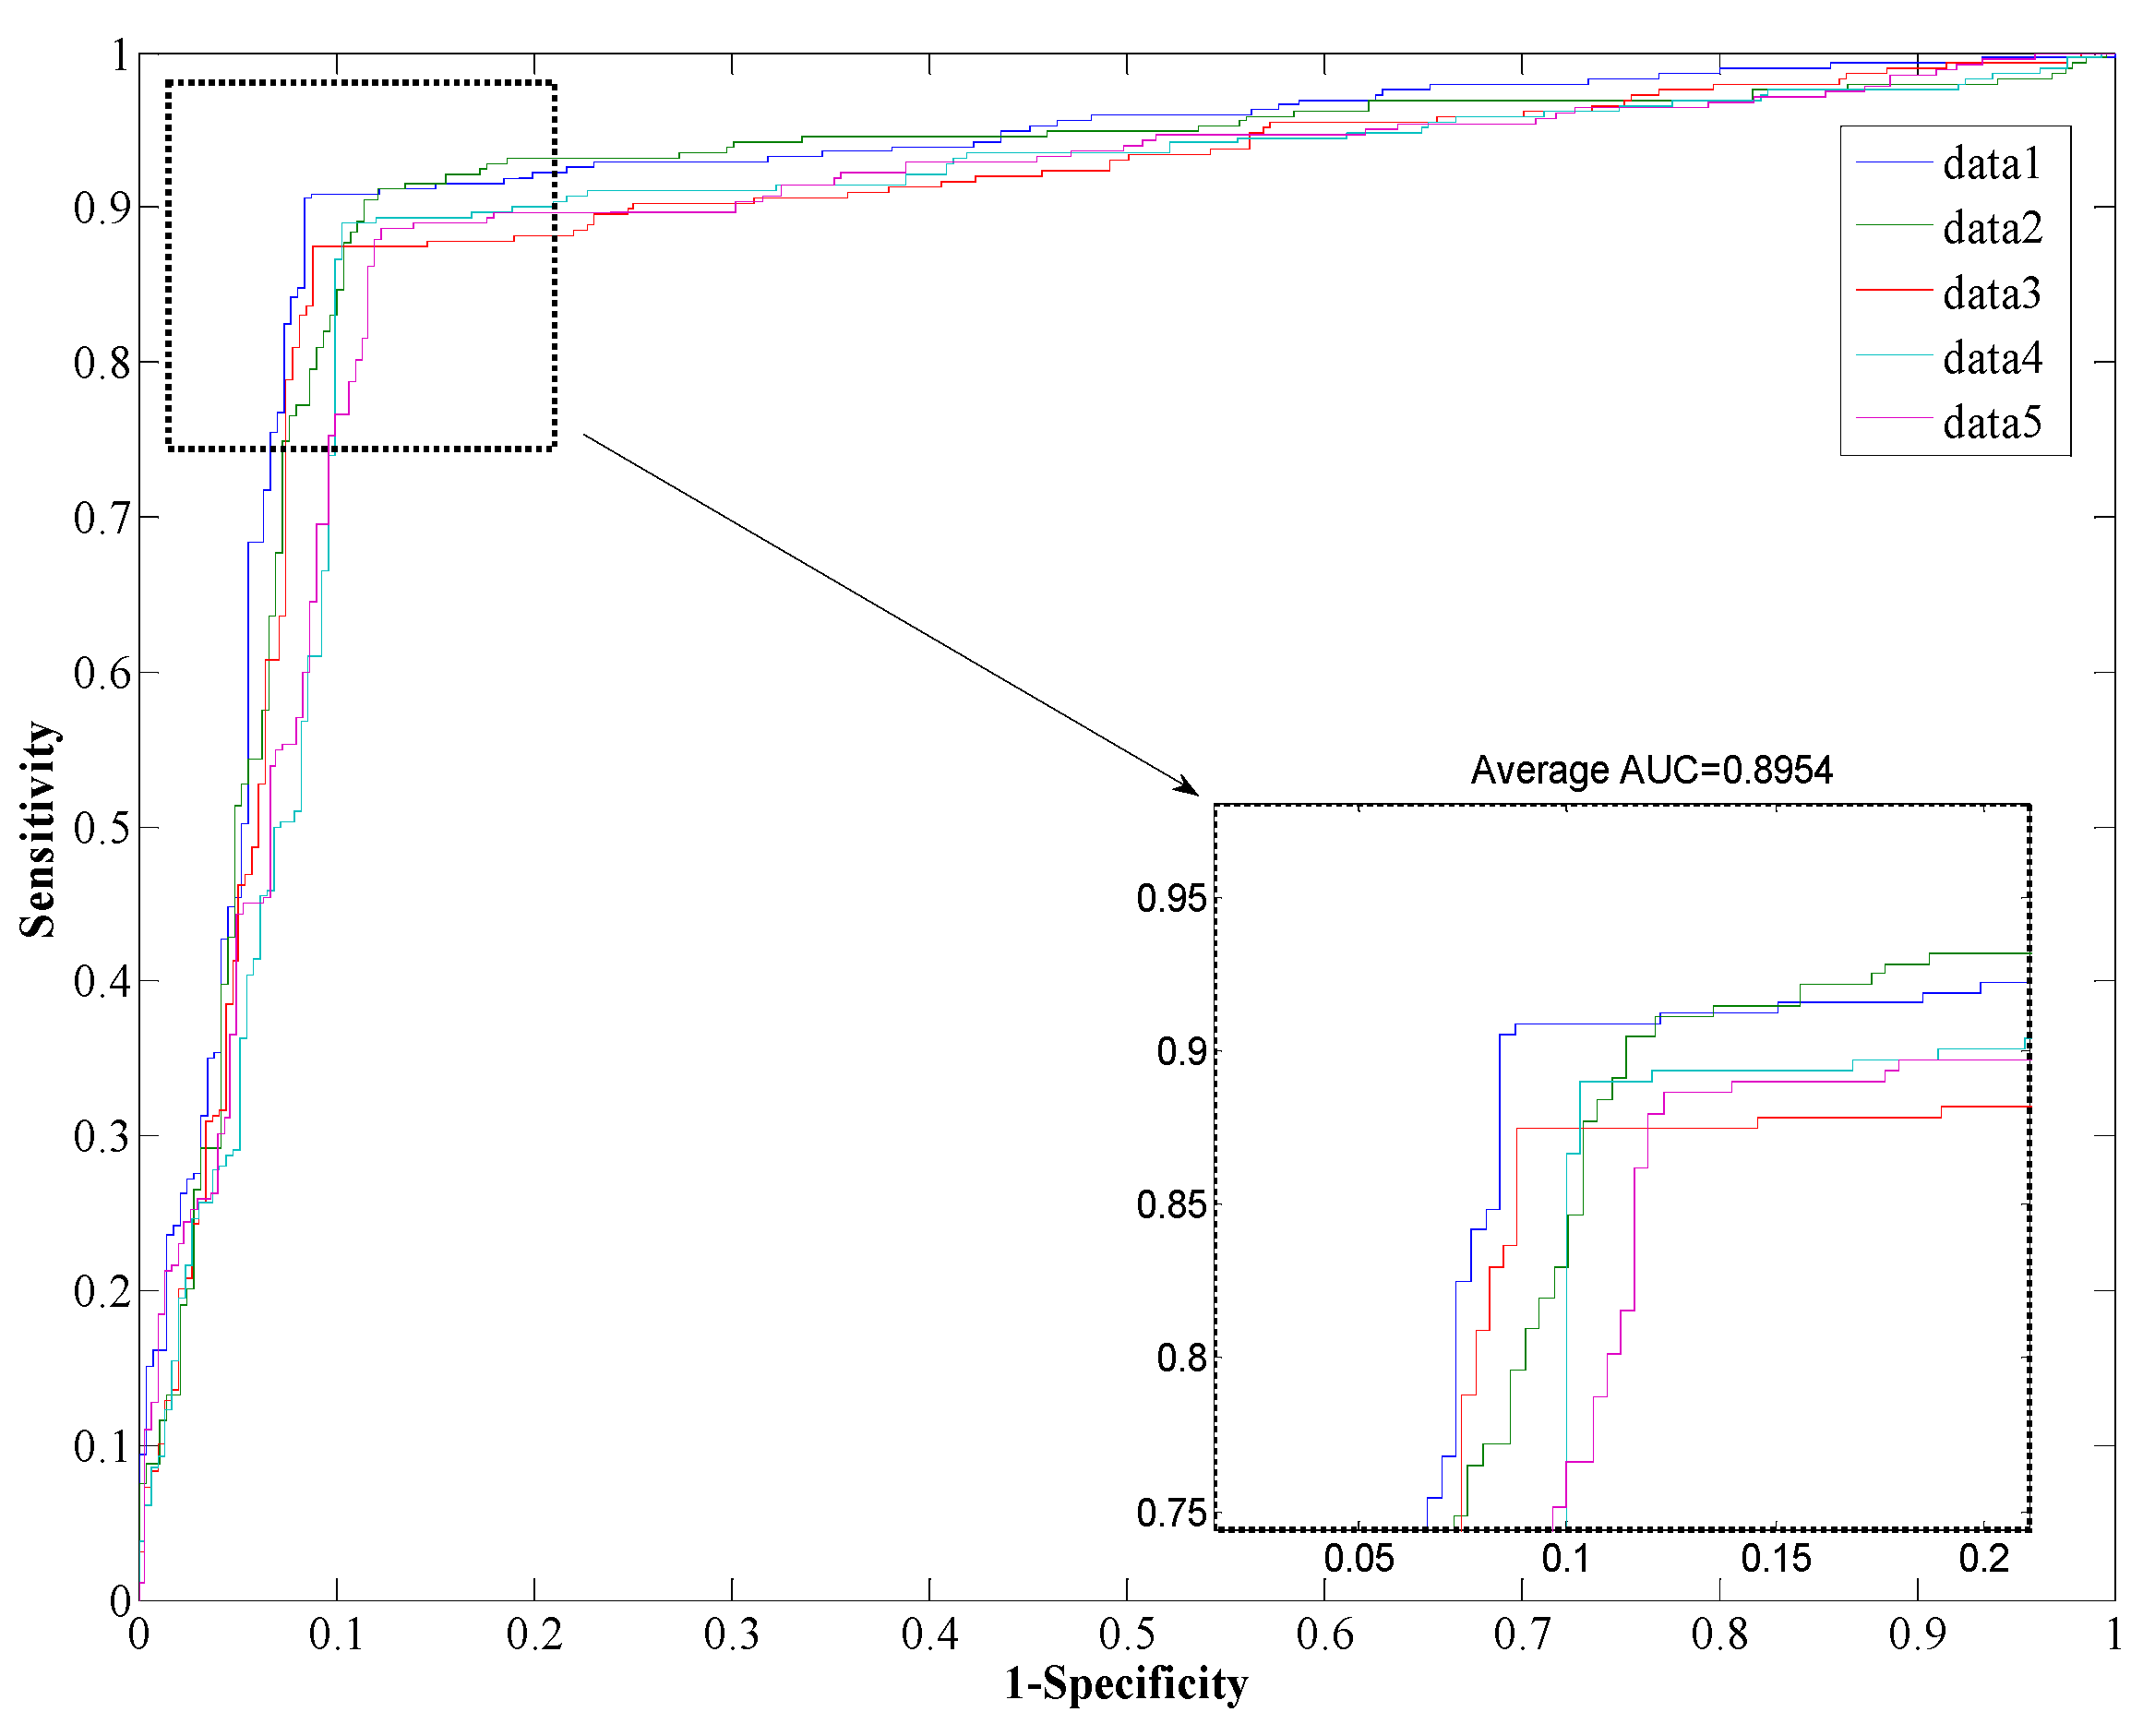
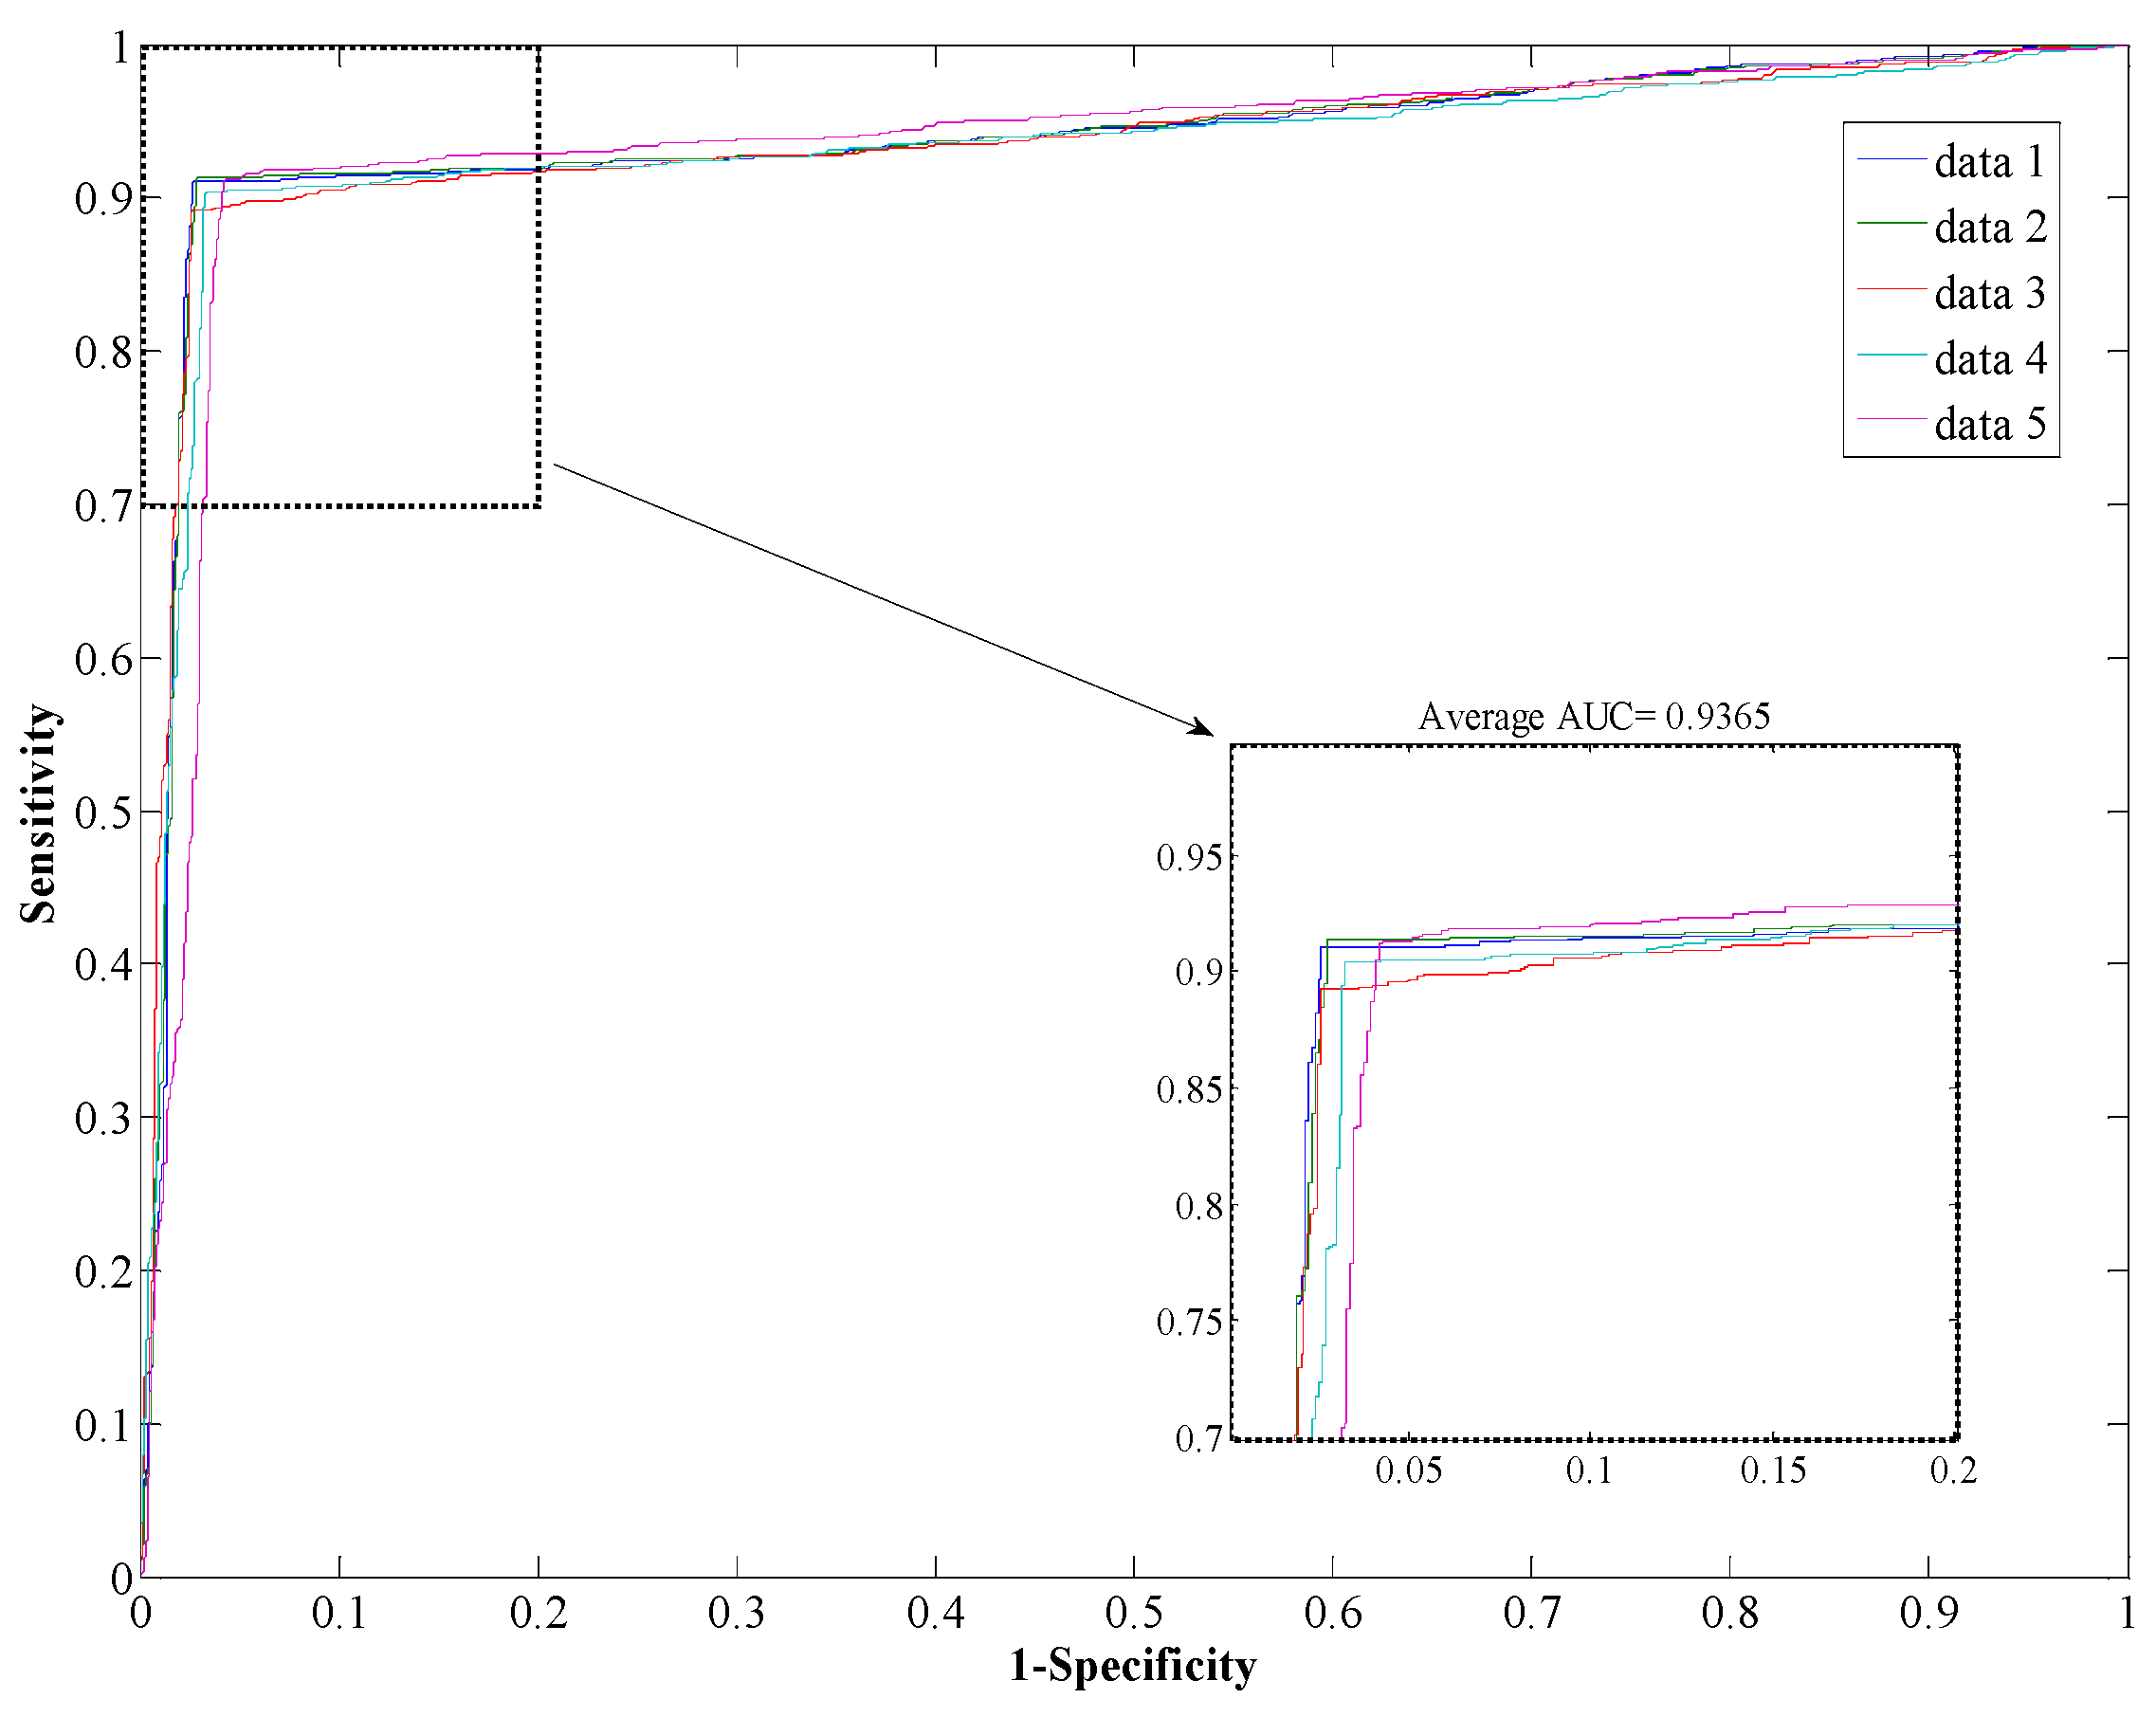
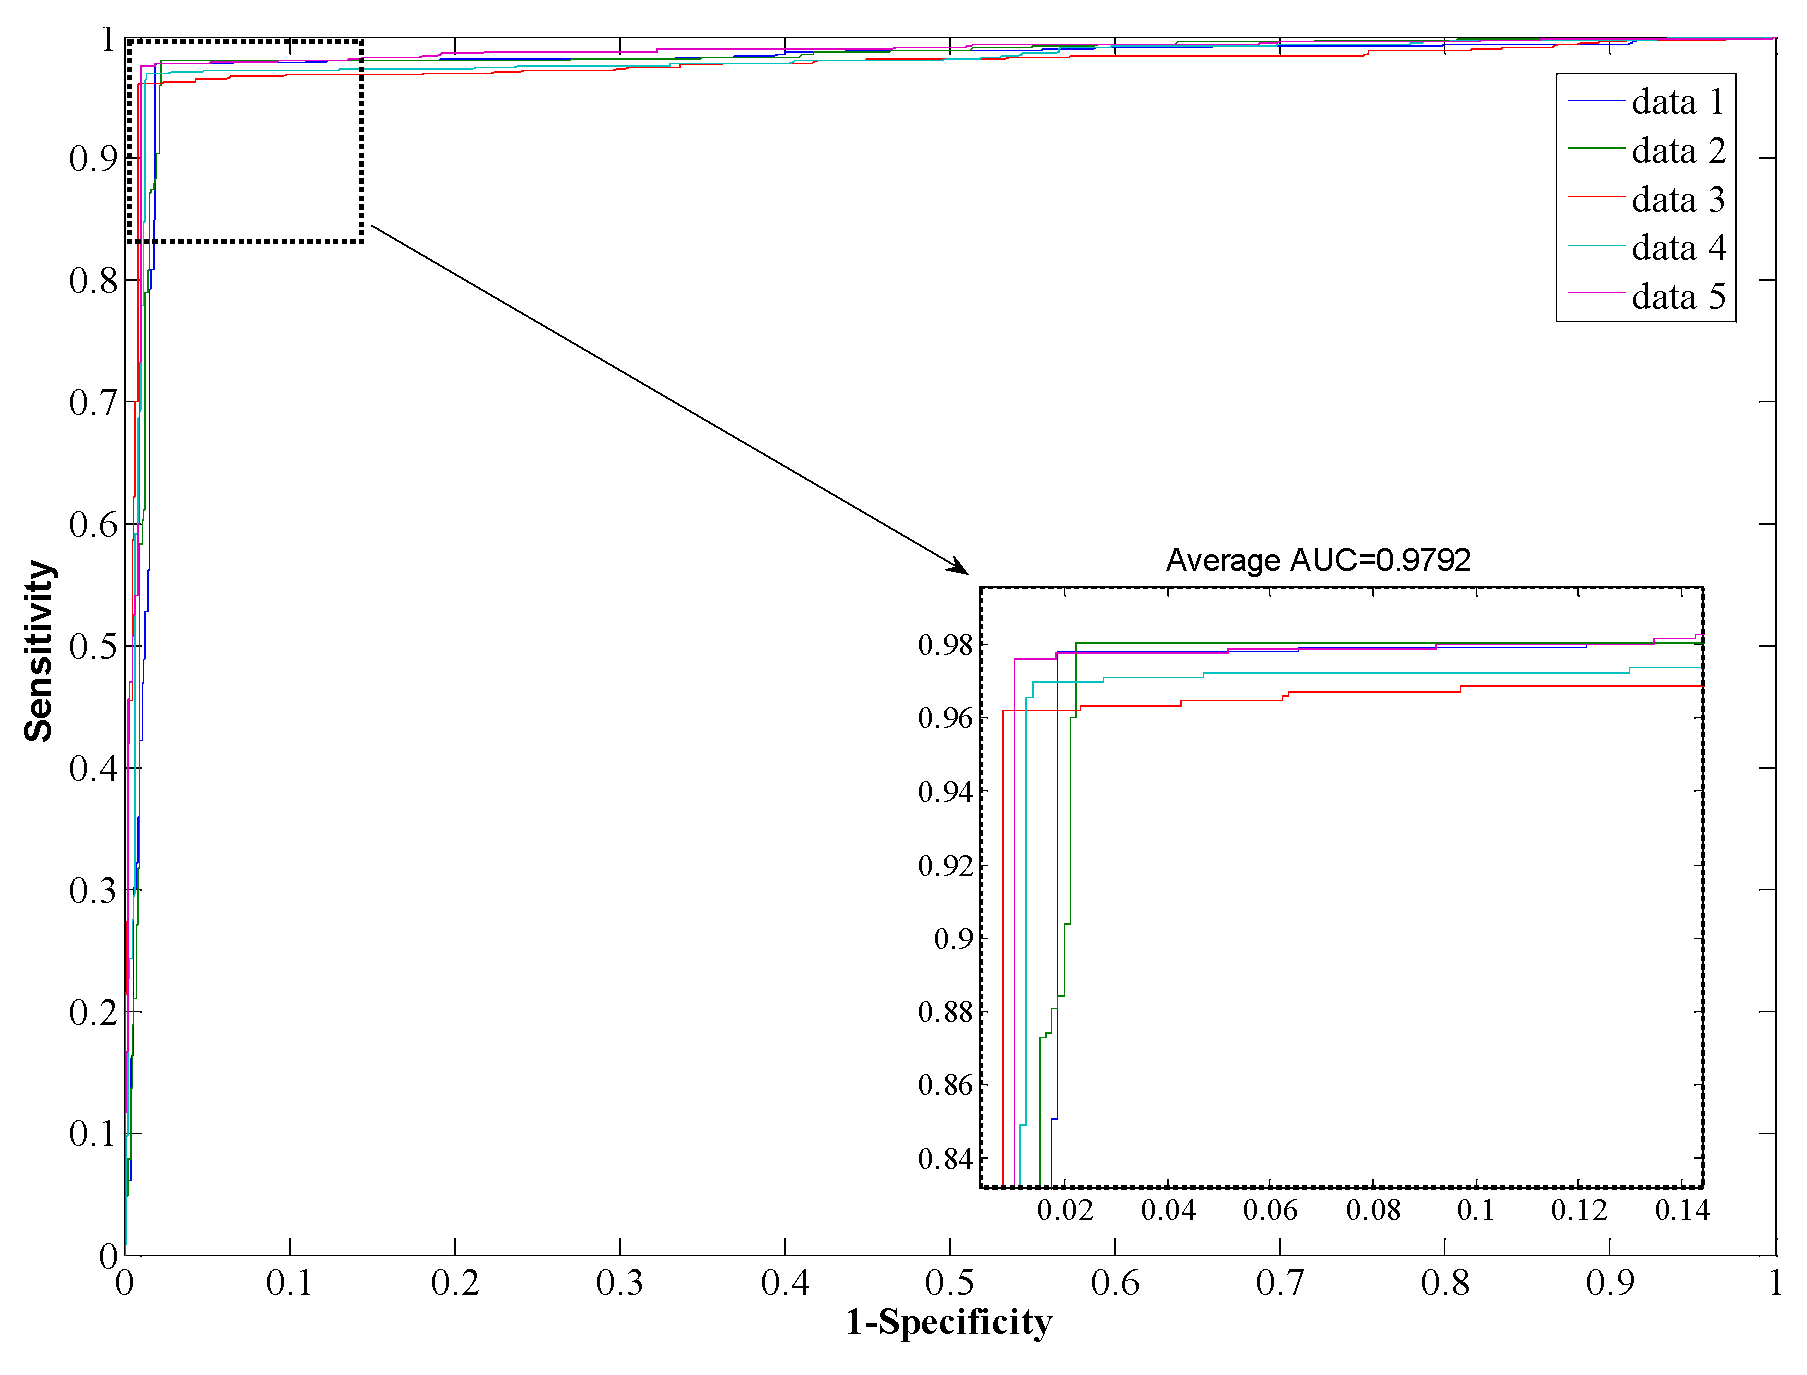
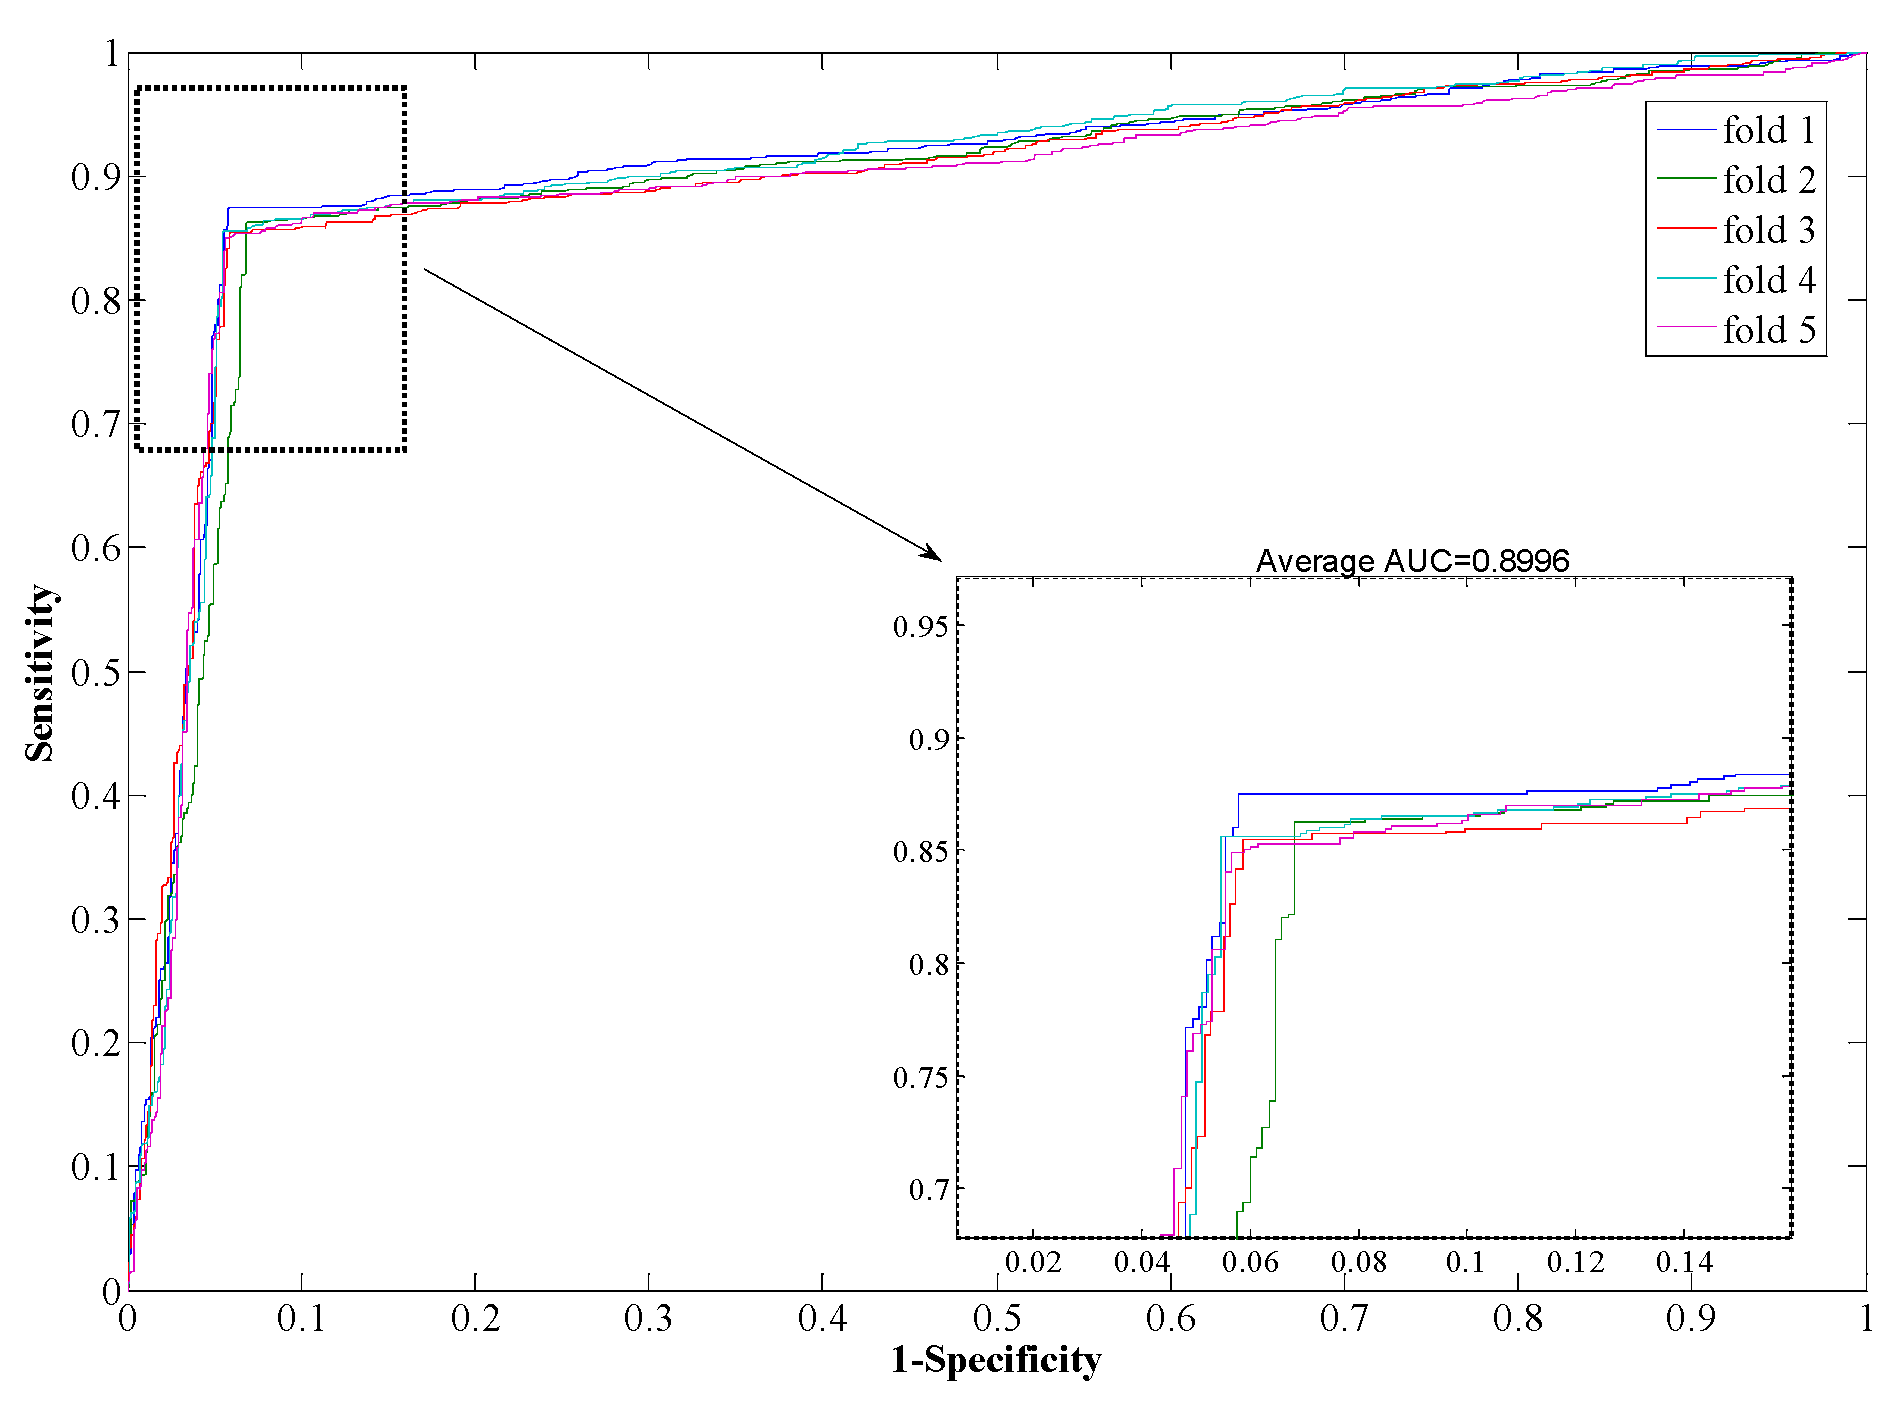
2.3. Prediction Performance of Proposed Model

| Test Set | Sensitivity (%) | Precision (%) | Accuracy (%) | MCC | AUC |
|---|---|---|---|---|---|
| 1 | 90.57 | 91.81 | 91.08 | 0.8375 | 0.9158 |
| 2 | 90.48 | 88.96 | 89.54 | 0.8126 | 0.9048 |
| 3 | 87.15 | 90.61 | 89.19 | 0.8070 | 0.8896 |
| 4 | 89.04 | 89.66 | 89.37 | 0.8099 | 0.8823 |
| 5 | 88.65 | 87.11 | 88.16 | 0.7912 | 0.8842 |
| Average | 89.18 ± 1.42 | 89.63 ± 1.77 | 89.47 ± 1.05 | 0.81 ± 0.0167 | 0.90 ± 0.0145 |
| Test Set | Sensitivity (%) | Precision (%) | Accuracy (%) | MCC | AUC |
|---|---|---|---|---|---|
| 1 | 89.22 | 97.16 | 93.34 | 0.8752 | 0.9381 |
| 2 | 91.18 | 95.61 | 93.47 | 0.8779 | 0.9387 |
| 3 | 90.40 | 96.61 | 93.52 | 0.8786 | 0.9368 |
| 4 | 91.07 | 97.06 | 94.32 | 0.8924 | 0.9331 |
| 5 | 91.34 | 96.88 | 94.37 | 0.8933 | 0.9358 |
| Average | 90.64 ± 0.87 | 96.66 ± 0.62 | 93.80 ± 0.50 | 0.88 ± 0.009 | 0.94 ± 0.002 |
| Model | Test Set | Sensitivity (%) | Precision (%) | Accuracy (%) | MCC | AUC |
|---|---|---|---|---|---|---|
| Rotation Forest | 1 | 97.68 | 97.93 | 97.91 | 0.9590 | 0.97.68 |
| 2 | 98.07 | 97.57 | 97.91 | 0.9591 | 0.97.93 | |
| 3 | 96.21 | 99.06 | 97.79 | 0.9566 | 0.97.65 | |
| 4 | 96.98 | 98.40 | 97.85 | 0.9578 | 0.97.79 | |
| 5 | 97.64 | 98.80 | 98.34 | 0.9673 | 0.98.53 | |
| Average | 97.32 ± 0.73 | 98.35 ± 0.61 | 97.96 ± 0.22 | 0.96 ± 0.004 | 0.98 ± 0.004 | |
| SVM | 1 | 87.52 | 93.59 | 90.92 | 0.8343 | 0.9055 |
| 2 | 86.28 | 92.07 | 89.88 | 0.8170 | 0.8959 | |
| 3 | 85.46 | 93.00 | 90.01 | 0.8185 | 0.8985 | |
| 4 | 85.62 | 93.05 | 90.44 | 0.8244 | 0.9047 | |
| 5 | 84.93 | 93.27 | 89.82 | 0.8156 | 0.8935 | |
| Average | 85.96 ± 0.99 | 93.00 ± 0.57 | 90.21 ± 0.46 | 0.82 ± 0.008 | 0.90 ± 0.005 |


2.4. Comparison with Other Methods
| Model | Test Set | Sensitivity (%) | Precision (%) | Accuracy (%) | MCC (%) |
|---|---|---|---|---|---|
| Zhou’s work | SVM + LD | 87.37 ± 0.22 | 89.50 ± 0.60 | 88.56 ± 0.33 | 77.15 ± 0.68 |
| Guo’s work | ACC | 89.93 ± 3.68 | 88.87 ± 6.16 | 89.33 ± 2.67 | N/A |
| AC | 87.30 ± 0.22 | 87.82 ± 4.33 | 87.36 ± 1.38 | N/A | |
| Yang’s work | Cod1 | 75.81 ± 1.20 | 74.75 ± 1.23 | 75.08 ± 1.13 | N/A |
| Cod2 | 76.77 ± 0.69 | 82.17 ± 1.35 | 80.04 ± 1.06 | N/A | |
| Cod3 | 78.14 ± 0.90 | 81.86 ± 0.99 | 80.41 ± 0.47 | N/A | |
| Cod4 | 81.03 ± 1.74 | 90.24 ± 1.34 | 86.15 ± 1.17 | N/A | |
| Proposed Method | Average | 90.64 ± 0.87 | 96.66 ± 0.62 | 93.80 ± 0.50 | 88.35 ± 0.87 |
| Model | Sensitivity (%) | Precision (%) | Accuracy (%) | MCC (%) |
|---|---|---|---|---|
| Phylogenetic bootstrap | 69.80 | 80.20 | 75.80 | N/A |
| Boosting | 80.37 | 81.69 | 79.52 | 70.64 |
| Signature products | 79.90 | 85.70 | 83.40 | N/A |
| HKNN | 86.00 | 84.00 | 84.00 | N/A |
| Proposed Method | 89.18 | 89.63 | 89.47 | 81.16 |
3. Materials and Methods
3.1. Generation of the Data Sets
3.2. Representation for Protein
| Amino Acids | A | R | N | D | C | Q | E | G | H | I |
|---|---|---|---|---|---|---|---|---|---|---|
| Values | 0.61 | 0.60 | 0.06 | 0.46 | 1.07 | 0 | 0.47 | 0.07 | 0.61 | 2.22 |
| Amino Acids | L | K | M | F | P | S | T | W | Y | V |
| Values | 1.53 | 1.15 | 1.18 | 2.02 | 1.95 | 0.05 | 0.05 | 2.65 | 1.88 | 1.32 |
3.3. Feature Vector Extraction
3.4. Rotation Forest
4. Conclusions
Acknowledgments
Author Contributions
Conflicts of Interest
References
- Krogan, N.J.; Cagney, G.; Yu, H.; Zhong, G.; Guo, X.; Ignatchenko, A.; Li, J.; Pu, S.; Datta, N.; Tikuisis, A.P.; et al. Global landscape of protein complexes in the yeast Saccharomyces cerevisiae. Nature 2006, 440, 637–643. [Google Scholar] [CrossRef] [PubMed]
- Zhang, Q.C.; Petrey, D.; Deng, L.; Qiang, L.; Shi, Y.; Thu, C.A.; Bisikirska, B.; Lefebvre, C.; Accili, D.; Hunter, T.; et al. Structure-based prediction of protein-protein interactions on a genome wide scale. Nature 2012, 490, 556–560. [Google Scholar] [CrossRef] [PubMed]
- Zhu, H.; Bilgin, M.; Bangham, R.; Hall, D.; Casamayor, A.; Bertone, P.; Lan, N.; Jansen, R.; Bidlingmaier, S.; Houfek, T.; et al. Global analysis of protein activities using proteome chips. Science 2001, 193, 2101–2105. [Google Scholar] [CrossRef] [PubMed]
- Tong, A.H.; Drees, B.; Nardelli, G.; Bader, G.D.; Brannetti, B.; Castagnoli, L.; Evangelista, M.; Ferracuti, S.; Nelson, B.; Paoluzi, S.; et al. A combined experimental and computational strategy to define protein interaction networks for peptide recognition modules. Science 2002, 295, 321–324. [Google Scholar] [CrossRef] [PubMed]
- Fields, S.; Song, O. A novel genetic system to detect protein protein interactions. Nature 1989, 340, 245–246. [Google Scholar] [CrossRef] [PubMed]
- Uetz, P.; Giot, L.; Cagney, G.; Mansfield, T.A.; Judson, R.S.; Knight, J.R.; Lockshon, D.; Narayan, V.; Srinivasan, M.; Pochart, P.; et al. A comprehensive analysis of protein–protein interactions in Saccharomyces cerevisiae. Nature 2000, 403, 623–627. [Google Scholar] [PubMed]
- Ito, T.; Chiba, T.; Ozawa, R.; Yoshida, M.; Hattori, M.; Sakaki, Y. A comprehensive twohybrid analysis to explore the yeast protein interactome. Proc. Natl. Acad. Sci. USA 2001, 98, 4569–4574. [Google Scholar] [CrossRef] [PubMed]
- Gavin, A.C.; Bösche, M.; Krause, R.; Grandi, P.; Marzioch, M.; Bauer, A.; Schultz, J.; Rick, J.M.; Michon, A.M.; Cruciat, C.M.; et al. Functional organization of the yeast proteome by systematic analysis of protein complexes. Nature 2002, 415, 141–147. [Google Scholar] [CrossRef] [PubMed]
- Ho, Y.; Gruhler, A.; Heilbut, A.; Bader, G.D.; Moore, L.; Adams, S.L.; Millar, A.; Taylor, P.; Bennett, K.; Boutilier, K.; et al. Systematic identification of protein complexes in Saccharomyces cerevisiae by mass spectrometry. Nature 2002, 415, 180–183. [Google Scholar] [CrossRef] [PubMed]
- Ge, H.; Liu, Z.; Church, G.M.; Vidal, M. Correlation between transcriptome and interactome mapping data from Saccharomyces cerevisiae. Nat. Genet. 2001, 29, 482–486. [Google Scholar] [CrossRef] [PubMed]
- You, Z.H.; Yin, Z.; Han, K.; Huang, D.S.; Zhou, X. A semi-supervised learning approach to predict synthetic genetic interactions by combining functional and topological properties of functional gene network. BMC Bioinform. 2010, 1. [Google Scholar] [CrossRef] [PubMed]
- Guo, Y.; Yu, L.; Wen, Z.; Li, M. Using support vector machine combined with auto covariance to predict proteinprotein interactions from protein sequences. Nucleic Acids Res. 2008, 36, 3025–3030. [Google Scholar] [CrossRef] [PubMed]
- You, Z.H.; Lei, Y.K.; Gui, J.; Huang, D.S.; Zhou, X. Using manifold embedding for assessing and predicting protein interactions from high-throughput experimental data. Bioinformatics 2010, 26, 2744–2751. [Google Scholar] [CrossRef] [PubMed]
- You, Z.H.; Li, L.; Yu, H.; Chen, S.; Wang, S.L. Increasing Reliability of Protein Interactome by Combining Heterogeneous Data Sources with Weighted Network Topological Metrics. In Advanced Intelligent Computing Theories and Applications; Huang, D.S., Zhao, Z.M., Bevilacqua, V., Figueroa, J.C., Eds.; Springer: Changsha, China, 2010; Volume 6215, pp. 657–663. [Google Scholar]
- Wan, C.; Borgeson, B.; Phanse, S.; Wan, C.; Borgeson, B.; Phanse, S.; Tu, F.; Drew, K.; Clark, G.; Xiong, X.; et al. Panorama of ancient metazoan macromolecular complexes. Nature 2015, 525, 339–344. [Google Scholar] [CrossRef] [PubMed]
- Lei, Y.K.; You, Z.H.; Ji, Z.; Zhu, L.; Huang, D.S. Assessing and predicting protein interactions by combining manifold embedding with multiple information integration. BMC Bioinform. 2012, 13 (Suppl. S7). [Google Scholar] [CrossRef] [PubMed]
- Skrabanek, L.; Saini, H.; Bader, G.; Enright, A. Computational prediction of protein-protein interactions. Mol. Biotechnol. 2008, 38, 1–17. [Google Scholar] [CrossRef] [PubMed]
- Qi, Y.J.; Seetharaman, J.K.; Joseph, Z.B. Random forest similarity for protein-protein interaction prediction from multiple sources. Pac. Symp. Biocomput. 2005, 10, 531–542. [Google Scholar]
- Yang, L.; Xia, J.F.; Gui, J. Prediction of protein-protein interactions from protein sequence using local descriptors. Protein Pept. Lett. 2010, 9, 1085–1090. [Google Scholar] [CrossRef]
- Shen, J.; Zhang, J.; Luo, X.; Zhu, W.; Yu, K.; Chen, K.; Li, Y.; Jiang, H. Predictina protein-protein interactions based only on sequences information. Proc. Natl. Acad. Sci. USA 2007, 104, 4337–4341. [Google Scholar] [CrossRef] [PubMed]
- Nanni, L.; Brahnam, S.; Lumini, A. Wavelet images and Chou’s pseudo amino acid composition for protein classification. Amino Acids 2012, 43, 657–665. [Google Scholar] [CrossRef] [PubMed]
- Zhou, Y.Z.; Gao, Y.; Zheng, Y.Y. Prediction of protein-protein interactions using local description of amino acid sequence. In Advances in Computer Science and Education Applications; Springer Berlin Heidelberg: Qingdao, China, 2011; pp. 254–262. [Google Scholar]
- Bock, J.R.; Gough, D.A. Whole-proteome interaction mining. Bioinformatics 2003, 19, 125–134. [Google Scholar] [CrossRef] [PubMed]
- Thanathamathee, P.; Lursinsap, C. Predicting protein-protein interactions using correlation coefficient and priciple component analysis. IEEE 2009, 3, 1–4. [Google Scholar]
- Martin, S.; Roe, D.; Faulon, J.L. Predicting protein-protein interactions using signature products. Bioinformatics 2005, 21, 218–226. [Google Scholar] [CrossRef] [PubMed]
- Kuncheva, L.I. Combining pattern classifiers: Methods and algorithms. Technometrics 2004, 47, 517–518. [Google Scholar]
© 2015 by the authors; licensee MDPI, Basel, Switzerland. This article is an open access article distributed under the terms and conditions of the Creative Commons by Attribution (CC-BY) license (http://creativecommons.org/licenses/by/4.0/).
Share and Cite
Wong, L.; You, Z.-H.; Ming, Z.; Li, J.; Chen, X.; Huang, Y.-A. Detection of Interactions between Proteins through Rotation Forest and Local Phase Quantization Descriptors. Int. J. Mol. Sci. 2016, 17, 21. https://doi.org/10.3390/ijms17010021
Wong L, You Z-H, Ming Z, Li J, Chen X, Huang Y-A. Detection of Interactions between Proteins through Rotation Forest and Local Phase Quantization Descriptors. International Journal of Molecular Sciences. 2016; 17(1):21. https://doi.org/10.3390/ijms17010021
Chicago/Turabian StyleWong, Leon, Zhu-Hong You, Zhong Ming, Jianqiang Li, Xing Chen, and Yu-An Huang. 2016. "Detection of Interactions between Proteins through Rotation Forest and Local Phase Quantization Descriptors" International Journal of Molecular Sciences 17, no. 1: 21. https://doi.org/10.3390/ijms17010021
APA StyleWong, L., You, Z.-H., Ming, Z., Li, J., Chen, X., & Huang, Y.-A. (2016). Detection of Interactions between Proteins through Rotation Forest and Local Phase Quantization Descriptors. International Journal of Molecular Sciences, 17(1), 21. https://doi.org/10.3390/ijms17010021