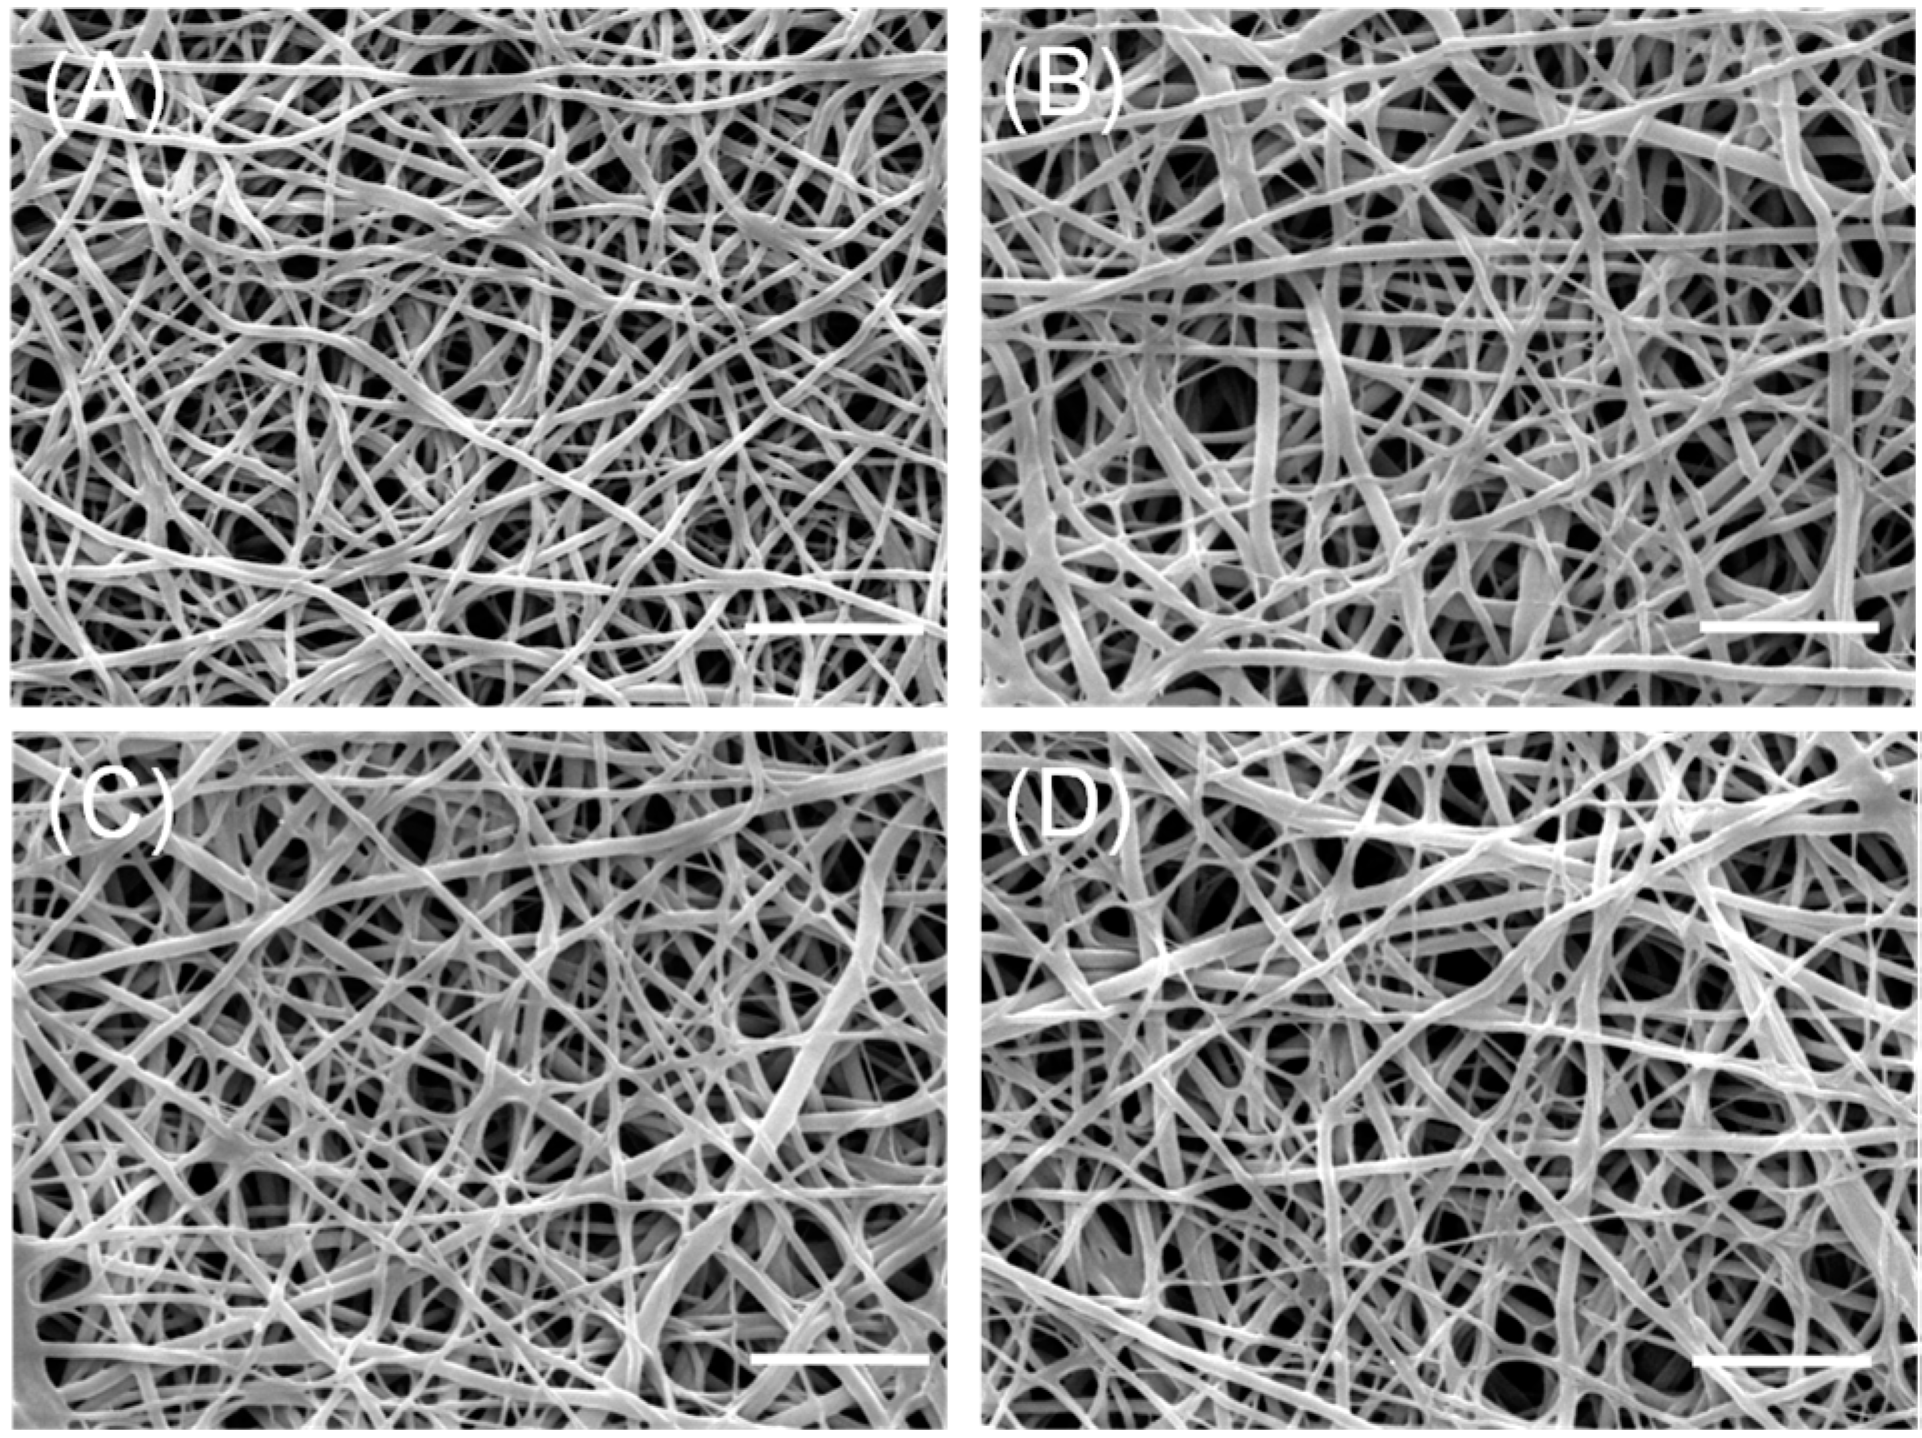
2.1. Morphological Analysis of Nanofibers
First of all, we observed the morphological stability of nanofibers during the aqueous neutralization and SP coupling process. Scanning electron microscopy (SEM) images of pristine or non-neutralized CNs (
Figure 1A) presented a highly uniform and smooth nanofibrous morphology without defects. Then, NaOH treatments for neutralization hold their nanofibrous structure (
Figure 1B), consistent with our previous study [
18]. Furthermore, this fibrous morphology of nanofibers was maintained during the SP coupling process (
Figure 1C,D). From SEM analysis, the aqueous neutralized and immobilized processes do not significantly change the morphology of fibers.
Figure 1.
Representative SEM images of pristine chitosan nanofibers (CNs) (A); neutralized CNs (B); CNs with passively-adsorbed substance-P (SP) (P-CNs) (C); and CNs with covalently-immobilized SP (S-CNs) (D). Scale bar: 5 μm.
Figure 1.
Representative SEM images of pristine chitosan nanofibers (CNs) (A); neutralized CNs (B); CNs with passively-adsorbed substance-P (SP) (P-CNs) (C); and CNs with covalently-immobilized SP (S-CNs) (D). Scale bar: 5 μm.
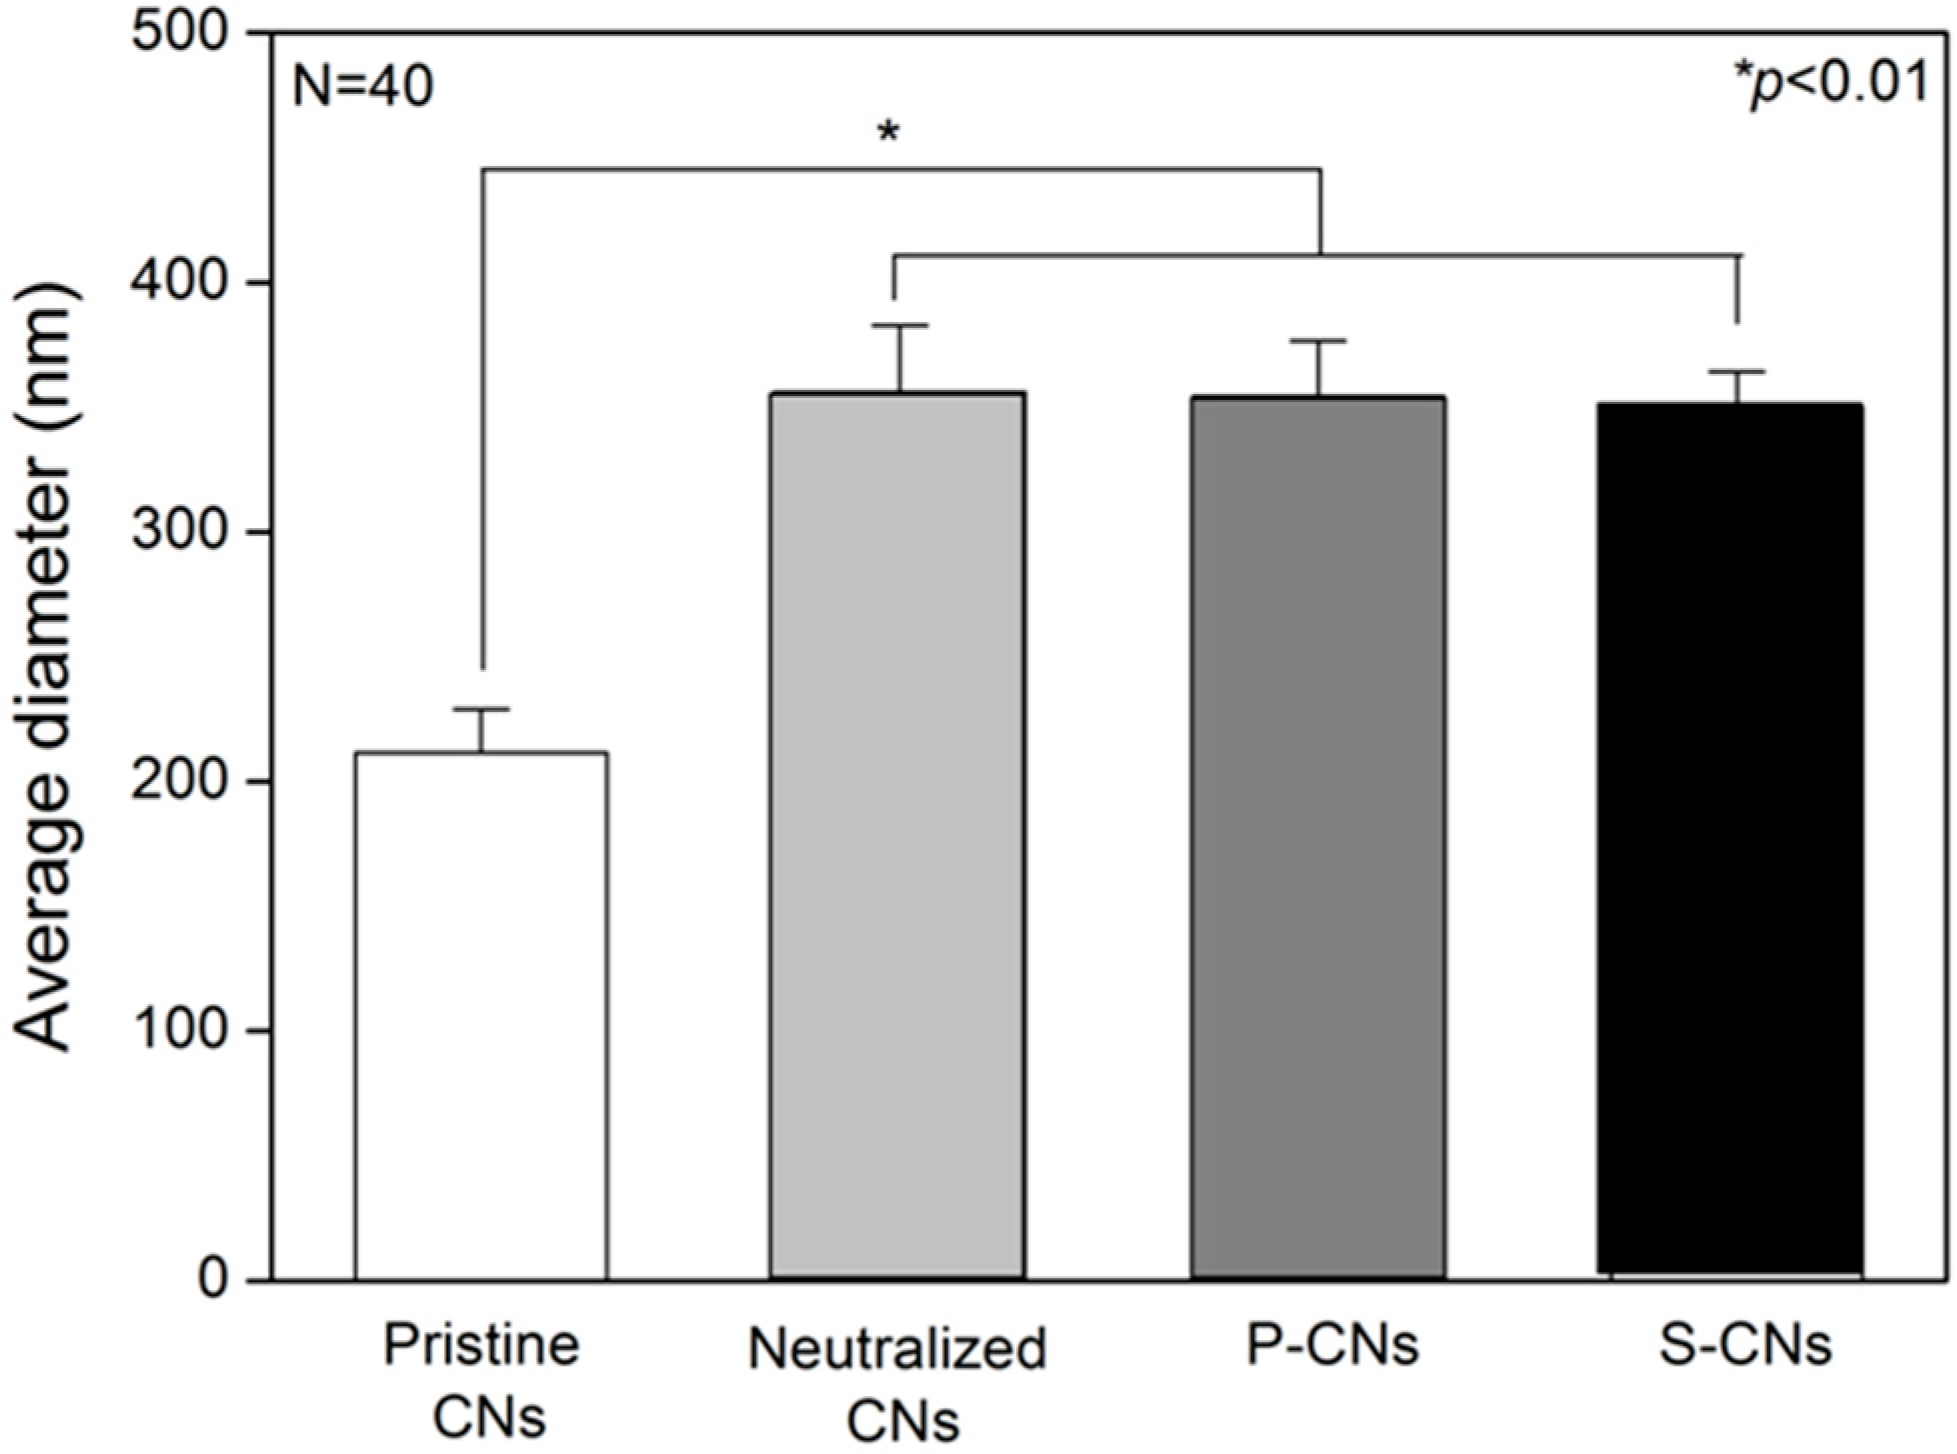
However, after completion of the aqueous SP coupling process, the fibers showed a thickened shape (compare to
Figure 1A). To analyze these morphological changes quantitatively, we measured the average diameters of CNs from the SEM images of
Figure 1. In
Figure 2, the average diameter of pristine CNs samples was 211.43 ± 17.44 nm, which increased to 356.22 ± 26.45 nm on the neutralized CNs. This phenomenon could be explained by the presence of minimum water in NaOH solution (dissolved in methanol) causing the swelling or partial hydrolysis of the chitosan component during the neutralization process [
18]. The average diameters of passively-adsorbed SP (P-CNs) and covalently-immobilized SP (S-CNs) were 354.27 ± 22.29 and 349.83 ± 14.51 nm, respectively, which were similar to those of neutralized nanofibers.
Figure 2.
Average fiber diameters of CNs. The average diameter of nanofibers was determined by selecting 10 fields from each image and manually measuring fiber diameters.
Figure 2.
Average fiber diameters of CNs. The average diameter of nanofibers was determined by selecting 10 fields from each image and manually measuring fiber diameters.
2.2. Quantification of SP on Nanofibers
Next, we quantified the amount of passively-adsorbed or immobilized SP on nanofibers using ELISA. In
Figure 3, the amount of SP passively-adsorbed on P-CNs was 6.21 ± 4.32 ng. For S-CNs, the amount of immobilized SP was greatly affected by the concentration of SP. Accordingly, for CNs reacted with 10 ng of SP, the amount of immobilized SP was 5.89 ± 3.27 ng, whereas reactions of CNs with 50 and 100 ng of SP further increased the amount of SP to 26.34 ± 15.37 and 69.63 ± 16.82, respectively. At a higher concentration of SP (500 ng), the amount of immobilized SP (75.29 ± 24.31 ng) was similar to that at 100 ng, which appears to be a saturating concentration for immobilization of SP on CNs in our conditions. In our previous study, the releasing behavior of SP from CNs was evaluated
in vitro conditions over the course of seven days [
17]. Passively-adsorbed P-CNs showed a particularly notable initial burst release, with 81.99% ± 10.61% and 93.72% ± 4.91% of SP being released after 12 and 24 h, respectively, after which, a slight increased release of SP was observed. However, immobilized SP (50 and 100 ng) released slowly during seven days, compared to others.
Figure 3.
The amount of SP on nanofibers was analyzed using ELISA. SP was passively-adsorbed onto nanofibers (P-CNs) at a single concentration (100 ng) or actively immobilized on nanofibers (S-CNs) at different concentrations (10, 50, 100 and 500 ng).
Figure 3.
The amount of SP on nanofibers was analyzed using ELISA. SP was passively-adsorbed onto nanofibers (P-CNs) at a single concentration (100 ng) or actively immobilized on nanofibers (S-CNs) at different concentrations (10, 50, 100 and 500 ng).
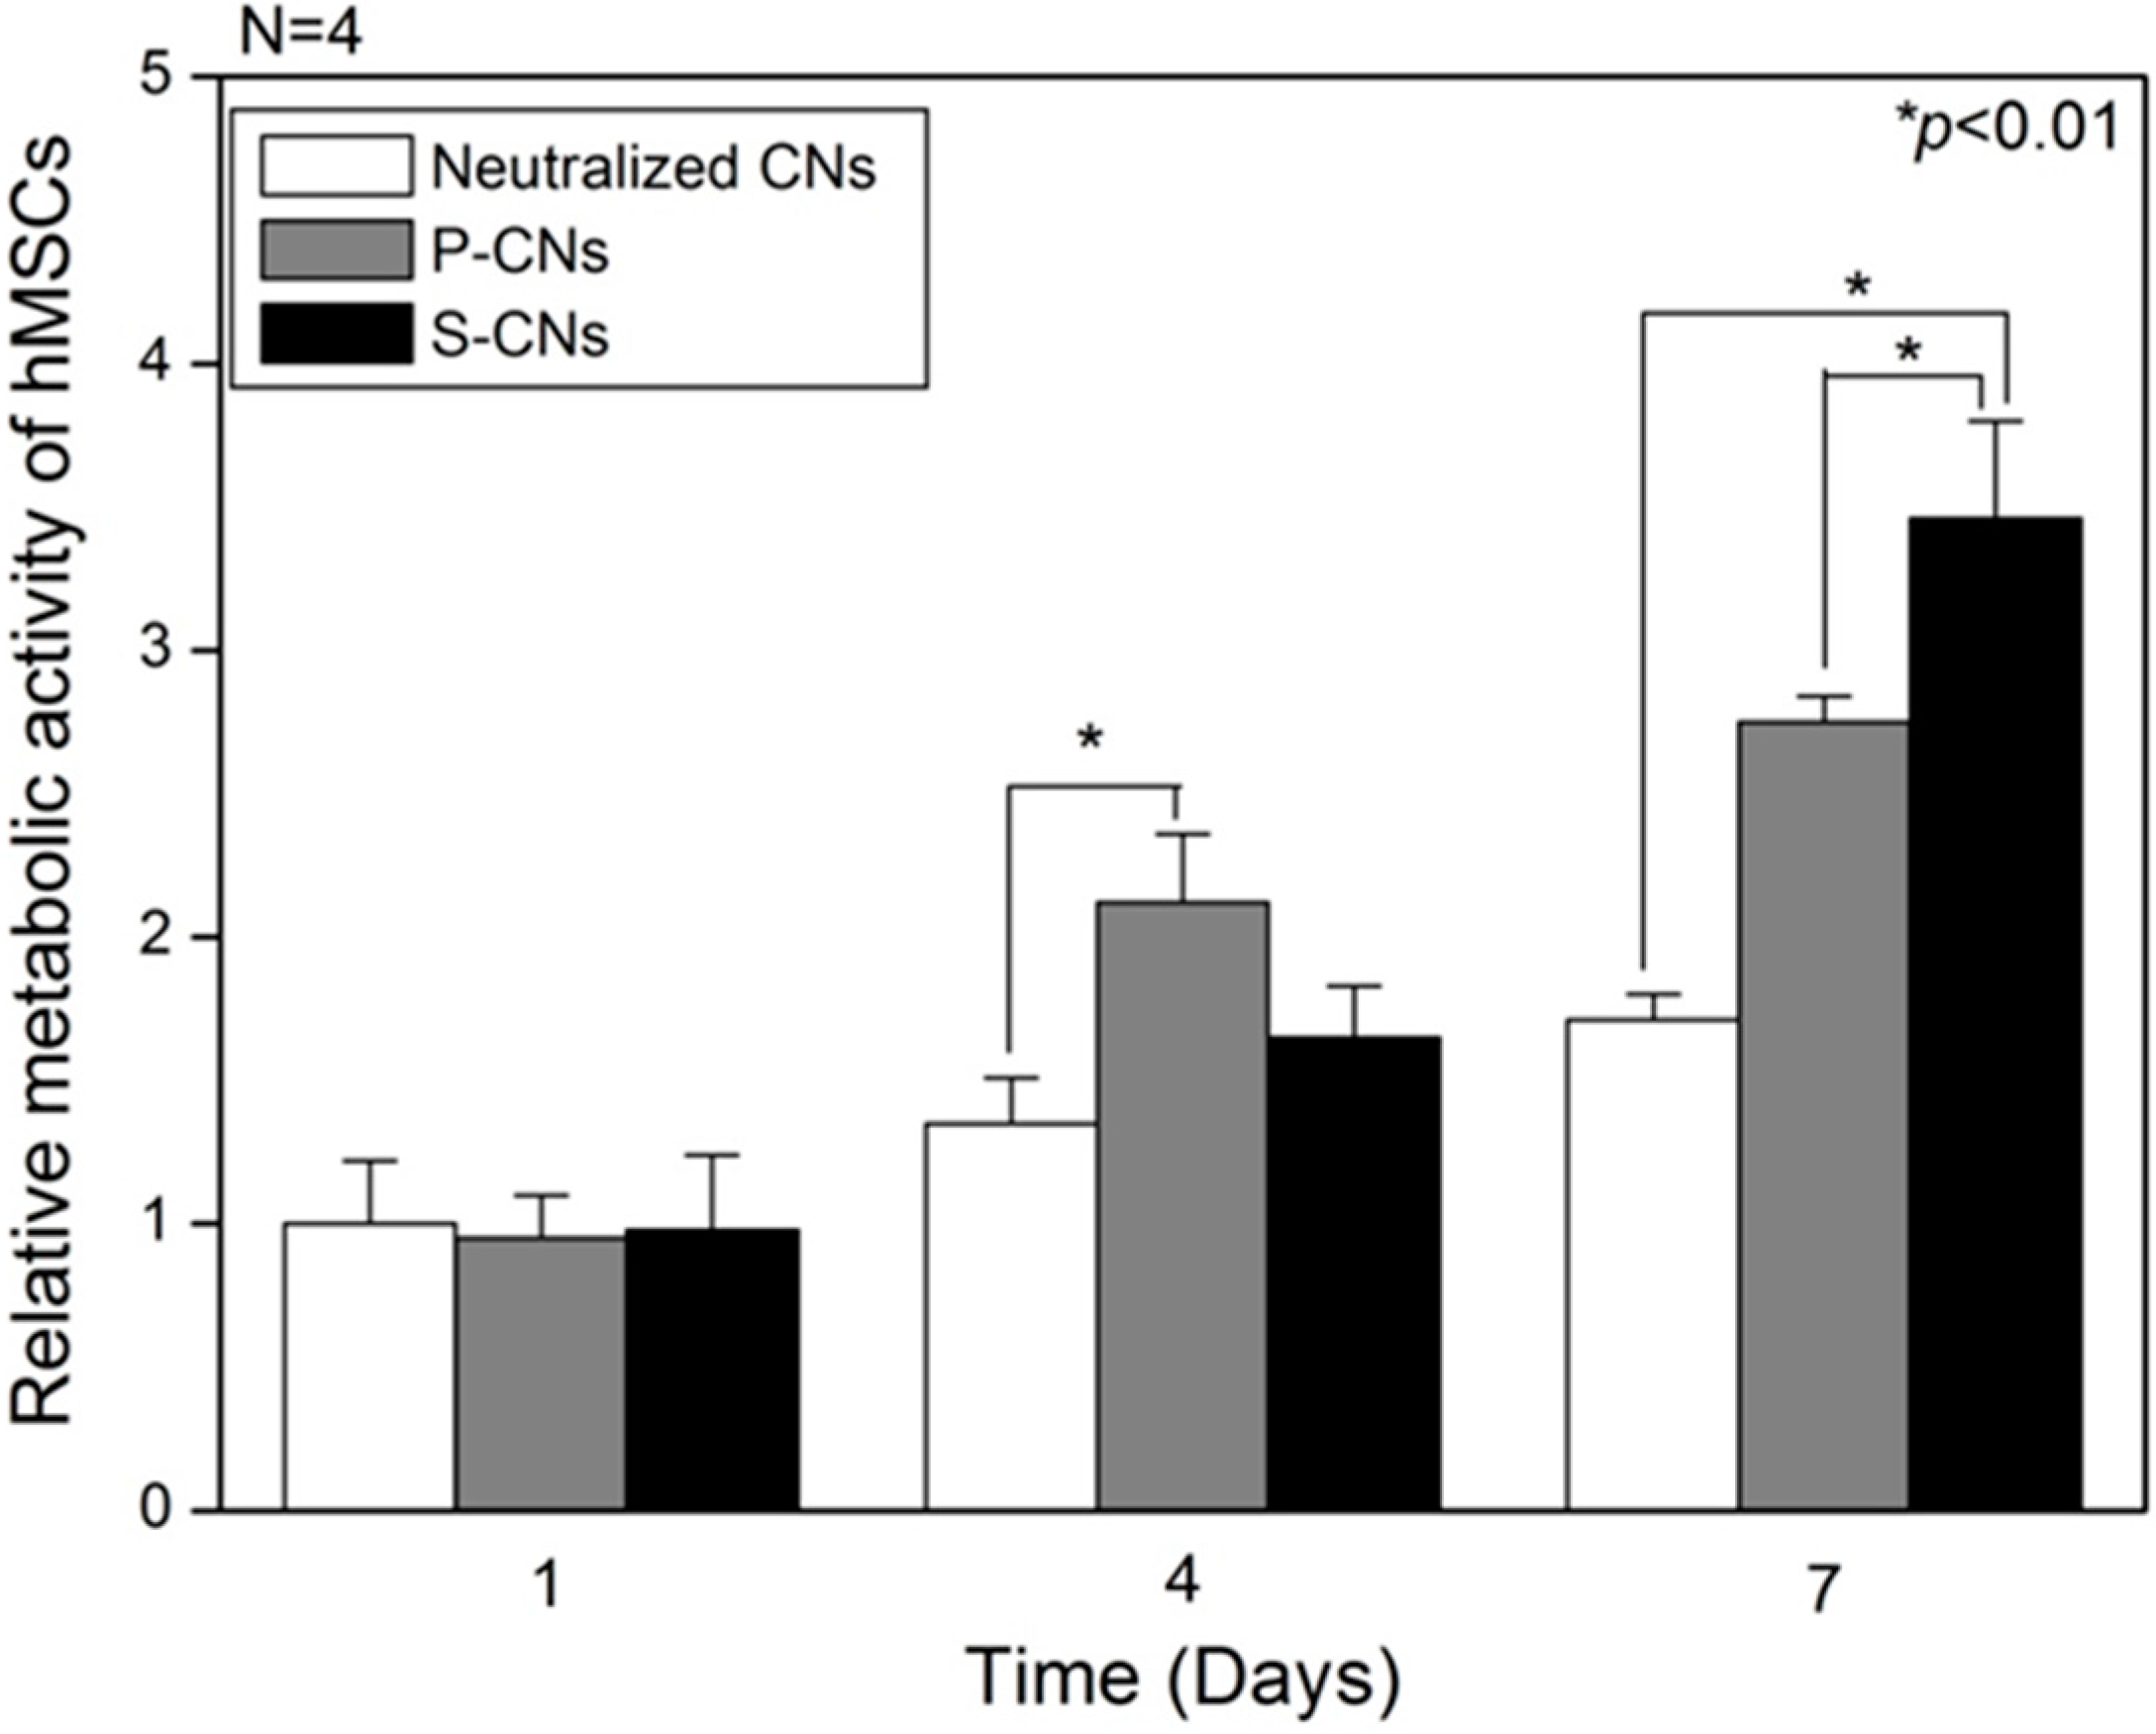
2.3. In Vitro Analysis of Nanofibers Using Human Mesenchymal Stem Cells
Next, we evaluated the metabolic activities of hMSCs on CNs using the Cell Counting Kit-8 (CCK-8, Dojindo Laboratories, Kumamoto, Japan) assay. As shown in
Figure 4, on Day 1 of culture, the metabolic activities of hMSCs were not significantly different among neutralized CN (1.0 ± 0.22), P-CN (0.95 ± 0.15) and S-CN (0.98 ± 0.26) samples. However, on Day 4, the metabolic activities of hMSCs on P-CN samples rapidly increased to 2.12 ± 0.24, compared to the slight increase for neutralized samples (1.35 ± 0.16) and SP-incorporated samples (1.65 ± 0.18). This enhanced induction of hMSC proliferation could be explained by the greater release of passively-adsorbed SP compared to other groups. On Day 7, the metabolic activities of hMSCs on SP-incorporated samples, S-CNs (3.46 ± 0.34), was higher than that for neutralized CNs (1.71 ± 0.09) and P-CNs (2.75 ± 0.08). The growth of hMSCs cultured on SP-incorporated substrates was greater than that of other groups up to and after seven days in culture. Thus, these results suggest that locally high concentrations and confined release of SP could account for the enhanced cellular activities of hMSCs. As consistent results, Hong
et al. reported that SP enhanced the growth of MSCs, even though the SP (at a similar concentration) was physically adsorbed or covalently bound [
10].
Figure 4.
The relative metabolic activity of hMSCs on neutralized CNs, P-CNs and S-CNs in conditioned (serum free) media over the course of seven days.
Figure 4.
The relative metabolic activity of hMSCs on neutralized CNs, P-CNs and S-CNs in conditioned (serum free) media over the course of seven days.
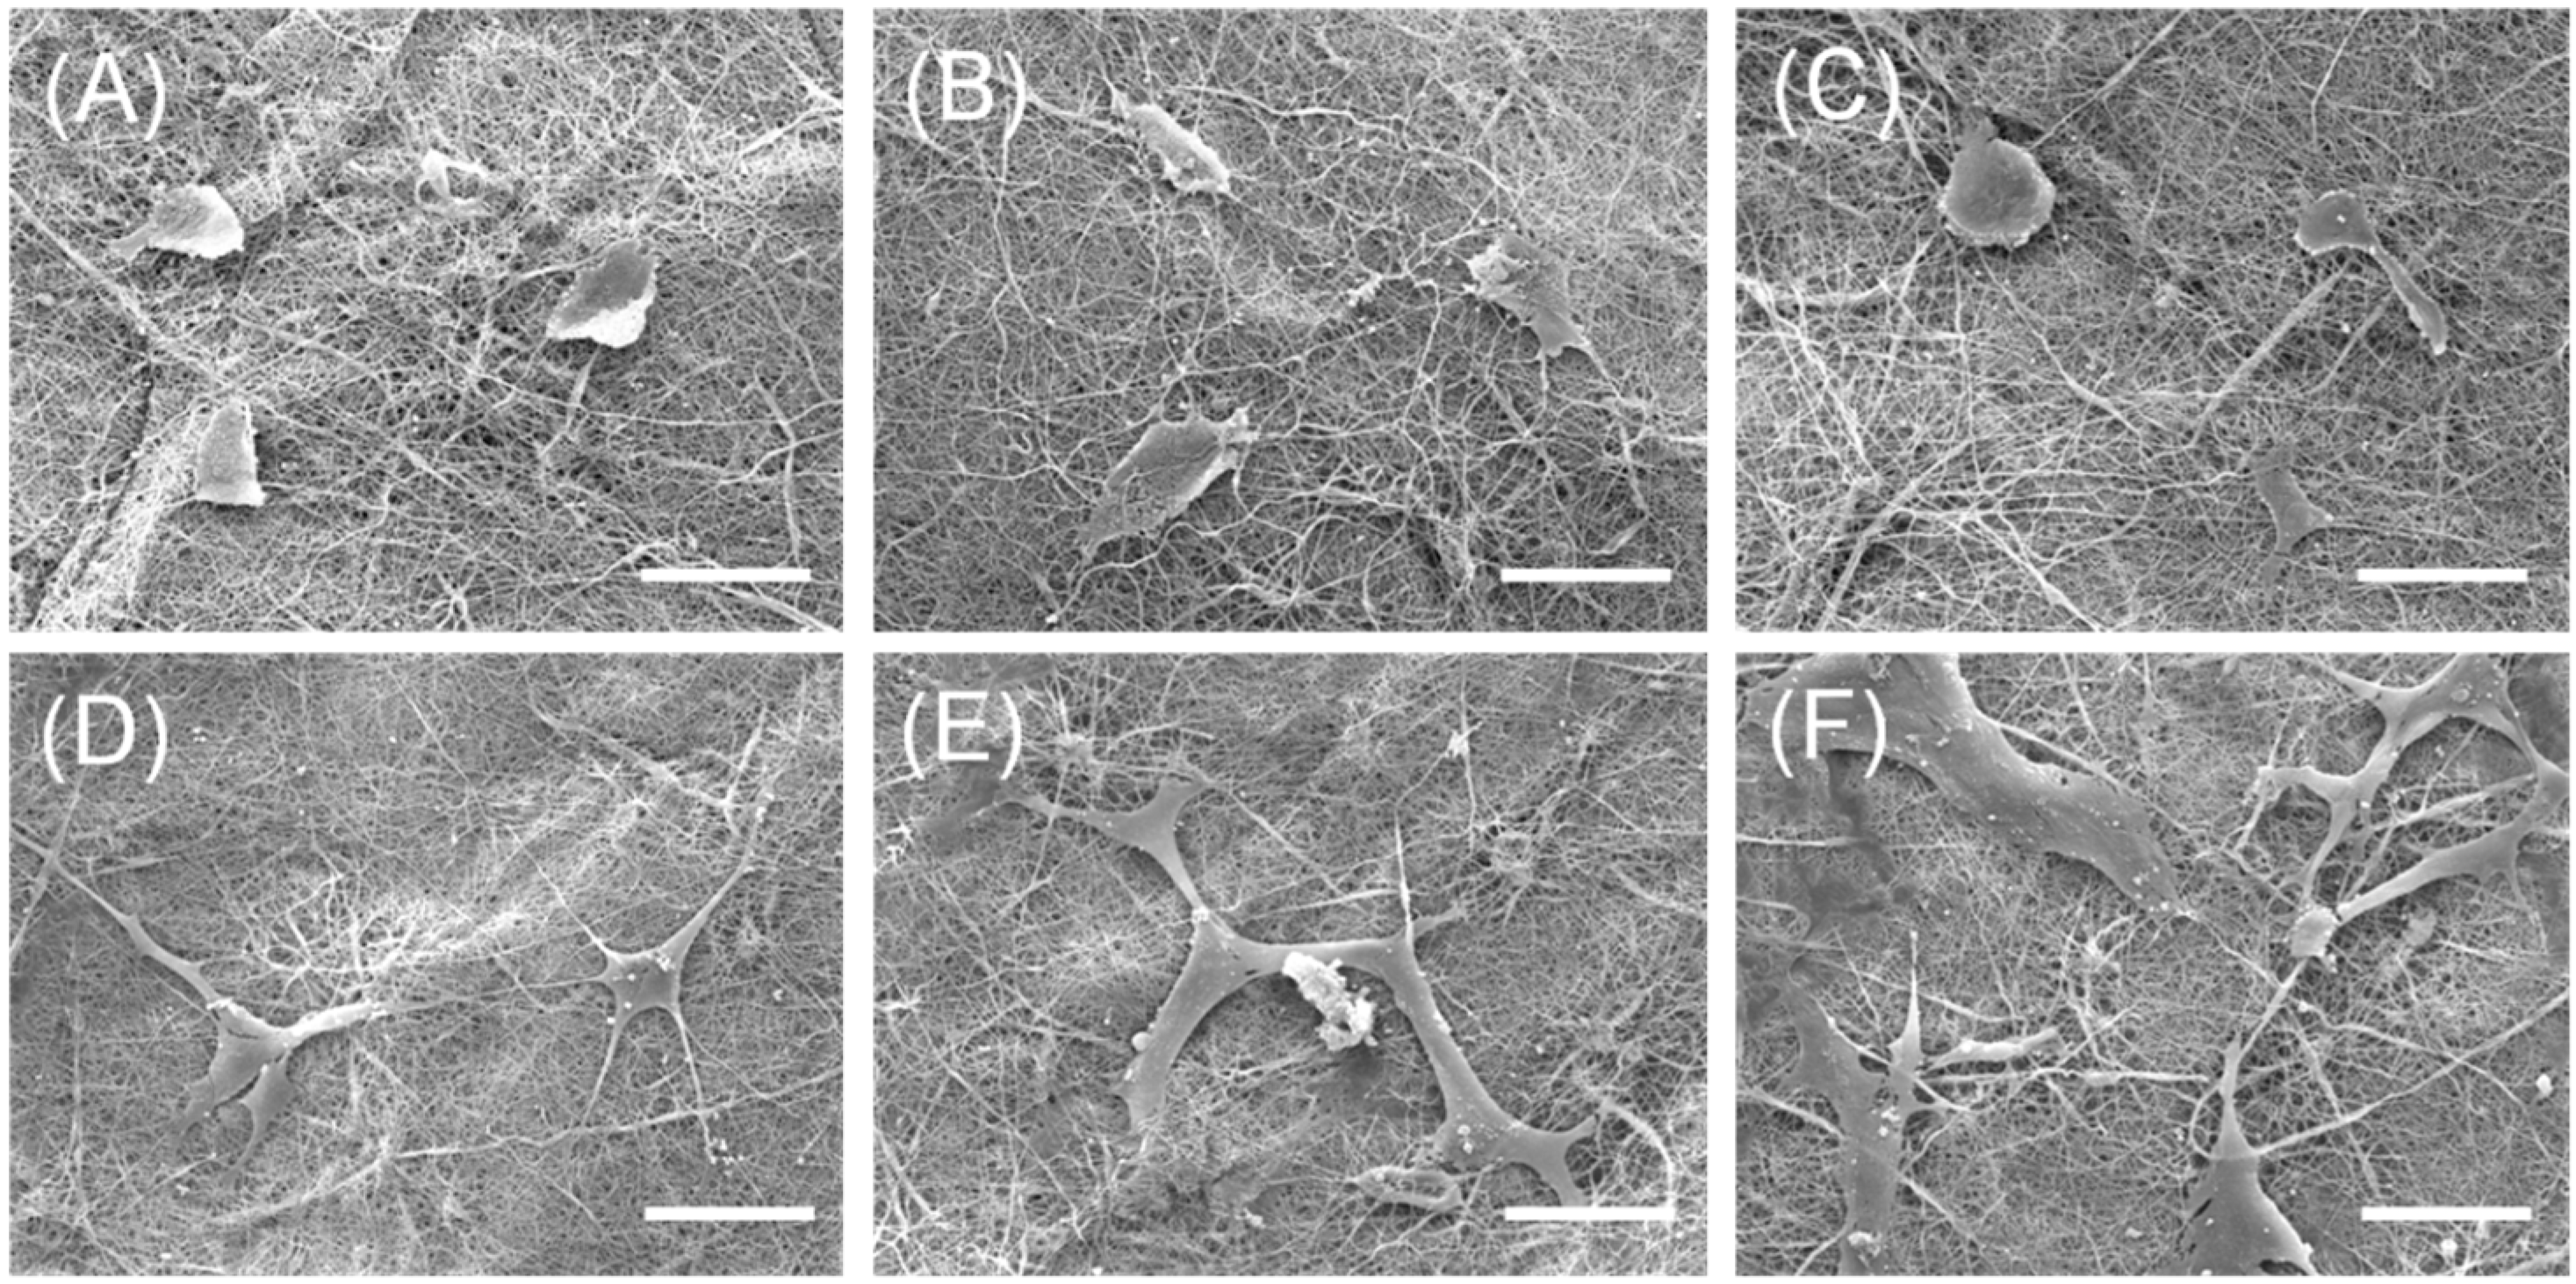
Then, the effects of SP on cultured hMSCs were confirmed by SEM analyses. On Day 1, the cultured hMSCs on all CNs samples exhibited spindle- or round-shaped cell morphologies, which were not significantly different regardless of the presence of SP, as shown in
Figure 5. However, after seven days, hMSCs on SP-incorporated substrates (S-CNs) showed a larger number of cell density, compared to those of other substrates, showing a mature filopodia (
Figure 5F). That is, hMSCs on neutralized substrates showed thinner morphologies and lower cells density, compared to hMSCs on SP-incorporated substrates. These morphological differences of hMSCs on nanofibers were correlated with CCK-8 assays (
Figure 4).
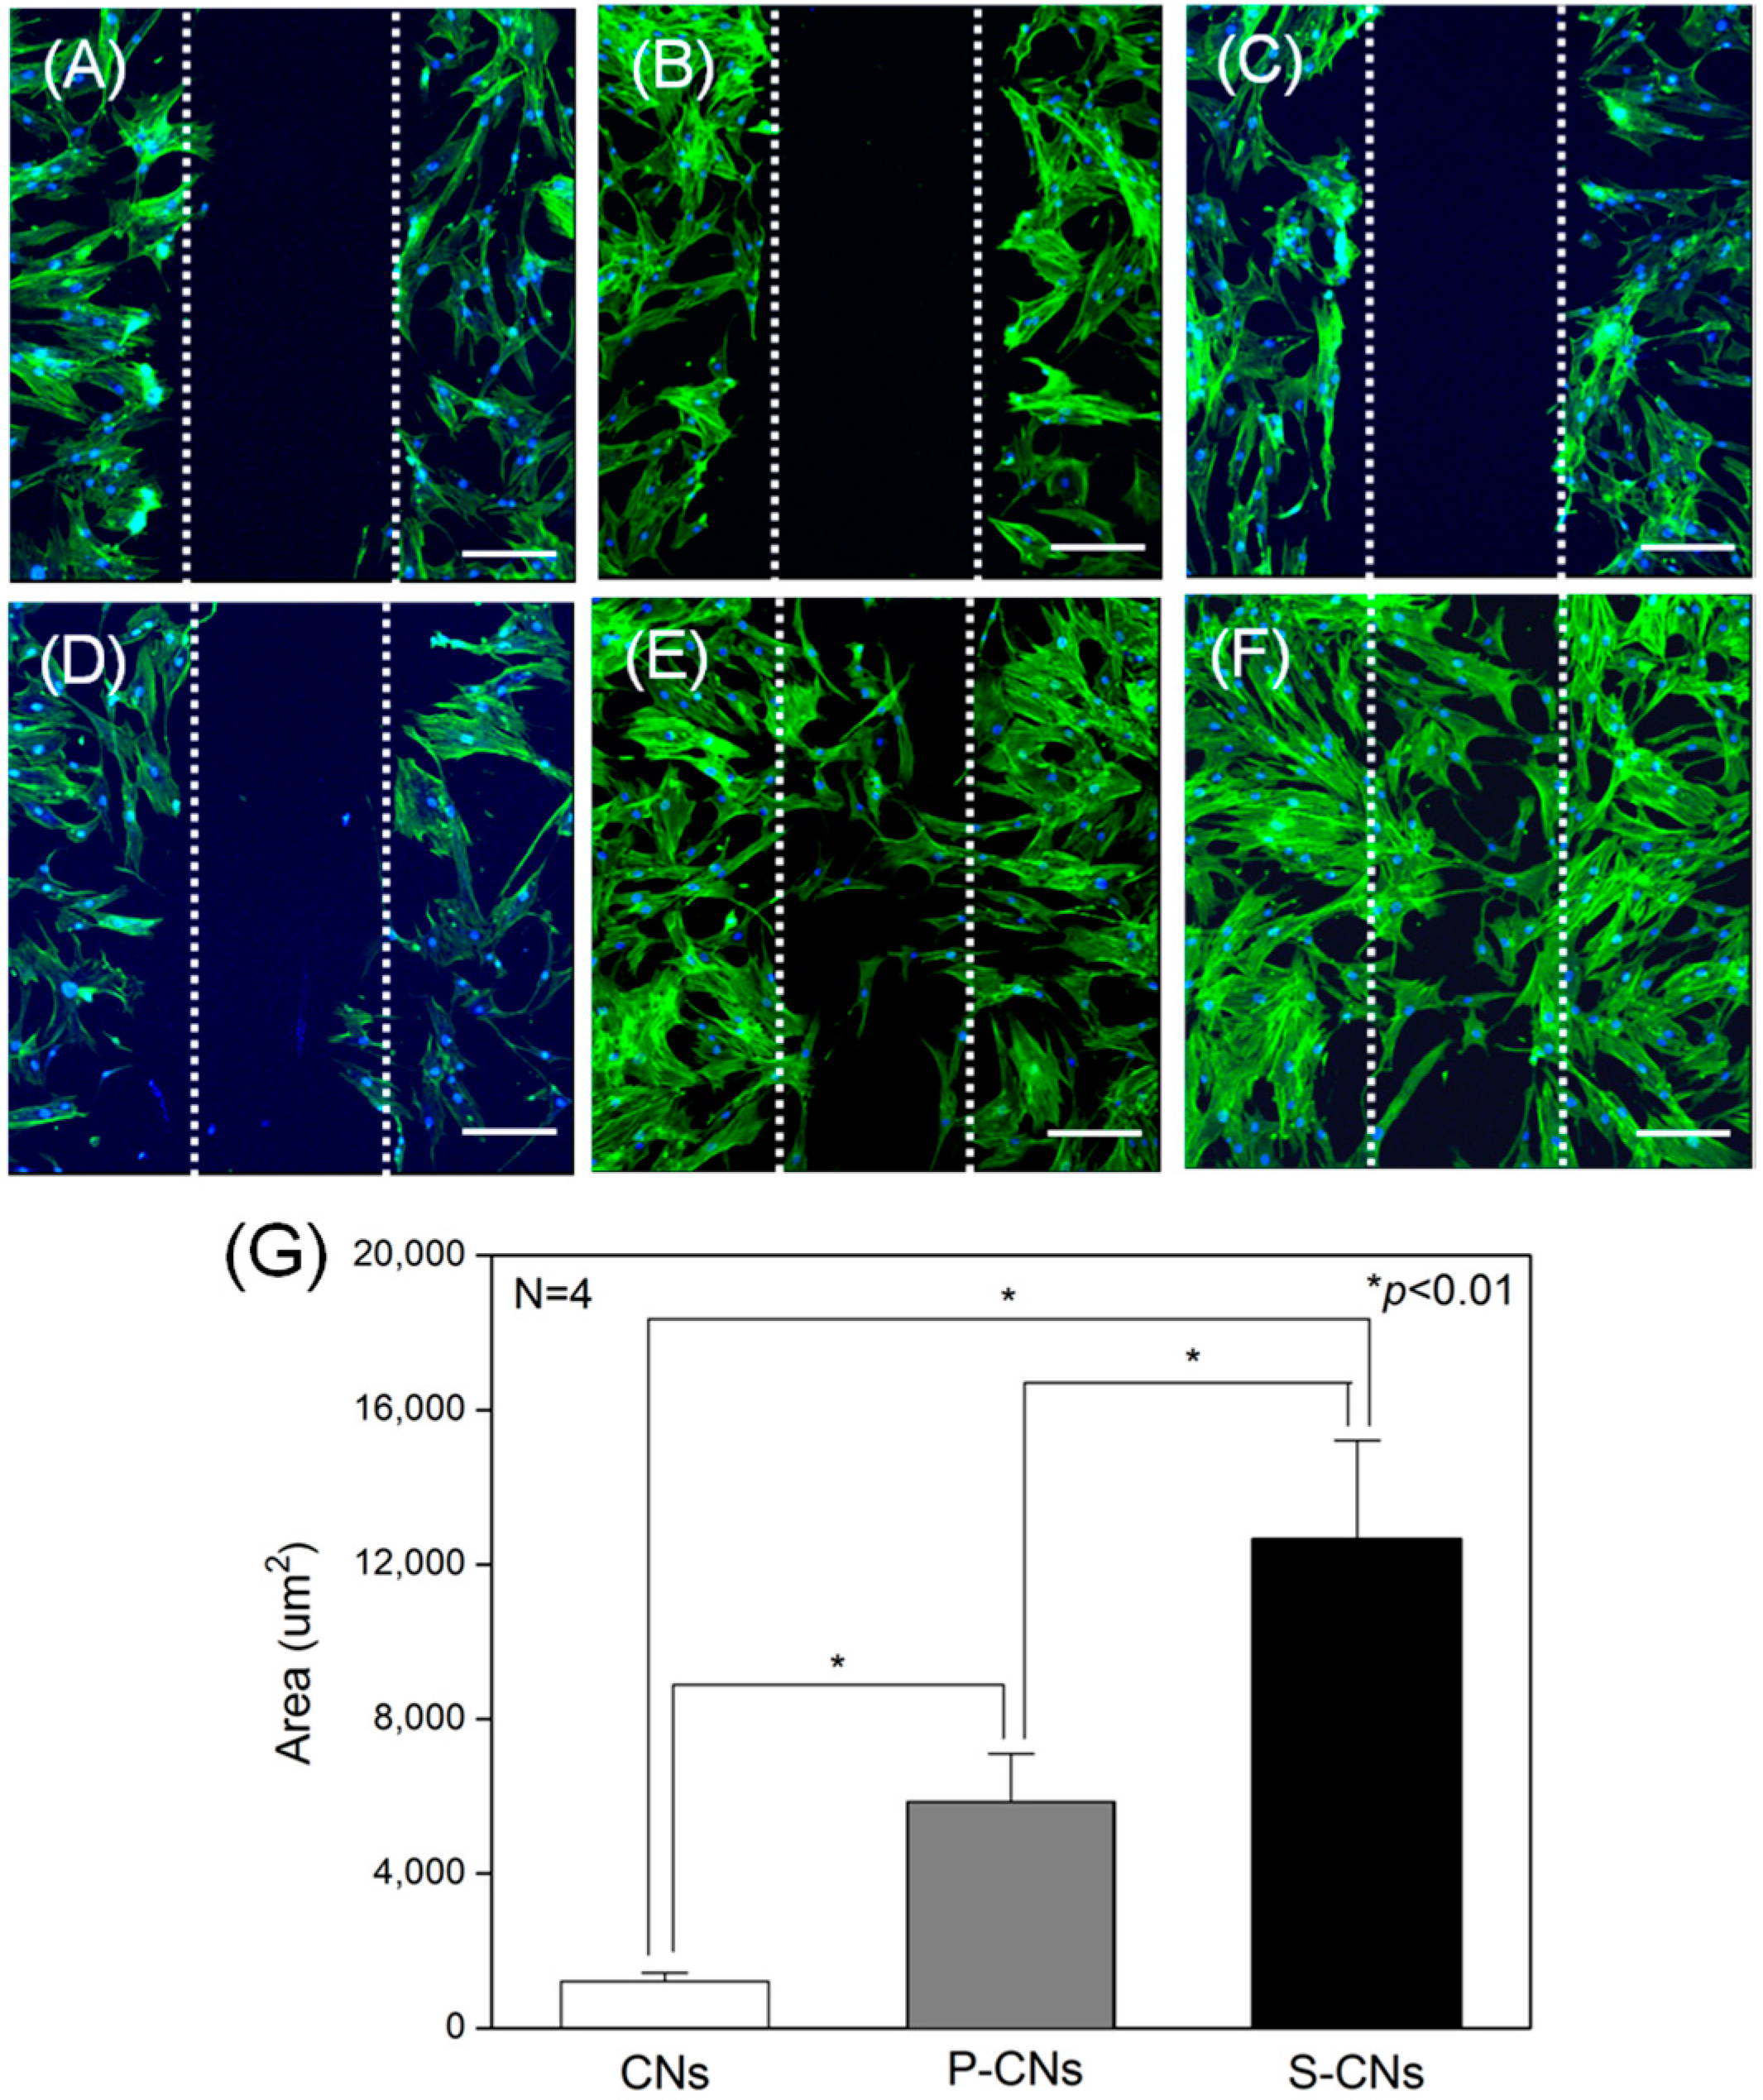
Next, we evaluated the effects of immobilized SP on the migration behavior of hMSCs seeded on CNs, as shown in
Figure 6. An initial wound edge of approximately 100 μm was prepared across the length of each sample using sterile syringe needles (
Figure 6A–C). After 48 h in culture, hMSCs cultured on P-CNs and S-CNs (
Figure 6E,F) migrated faster and in larger numbers compared to the rare migration of hMSCs cultured on neutralized CNs, an effect that was dependent on SP concentration (
Figure 6D). To quantify this migratory behavior, we evaluated the migrated area from fluorescence images. As shown in
Figure 6G, the migrated area of hMSCs on neutralized CNs was 1209.83 ± 226.48 μm
2. In keeping with the results shown in
Figure 6E,F, the area of hMSCs increased to 5854.48 ± 1246.57 and 12,763.69 ± 2537.54 μm
2 for the P-CN and S-CN samples, respectively. These migration behaviors of hMSCs are consistent with previous reports that SP plays a strong chemotaxis role, inducing hMSC migration into the periphery
in vitro and
in vivo [
11,
19,
20]. Notably, the biological activity of SP was preserved in SP-immobilized nanofibers, a possible critical factor for
in vivo applications.
Figure 5.
Representative SEM images of hMSCs cultured on neutralized CNs, P-CNs and S-CNs for seven days. (A–C) SEM images of hMSCs on neutralized CNs (A), P-CNs (B) and S-CNs (C) on Day 1; (D–F) hMSCs on neutralized CNs (D), P-CNs (E) and S-CNs (F) on Day 7. Scale bar: 50 μm.
Figure 5.
Representative SEM images of hMSCs cultured on neutralized CNs, P-CNs and S-CNs for seven days. (A–C) SEM images of hMSCs on neutralized CNs (A), P-CNs (B) and S-CNs (C) on Day 1; (D–F) hMSCs on neutralized CNs (D), P-CNs (E) and S-CNs (F) on Day 7. Scale bar: 50 μm.
Figure 6.
hMSCs were cultured on CNs in an in vitro wound-healing model. (A–C) Dotted white lines represent initial wound edges at 0 h for neutralized CNs (A), P-CNs (B) and S-CNs (C); (D–F) After 48 h, cells on neutralized CNs (D), P-CNs (E) and S-CNs (F) were stained for actin filaments (green) and nuclei (blue) using FITC-phalloidin and DAPI, respectively. Scale bar: 50 μm; (G) Quantitative analysis of the migrated area of hMSCs from (D–F).
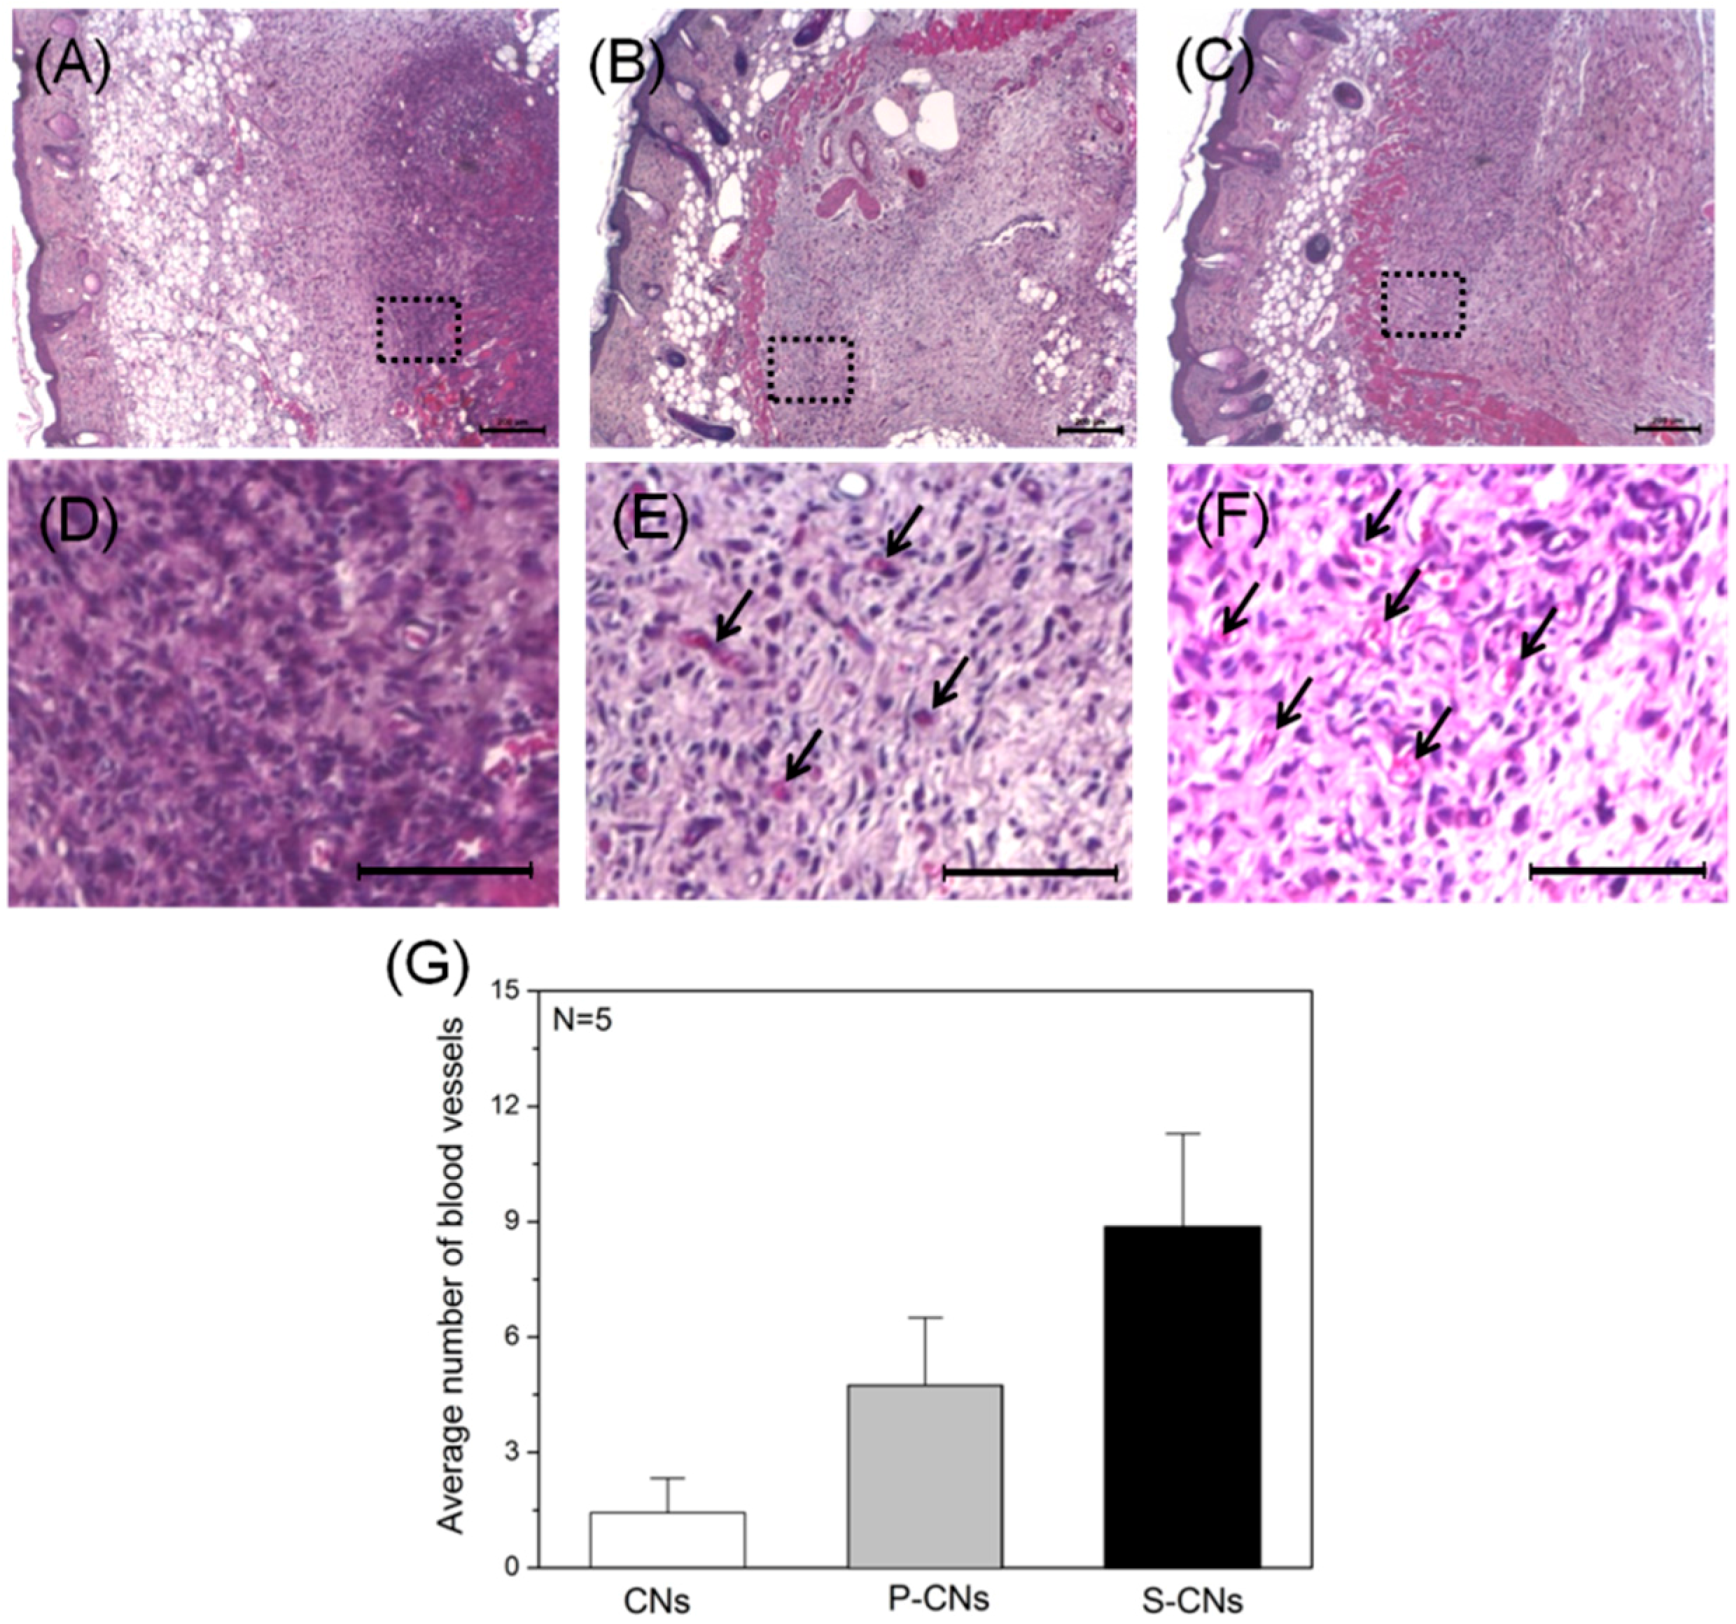
2.4. In Vivo Evaluation of Foreign Body Reaction and Recruited Stem Cells
To evaluate the
in vivo biological effects of neutralized and SP-incorporated CNs, we subcutaneously implanted each sample into Balb/C nude mice. H&E-stained images of each sample one week after implantation (
Figure 7A–D) show that neutralized CNs evoked an FBR that was mediated by inflammatory host cells (stained with dark violet). However, SP-incorporated CNs showed a weaker FBR and a larger number of blood vessels (
Figure 7E,F, black arrows) around implants.
Figure 7.
Histological images of implanted CNs H&E-stained after one week. (A–C) Images of neutralized CNs (A), P-CNs (B) and S-CNs (C) samples within subcutaneous tissue; (D–F) Magnified images of the dotted line regions in (A–C), respectively. SP-incorporated samples (B,C) showed weaker foreign body reactions (FBRs) and larger numbers of blood vessels (dark arrows) compared to other samples. Scale bar: 200 μm; (G) Quantitative analysis of blood vessels from (D–F).
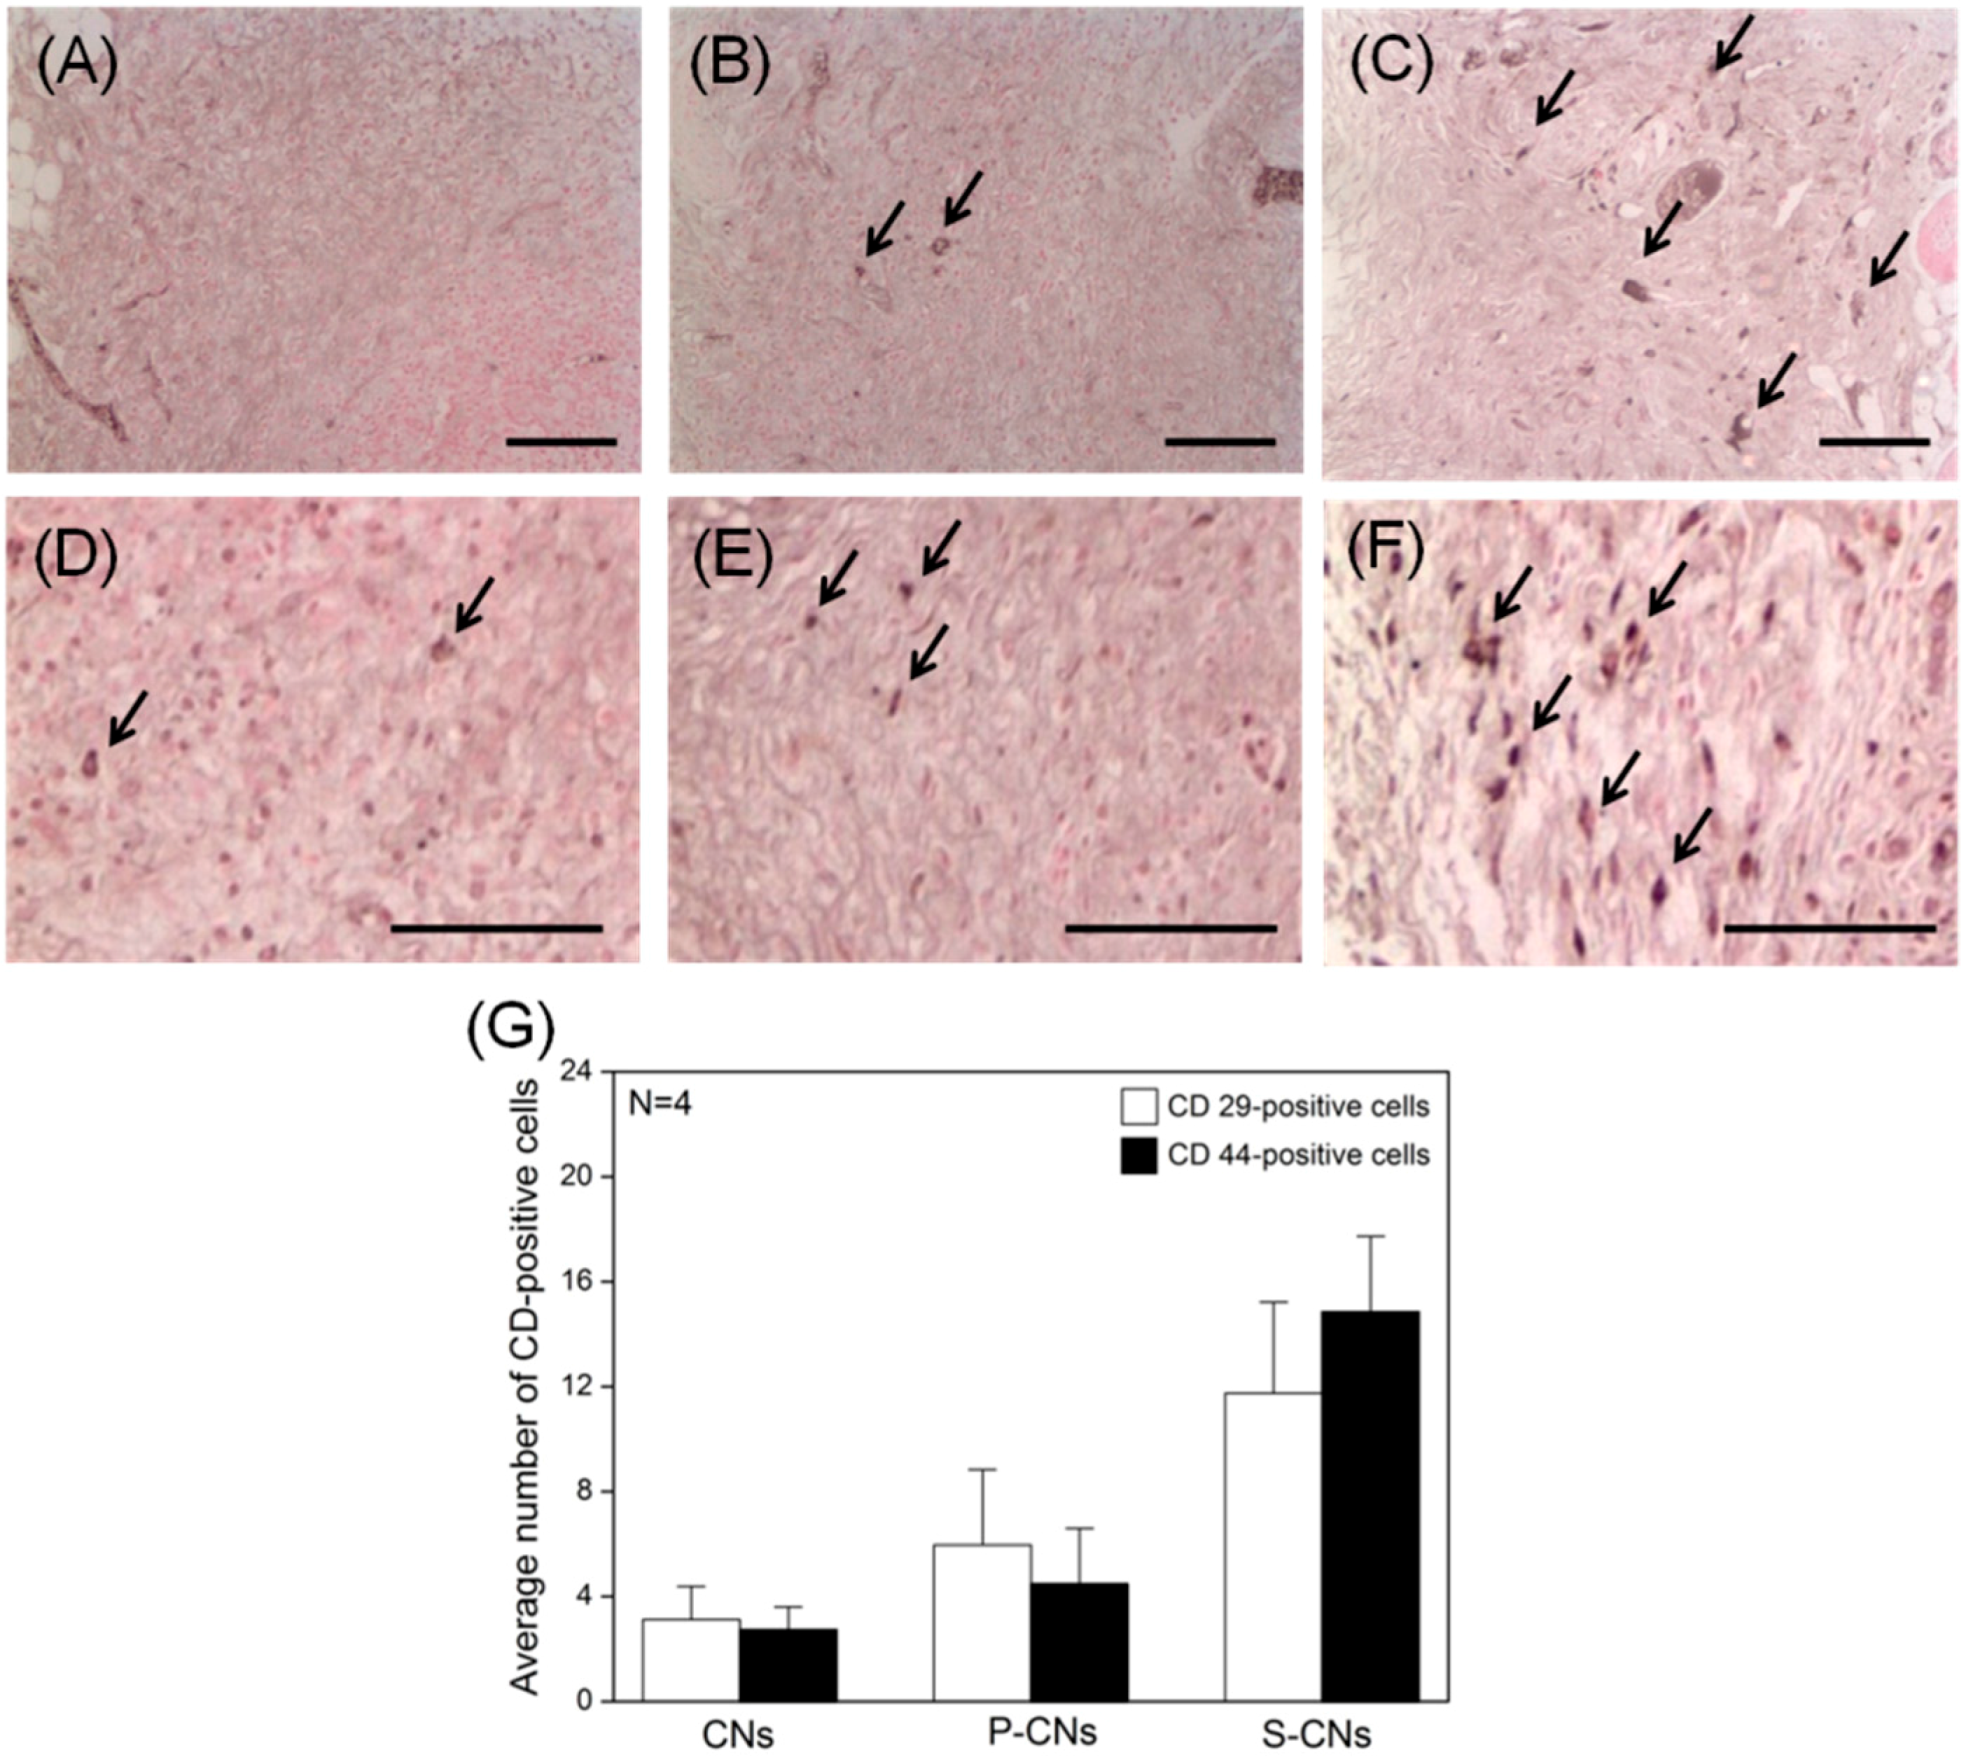
Finally, to evaluate the response of host stem cells to CNs, we performed immune-histochemical staining of each explanted CN for the hMSC-specific markers CD29 and CD44, as well as integrin β-1 and glycoprotein, at seven days post-implantation. As shown in
Figure 8, these
in vivo experiments revealed that the proportion of CD29- and CD44-positive hMSCs was significantly lower in neutralized CNs than in SP-conjugated groups (
Figure 8A–D). A quantitative analysis of recruited hMSCs, performed by evaluating the proportion of CD marker-positive cells from immunohistochemically-stained images (
Figure 8G), showed that the average number of CD29- and CD44-positive hMSCs was 3.12 ± 1.27 and 2.75 ± 0.86, respectively. The number of recruited CD29-positive hMSCs for P-CNs and S-CNs increased to 5.97 ± 2.87 and 4.46 ± 2.14, respectively, whereas the corresponding increases for CD44-positive cells were 11.75 ± 3.47 and 14.86 ± 2.86. Based on our
in vitro SP-release studies, these results suggest that SP covalently conjugated to CNs maintains its biological activity, is released slowly and is capable of recruiting MSCs
in vivo [
17]. More importantly, the strategy of using bioactive molecules may allow stem cell recruiting factors to persist longer in an implant, allowing them to promote long-term tissue regeneration [
21]. Although the specific source of the recruited hMSCs is not yet known, bone marrow and/or adipose tissues are possible origins [
22].
Figure 8.
In vivo hMSC recruitment in CNs retrieved after one week. (A–C) Images showing immunohistochemical staining of CD29-positive hMSCs (dark arrows) in neutralized CNs (A), P-CNs (B) and S-CNs (C); (D–F) Images of CD44-positive hMSCs (dark arrows) in neutralized CNs (D), P-CNs (E) and S-CNs (F). SP-incorporated samples showed a larger number of CD29- and CD44-positive cells compared to the pristine sample. Scale bar: 100 μm. (G) Quantitative analysis of CD marker-positive hMSCs from (A–F).
Our study showed that SP-incorporated CNs promote the cellular responses of hMSCs in vitro and in vivo, compared to neutralized CNs. Notably, SP incorporated on a matrix, maintained its biological activity and could greatly enhance the recruitment of hMSCs into implanted nanofibers under in vivo conditions. Moreover, various combinations of regulatory bioactive molecules, such as cytokines and cell adhesion molecules, could be immobilized to the positive amino groups of chitosan to simultaneously enhance local induction, migration and recruitment of MSCs. Taken together, these findings suggest that our SP delivering system could be extended to various therapeutic applications using MSC for the repair of tissue injury.


