1. Introduction
Quercetin is a prominent food bioactive flavonol whose daily intake has considerably increased due to its use as food supplements [
1] and mainly due to the “eat five fruits and vegetables a day” international recommendation. Unfortunately, quercetin aglycone suffers from low water solubility, poor bioavailability, and instability [
2]. Quercetin pharmacokinetics and metabolism have been extensively studied and it was found that after deglycosylation of respective glycosides in the small intestine it is preferentially sulfated, glucuronidated or
O-methylated by Phase II biotransformation enzymes [
3,
4]. To date, in most of the studies on bioavailability, the level of quercetin in biological samples (mostly blood plasma and/or urine) was measured as the sum of free and conjugated (after conjugate hydrolysis by gut enzymes from
Helix pomatia) aglycones). Specific determination of conjugates is typically accomplished using HPLC/MS [
2]. The following quercetin conjugates were thus identified in human plasma: quercetin-3-
O-glucuronide, quercetin glucuronide sulfate (without determination of the conjugation positions), isorhamnetin-3-
O-glucuronide, quercetin-3′-
O-sulfate and isorhamnetin [
5]. However, the identification of the exact structures of these metabolites (i.e., position of conjugation) requires authentic and well-characterized standards.
Numerous attempts to prepare authentic standards of quercetin metabolites have been published to date. Quercetin-3′-
O-sulfate, quercetin-7-
O-sulfate, and quercetin-4′,7-
O-disulfate were previously prepared by chemical synthesis, which involves a laborious series of protection and deprotection steps, and purification steps with overall low yields and high consumption of reagents [
6]. The reaction of quercetin with SO
3-triethylamine complex without protection steps led to a complex mixture of mono- and disulfates, which was difficult to purify and consequently yields were very low, typically ranging from 0.8% to 16%. After separation by preparative HPLC, the fractions containing monosulfates at C-3 and C-7 in ca 90% purity were obtained; sulfates at C-3′ and C-4′ were not separable. Moreover, the products were characterized by
1H NMR only [
7]. A chemical synthesis of a whole series of quercetin sulfates, without providing their yields and purities, was recently reported, but the compounds were mostly characterized by LC-MS [
3]. On the other hand, alternative methods to produce sulfated metabolites involve chemoenzymatic procedures. The main advantage of these procedures is that the synthesis takes place in mild conditions without the use of expensive, potentially toxic reagents and solvents. Arylsulfotransferase (AST) from
Eubacterium A-44 was exploited for quercetin sulfation yielding quercetin-3,3′-di-
O-sulfate and quercetin-3,3′,7-tri-
O-sulfate without indication of purity or yields [
8]. AST from
Desulfitobacterium hafniense [
9,
10] preferentially sulfated the catechol moiety of the flavonols [
11]; in the case of quercetin, inseparable mixtures of quercetin-3′-
O-sulfate and quercetin-4′-
O-sulfate were previously prepared by us [
11] and others [
10]. The aim of the present study was therefore to prepare pure quercetin sulfates and to evaluate their basic biophysical properties.
3. Materials and Methods
3.1. Chemicals and Reagents
Quercetin hydrate, 1,1-diphenyl-2-picrylhydrazyl (DPPH) radical, antioxidant assay kit (CS0790), pooled microsomes from male rat liver (M9066), dimethyl sulfoxide (DMSO), p-NPS, tert-butyl hydroperoxide, trolox, and other chemicals were obtained from Sigma-Aldrich (Prague, Czech Republic). Folin-Ciocalteau reagent was purchased from Merck (Prague, Czech Republic), DMPD and FRAP kits from Bioquochem (Llanera, Spain).
3.2. NMR Spectroscopy
NMR spectra were recorded on a Bruker Avance III 600 MHz spectrometer (600.23 MHz for 1H, 150.94 MHz for 13C) at 30 °C in DMSO-d6. Residual signal of solvent (δH 2.500 ppm, δC 39.60 ppm) was used as an internal standard. NMR experiments 1H NMR, 13C NMR, gCOSY, gHSQC, and gHMBC were performed using the manufacturer’s software (Topspin 3.2, Bruker BioSpin, Rheinstetten, Germany). 1H NMR and 13C NMR spectra were zero filled to fourfold data points and multiplied by window function before Fourier transformation. Two-parameter double-exponential Lorentz-Gauss function was applied for 1H to improve resolution and line broadening (1 Hz) was applied to get better 13C signal-to-noise ratio. Chemical shifts are given in δ-scale with digital resolution justifying the reported values to three (δH) or two (δC) decimal places, respectively.
3.3. Mass Spectrometry
Mass spectra in the negative ion mode were measured using a LTQ Orbitrap XL hybrid mass spectrometer (ThermoFisher Scientific, Waltham, MA, USA) equipped with an electrospray ion source. The samples were dissolved in methanol and introduced into the mobile phase flow (methanol/water 4:1; 100 μL/min) using a 2-μL loop. Spray voltage, capillary voltage, tube lens voltage and capillary temperature were 4.0 kV, −16 V, −120 V, and 275 °C, respectively.
3.4. Analytical HPLC–PDA
All analytical HPLC analyses were performed with the Shimadzu Prominence System (Shimadzu, Kyoto, Japan) consisting of a DGU-20A mobile phase degasser, two LC-20AD solvent delivery units, a SIL-20AC cooling auto sampler, a CTO-10AS column oven, and a SPD-M20A diode array detector. Chromatographic data were collected and processed using Shimadzu LabSolutions software (version 5.75 SP2, Shimadzu Corporation, Tokyo, Japan) at a 40 Hz rate.
The separation of quercetin sulfates was achieved on the core-shell silica column Kinetex 5 μm PFP (pentafluorophenyl), 150 mm × 4.6 mm (Phenomenex, CA, USA), thermostated at 40 °C and equipped with a guard column (Analytical Guard Cartridge System, Security guard cartridges (PFP 4 × 3.0 mm ID), Phenomenex)) using linear gradient: water/trifluoroacetic acid (100/0.1, v/v, phase A) and methanol (phase B); 0–25 min 40–80% B; flow rate 0.6 mL/min. The PDA data were acquired in the 200–450 nm range and the wavelength 360 nm signal was extracted.
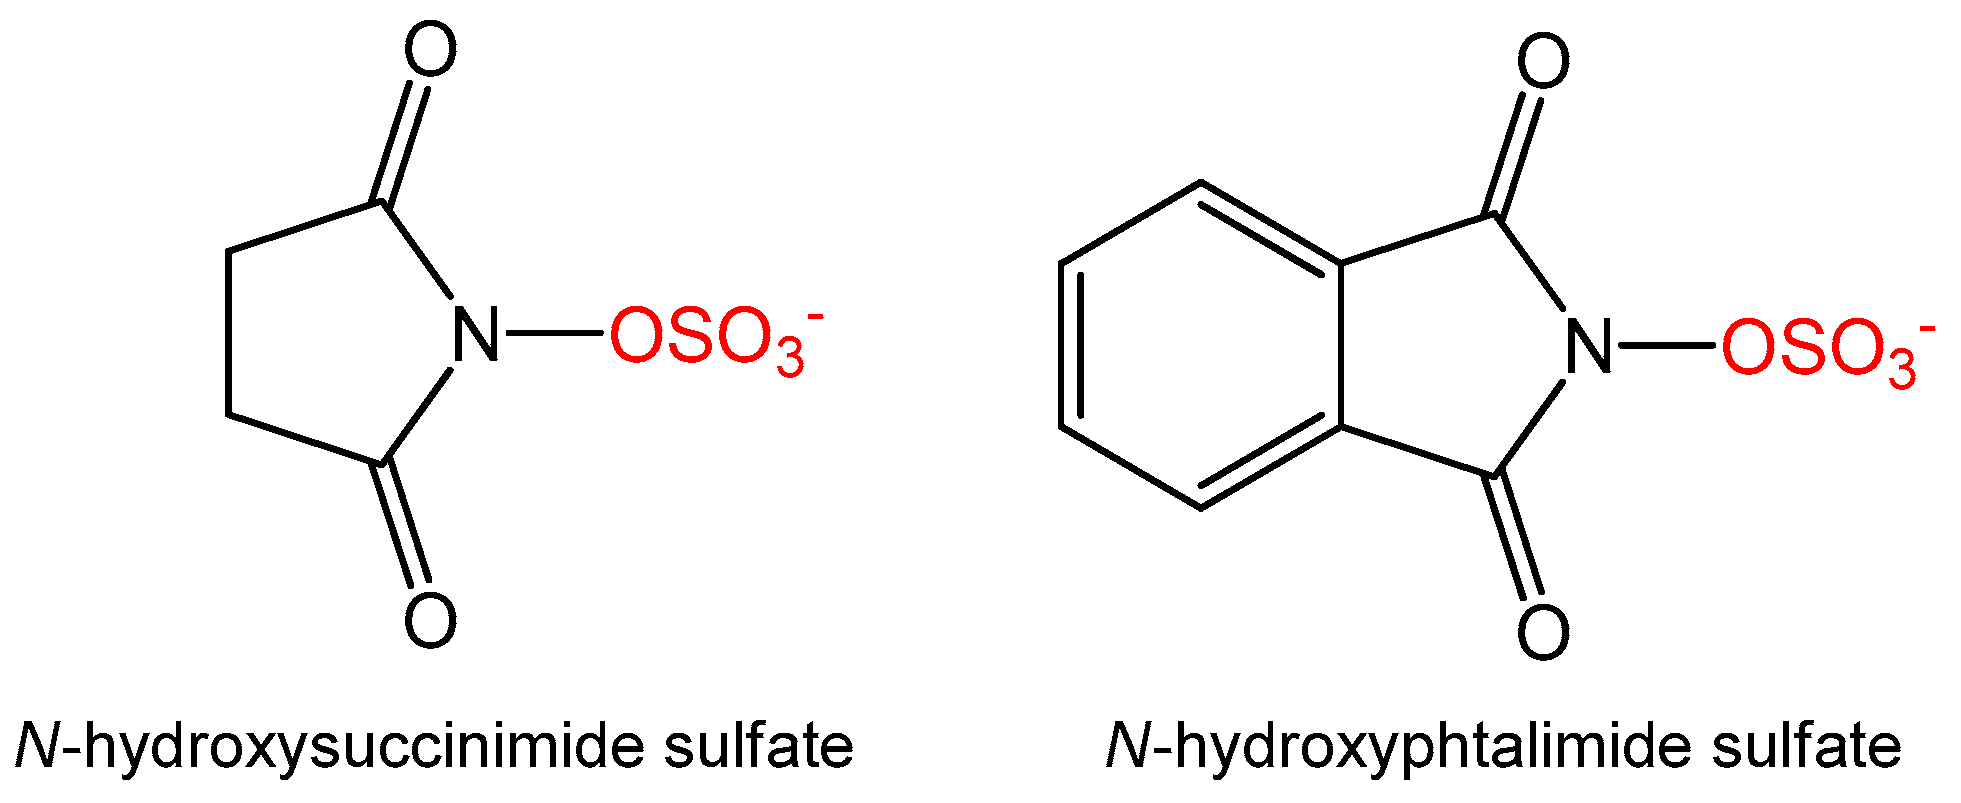
3.5. Synthesis of Alternative Sulfate Donors
N-Hydroxysuccinimide (115 mg, 1 mmol, 1 eq) was dissolved in dioxane (5 mL) and NaH, in a 60% oil dispersion (44 mg, 1.1 mmol, 1.1 eq), was added. The whole was stirred at room temperature for 1 h before slow addition of sulfur trioxide triethylamine complex (199 mg, 1.1 mmol, 1.1 eq). The mixture was stirred overnight until TLC analysis (9:1 EtOAc:MeOH) showed full consumption of starting material. The reaction was quenched with water and the aqueous layer was washed with EtOAc (2 × 10 mL) and concentrated in vacuo. The solid was washed in hot MeOH (2 × 5 mL) to yield N-succinimide sulfate as a white solid (109 mg, 56%, ESI–m/z 194 [M − H]+).
N-Hydroxyphthalimide (326 mg, 2 mmol, 1 eq) was dissolved in dioxane (5 mL) and to this was added NaH in a 60% oil dispersion (88 mg, 2.2 mmol, 1.1 eq). The reaction mixture was stirred at room temperature for 1 hour before slow addition of sulfur trioxide triethylamine complex (398 mg, 2.2 mmol, 1.1 eq). The reaction was kept at room temperature overnight and TLC (95:5 EtOAc:MeOH) analysis showed full consumption of starting material. The reaction was quenched with water and the aqueous layer was washed with EtOAc (2 × 10 mL) and concentrated in vacuo. The solid was washed in hot MeOH (2 × 5 mL) to yield N-phthalimide sulfate as a white solid (79 mg, 17%, ESI–(m/z) 242 [M − H]+). BaCl2 test was used to control the presence of both sulfates during the purification procedures.
3.6. AST from Desulfitobacterium Hafninense
The expression of the AST enzyme was performed as described by van der Horst et al. [
24] with the modifications described in our previous work [
11].
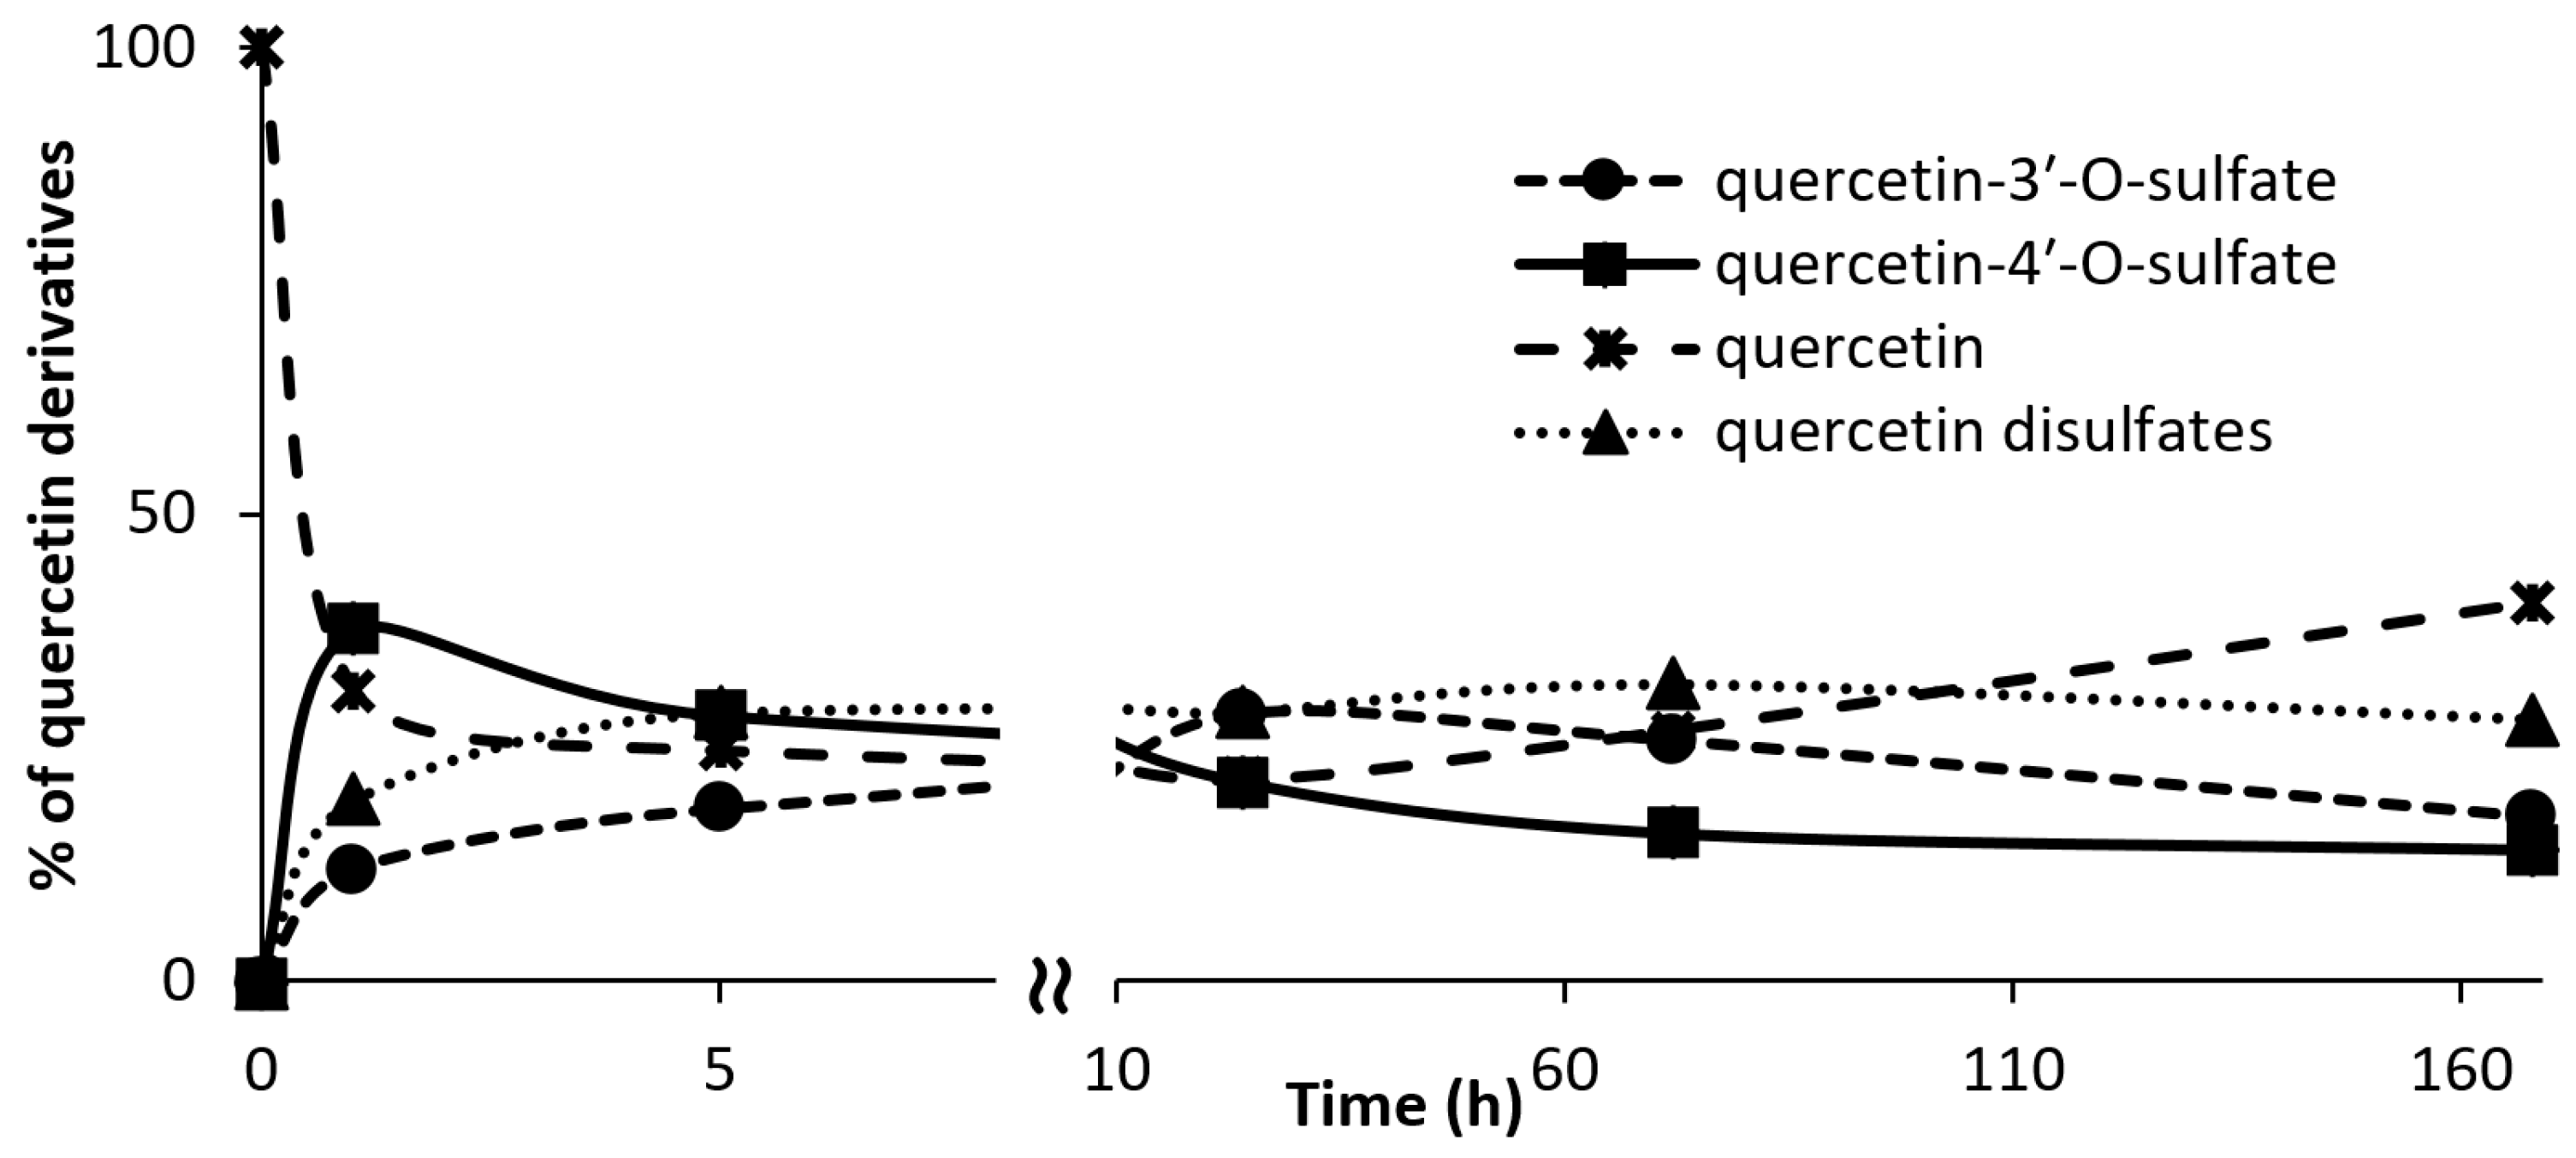
3.7. Kinetics of Regioisomer Quercetin Sulfate Formation
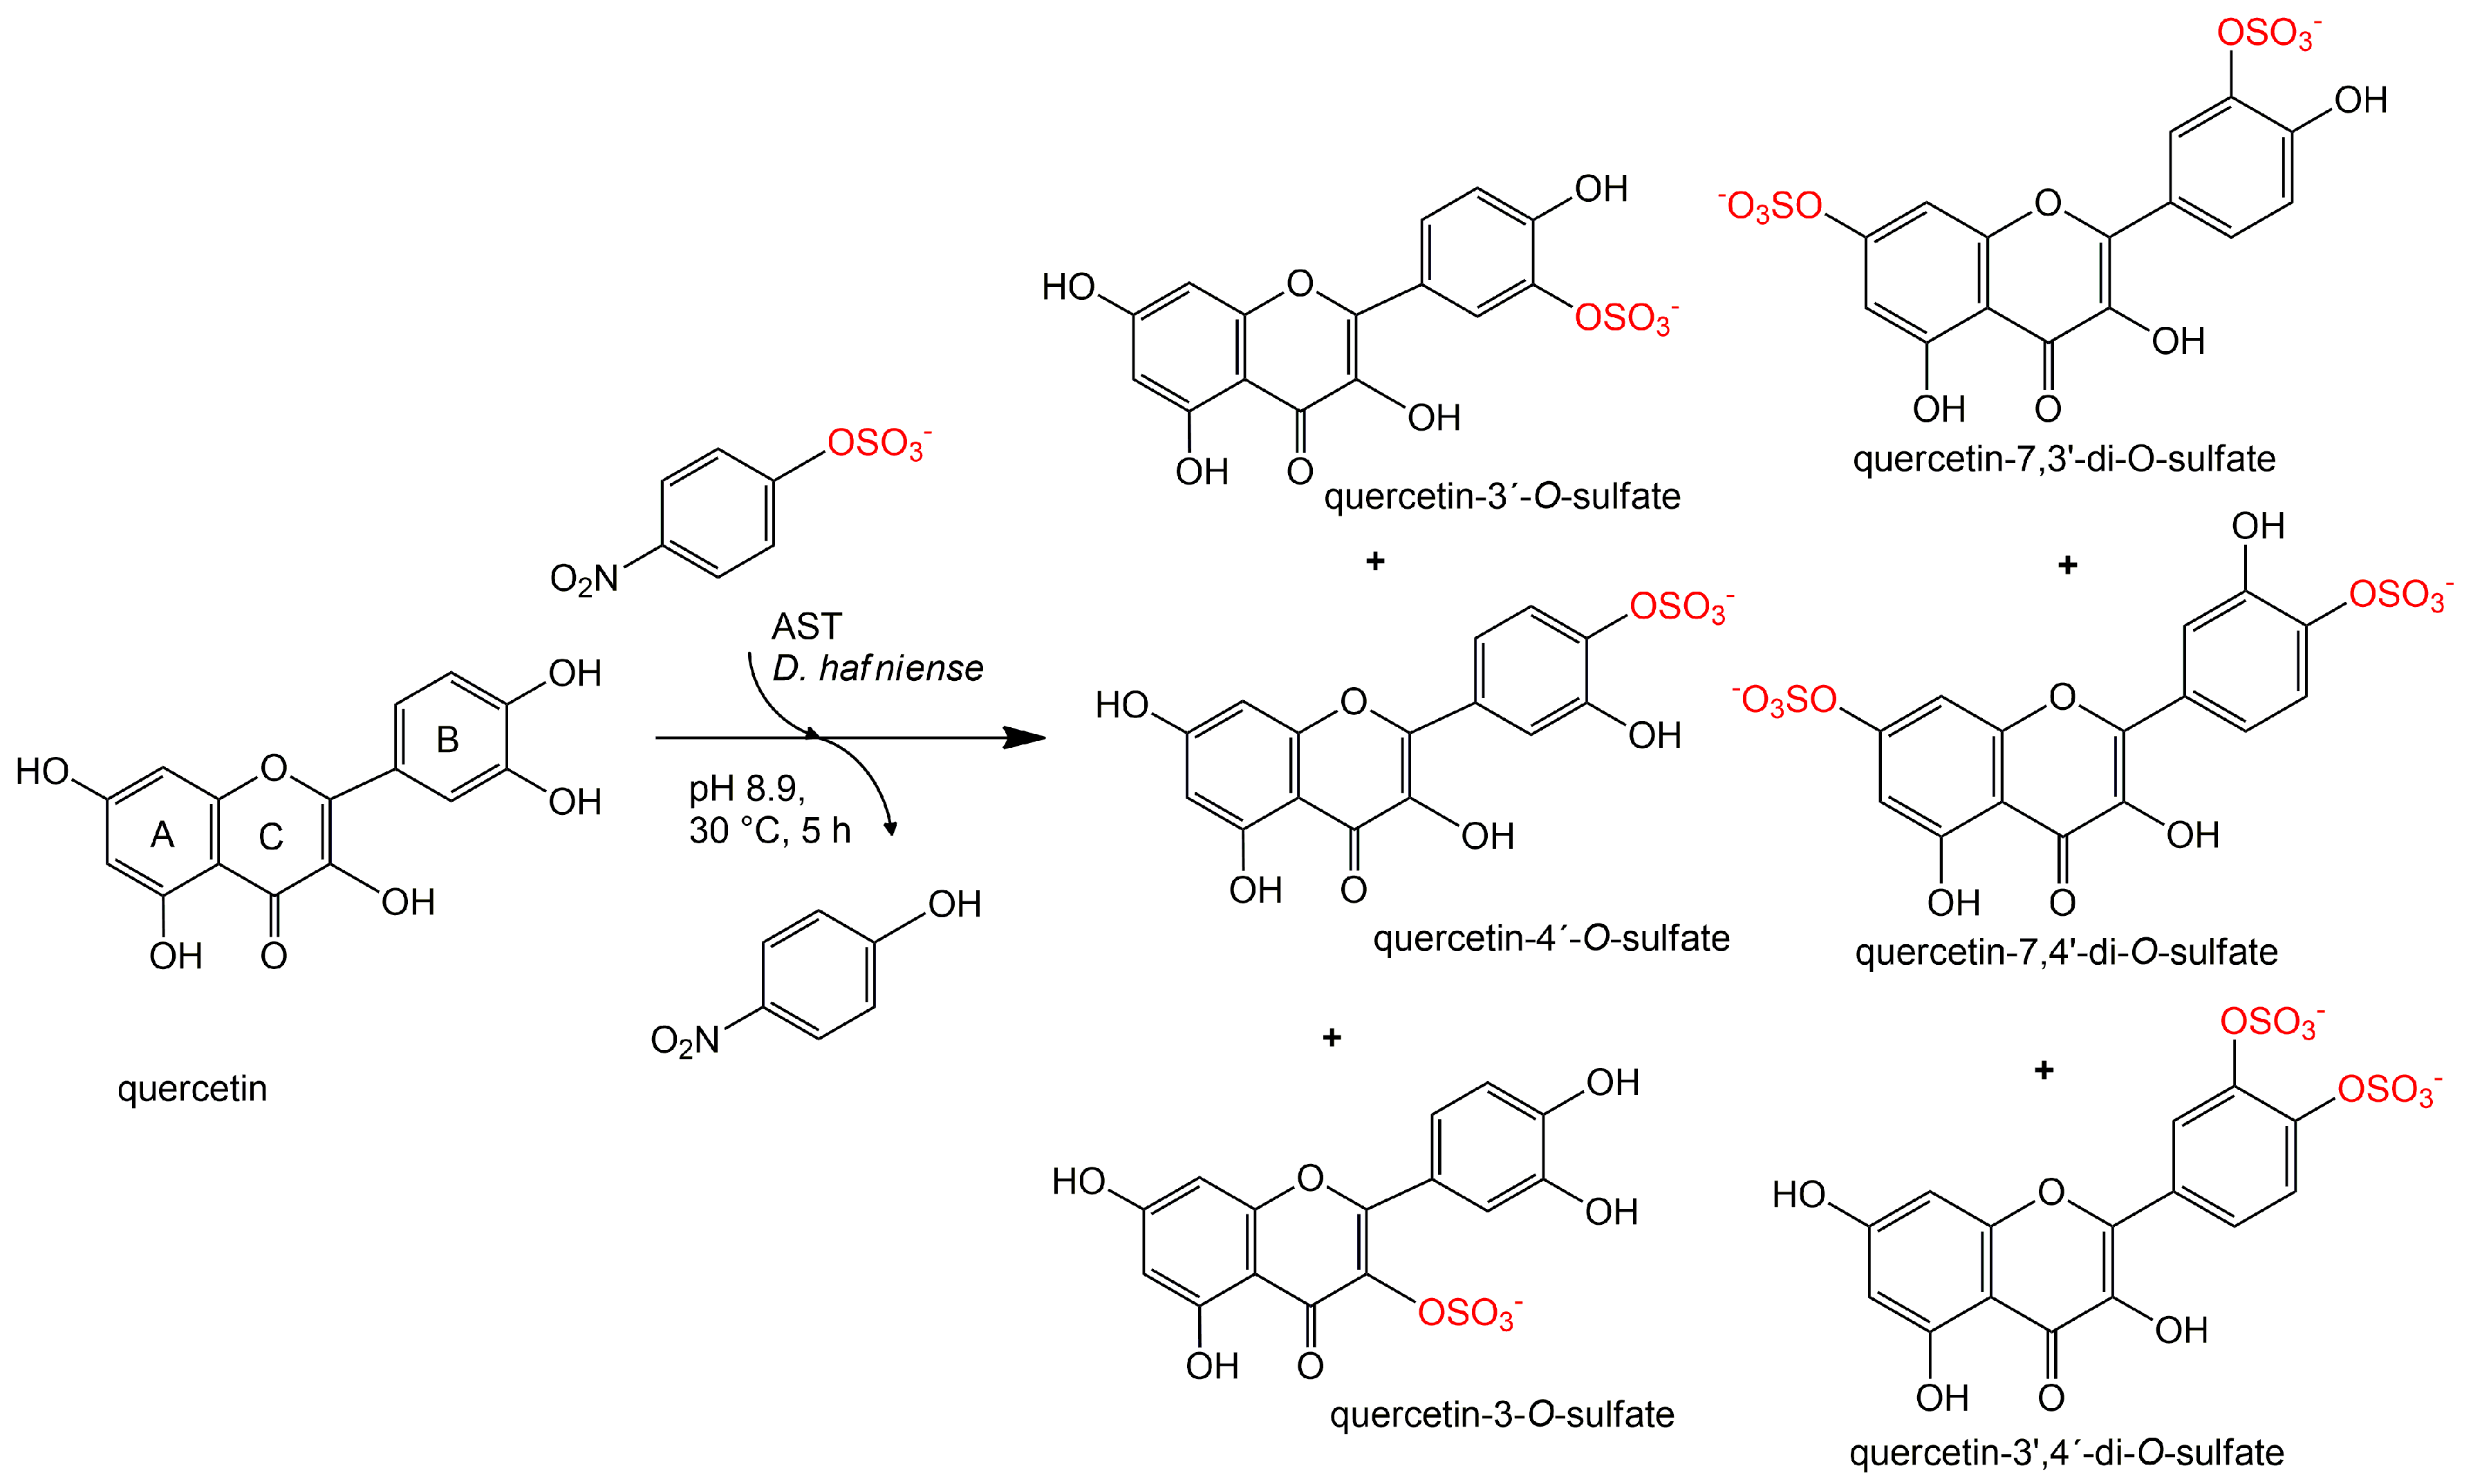
Quercetin (100 mg, 0.332 mmol, Sigma-Aldrich) was dissolved in 2.5 mL of acetone. p-Nitrophenyl sulfate (p-NPS, Sigma-Aldrich, 102 mg, 0.399 mmol, 1.2 eq.), AST from D. hafniense (360 U·mL−1 of the reaction mixture) and Tris-glycine buffer (to the final volume of 18 mL, 100 mM, pH 8.9) were added to the substrate solution and the mixture was incubated at 30 °C under argon atmosphere. The reaction progress was monitored by HPLC. The reaction was stopped after 1, 4, 24, 72, 168, and 336 h.
3.8. Quercetin Sulfation Using Alternative Sulfate Donors
Quercetin (50 mg, 0.166 mmol, Sigma-Aldrich) was dissolved in 1 mL of acetone. p-NPS (51 mg, 0.199 mmol 1.2 eq.), N-succinimide sulfate (38.6 mg, 0.199 mmol 1.2 eq.) or N-phthalimide sulfate (48.4 mg, 0.199 mmol 1.2 eq.), AST from D. hafniense (360 U·mL−1 of the reaction mixture) and Tris-glycine buffer (to a final volume of 9 mL, 100 mM, pH 8.9) was added to the substrate solution and the mixture was incubated at 30 °C under argon atmosphere. The reaction progress was monitored by HPLC. The reaction was stopped after 1 and 5 h.
3.9. Preparation and Purification of Quercetin Sulfates
Quercetin (200 mg, 0.664 mmol, Sigma-Aldrich) was dissolved in 5 mL of acetone. 24 mL of 100 mM Tris-glycine buffer (pH 8.9), p-NPS (205 mg, 0.80 mmol) and AST from D. hafniense (2 mL, 360 U/mL of the reaction mixture) were added to the substrate solution and the mixture was incubated ca 5 h at 30 °C under argon atmosphere. The reaction progress was monitored by HPLC or by TLC (ethyl acetate/methanol/HCO2H, 4:1:0.01). The reaction mixture was halved by evaporation in vacuo so that all organic solvents were removed, pH was adjusted to 7.5–7.7 and p-NP and residual starting materials were removed by extraction (3 × 50 mL EtOAc). The aqueous phase (15 mL) containing the sulfated products was evaporated, the residue was dissolved in 2 mL of 80% methanol and loaded onto a Sephadex LH-20 (GE Healthcare Bio-Sciences, Uppsala, Sweden) column (30 g dry weight, 3 cm i.d.) packed and equilibrated with 80% aqueous methanol. The elution typically took 2–4 days. The fractions were analyzed by TLC (EtOAc/MeOH/HCO2H, 4:1:0.01, v/v) and the fractions containing the respective product were collected and evaporated in vacuo at 45 °C.
Quercetin-3′-
O-sulfate was obtained as a yellowish solid (37 mg, yield 15%, purity 99%,
Figure S6), its structure was confirmed by
13C and
1H NMR (
Figures S3 and S4) whose results agreed well with published data [
11]; HRMS (
m/
z calcd for [M−H]
− (C
15H
9O
10S) 380.99219, found 380.99158;
Figure S5).
Quercetin-4′-
O-sulfate was obtained as a yellowish solid (18 mg, yield 7%, purity 97%,
Figure S10), its structure was confirmed by
13C and
1H NMR (
Figures S7 and S8) whose results agreed well with published data [
11]; HRMS (
m/
z calcd for [M−H]
− (C
15H
9O
10S) 380.99219, found 380.99149;
Figure S9).
Quercetin-3-
O-sulfate was obtained as a yellowish solid (3 mg, yield 1%, purity 80%,
Figure S14), its structure was confirmed by
13C and
1H NMR (
Figures S11 and S12) whose results agreed well with published data [
14,
15]; HRMS (
m/
z calcd for [M−H]
− (C
15H
9O
10S) 380.99219, found 380.99150;
Figure S13).
Quercetin-di-
O-sulfates mixture was obtained as a yellowish solid (34 mg, yield 10%, purity 91%,
Figure S18), its composition was determined by
13C and
1H NMR. Complete assignment of all extracted NMR signals was accomplished by the use of a combination of gCOSY, gHSQC, and gHMBC experiments (
Table 2,
Figures S15 and S16); HRMS (
m/
z calcd for [M − 2H + Na]
− (C
15H
8O
13NaS
2) 482.93095, found 482.93064; calcd for [M − 2H + K]
− (C
15H
8O
13KS
2) 498.90489, found 498.90447;
Figure S17).
3.10. Antioxidant Activity Measurement
Reducing capacity was evaluated using Folin–Ciocalteau reagent [
26] with minor modifications as described previously [
27,
28,
29]. Antiradical activity was evaluated spectrophotometrically as the ability of the substances to reduce the DPPH radical as described previously [
30] with minor modifications [
27,
28,
29]. DMPD [
31] radical scavenging and FRAP [
32] were measured using kits from Bioquochem (Llanera–Asturias, Spain). The capacity to scavenge the radical cation (ABTS
+•) was evaluated using the Antioxidant Assay Kit (CS0790, Sigma-Aldrich) and expressed as trolox equivalents (TE) from the trolox calibration curve. Inhibition of microsomal lipid peroxidation was tested using pooled microsomes from male rat livers oxidatively damaged by
tert-butylhydroperoxide in PBS. Determination of lipid peroxidation products as thiobarbituric acid reactive substances (TBARS) and calculation of the IC
50 values were performed as previously described [
27,
28,
29].
3.11. Statistical Analysis
All data were analyzed with one-way ANOVA, Scheffé and Least Square Difference tests for post hoc comparisons among pairs of means using the statistical package Statext ver. 2.1 (Statext LLC, Wayne, NJ, USA). Differences were considered statistically significant when p < 0.05.
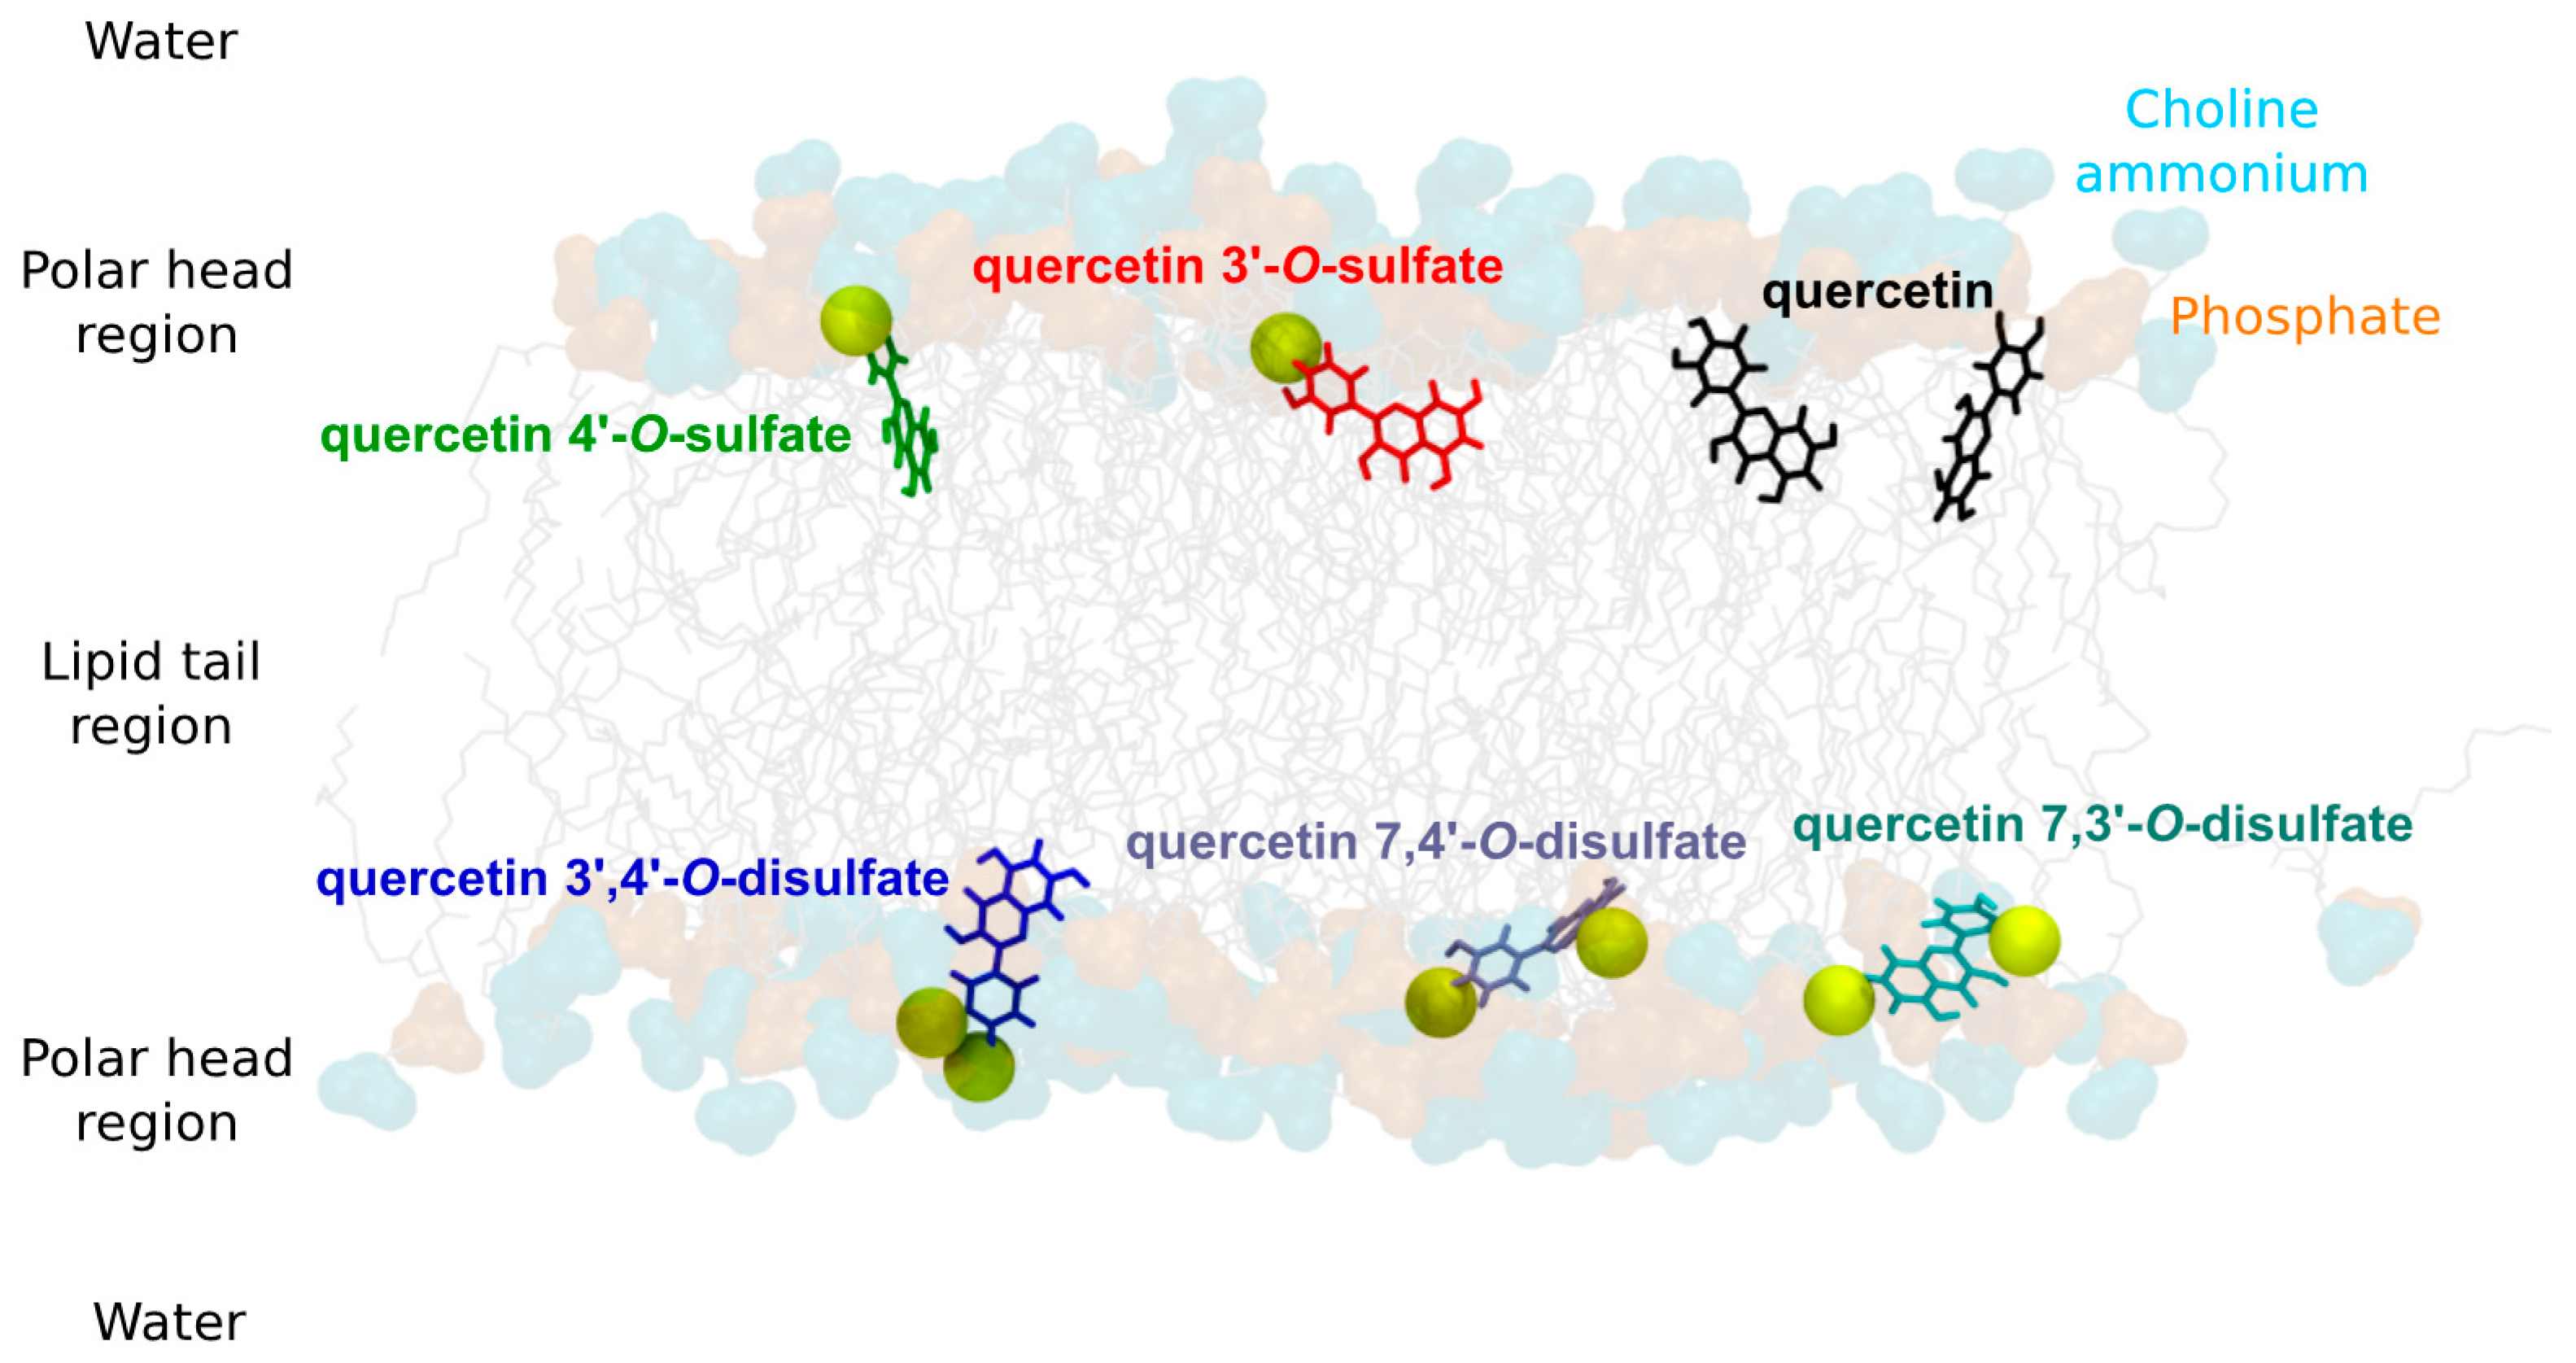
3.12. Molecular Modeling
For MD simulations, the force field (FF) parameters of the quercetin sulfates were derived from the Generalized Amber Force Field (GAFF) [
33] using the antechamber package [
34]. Partial atomic charges were derived from RESP (Restrained fit of ElectroStatic Potential) based on calculations achieved within the density functional theory (DFT) formalism with the (IEFPCM)-B3LYP/cc-pVDZ method, in diethylether [
35]. The DFT calculations and the atomic charge fitting were performed with the Gaussian09 RevA [
36] and RESP-v.III softwares [
37], respectively. The three quercetin disulfate derivatives were considered, namely quercetin 7,4′-, 7,3′-, and 3′,4′-di-
O-sulfates. The lipid14 FF [
38] available in the Amber16 package [
39] was used to describe POPC lipids. The “three-point” TIP3P water model [
40] was used to describe water molecules.
Pure POPC bilayer membranes made of 128 lipids were created using the membrane bilayer builder from the CHARMM-GUI server [
41]. Membranes were solvated with a hydration number of 50 water molecules per one lipid molecule. Na
+ and Cl
− ions were added to match with experimental conditions (i.e., (NaCl) = 0.154 M). MD simulations were carried out using both the CPU and GPU codes available in Amber16 [
39,
42]. Particle-Mesh Ewald (PME) MD simulations were first run on the pure POPC bilayer membrane which was carefully prepared as follows: minimization of the water molecule system prior to the entire system minimization; slow thermalization of water molecules up to 100 K in the (
N,
V,
T) ensemble for 200 ps; thermalization of the whole system to the final temperature (298.15 K) of the entire system for 500 ps (
N,
P,
T); equilibration of the density of the system for 5 ns (
N,
P,
T) MD simulations; finally, production of 200 ns MD simulation. Quercetin sulfates were then inserted into the equilibrated membranes, and the system was relaxed by a short minimization, so as to prevent any steric clash artifact. For each system of interest, four non-interacting identical quercetin sulfates were included in the MD box to fasten sampling. For each system, 400 ns MD simulations were then carried out. The total MD simulation time for the six systems (quercetin, quercetin-3′-
O-sulfate, 4′-
O-sulfate, and quercetin-7,4′-, 7,3′-, and 3′,4′-di-
O-sulfates) was ca 2.4 μs. The analyses were performed (i) over the last 200 ns of the MD trajectories (series of snapshots of the molecular systems) and (ii) considering each non-interacting quercetin separately in the MD box. This allowed a complete sampling of structural properties during 4 × 200 ns to be obtained, after the equilibrium was reached (i.e., within the first 200 ns of the MD simulation). PME MD simulations were carried out using the SHAKE algorithm and a 10 Å noncovalent interaction cut-off. The temperature was maintained using the Langevin dynamics with a collision frequency of 1 ps
−1. Anisotropic pressure scaling was used in which the pressure relaxation time was set at 1 ps. The analyses were carried out using the cpptraj software [
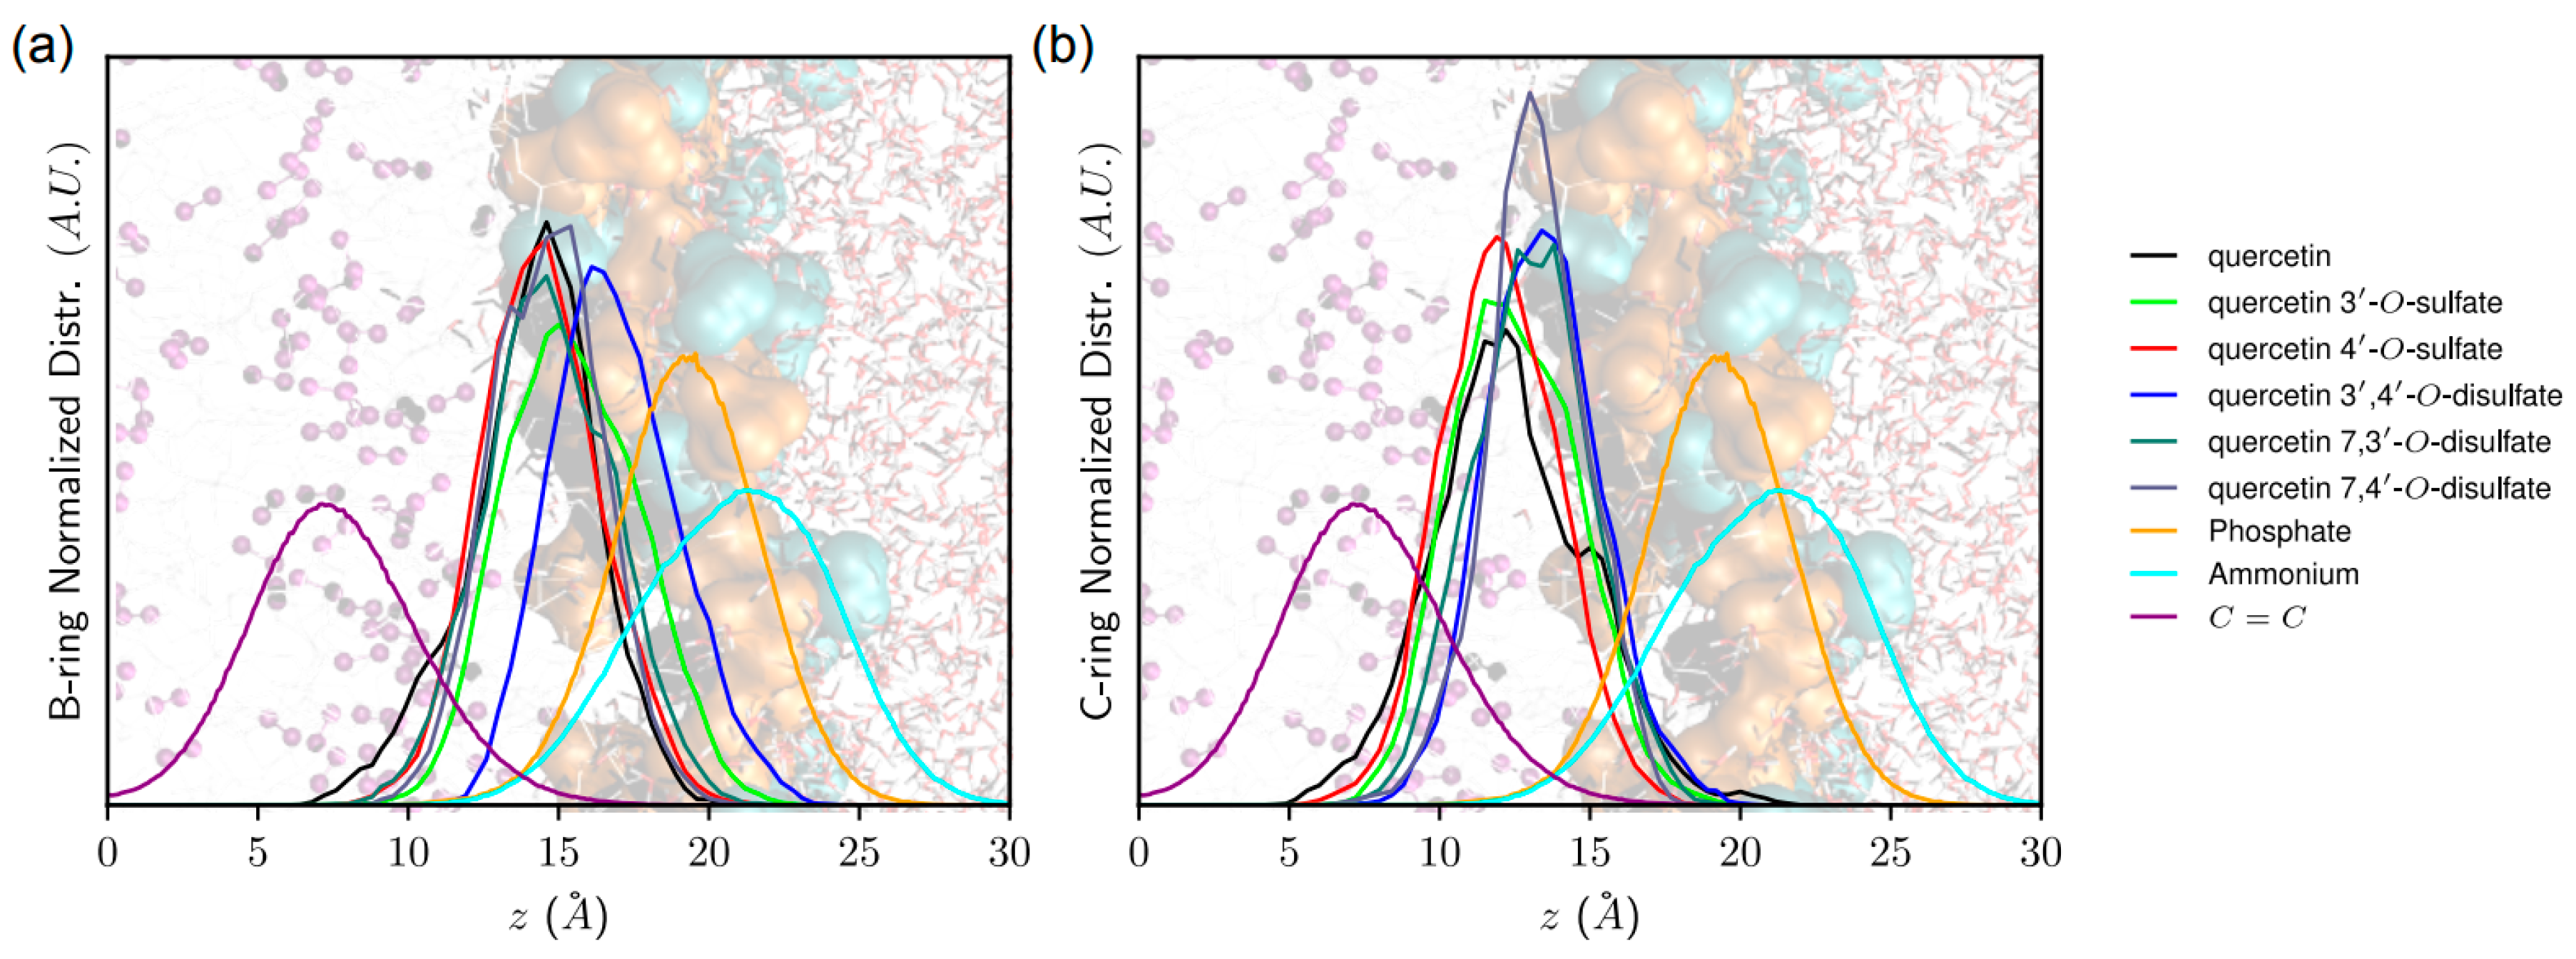
43]. The z-axis is defined as being perpendicular to the membrane surface. The distance of quercetin derivatives to the membrane center was measured as the
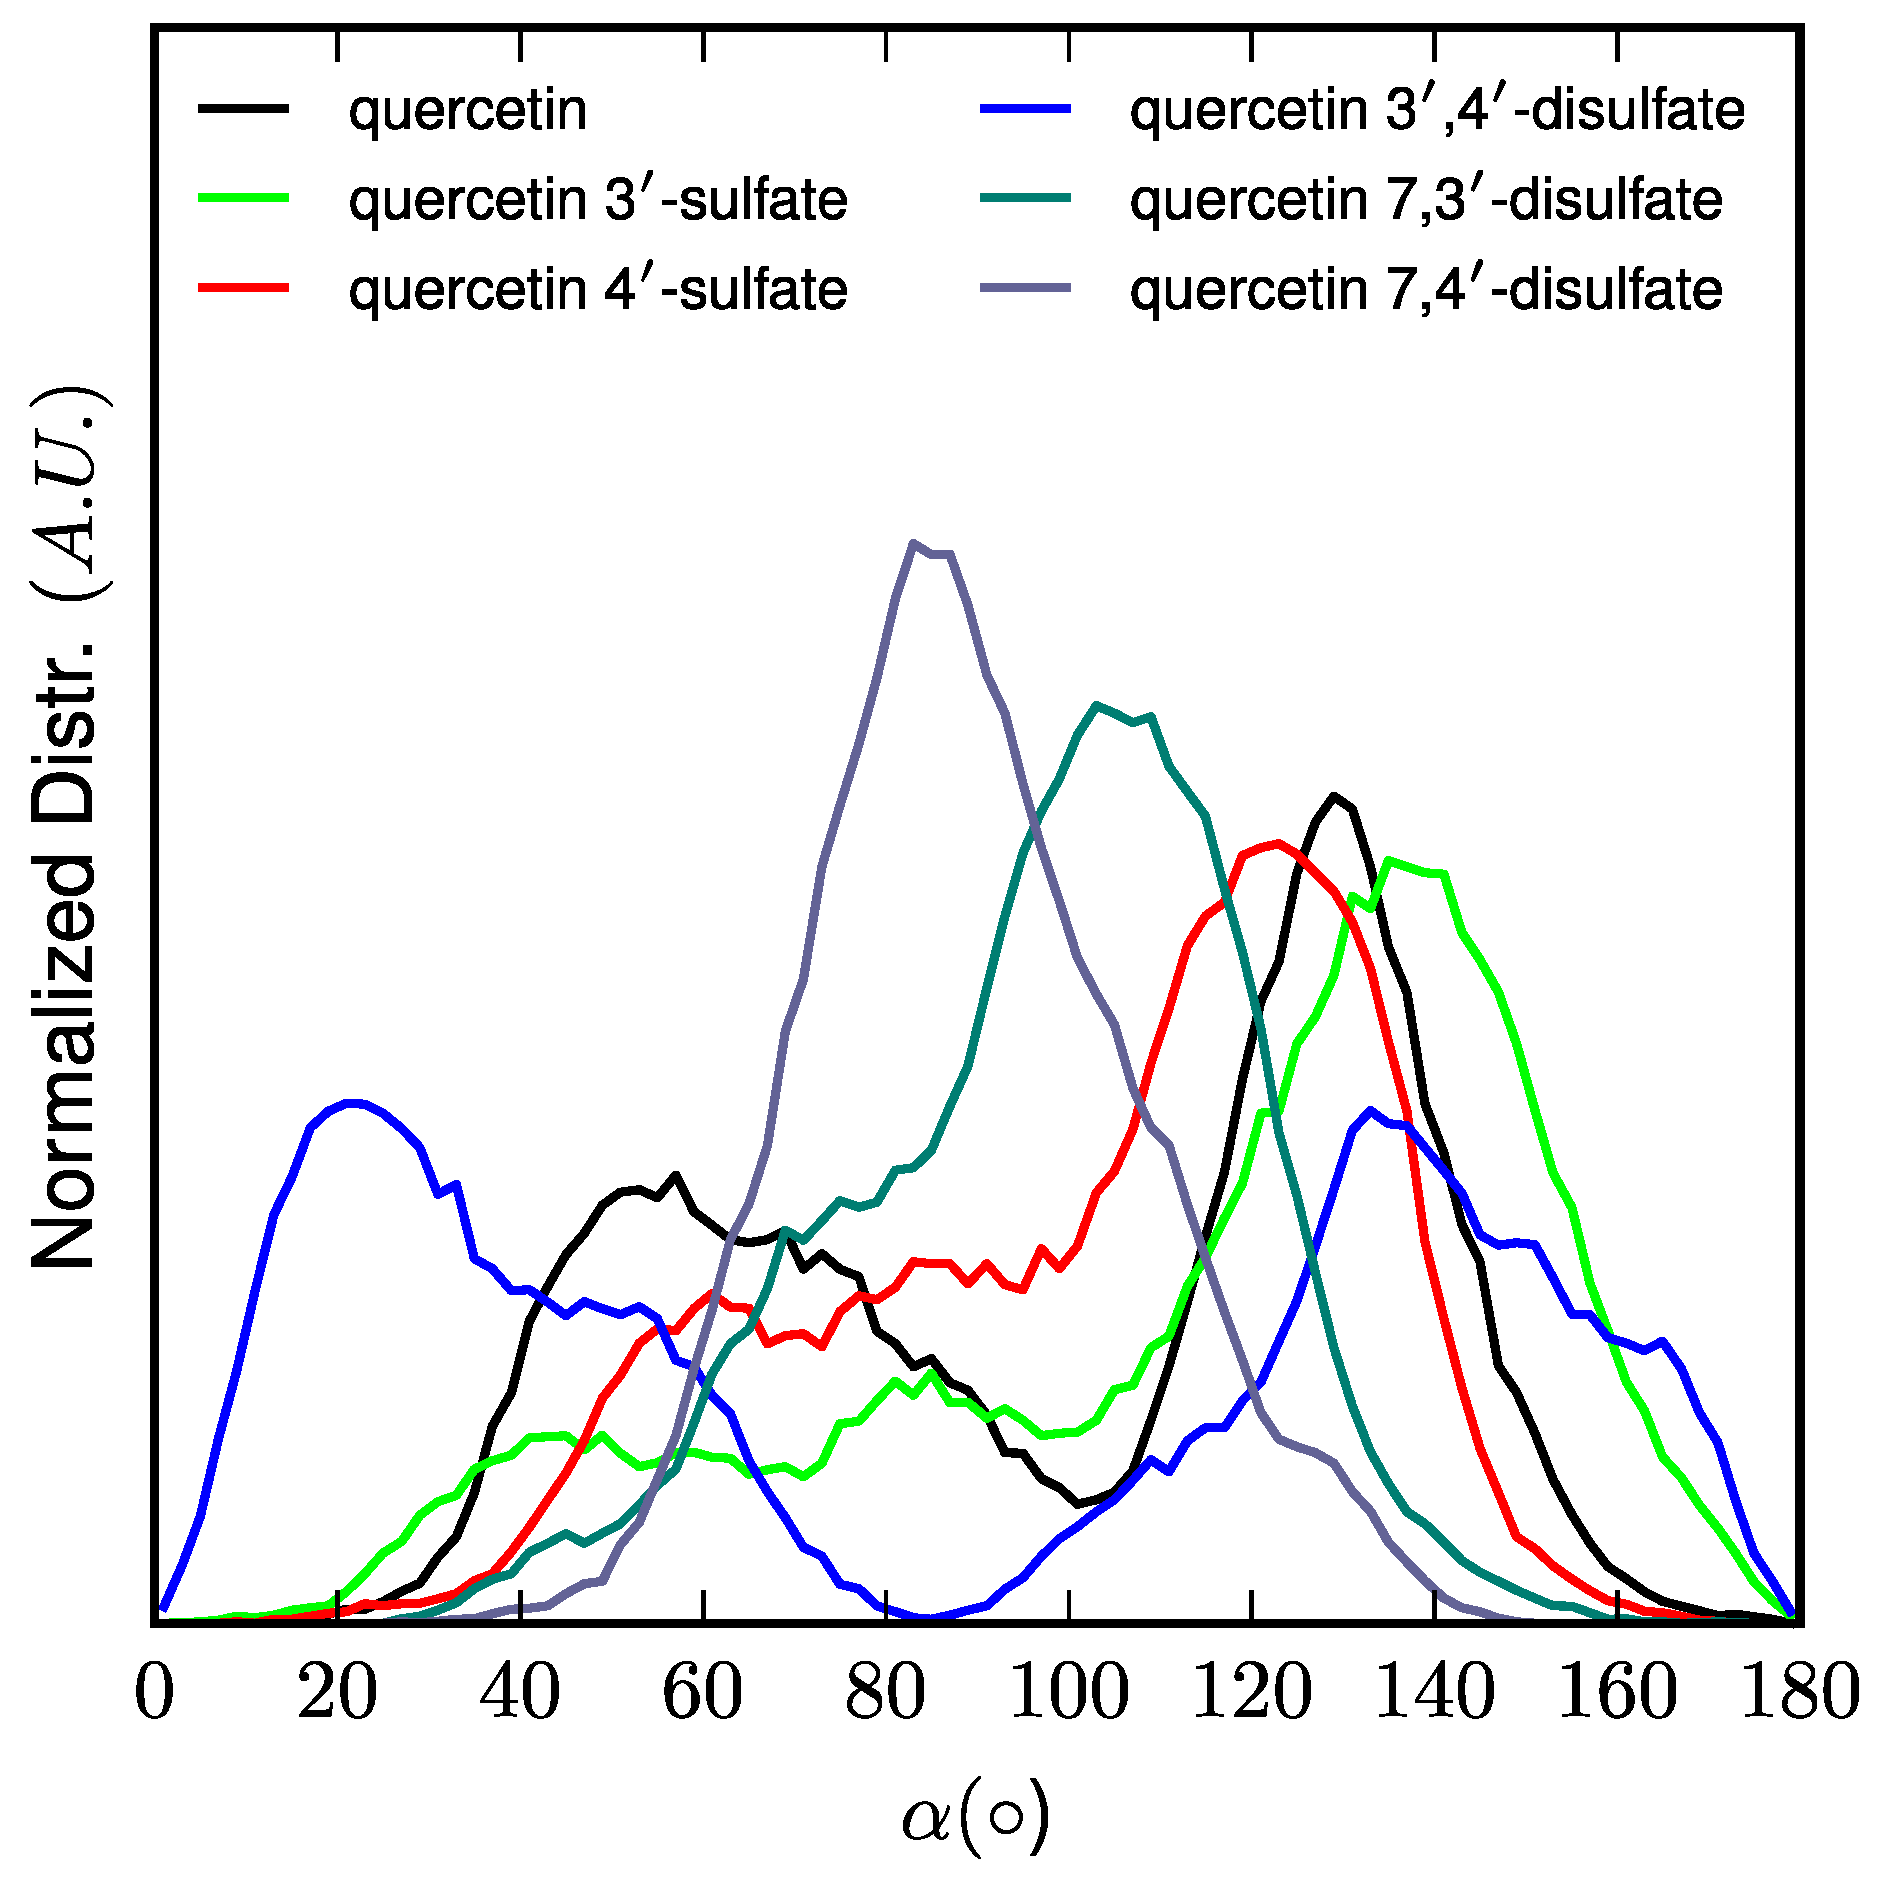
z-component of the vector originating at the center-of-mass of the lipid bilayer and pointing towards the quercetin derivative center-of-mass. The orientation of quercetin and quercetin sulfates in the lipid bilayer membrane was assessed as the α-angle between the
z-axis and the vector starting from the A- to the B-ring. Noncovalent interactions energies were obtained from MD simulations by calculating the averaged electrostatic and van der Waals interaction energies between (i) quercetin derivatives and POPC molecules, as well as (ii) quercetin and lipid tails only, lipid tails being defined as the
sn1- and
sn2-chains. It is worth noting that such interaction energies can be compared only in systems containing the same number of atoms (i.e., within monosulfate or disulfate derivatives).
Antioxidant properties in the water of quercetin derivatives as well as relative stabilities were assessed at the (DFT) B3P86/cc-pVDZ level of theory at 298 K. Solvent effects were taken into account during optimization by using the integral equation formalism polarizable continuum model (IEFPCM). Ground state geometries were confirmed by a vibrational frequency analysis that indicated the absence of imaginary frequency. Electron transfer capacity was assessed by calculating ionization potentials (IP) as follows IP = EArOH (ArOH+•)–EArOH (ArOH) where EArOH pictures energy calculated using the optimized ArOH geometry. H-atom transfer capacities were assessed by calculating ArO-H bond dissociation enthalpies as follows: BDE(ArO-H) = H[ArO•, 298 K] + H[H•, 298 K] – H[ArOH, 298 K,] where H is enthalpy.
4. Conclusions
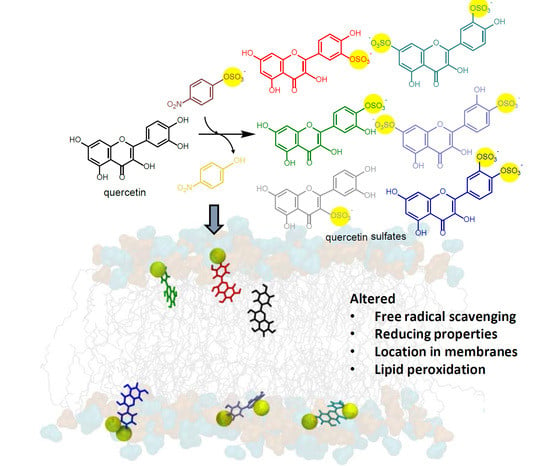
Using arylsulfotransferase from Desulfitobacterium hafniense we synthetized and fully characterized a series of potential quercetin sulfated metabolites, namely quercetin-3′-O-sulfate, quercetin-4′-O-sulfate, and quercetin-3-O-sulfate as well as a quercetin-di-O-sulfate mixture (quercetin-7,3′-di-O-sulfate, quercetin-7,4′-di-O-sulfate, and quercetin-3′,4′-di-O-sulfate). The quercetin sulfated metabolites are usually less active as radical scavengers, and reducing or anti-lipoperoxidant agents than quercetin itself. However, they appeared still effective antiradical and reducing agents. While quercetin-3′-O-sulfate was more efficient than quercetin-4′-O-sulfate in DPPH and FCR assays, quercetin-4′-O-sulfate was the best ferric reductant and lipoperoxidation inhibitor. The capacity to scavenge ABTS+• and DMPD was comparable for all substances, except for disulfates, which were the most efficient. Quantum calculations and molecular dynamics simulations on membrane models supported rationalization of free radical scavenging and lipid peroxidation inhibition. These results clearly showed that individual metabolites of the food bioactives can markedly differ in their biological activity. Therefore, a systematic and thorough investigation of all bioavailable metabolites with respect to native compounds is always required when evaluating food health benefits.

 ,
, 


