Colorful Packages: Encapsulation of Fluorescent Proteins in Complex Coacervate Core Micelles

 ,
,  and
and 
Abstract
:
1. Introduction
2. Results
2.1. Fluorescent Protein Charge Determination
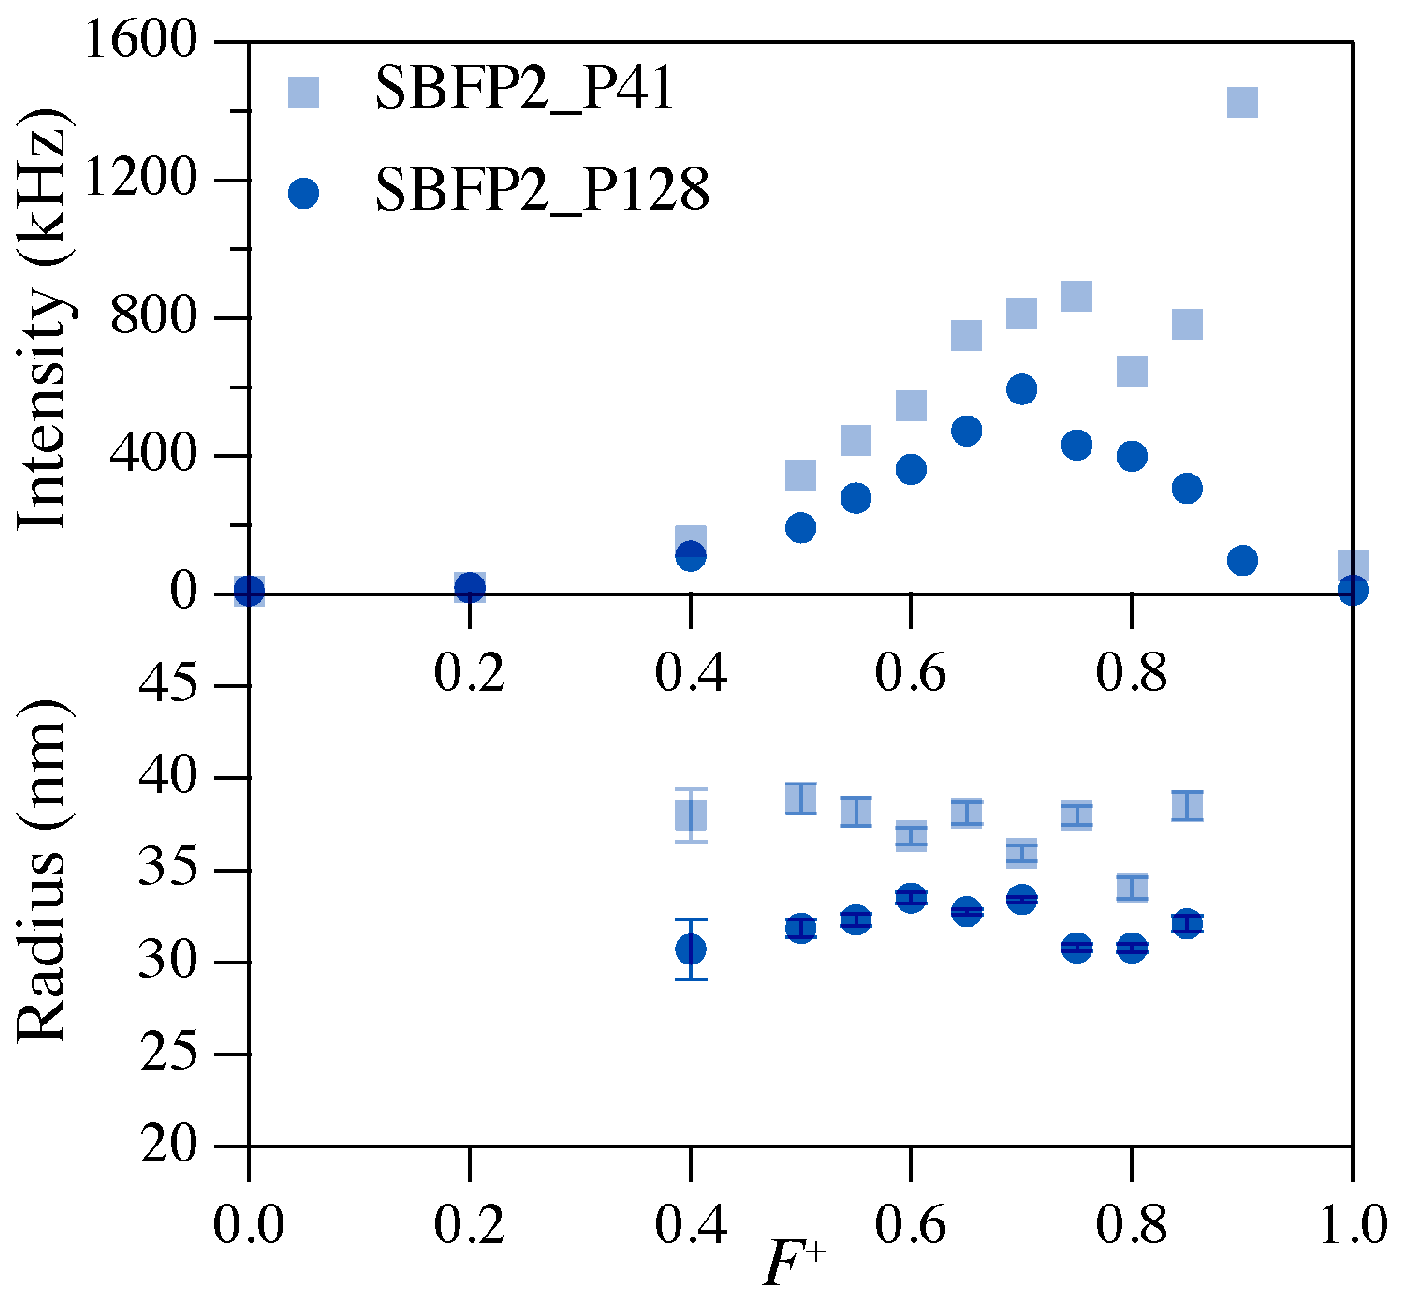
2.2. Preferred Micellar Composition (PMC)
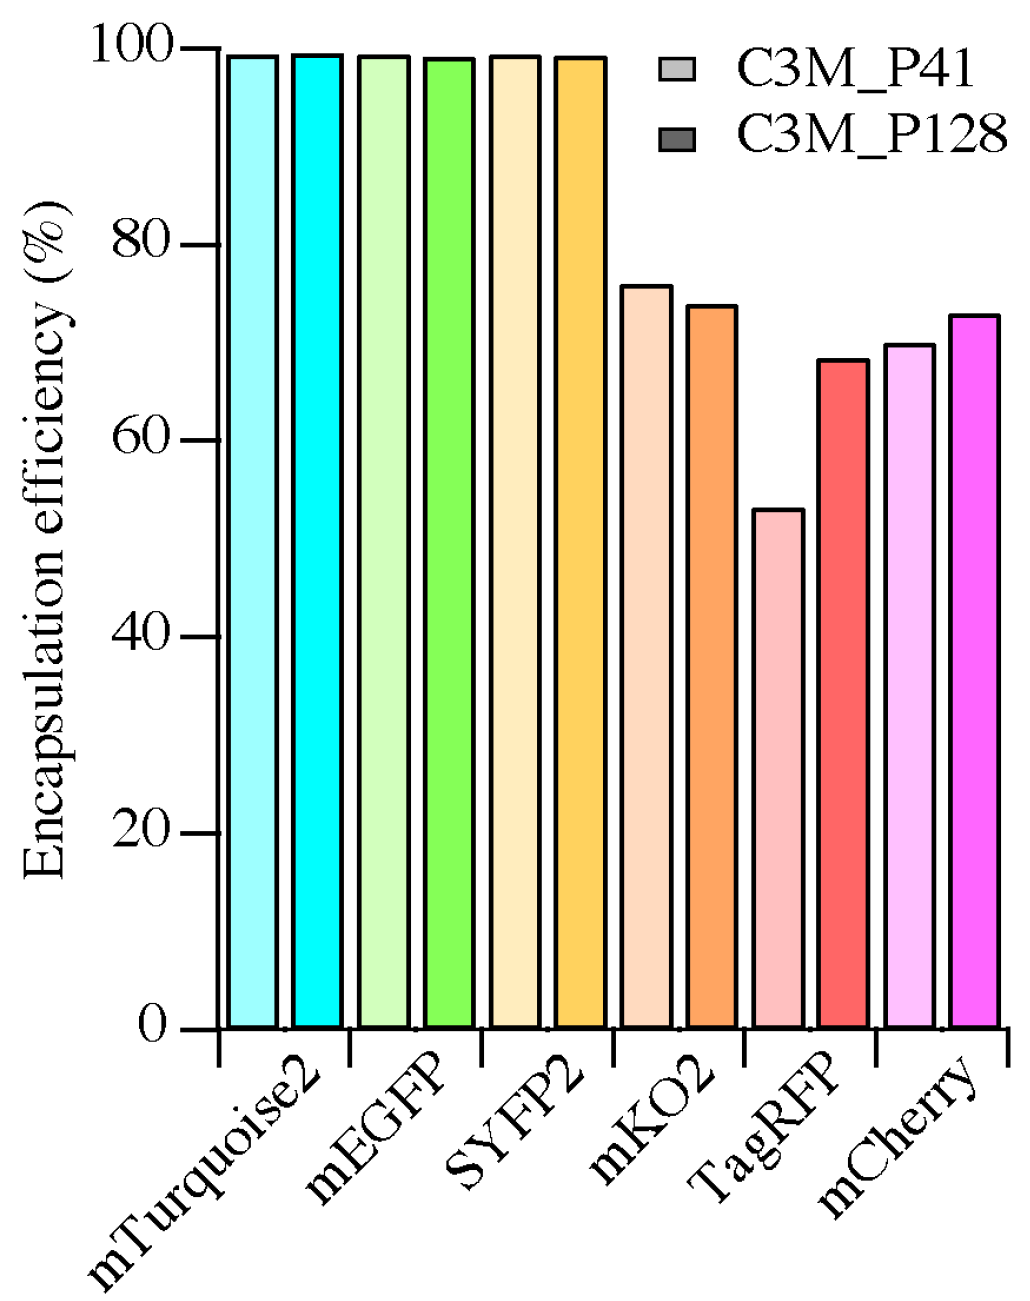
2.3. Encapsulation Efficiency
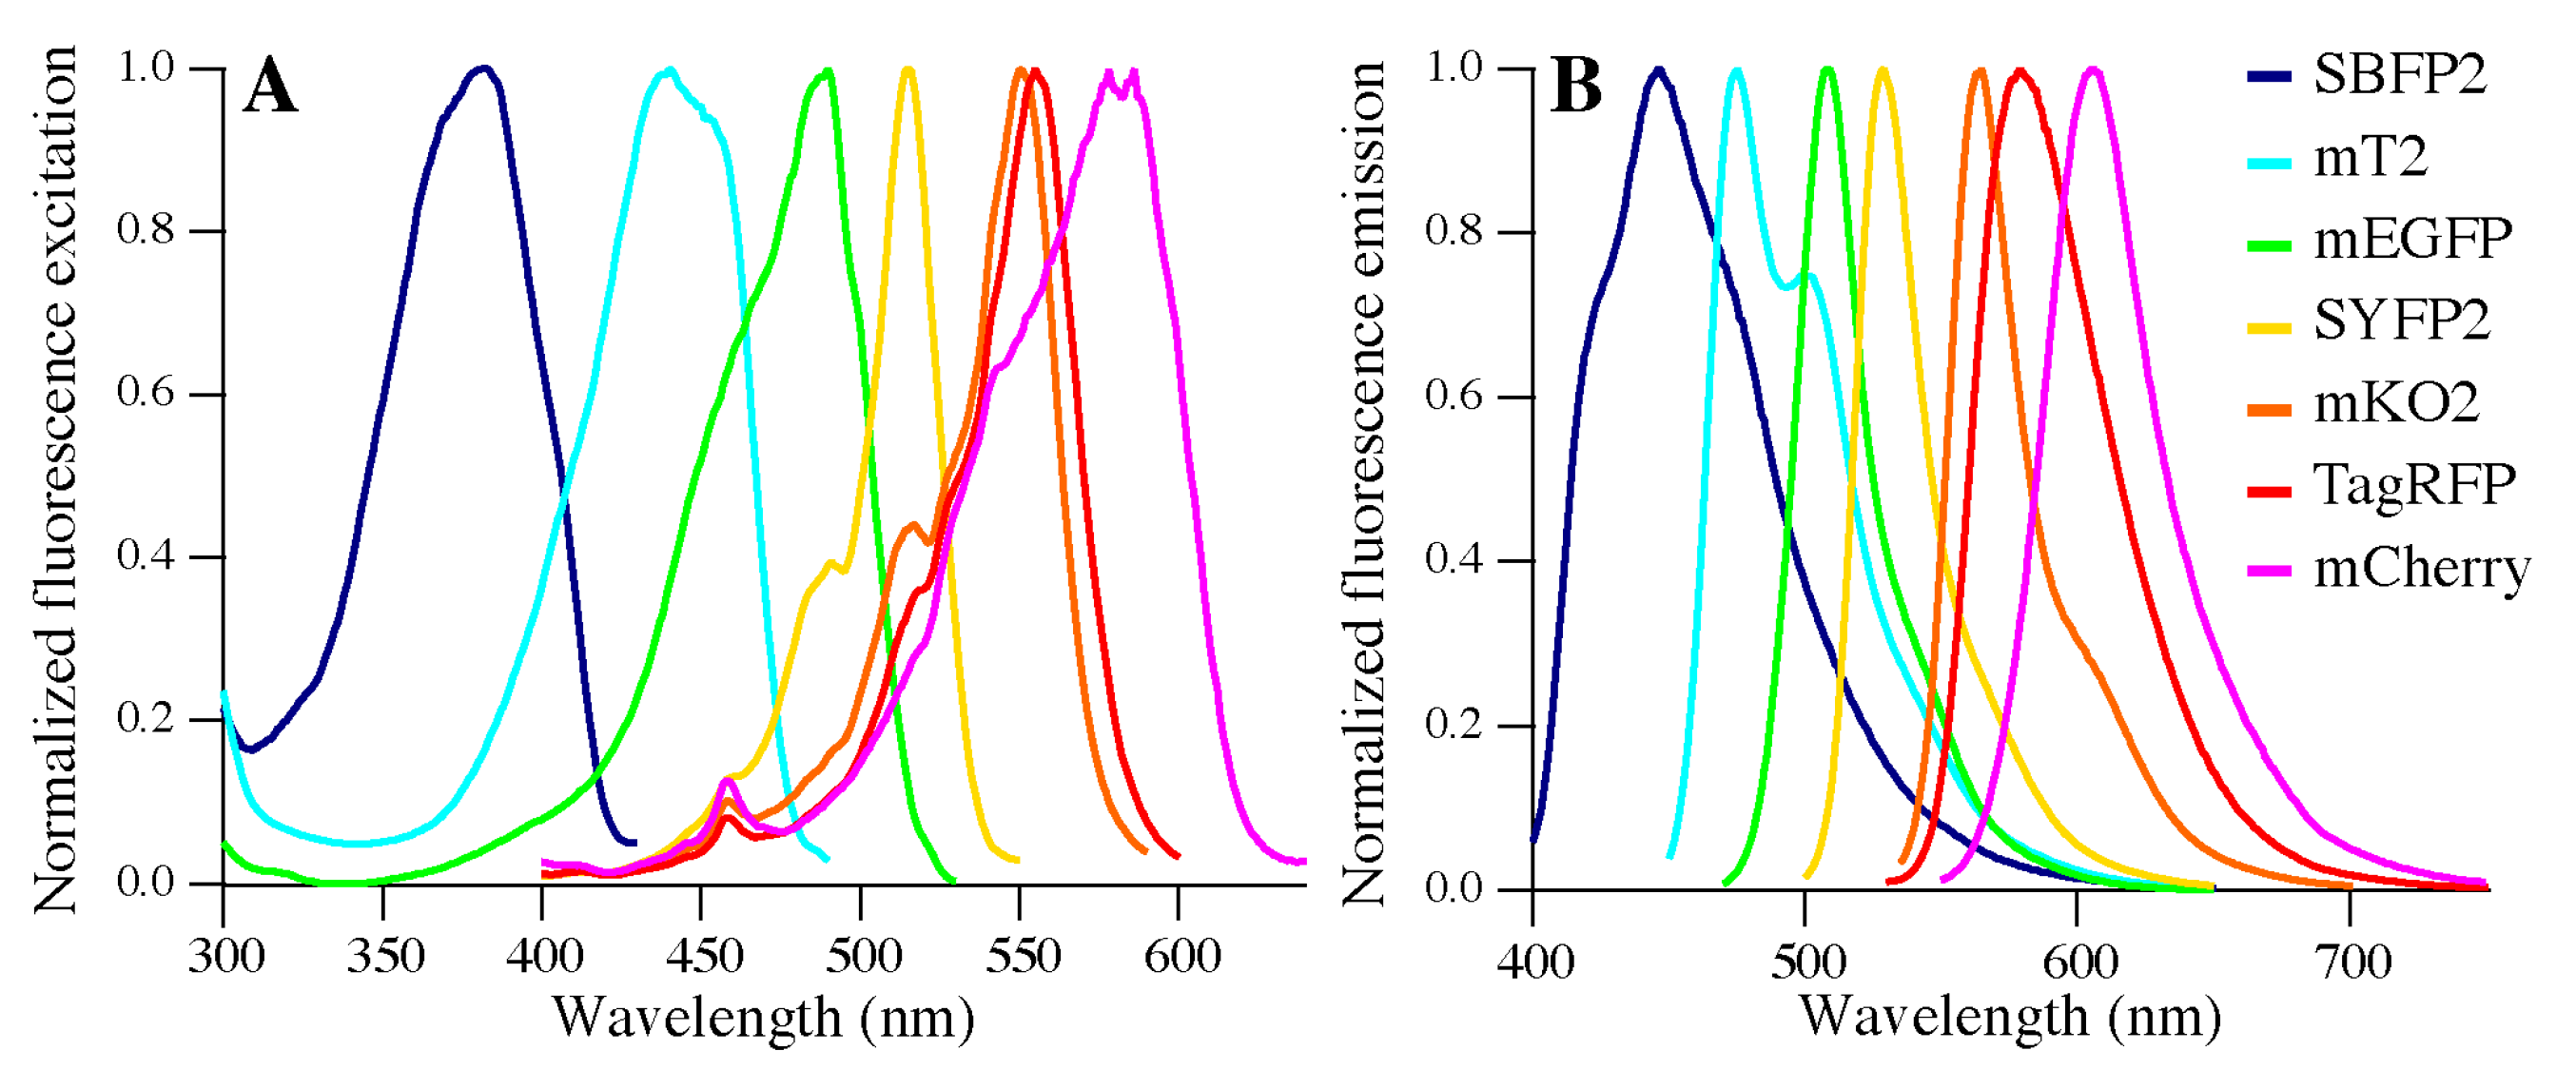
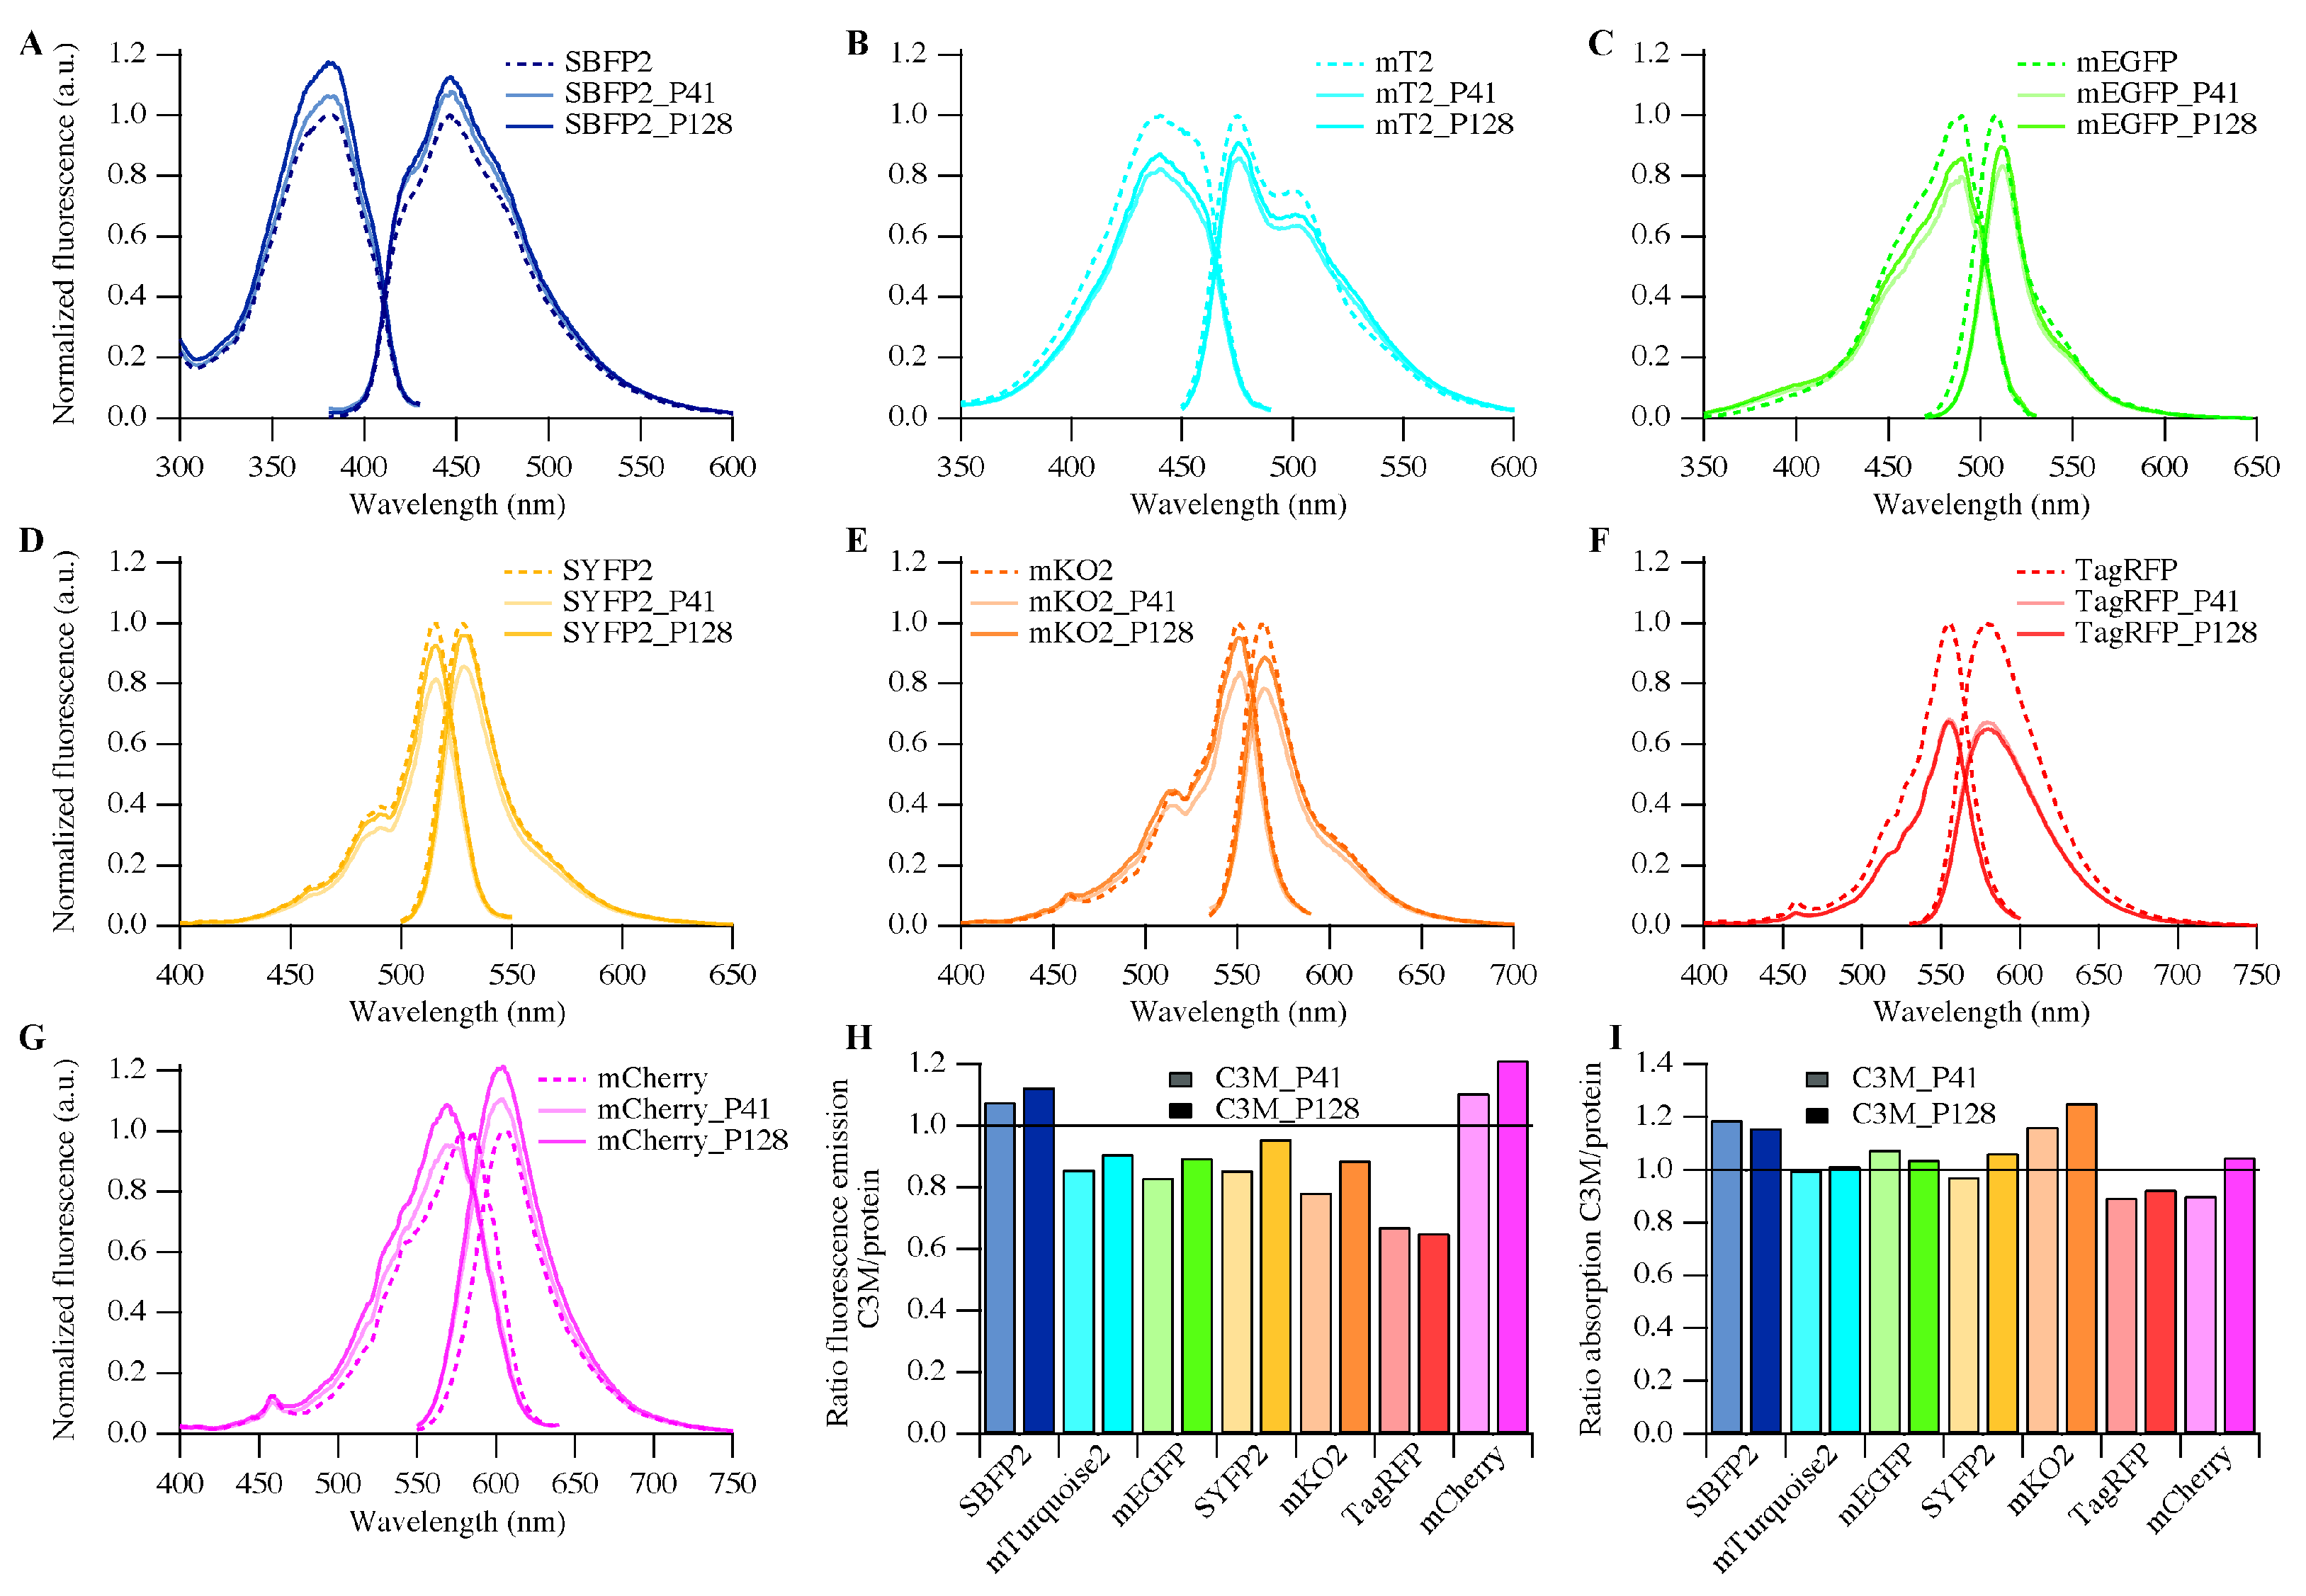
2.4. Fluorescence Properties
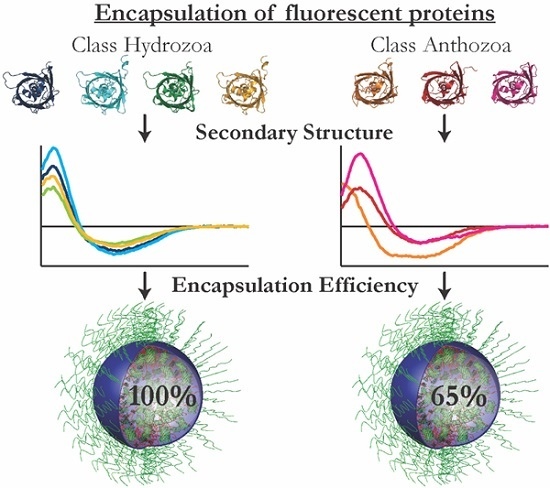
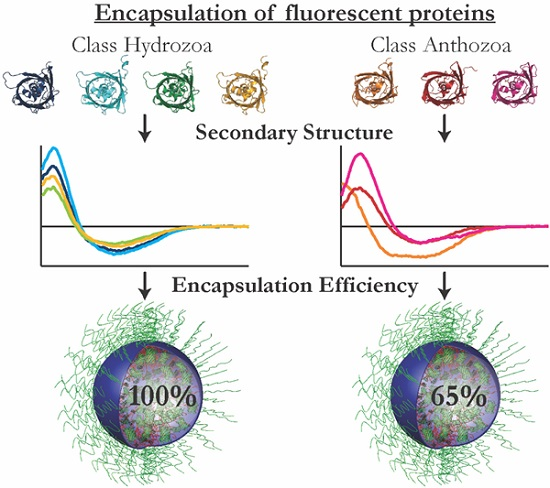
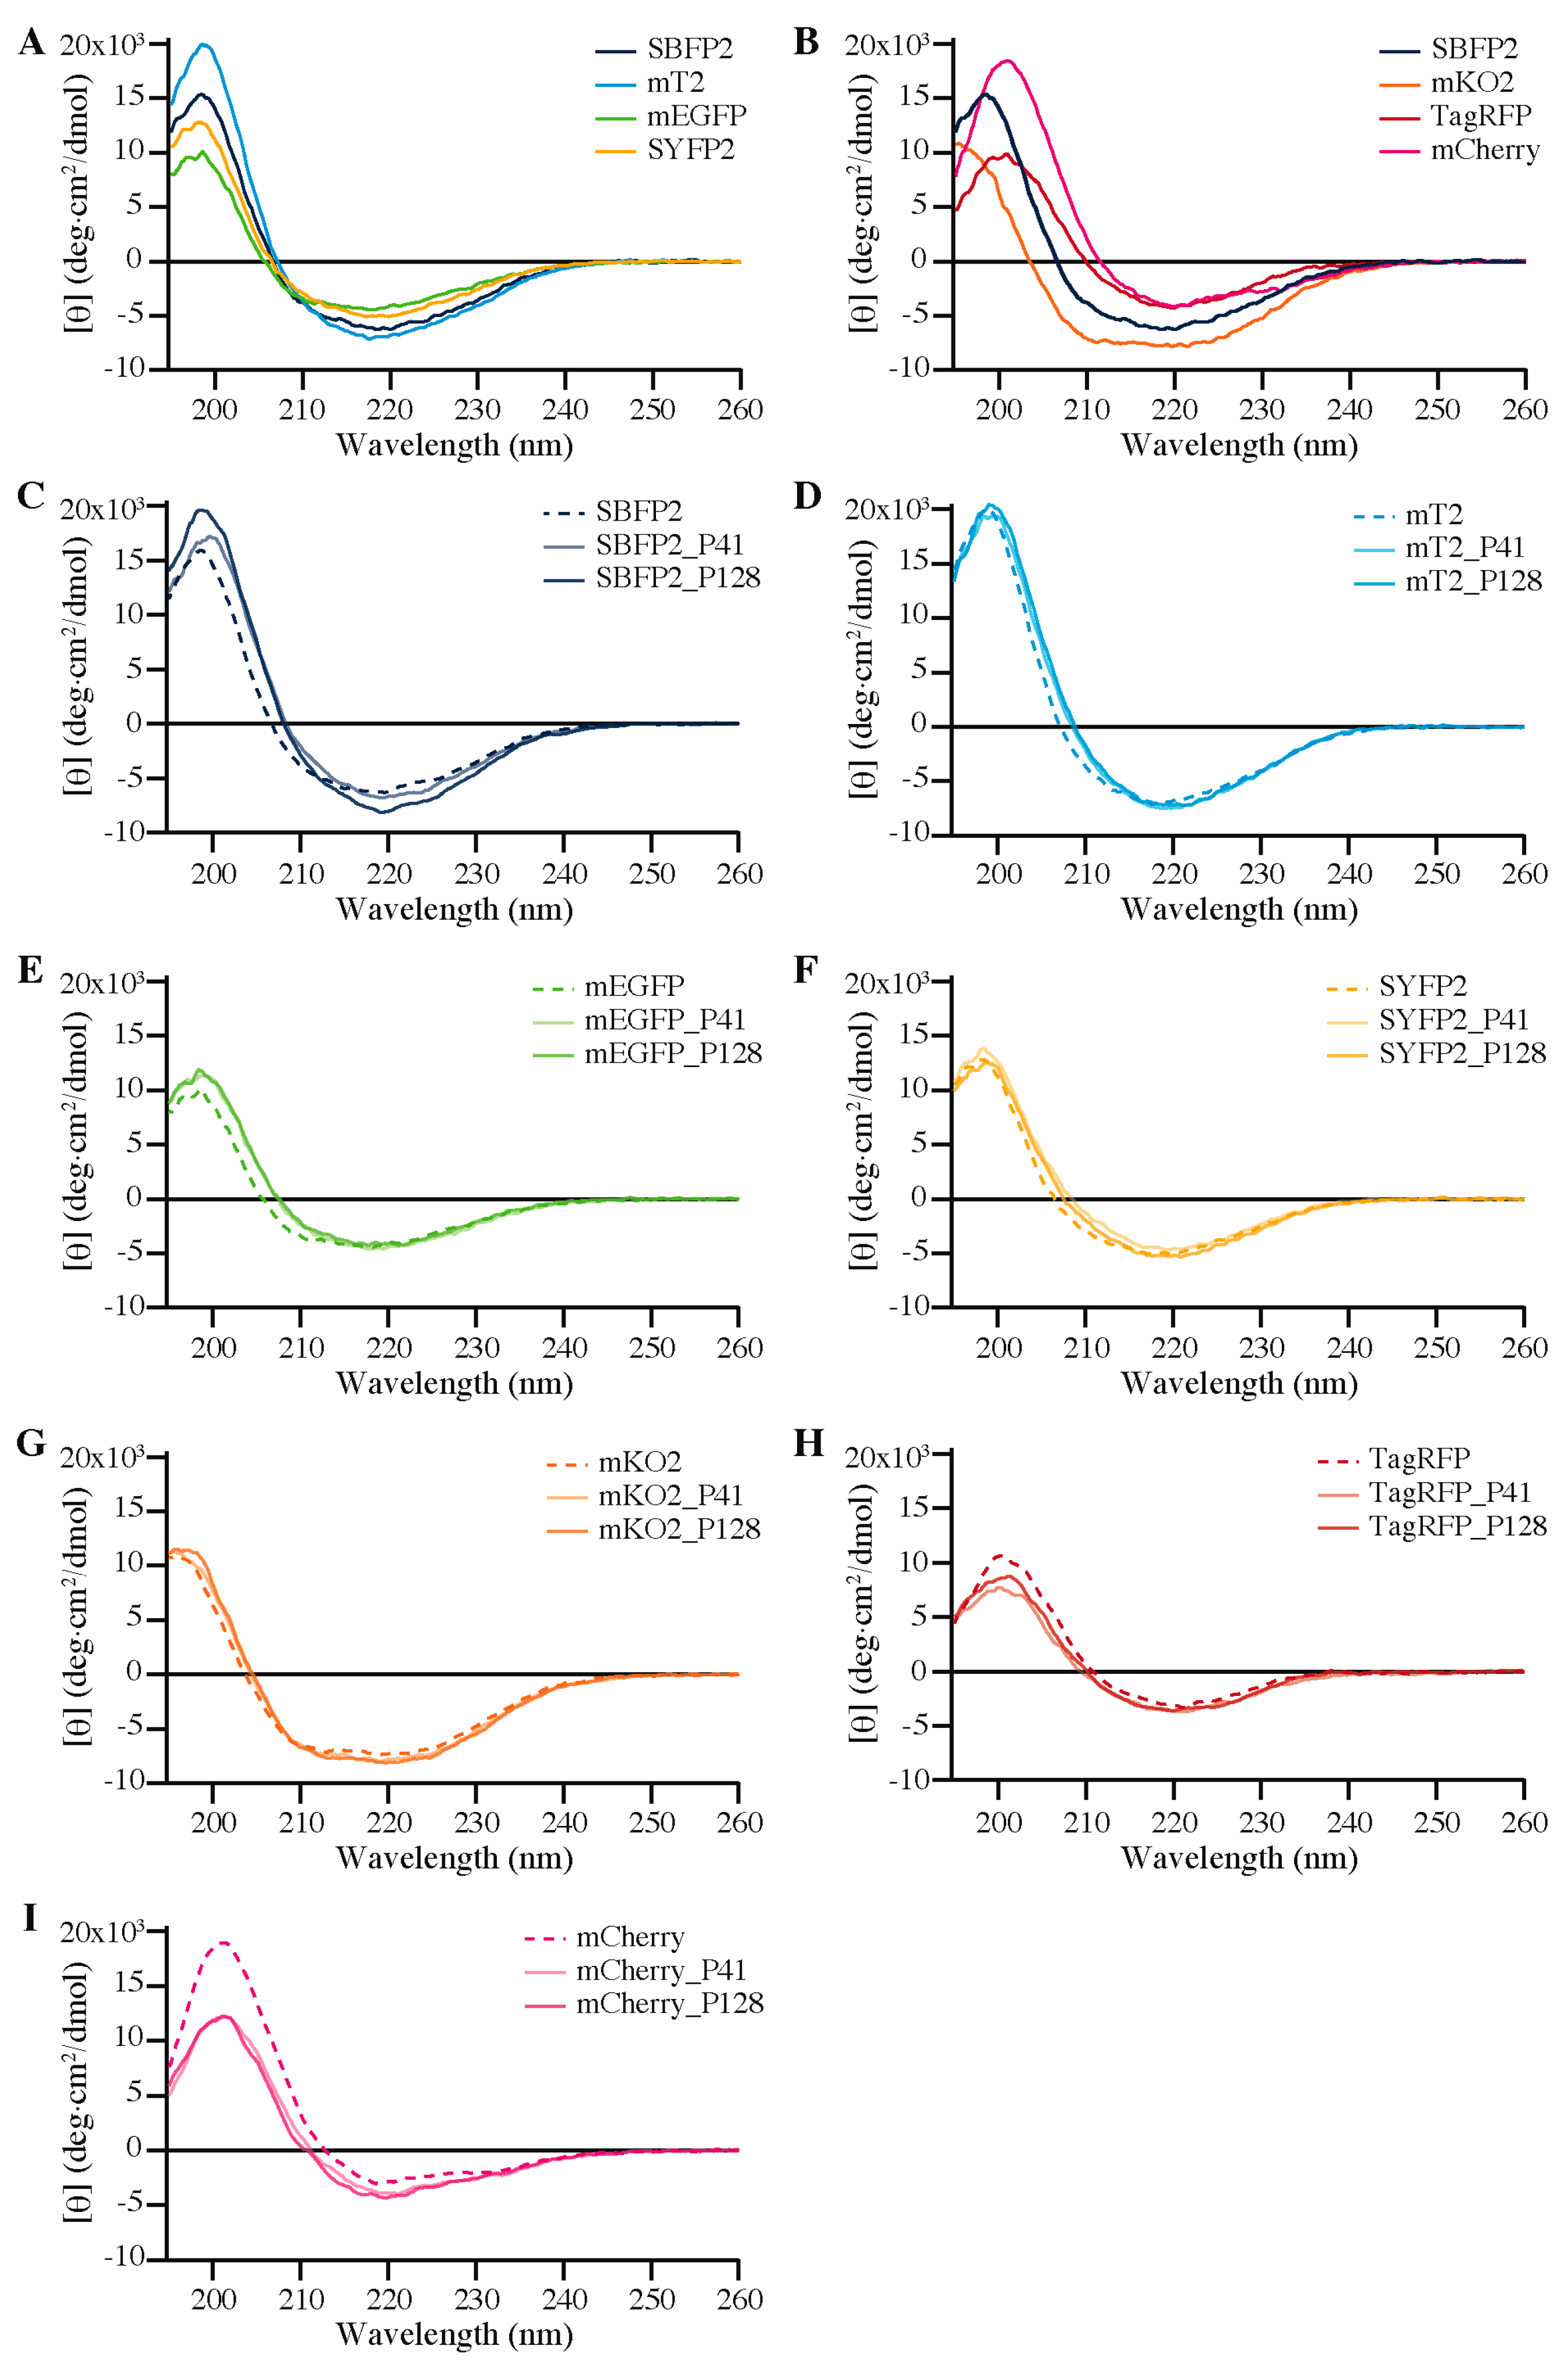
2.5. Secondary Structure
3. Discussion
3.1. Encapsulation Efficiency
3.2. Elliptical Symmetry of FP Barrels
3.3. Biophysical Properties of Encapsulated Proteins
3.4. Future Research
4. Materials and Methods
4.1. Materials
4.2. Protein Production
4.3. Modeling

| Protein | PDB Entry | Figure | % ID | Reference |
|---|---|---|---|---|
| mTurquoise2 | 3ZTF | S8 | 99.57 | Goedhart, et al. [23] |
| mEGFP | 4EUL | S9 | 99.56 | Arpino, et al. [29] |
| TagRFP | 3M22 | S12 | 100.00 | Subach, et al. [59] |
| mCherry | 2H5Q | S13 | 100.00 | Shu, et al. [27] |
| Protein | PDB Entry | Figure | % ID | Reference |
|---|---|---|---|---|
| SBFP2 | 1BFP | S7 | 96.44 | Wachter, et al. [60] |
| SYFP2 | 1MYW | S10 | 99.12 | Rekas, et al. [61] |
| mKO2 | 2ZMU | S11 | 95.31 | Kikuchi, et al. [62] |
4.4. C3M Preparation
4.5. Dynamic Light Scattering (DLS)
4.6. DLS Data Analysis
4.7. Fluorescence Correlation Spectroscopy (FCS)
4.8. FCS Data Analysis
4.9. Steady-State Fluorescence Spectroscopy
4.10. Circular Dichroism (CD)
5. Conclusions
Supplementary Materials
Acknowledgments
Author Contributions
Conflicts of Interest
Abbreviations
| anFP | Anthozoa fluorescent protein |
| avFP | Aequorea victoria fluorescent protein |
| C3M | Complex coacervate core micelles |
| CD | Circular dichroism |
| DLS | Dynamic light scattering |
| EGFP | Enhanced green fluorescent protein |
| FCS | Fluorescence correlation spectroscopy |
| FP | Fluorescent protein |
| FRET | Förster resonance energy transfer |
| GFP | Green fluorescent protein |
| mEGFP | Monomeric enhanced green fluorescent protein |
| mKO2 | Monomeric Kusabira Orange 2 |
| P128 | P2MVP128-b-PEO477 |
| P2MVP-b-PEO | poly(2-methyl-vinyl-pyridinium)-b-poly(ethylene-oxide) |
| P41 | P2MVP41-b-PEO205 |
| PDB | Protein Data Bank |
| PMC | Preferred micellar composition |
| SBFP2 | Strongly enhanced blue fluorescent protein 2 |
| SYFP2 | Strongly enhanced yellow fluorescent protein 2 |
| TagRFP | Tag red fluorescent protein |
References
- Miyawaki, A.; Niino, Y. Molecular spies for bioimaging—Fluorescent protein-based probes. Mol. Cell 2015, 58, 632–643. [Google Scholar] [CrossRef] [PubMed]
- Enterina, J.R.; Wu, L.; Campbell, R.E. Emerging fluorescent protein technologies. Curr. Opin. Chem. Biol. 2015, 27, 10–17. [Google Scholar] [CrossRef] [PubMed]
- Zimmer, M. Green fluorescent protein (GFP): Applications, structure, and related photophysical behavior. Chem. Rev. 2002, 102, 759–781. [Google Scholar] [CrossRef] [PubMed]
- Tsien, R.Y. The green fluorescent protein. Annu. Rev. Biochem. 1998, 67, 509–544. [Google Scholar] [CrossRef] [PubMed]
- Shimomura, O.; Johnson, F.H.; Saiga, Y. Extraction, purification and properties of aequorin, a bioluminescent protein from the luminous hydromedusan, Aequorea. J. Cell. Comp. Physiol. 1962, 59, 223–239. [Google Scholar] [CrossRef] [PubMed]
- Morise, H.; Shimomura, O.; Johnson, F.H.; Winant, J. Intermolecular energy transfer in the bioluminescent system of Aequorea. Biochemistry 1974, 13, 2656–2662. [Google Scholar] [CrossRef] [PubMed]
- Prasher, D.C.; Eckenrode, V.K.; Ward, W.W.; Prendergast, F.G.; Cormier, M.J. Primary structure of the Aequorea victoria green-fluorescent protein. Gene 1992, 111, 229–233. [Google Scholar] [CrossRef]
- Matz, M.V.; Fradkov, A.F.; Labas, Y.A.; Savitsky, A.P.; Zaraisky, A.G.; Markelov, M.L.; Lukyanov, S.A. Fluorescent proteins from nonbioluminescent Anthozoa species. Nat. Biotechnol. 1999, 17, 969–973. [Google Scholar] [CrossRef] [PubMed]
- Karasawa, S.; Araki, T.; Nagai, T.; Mizuno, H.; Miyawaki, A. Cyan-emitting and orange-emitting fluorescent proteins as a donor/acceptor pair for fluorescence resonance energy transfer. Biochem. J. 2004, 381, 307–312. [Google Scholar] [CrossRef] [PubMed]
- Merzlyak, E.M.; Goedhart, J.; Shcherbo, D.; Bulina, M.E.; Shcheglov, A.S.; Fradkov, A.F.; Gaintzeva, A.; Lukyanov, K.A.; Lukyanov, S.; Gadella, T.W.J.; et al. Bright monomeric red fluorescent protein with an extended fluorescence lifetime. Nat. Methods 2007, 4, 555–557. [Google Scholar] [CrossRef] [PubMed]
- Shcherbo, D.; Murphy, C.S.; Ermakova, G.V.; Solovieva, E.A.; Chepurnykh, T.V.; Shcheglov, A.S.; Verkhusha, V.V.; Pletnev, V.Z.; Hazelwood, K.L.; Roche, P.M.; et al. Far-red fluorescent tags for protein imaging in living tissues. Biochem. J. 2009, 418, 567–574. [Google Scholar] [CrossRef] [PubMed]
- Cranfill, P.J.; Sell, B.R.; Baird, M.A.; Allen, J.R.; Lavagnino, Z.; de Gruiter, H.M.; Kremers, G.J.; Davidson, M.W.; Ustione, A.; Piston, D.W. Quantitative assessment of fluorescent proteins. Nat. Methods 2016, 13, 557–562. [Google Scholar] [CrossRef] [PubMed]
- Shcherbo, D.; Merzlyak, E.M.; Chepurnykh, T.V.; Fradkov, A.F.; Ermakova, G.V.; Solovieva, E.A.; Lukyanov, K.A.; Bogdanova, E.A.; Zaraisky, A.G.; Lukyanov, S.; et al. Bright far-red fluorescent protein for whole-body imaging. Nat. Methods 2007, 4, 741–746. [Google Scholar] [CrossRef] [PubMed]
- Chudakov, D.M.; Matz, M.V.; Lukyanov, S.; Lukyanov, K.A. Fluorescent proteins and their applications in imaging living cells and tissues. Physiol. Rev. 2010, 90, 1103–1163. [Google Scholar] [CrossRef] [PubMed]
- Rhee, J.K.; Hovlid, M.; Fiedler, J.D.; Brown, S.D.; Manzenrieder, F.; Kitagishi, H.; Nycholat, C.; Paulson, J.C.; Finn, M.G. Colorful virus-like particles: Fluorescent protein packaging by the Qβ capsid. Biomacromolecules 2011, 12, 3977–3981. [Google Scholar] [CrossRef] [PubMed]
- Seebeck, F.P.; Woycechowsky, K.J.; Zhuang, W.; Rabe, J.P.; Hilvert, D. A simple tagging system for protein encapsulation. J. Am. Chem. Soc. 2006, 128, 4516–4517. [Google Scholar] [CrossRef] [PubMed]
- Minten, I.J.; Hendriks, L.J.; Nolte, R.J.; Cornelissen, J.J. Controlled encapsulation of multiple proteins in virus capsids. J. Am. Chem. Soc. 2009, 131, 17771–17773. [Google Scholar] [CrossRef] [PubMed]
- Nolles, A.; Westphal, A.H.; de Hoop, J.A.; Fokkink, R.G.; Kleijn, J.M.; van Berkel, W.J.H.; Borst, J.W. Encapsulation of GFP in complex coacervate core micelles. Biomacromolecules 2015, 16, 1542–1549. [Google Scholar] [CrossRef] [PubMed]
- Nolles, A.; van Dongen, N.J.E.; Westphal, A.H.; Visser, A.J.W.G.; Kleijn, J.M.; van Berkel, W.J.H.; Borst, J.W. Encapsulation into complex coacervate core micelles promotes EGFP dimerization. Phys. Chem. Chem. Phys. 2017, 19, 11380–11389. [Google Scholar] [CrossRef] [PubMed]
- Zacharias, D.A.; Violin, J.D.; Newton, A.C.; Tsien, R.Y. Partitioning of lipid-modified monomeric GFPs into membrane microdomains of live cells. Science 2002, 296, 913–916. [Google Scholar] [CrossRef] [PubMed]
- Sniegowski, J.A.; Phail, M.E.; Wachter, R.M. Maturation efficiency, trypsin sensitivity, and optical properties of Arg96, Glu222, and Gly67 variants of green fluorescent protein. Biochem. Biophys. Res. Commun. 2005, 332, 657–663. [Google Scholar] [CrossRef] [PubMed]
- Kremers, G.J.; Goedhart, J.; van den Heuvel, D.J.; Gerritsen, H.C.; Gadella, T.W.J. Improved green and blue fluorescent proteins for expression in bacteria and mammalian cells. Biochemistry 2007, 46, 3775–3783. [Google Scholar] [CrossRef] [PubMed]
- Goedhart, J.; von Stetten, D.; Noirclerc-Savoye, M.; Lelimousin, M.; Joosen, L.; Hink, M.A.; van Weeren, L.; Gadella, T.W.J.; Royant, A. Structure-guided evolution of cyan fluorescent proteins towards a quantum yield of 93%. Nat. Commun. 2012, 3, 751. [Google Scholar] [CrossRef] [PubMed]
- Kremers, G.J.; Goedhart, J.; van Munster, E.B.; Gadella, T.W.J. Cyan and yellow super fluorescent proteins with improved brightness, protein folding, and FRET Forster radius. Biochemistry 2006, 45, 6570–6580. [Google Scholar] [CrossRef] [PubMed]
- Sakaue-Sawano, A.; Kurokawa, H.; Morimura, T.; Hanyu, A.; Hama, H.; Osawa, H.; Kashiwagi, S.; Fukami, K.; Miyata, T.; Miyoshi, H.; et al. Visualizing spatiotemporal dynamics of multicellular cell-cycle progression. Cell 2008, 132, 487–498. [Google Scholar] [CrossRef] [PubMed]
- Shaner, N.C.; Campbell, R.E.; Steinbach, P.A.; Giepmans, B.N.; Palmer, A.E.; Tsien, R.Y. Improved monomeric red, orange and yellow fluorescent proteins derived from Discosoma sp. red fluorescent protein. Nat. Biotechnol. 2004, 22, 1567–1572. [Google Scholar] [CrossRef] [PubMed]
- Shu, X.; Shaner, N.C.; Yarbrough, C.A.; Tsien, R.Y.; Remington, S.J. Novel chromophores and buried charges control color in mFruits. Biochemistry 2006, 45, 9639–9647. [Google Scholar] [CrossRef] [PubMed]
- Albertazzi, L.; Arosio, D.; Marchetti, L.; Ricci, F.; Beltram, F. Quantitative FRET analysis with the EGFP-mCherry fluorescent protein pair. Photochem. Photobiol. 2009, 85, 287–297. [Google Scholar] [CrossRef] [PubMed]
- Arpino, J.A.; Rizkallah, P.J.; Jones, D.D. Crystal structure of enhanced green fluorescent protein to 1.35 A resolution reveals alternative conformations for Glu222. PLoS ONE 2012, 7, e47132. [Google Scholar] [CrossRef] [PubMed]
- Nolles, A. Encapsulation of mTurquoise2 and mTurquoise2-His; Wageningen University & Research: Wageningen, The Netherlands, 2017. [Google Scholar]
- Lindhoud, S.; Norde, W.; Cohen Stuart, M.A. Reversibility and relaxation behavior of polyelectrolyte complex micelle formation. J. Phys. Chem. B 2009, 113, 5431–5439. [Google Scholar] [CrossRef] [PubMed]
- Rostkowski, M.; Olsson, M.H.M.; Søndergaard, C.R.; Jensen, J.H. Graphical analysis of pH-dependent properties of proteins predicted using PROPKA. BMC Struct. Biol. 2011, 11, 6. [Google Scholar] [CrossRef] [PubMed]
- Olsson, M.H.; Søndergaard, C.R.; Rostkowski, M.; Jensen, J.H. PROPKA3: Consistent treatment of internal and surface residues in empirical pKa predictions. J. Chem. Theory Comput. 2011, 7, 525–537. [Google Scholar] [CrossRef] [PubMed]
- Berman, H.M.; Westbrook, J.; Feng, Z.; Gilliland, G.; Bhat, T.N.; Weissig, H.; Shindyalov, I.N.; Bourne, P.E. The protein data bank. Nucleic Acids Res. 2000, 28, 235–242. [Google Scholar] [CrossRef] [PubMed]
- Haupts, U.; Maiti, S.; Schwille, P.; Webb, W.W. Dynamics of fluorescence fluctuations in green fluorescent protein observed by fluorescence correlation spectroscopy. Proc. Natl. Acad. Sci. USA 1998, 95, 13573–13578. [Google Scholar] [CrossRef] [PubMed]
- Han, L.; Zhao, Y.; Zhang, X.; Peng, J.; Xu, P.; Huan, S.; Zhang, M. RFP tags for labeling secretory pathway proteins. Biochem. Biophys. Res. Commun. 2014, 447, 508–512. [Google Scholar] [CrossRef] [PubMed]
- Nolles, A. CD Spectra of Fluorescent Proteins at pH 9.0 or 10.0 and at pH 7.0; Wageningen University & Research: Wageningen, The Netherlands, 2017. [Google Scholar]
- Visser, N.V.; Hink, M.A.; Borst, J.W.; van der Krogt, G.N.M.; Visser, A.J.W.G. Circular dichroism spectroscopy of fluorescent proteins. FEBS Lett. 2002, 521, 31–35. [Google Scholar] [CrossRef]
- Brahms, S.; Brahms, J. Determination of protein secondary structure in solution by vacuum ultraviolet circular dichroism. J. Mol. Biol. 1980, 138, 149–178. [Google Scholar] [CrossRef]
- Woody, R.W. Circular dichroism. Methods Enzymol. 1995, 246, 34–71. [Google Scholar] [PubMed]
- Voets, I.K.; de Keizer, A.; Cohen Stuart, M.A. Complex coacervate core micelles. Adv. Colloid Interface Sci. 2009, 147–148, 300–318. [Google Scholar] [CrossRef] [PubMed]
- Blocher, W.C.; Perry, S.L. Complex coacervate-based materials for biomedicine. WIREs Nanomed. Nanobiotechnol. 2016. [Google Scholar] [CrossRef] [PubMed]
- Kayitmazer, A.B.; Seyrek, E.; Dubin, P.L.; Staggemeier, B.A. Influence of chain stiffness on the interaction of polyelectrolytes with oppositely charged micelles and proteins. J. Phys. Chem. B 2003, 107, 8158–8165. [Google Scholar] [CrossRef]
- Cooper, C.L.; Goulding, A.; Kayitmazer, A.B.; Ulrich, S.; Stoll, S.; Turksen, S.; Yusa, S.; Kumar, A.; Dubin, P.L. Effects of polyelectrolyte chain stiffness, charge mobility, and charge sequences on binding to proteins and micelles. Biomacromolecules 2006, 7, 1025–1035. [Google Scholar] [CrossRef] [PubMed]
- Du, X.; Dubin, P.L.; Hoagland, D.A.; Sun, L. Protein-selective coacervation with hyaluronic acid. Biomacromolecules 2014, 15, 726–734. [Google Scholar] [CrossRef] [PubMed]
- De Vos, W.M.; Leermakers, F.A.; de Keizer, A.; Cohen Stuart, M.A.; Kleijn, J.M. Field theoretical analysis of driving forces for the uptake of proteins by like-charged polyelectrolyte brushes: Effects of charge regulation and patchiness. Langmuir 2010, 26, 249–259. [Google Scholar] [CrossRef] [PubMed]
- Day, R.N.; Davidson, M.W. The fluorescent protein palette: Tools for cellular imaging. Chem. Soc. Rev. 2009, 38, 2887–2921. [Google Scholar] [CrossRef] [PubMed]
- Micsonai, A.; Wien, F.; Kernya, L.; Lee, Y.H.; Goto, Y.; Refregiers, M.; Kardos, J. Accurate secondary structure prediction and fold recognition for circular dichroism spectroscopy. Proc. Natl. Acad. Sci. USA 2015, 112, E3095–E3103. [Google Scholar] [CrossRef] [PubMed]
- Dolinsky, T.J.; Czodrowski, P.; Li, H.; Nielsen, J.E.; Jensen, J.H.; Klebe, G.; Baker, N.A. PDB2PQR: Expanding and upgrading automated preparation of biomolecular structures for molecular simulations. Nucleic Acids Res. 2007, 35, W522–W525. [Google Scholar] [CrossRef] [PubMed]
- Baker, N.A.; Sept, D.; Joseph, S.; Holst, M.J.; McCammon, J.A. Electrostatics of nanosystems: Application to microtubules and the ribosome. Proc. Natl. Acad. Sci. USA 2001, 98, 10037–10041. [Google Scholar] [CrossRef] [PubMed]
- Schrödinger, LLC. The MacPyMOL Molecular Graphics System, Version 1.4; Schrödinger, LLC: New York, NY, USA, 2016. [Google Scholar]
- Chong, S.; Mersha, F.B.; Comb, D.G.; Scott, M.E.; Landry, D.; Vence, L.M.; Perler, F.B.; Benner, J.; Kucera, R.B.; Hirvonen, C.A.; et al. Single-column purification of free recombinant proteins using a self-cleavable affinity tag derived from a protein splicing element. Gene 1997, 192, 271–281. [Google Scholar] [CrossRef]
- Evans, T.C., Jr.; Xu, M.Q. Intein-mediated protein ligation: Harnessing nature′s escape artists. Biopolymers 1999, 51, 333–342. [Google Scholar] [CrossRef]
- Xu, M.Q.; Paulus, H.; Chong, S. Fusions to self-splicing inteins for protein purification. Methods Enzymol. 2000, 326, 376–418. [Google Scholar] [PubMed]
- Biasini, M.; Bienert, S.; Waterhouse, A.; Arnold, K.; Studer, G.; Schmidt, T.; Kiefer, F.; Gallo Cassarino, T.; Bertoni, M.; Bordoli, L.; et al. SWISS-MODEL: Modelling protein tertiary and quaternary structure using evolutionary information. Nucleic Acids Res. 2014, 42, W252–W258. [Google Scholar] [CrossRef] [PubMed]
- Arnold, K.; Bordoli, L.; Kopp, J.; Schwede, T. The SWISS-MODEL workspace: A web-based environment for protein structure homology modelling. Bioinformatics 2006, 22, 195–201. [Google Scholar] [CrossRef] [PubMed]
- Kiefer, F.; Arnold, K.; Künzli, M.; Bordoli, L.; Schwede, T. The SWISS-MODEL repository and associated resources. Nucleic Acids Res. 2009, 37, D387–D392. [Google Scholar] [CrossRef] [PubMed]
- Guex, N.; Peitsch, M.C.; Schwede, T. Automated comparative protein structure modeling with SWISS-MODEL and Swiss-PdbViewer: A historical perspective. Electrophoresis 2009, 30, S162–S173. [Google Scholar] [CrossRef] [PubMed]
- Subach, O.M.; Malashkevich, V.N.; Zencheck, W.D.; Morozova, K.S.; Piatkevich, K.D.; Almo, S.C.; Verkhusha, V.V. Structural characterization of acylimine-containing blue and red chromophores in mTagBFP and TagRFP fluorescent proteins. Chem. Biol. 2010, 17, 333–341. [Google Scholar] [CrossRef] [PubMed]
- Wachter, R.M.; King, B.A.; Heim, R.; Kallio, K.; Tsien, R.Y.; Boxer, S.G.; Remington, S.J. Crystal structure and photodynamic behavior of the blue emission variant Y66H/Y145F of green fluorescent protein. Biochemistry 1997, 36, 9759–9765. [Google Scholar] [CrossRef] [PubMed]
- Rekas, A.; Alattia, J.R.; Nagai, T.; Miyawaki, A.; Ikura, M. Crystal structure of venus, a yellow fluorescent protein with improved maturation and reduced environmental sensitivity. J. Biol. Chem. 2002, 277, 50573–50578. [Google Scholar] [CrossRef] [PubMed]
- Kikuchi, A.; Fukumura, E.; Karasawa, S.; Mizuno, H.; Miyawaki, A.; Shiro, Y. Structural characterization of a thiazoline-containing chromophore in an orange fluorescent protein, monomeric Kusabira Orange. Biochemistry 2008, 47, 11573–11580. [Google Scholar] [CrossRef] [PubMed]
- Koppel, D.E. Analysis of macromolecular polydispersity in intensity correlation spectroscopy—Method of cumulants. J. Chem. Phys. 1972, 57, 4814–4820. [Google Scholar] [CrossRef]
- Berne, B.J.; Pecora, R. Dynamic Light Scattering with Application to Chemistry, Biology and Physics; Courier Dover: New York, NY, USA, 1976. [Google Scholar]
- Provencher, S.W. Contin—A general-purpose constrained regularization program for inverting noisy linear algebraic and integral-equations. Comput. Phys. Commun. 1982, 27, 229–242. [Google Scholar] [CrossRef]
- Provencher, S.W. A constrained regularization method for inverting data represented by linear algebraic or integral-equations. Comput. Phys. Commun. 1982, 27, 213–227. [Google Scholar] [CrossRef]
- Skakun, V.V.; Hink, M.A.; Digris, A.V.; Engel, R.; Novikov, E.G.; Apanasovich, V.V.; Visser, A.J.W.G. Global analysis of fluorescence fluctuation data. Eur. Biophys. J. 2005, 34, 323–334. [Google Scholar] [CrossRef] [PubMed]
- Skakun, V.V.; Engel, R.; Digris, A.V.; Borst, J.W.; Visser, A.J.W.G. Global analysis of autocorrelation functions and photon counting distributions. Front. Biosci. Elite Ed. 2011, 3, 489–505. [Google Scholar] [CrossRef] [PubMed]
- Velapoldi, R.A.; Tonnesen, H.H. Corrected emission spectra and quantum yields for a series of fluorescent compounds in the visible spectral region. J. Fluoresc. 2004, 14, 465–472. [Google Scholar] [CrossRef] [PubMed]
- Huang, X.Q.; Miller, W. A time-efficient, linear-space local similarity algorithm. Adv. Appl. Math. 1991, 12, 337–357. [Google Scholar] [CrossRef]
- Robert, X.; Gouet, P. Deciphering key features in protein structures with the new ENDscript server. Nucleic Acids Res. 2014, 42, W320–W324. [Google Scholar] [CrossRef] [PubMed]
- Shealy, P.; Valafar, H. Multiple structure alignment with msTALI. BMC Bioinform. 2012, 13, 105. [Google Scholar] [CrossRef] [PubMed]
- Von Stetten, D.; Noirclerc-Savoye, M.; Goedhart, J.; Gadella, T.W., Jr.; Royant, A. Structure of a fluorescent protein from Aequorea victoria bearing the obligate-monomer mutation A206K. Acta Crystallogr. Sect. F Struct. Biol. Cryst. Commun. 2012, 68, 878–882. [Google Scholar] [CrossRef] [PubMed]
- Yang, T.T.; Cheng, L.; Kain, S.R. Optimized codon usage and chromophore mutations provide enhanced sensitivity with the green fluorescent protein. Nucleic Acids Res. 1996, 24, 4592–4593. [Google Scholar] [CrossRef] [PubMed]


| Fluorescent Protein Variant | Charge | P2MVP41-b-PEO205 | P2MVP128-b-PEO477 | ||
|---|---|---|---|---|---|
| PMC (F+) | Radius (nm) | PMC (F+) | Radius (nm) | ||
| SBFP2 | −8.96 | 0.75 | 38.3 ± 0.5 | 0.70 | 33.6 ± 0.2 |
| mTurquoise2 | −11.30 | 0.70 | 37.1 ± 1.0 | 0.70 | 33.9 ± 0.5 |
| mEGFP | −9.87 | 0.70 | 30.4 ± 0.5 | 0.65 | 32.2 ± 0.2 |
| SYFP2 | −9.75 | 0.70 | 30.4 ± 0.4 | 0.60 | 35.2 ± 0.7 |
| mKO2 | −13.09 | 0.65 | 25.7 ± 0.5 | 0.60 | 28.3 ± 0.5 |
| TagRFP a | −10.35 | 0.70 | 36.7 ± 5.0 | 0.65 | 33.3 ± 1.9 |
| mCherry | −8.93 | 0.75 | 30.0 ± 0.8 | 0.75 | 35.1 ± 1.0 |
| Fluorescent Protein Variant | Free Protein | C3M_P41 | C3M_P128 |
|---|---|---|---|
| SBFP2 | 0.47 | 0.47 | 0.46 |
| mTurquoise2 | 0.93 | 0.84 | 0.88 |
| mEGFP | 0.60 | 0.44 | 0.50 |
| SYFP2 | 0.68 | 0.60 | 0.62 |
| mKO2 | 0.62 | 0.41 | 0.45 |
| TagRFP | 0.48 | 0.33 | 0.25 |
| mCherry | 0.22 | 0.25 | 0.24 |
| Protein | Laser Line (nm) | Spectral Filter (nm) |
|---|---|---|
| mTurquoise2 | 440 | 475–500 |
| mEGFP | 488 | 495–525 |
| SYFP2 | 514 | 520–550 |
| mKO2 | 550 | 650–600 |
| TagRFP and mCherry | 561 | 575–610 |
© 2017 by the authors. Licensee MDPI, Basel, Switzerland. This article is an open access article distributed under the terms and conditions of the Creative Commons Attribution (CC BY) license (http://creativecommons.org/licenses/by/4.0/).
Share and Cite
Nolles, A.; Westphal, A.H.; Kleijn, J.M.; Van Berkel, W.J.H.; Borst, J.W. Colorful Packages: Encapsulation of Fluorescent Proteins in Complex Coacervate Core Micelles. Int. J. Mol. Sci. 2017, 18, 1557. https://doi.org/10.3390/ijms18071557
Nolles A, Westphal AH, Kleijn JM, Van Berkel WJH, Borst JW. Colorful Packages: Encapsulation of Fluorescent Proteins in Complex Coacervate Core Micelles. International Journal of Molecular Sciences. 2017; 18(7):1557. https://doi.org/10.3390/ijms18071557
Chicago/Turabian StyleNolles, Antsje, Adrie H. Westphal, J. Mieke Kleijn, Willem J. H. Van Berkel, and Jan Willem Borst. 2017. "Colorful Packages: Encapsulation of Fluorescent Proteins in Complex Coacervate Core Micelles" International Journal of Molecular Sciences 18, no. 7: 1557. https://doi.org/10.3390/ijms18071557
APA StyleNolles, A., Westphal, A. H., Kleijn, J. M., Van Berkel, W. J. H., & Borst, J. W. (2017). Colorful Packages: Encapsulation of Fluorescent Proteins in Complex Coacervate Core Micelles. International Journal of Molecular Sciences, 18(7), 1557. https://doi.org/10.3390/ijms18071557