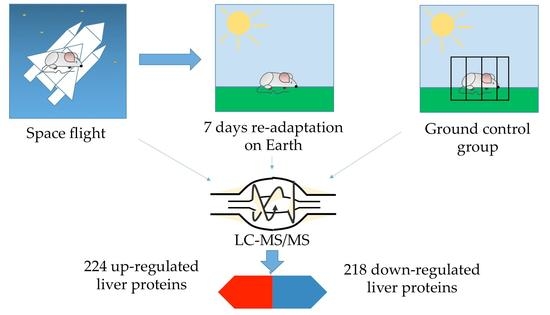
Re-adaption on Earth after Spaceflights Affects the Mouse Liver Proteome


Abstract
:
1. Introduction
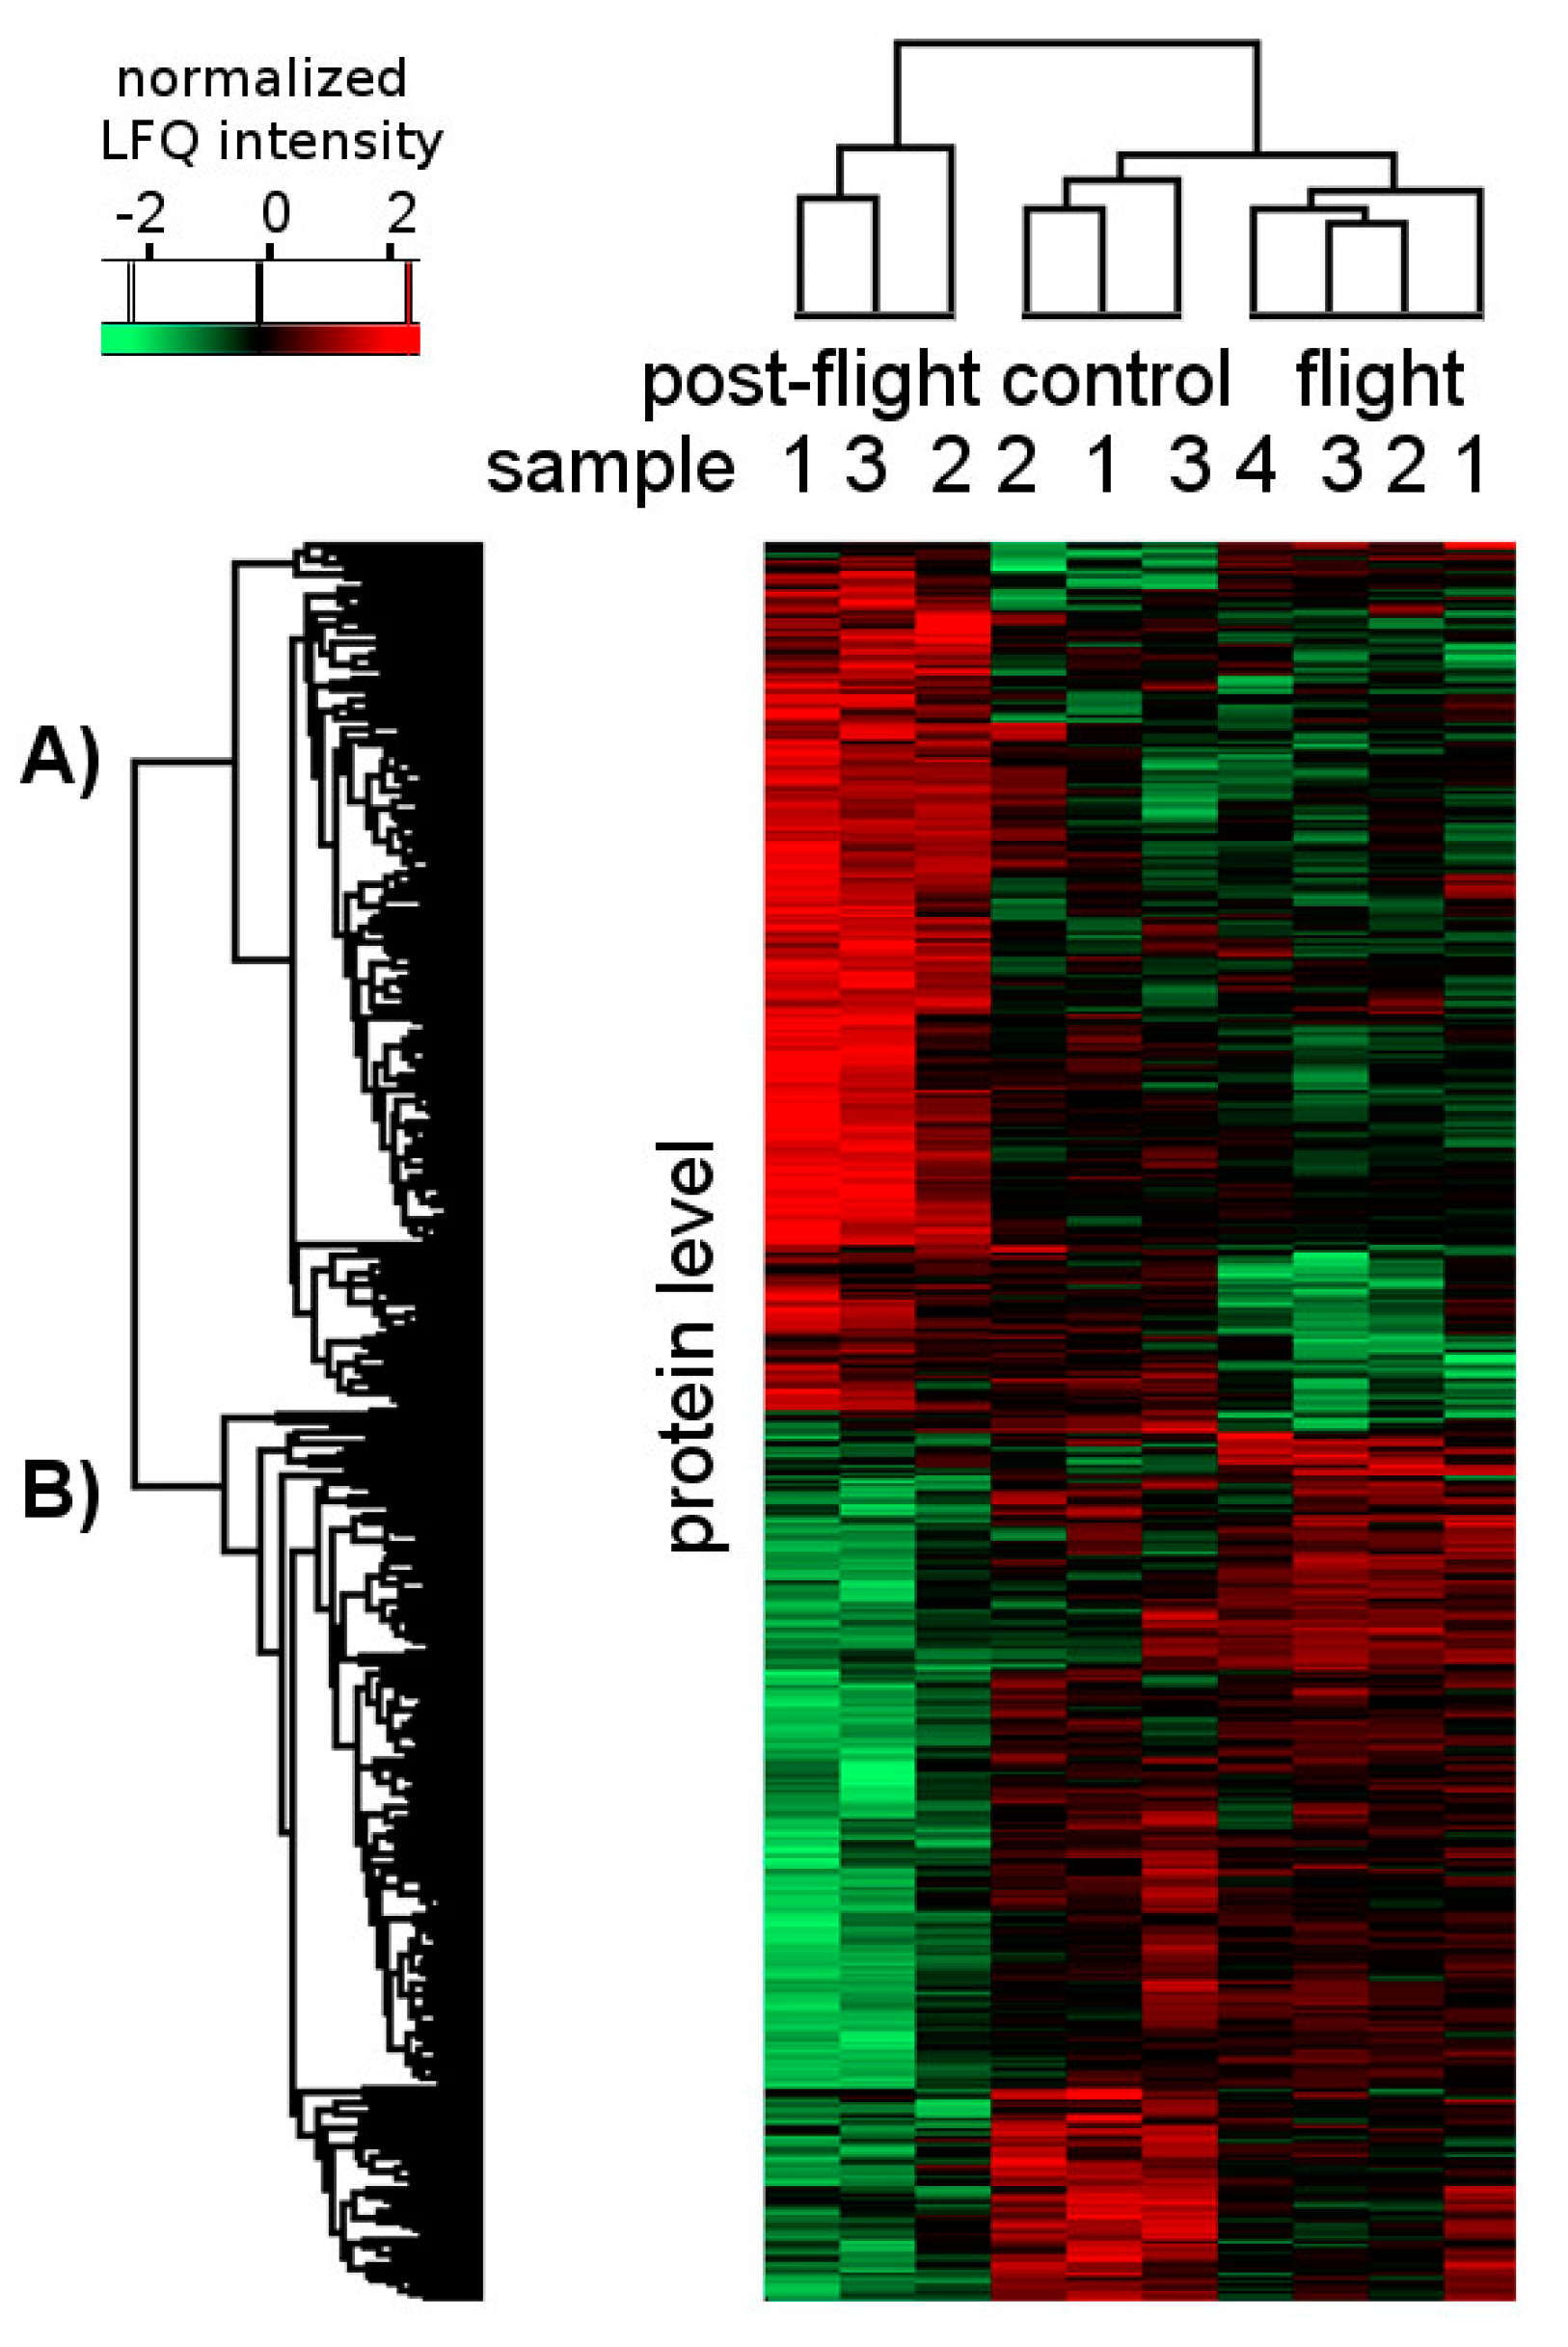
2. Results
3. Discussion
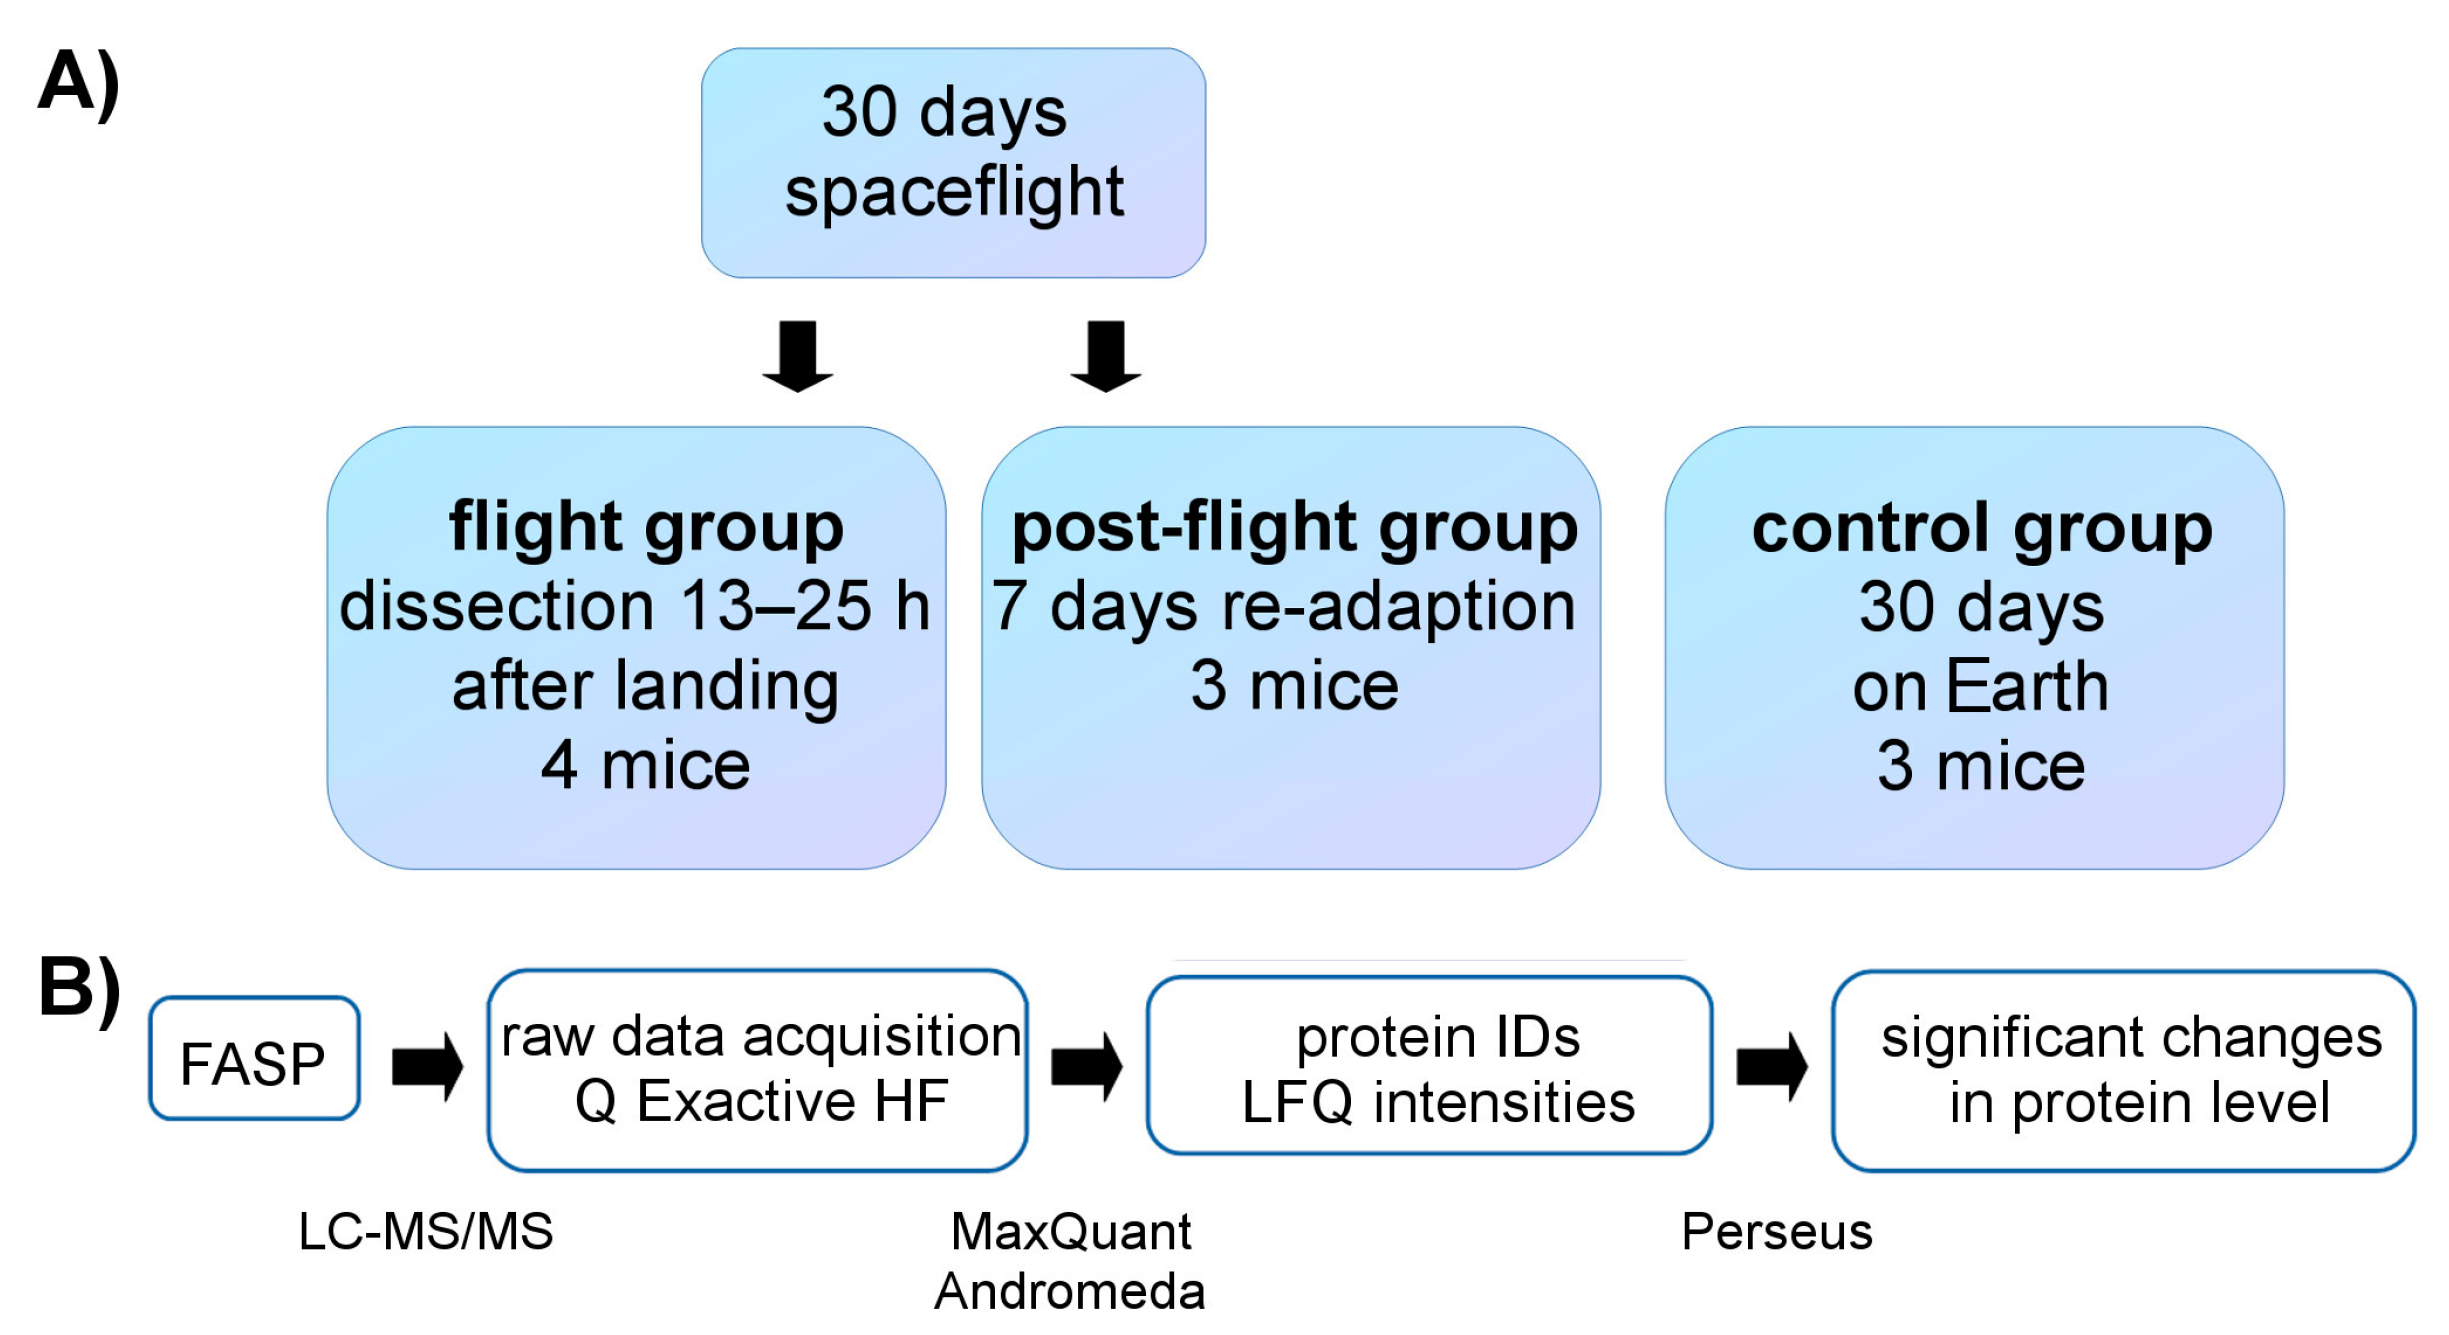
4. Materials and Methods
4.1. Samples
4.2. Sample Preparation
4.3. LC-MS/MS
4.4. Data Processing
4.5. Statistical Analysis
5. Conclusions
Supplementary Materials
Acknowledgments
Author Contributions
Conflicts of Interest
Abbreviations
| PPAR | Peroxisome proliferator-activated receptor |
| FDR | False discovery rates |
| CYP | Cytochrome P450 |
| FASP | Filter aided sample preparation |
| LFQ | Label-free quantification |
| NAFLD | Non-alcoholic fatty liver disease |
| FABP | Fatty acid binding protein |
| ID | Identification number |
| GOCC | GeneOntology cell compartment |
| GOMF | GeneOntology molecular function |
| GOBP | GeneOntology biological process |
| KEGG | Kyoto Encyclopedia of Genes and Genomes |
References
- Andreev-Andrievskiy, A.; Popova, A.; Boyle, R.; Alberts, J.; Shenkman, B.; Vinogradova, O.; Dolgov, O.; Anokhin, K.; Tsvirkun, D.; Soldatov, P.; et al. Mice in Bion-M 1 Space Mission: Training and Selection. PLoS ONE 2014, 9, e104830. [Google Scholar] [CrossRef] [PubMed]
- McDonnell, A.M.; Dang, C.H. Basic review of the cytochrome p450 system. J. Adv. Pract. Oncol. 2013, 4, 263–268. [Google Scholar] [PubMed]
- Aebersold, R.; Mann, M. Mass spectrometry-based proteomics. Nature 2003, 422, 198–207. [Google Scholar] [CrossRef] [PubMed]
- Jonscher, K.R.; Alfonso-Garcia, A.; Suhalim, J.L.; Orlicky, D.J.; Potma, E.O.; Ferguson, V.L.; Bouxsein, M.L.; Bateman, T.A.; Stodieck, L.S.; Levi, M.; et al. Spaceflight Activates Lipotoxic Pathways in Mouse Liver. PLoS ONE 2016, 11, e0152877. [Google Scholar] [CrossRef]
- Gillet, L.C.; Leitner, A.; Aebersold, R. Mass Spectrometry Applied to Bottom-Up Proteomics: Entering the High-Throughput Era for Hypothesis Testing. Annu. Rev. Anal. Chem. 2016, 9, 449–472. [Google Scholar] [CrossRef] [PubMed]
- Pawlak, M.; Lefebvre, P.; Staels, B. Molecular mechanism of PPARα action and its impact on lipid metabolism, inflammation and fibrosis in non-alcoholic fatty liver disease. J. Hepatol. 2015, 62, 720–733. [Google Scholar] [CrossRef] [PubMed]
- Rui, L. Energy Metabolism in the Liver. In Comprehensive Physiology; John Wiley & Sons, Inc.: Hoboken, NJ, USA, 2014; Vol. 4, pp. 177–197. [Google Scholar]
- Tyanova, S.; Temu, T.; Sinitcyn, P.; Carlson, A.; Hein, M.Y.; Geiger, T.; Mann, M.; Cox, J. The Perseus computational platform for comprehensive analysis of (prote)omics data. Nat. Methods 2016, 13, 731–740. [Google Scholar] [CrossRef] [PubMed]
- Boyer, J.L. Bile Formation and Secretion. In Comprehensive Physiology; John Wiley & Sons, Inc.: Hoboken, NJ, USA, 2013; Vol. 3, pp. 1035–1078. [Google Scholar]
- Oswald, M.; Kullak-Ublick, G.A.; Paumgartner, G.; Beuers, U. Expression of hepatic transporters OATP-C and MRP2 in primary sclerosing cholangitis. Liver 2001, 21, 247–253. [Google Scholar] [CrossRef] [PubMed]
- Frayn, K.N.; Arner, P.; Yki-Järvinen, H. Fatty acid metabolism in adipose tissue, muscle and liver in health and disease. Essays Biochem. 2006, 42, 89–103. [Google Scholar] [CrossRef] [PubMed]
- Vildhede, A.; Wiśniewski, J.R.; Norén, A.; Karlgren, M.; Artursson, P. Comparative Proteomic Analysis of Human Liver Tissue and Isolated Hepatocytes with a Focus on Proteins Determining Drug Exposure. J. Proteome Res. 2015, 14, 3305–3314. [Google Scholar] [CrossRef] [PubMed]
- Merrick, B.A.; Madenspacher, J.H. Complementary gene and protein expression studies and integrative approaches in toxicogenomics. Toxicol. Appl. Pharmacol. 2005, 207, 189–194. [Google Scholar] [CrossRef] [PubMed]
- Shirakami, Y.; Lee, S.-A.; Clugston, R.D.; Blaner, W.S. Hepatic metabolism of retinoids and disease associations. Biochim. Biophys. Acta-Mol. Cell Biol. Lipids 2012, 1821, 124–136. [Google Scholar] [CrossRef] [PubMed]
- Shaw, N.; Elholm, M.; Noy, N. Retinoic acid is a high affinity selective ligand for the peroxisome proliferator-activated receptor beta/delta. J. Biol. Chem. 2003, 278, 41589–41592. [Google Scholar] [CrossRef] [PubMed]
- Ziouzenkova, O.; Plutzky, J. Retinoid metabolism and nuclear receptor responses: New insights into coordinated regulation of the PPAR-RXR complex. FEBS Lett. 2008, 582, 32–38. [Google Scholar] [CrossRef] [PubMed]
- Radominska, A.; Little, J.M.; Lehman, P.A.; Samokyszyn, V.; Rios, G.R.; King, C.D.; Green, M.D.; Tephly, T.R. Glucuronidation of retinoids by rat recombinant UDP: Glucuronosyltransferase 1.1 (bilirubin UGT). Drug Metab. Dispos. 1997, 25, 889–892. [Google Scholar] [PubMed]
- Eun, J.W.; Bae, H.J.; Shen, Q.; Park, S.J.; Kim, H.S.; Shin, W.C.; Yang, H.D.; Jin, C.Y.; You, J.S.; Kang, H.J.; et al. Characteristic molecular and proteomic signatures of drug-induced liver injury in a rat model. J. Appl. Toxicol. 2015, 35, 152–164. [Google Scholar] [CrossRef] [PubMed]
- Wanders, R.J. A.; Komen, J.; Kemp, S. Fatty acid omega-oxidation as a rescue pathway for fatty acid oxidation disorders in humans. FEBS J. 2011, 278, 182–194. [Google Scholar] [CrossRef] [PubMed]
- Burns, K.A.; Vanden Heuvel, J.P. Modulation of PPAR activity via phosphorylation. Biochim. Biophys. Acta 2007, 1771, 952–960. [Google Scholar] [CrossRef] [PubMed]
- Fan, J.-G.; Cao, H.-X. Role of diet and nutritional management in non-alcoholic fatty liver disease. J. Gastroenterol. Hepatol. 2013, 28, 81–87. [Google Scholar] [CrossRef] [PubMed]
- Moskaleva, N.; Moysa, A.; Novikova, S.; Tikhonova, O.; Zgoda, V.; Archakov, A. Spaceflight Effects on Cytochrome P450 Content in Mouse Liver. PLoS ONE 2015, 10, e0142374. [Google Scholar] [CrossRef] [PubMed]
- Wang, B.; Zhou, S.F. Synthetic and natural compounds that interact with human cytochrome P450 1A2 and implications in drug development. Curr. Med. Chem. 2009, 16, 4066–4218. [Google Scholar] [CrossRef] [PubMed]
- Shao, Y.; Yin, X.; Kang, D.; Shen, B.; Zhu, Z.; Li, X.; Li, H.; Xie, L.; Wang, G.; Liang, Y. An integrated strategy for the quantitative analysis of endogenous proteins: A case of gender-dependent expression of P450 enzymes in rat liver microsome. Talanta 2017, 170, 514–522. [Google Scholar] [CrossRef] [PubMed]
- Walker, J.M. The Bicinchoninic Acid (BCA) Assay for Protein Quantitation. In Basic Protein and Peptide Protocols; Humana Press: Totowa, New Jersey, USA, 1994; Vol. 32, pp. 5–8. [Google Scholar]
- Wiśniewski, J.R.; Zougman, A.; Nagaraj, N.; Mann, M. Universal sample preparation method for proteome analysis. Nat. Methods 2009, 6, 359–362. [Google Scholar] [CrossRef] [PubMed]
- Vizcaíno, J.A.; Côté, R.G.; Csordas, A.; Dianes, J.A.; Fabregat, A.; Foster, J.M.; Griss, J.; Alpi, E.; Birim, M.; Contell, J.; et al. The PRoteomics IDEntifications (PRIDE) database and associated tools: Status in 2013. Nucleic Acids Res. 2013, 41, D1063–D1069. [Google Scholar] [CrossRef] [PubMed]
- Cox, J.; Mann, M. MaxQuant enables high peptide identification rates, individualized p.p.b.-range mass accuracies and proteome-wide protein quantification. Nat. Biotechnol. 2008, 26, 1367–1372. [Google Scholar] [CrossRef] [PubMed]
- Cox, J.; Neuhauser, N.; Michalski, A.; Scheltema, R.A.; Olsen, J.V.; Mann, M. Andromeda: A Peptide Search Engine Integrated into the MaxQuant Environment. J. Proteome Res. 2011, 10, 1794–1805. [Google Scholar] [CrossRef] [PubMed]
- Cox, J.; Hein, M.Y.; Luber, C.A.; Paron, I.; Nagaraj, N.; Mann, M. Accurate proteome-wide label-free quantification by delayed normalization and maximal peptide ratio extraction, termed MaxLFQ. Mol. Cell Proteom. 2014, 13, 2513–2526. [Google Scholar] [CrossRef] [PubMed]


| Type | Name | p-Value | Enrichment | Total | In Cluster | Cluster Size | Benj. Hoch. FDR |
|---|---|---|---|---|---|---|---|
| Cluster A: Significantly Higher Protein Levels in Post-flight Group | |||||||
| GOCC name | Ribonucleoprotein complex | 1.62 × 10⁻¹⁴ | 1.92 | 55 | 52 | 218 | 1.90 × 10⁻¹² |
| KEGG name | Ribosome | 1.70 × 10⁻¹¹ | 1.97 | 38 | 37 | 218 | 3.13 × 10⁻⁹ |
| GOBP name | Cellular amino acid metabolic process | 2.23 × 10⁻¹² | 1.82 | 59 | 53 | 218 | 7.79 × 10⁻⁹ |
| GOBP name | Cellular nitrogen compound metabolic process | 1.07 × 10⁻¹¹ | 1.54 | 116 | 88 | 218 | 1.87 × 10⁻⁸ |
| GOMF name | Structural constituent of ribosome | 3.68 × 10⁻¹¹ | 1.97 | 37 | 36 | 218 | 3.37 × 10⁻⁸ |
| GOBP name | Nitrogen compound metabolic process | 3.29 × 10⁻¹¹ | 1.52 | 119 | 89 | 218 | 3.83 × 10⁻⁸ |
| GOCC name | Mitochondrial matrix | 1.69 × 10⁻⁹ | 1.91 | 36 | 34 | 218 | 9.86 × 10⁻⁸ |
| GOBP name | Cellular amine metabolic process | 6.56 × 10⁻¹⁰ | 1.71 | 63 | 53 | 218 | 5.73 × 10⁻⁷ |
| GOBP name | Translation | 1.69 × 10⁻⁹ | 1.91 | 36 | 34 | 218 | 9.81 × 10⁻⁷ |
| GOBP name | Macromolecule biosynthetic process | 1.41 × 10⁻⁹ | 1.76 | 53 | 46 | 218 | 9.84 × 10⁻⁷ |
| Cluster B: Significantly Lower Protein Levels in Post-flight Group | |||||||
| GOCC name | Membrane part | 1.04 × 10⁻³⁰ | 1.65 | 173 | 145 | 224 | 4.85 × 10⁻²⁸ |
| GOCC name | Intrinsic to membrane | 6.62 × 10⁻²³ | 1.80 | 102 | 93 | 224 | 1.03 × 10⁻²⁰ |
| GOCC name | Integral to membrane | 6.62 × 10⁻²³ | 1.80 | 102 | 93 | 224 | 1.55 × 10⁻²⁰ |
| GOCC name | Organelle membrane | 3.49 × 10⁻¹⁴ | 1.47 | 157 | 117 | 224 | 3.26 × 10⁻¹² |
| GOCC name | Endoplasmic reticulum part | 7.21 × 10⁻¹² | 1.72 | 69 | 60 | 224 | 5.63 × 10⁻¹⁰ |
| GOCC name | Endoplasmic reticulum | 5.52 × 10⁻¹¹ | 1.84 | 46 | 43 | 224 | 3.69 × 10⁻⁹ |
| GOCC name | Endoplasmic reticulum membrane | 2.47 × 10⁻⁹ | 1.72 | 54 | 47 | 224 | 1.28 × 10⁻⁷ |
| GOCC name | Plasma membrane part | 5.85 × 10⁻⁸ | 1.67 | 52 | 44 | 224 | 2.74 × 10⁻⁶ |
| GOCC name | Membrane | 4.95 × 10⁻⁷ | 1.19 | 260 | 157 | 224 | 2.10 × 10⁻⁵ |
| GOMF name | Transporter activity | 1.46 × 10⁻⁶ | 1.78 | 31 | 28 | 224 | 2.67 × 10⁻⁴ |
| Protein Name | Uniprot ID | Fold Change: Control/Post-flight | Fold Change: Flight/Post-flight | Student’s t-Test q-Value | ANOVA q-Value |
|---|---|---|---|---|---|
| Bile Secretion1 | |||||
| Solute carrier organic anion transporter family member 1B2 | Q9JJL3 | - | 1.7 | 0.0187 | 0.0143 |
| ATP-binding cassette sub-family G member 2 | Q7TMS5 | - | 2.7 | 0.0106 | 0.0131 |
| Scavenger receptor class B member 1 | Q4FK30 | * | >0.05 | 0.0198 | |
| Solute carrier family 22 member 1 | O08966 | * | >0.05 | 0.0197 | |
| Sodium/potassium-transporting ATPase subunit β-1 | Q545P0 | - | 1.6 | 0.0127 | 0.0132 |
| Sodium/potassium-transporting ATPase subunit beta-3 | Q544Q7 | - | 2.4 | 0.0171 | 0.0116 |
| Aquaporin-1 | Q02013 | * | >0.05 | 0.0211 | |
| Solute carrier organic anion transporter family member 1A1 | Q53ZW9 | - | 4.0 | 0.0293 | 0.0291 |
| Sodium/potassium-transporting ATPase subunit alpha-1 | Q8VDN2 | 1.9 | 1.6 | 0.0165 | 0.0122 |
| Epoxide hydrolase 1 | Q9D379 | - | 1.9 | 0.0077 | 0.0278 |
| PPAR Signaling Pathway 1 | |||||
| Long-chain specific acyl-CoA dehydrogenase, mitochondrial | P51174 | - | 0.6 | 0.0340 | 0.0374 |
| Long-chain-fatty-acid--CoA ligase 1 | D3Z041 | - | 1.9 | 0.0052 | 0.0075 |
| Very long-chain acyl-CoA synthetase | O35488 | - | 1.5 | 0.0247 | 0.0341 |
| Cytochrome P450 4A10 | O88833 | * | >0.05 | 0.0154 | |
| Fatty acid-binding protein, liver | Q3V2F7 | - | 3.9 | 0.0080 | 0.0187 |
| Acyl-CoA-binding protein | Q548W7 | * | >0.05 | 0.0374 | |
| Medium-chain specific acyl-CoA dehydrogenase, mitochondrial | P45952 | 0.5 | 0.6 | 0.0457 | 0.0132 |
| Carnitine O-palmitoyltransferase 2, mitochondrial | P52825 | - | 1.7 | 0.0110 | 0.0115 |
| Carnitine O-palmitoyltransferase 1, liver isoform | Q7TQD5 | * | >0.05 | 0.0153 | |
| CD36 antigen, isoform CRA_a | Q3UAI3 | - | 2.1 | 0.0044 | 0.0255 |
| Cytochrome P450 4A12A | Q91WL5 | - | 5.0 | 0.0113 | 0.0128 |
| Peroxisomal bifunctional enzyme | Q9DBM2 | - | 0.6 | 0.0141 | 0.0116 |
| Phosphoenol pyruvate carboxy kinase, cytosolic [GTP] | Q9Z2V4 | * | >0.05 | 0.0271 | |
| Retinol Metabolism 1 | |||||
| Cytochrome P450 1A2 | B6VGH4 | - | 2.7 | 0.0117 | 0.0125 |
| Cytochrome P450 2B10 | Q9WUD0 | * | >0.05 | 0.0120 | |
| Cytochrome P450 4A10 | O88833 | * | >0.05 | 0.0154 | |
| Cytochrome P450 3A11 | Q3UEN8 | - | 0.7 | 0.0198 | 0.0166 |
| UDP-glucuronosyltransferase | Q3UEP4 | - | 2.1 | 0.0167 | 0.0132 |
| Cytochrome P450 3A13 | Q3UW87 | - | 0.4 | 0.0121 | 0.0279 |
| UDP-glucuronosyltransferase 1-1 | Q63886 | - | 1.2 | 0.0420 | 0.0185 |
| UDP-glucuronosyltransferase 1-6 | Q64435 | - | 2.0 | 0.0179 | 0.0410 |
| Cytochrome P450 2C54 | Q6XVG2 | * | >0.05 | 0.0476 | |
| UDP-glucuronosyltransferase 2A3 | Q8BWQ1 | - | 1.9 | 0.0109 | 0.0132 |
| UDP-glucuronosyltransferase | Q8K154 | - | 1.9 | 0.0172 | 0.0126 |
| UDP-glucuronosyltransferase | Q8R084 | - | 3.5 | 0.0118 | 0.0119 |
| Cytochrome P450 2C70 | Q91W64 | * | >0.05 | 0.0340 | |
| Cytochrome P450 4A12A | Q91WL5 | - | 5.0 | 0.0113 | 0.0128 |
| Dehydrogenase/reductase SDR family member 4 | Q99LB2 | - | 1.7 | 0.0108 | 0.0131 |
| Cytochromes 2 | |||||
| Cytochrome P450 2D26 | Q8CIM7 | 1.5 | - | 0.0474 | 0.0120 |
| Cytochrome P450 4V3 | B2RSR0 | - | 2.3 | 0.0175 | 0.0176 |
| Cytochrome P450 1A2 | B6VGH4 | - | 2.7 | 0.0117 | 0.0125 |
| Cytochrome P450 2B10 | Q9WUD0 | * | >0.05 | 0.0120 | |
| Cytochrome P450 4A10 | O88833 | * | >0.05 | 0.0154 | |
| Cytochrome P450 2D9 | P11714 | - | 6.1 | 0.0117 | 0.0106 |
| Cytochrome P450 2D10 | P24456 | - | 2.1 | 0.0134 | 0.0152 |
| Cytochrome P450 2F2 | P33267 | - | 1.6 | 0.0264 | 0.0198 |
| Cytochrome P450 3A11 | Q3UEN8 | - | 0.7 | 0.0198 | 0.0166 |
| Cytochrome P450 3A13 | Q3UW87 | - | 0.4 | 0.0121 | 0.0279 |
| Cytochrome P450 2C54 | Q6XVG2 | * | >0.05 | 0.0476 | |
| Cytochrome P450 2C70 | Q91W64 | * | >0.05 | 0.0340 | |
| Cytochrome P450 4A12A | Q91WL5 | - | 5.0 | 0.0113 | 0.0128 |
© 2017 by the authors. Licensee MDPI, Basel, Switzerland. This article is an open access article distributed under the terms and conditions of the Creative Commons Attribution (CC BY) license (http://creativecommons.org/licenses/by/4.0/).
Share and Cite
Anselm, V.; Novikova, S.; Zgoda, V. Re-adaption on Earth after Spaceflights Affects the Mouse Liver Proteome. Int. J. Mol. Sci. 2017, 18, 1763. https://doi.org/10.3390/ijms18081763
Anselm V, Novikova S, Zgoda V. Re-adaption on Earth after Spaceflights Affects the Mouse Liver Proteome. International Journal of Molecular Sciences. 2017; 18(8):1763. https://doi.org/10.3390/ijms18081763
Chicago/Turabian StyleAnselm, Viktoria, Svetlana Novikova, and Victor Zgoda. 2017. "Re-adaption on Earth after Spaceflights Affects the Mouse Liver Proteome" International Journal of Molecular Sciences 18, no. 8: 1763. https://doi.org/10.3390/ijms18081763
APA StyleAnselm, V., Novikova, S., & Zgoda, V. (2017). Re-adaption on Earth after Spaceflights Affects the Mouse Liver Proteome. International Journal of Molecular Sciences, 18(8), 1763. https://doi.org/10.3390/ijms18081763