Transcriptomics Sequencing Provides Insights into Understanding the Mechanism of Grass Carp Reovirus Infection

 ,
,
Abstract
:
1. Introduction
2. Results
2.1. GCRV Infection Induces Cytopathic Effects
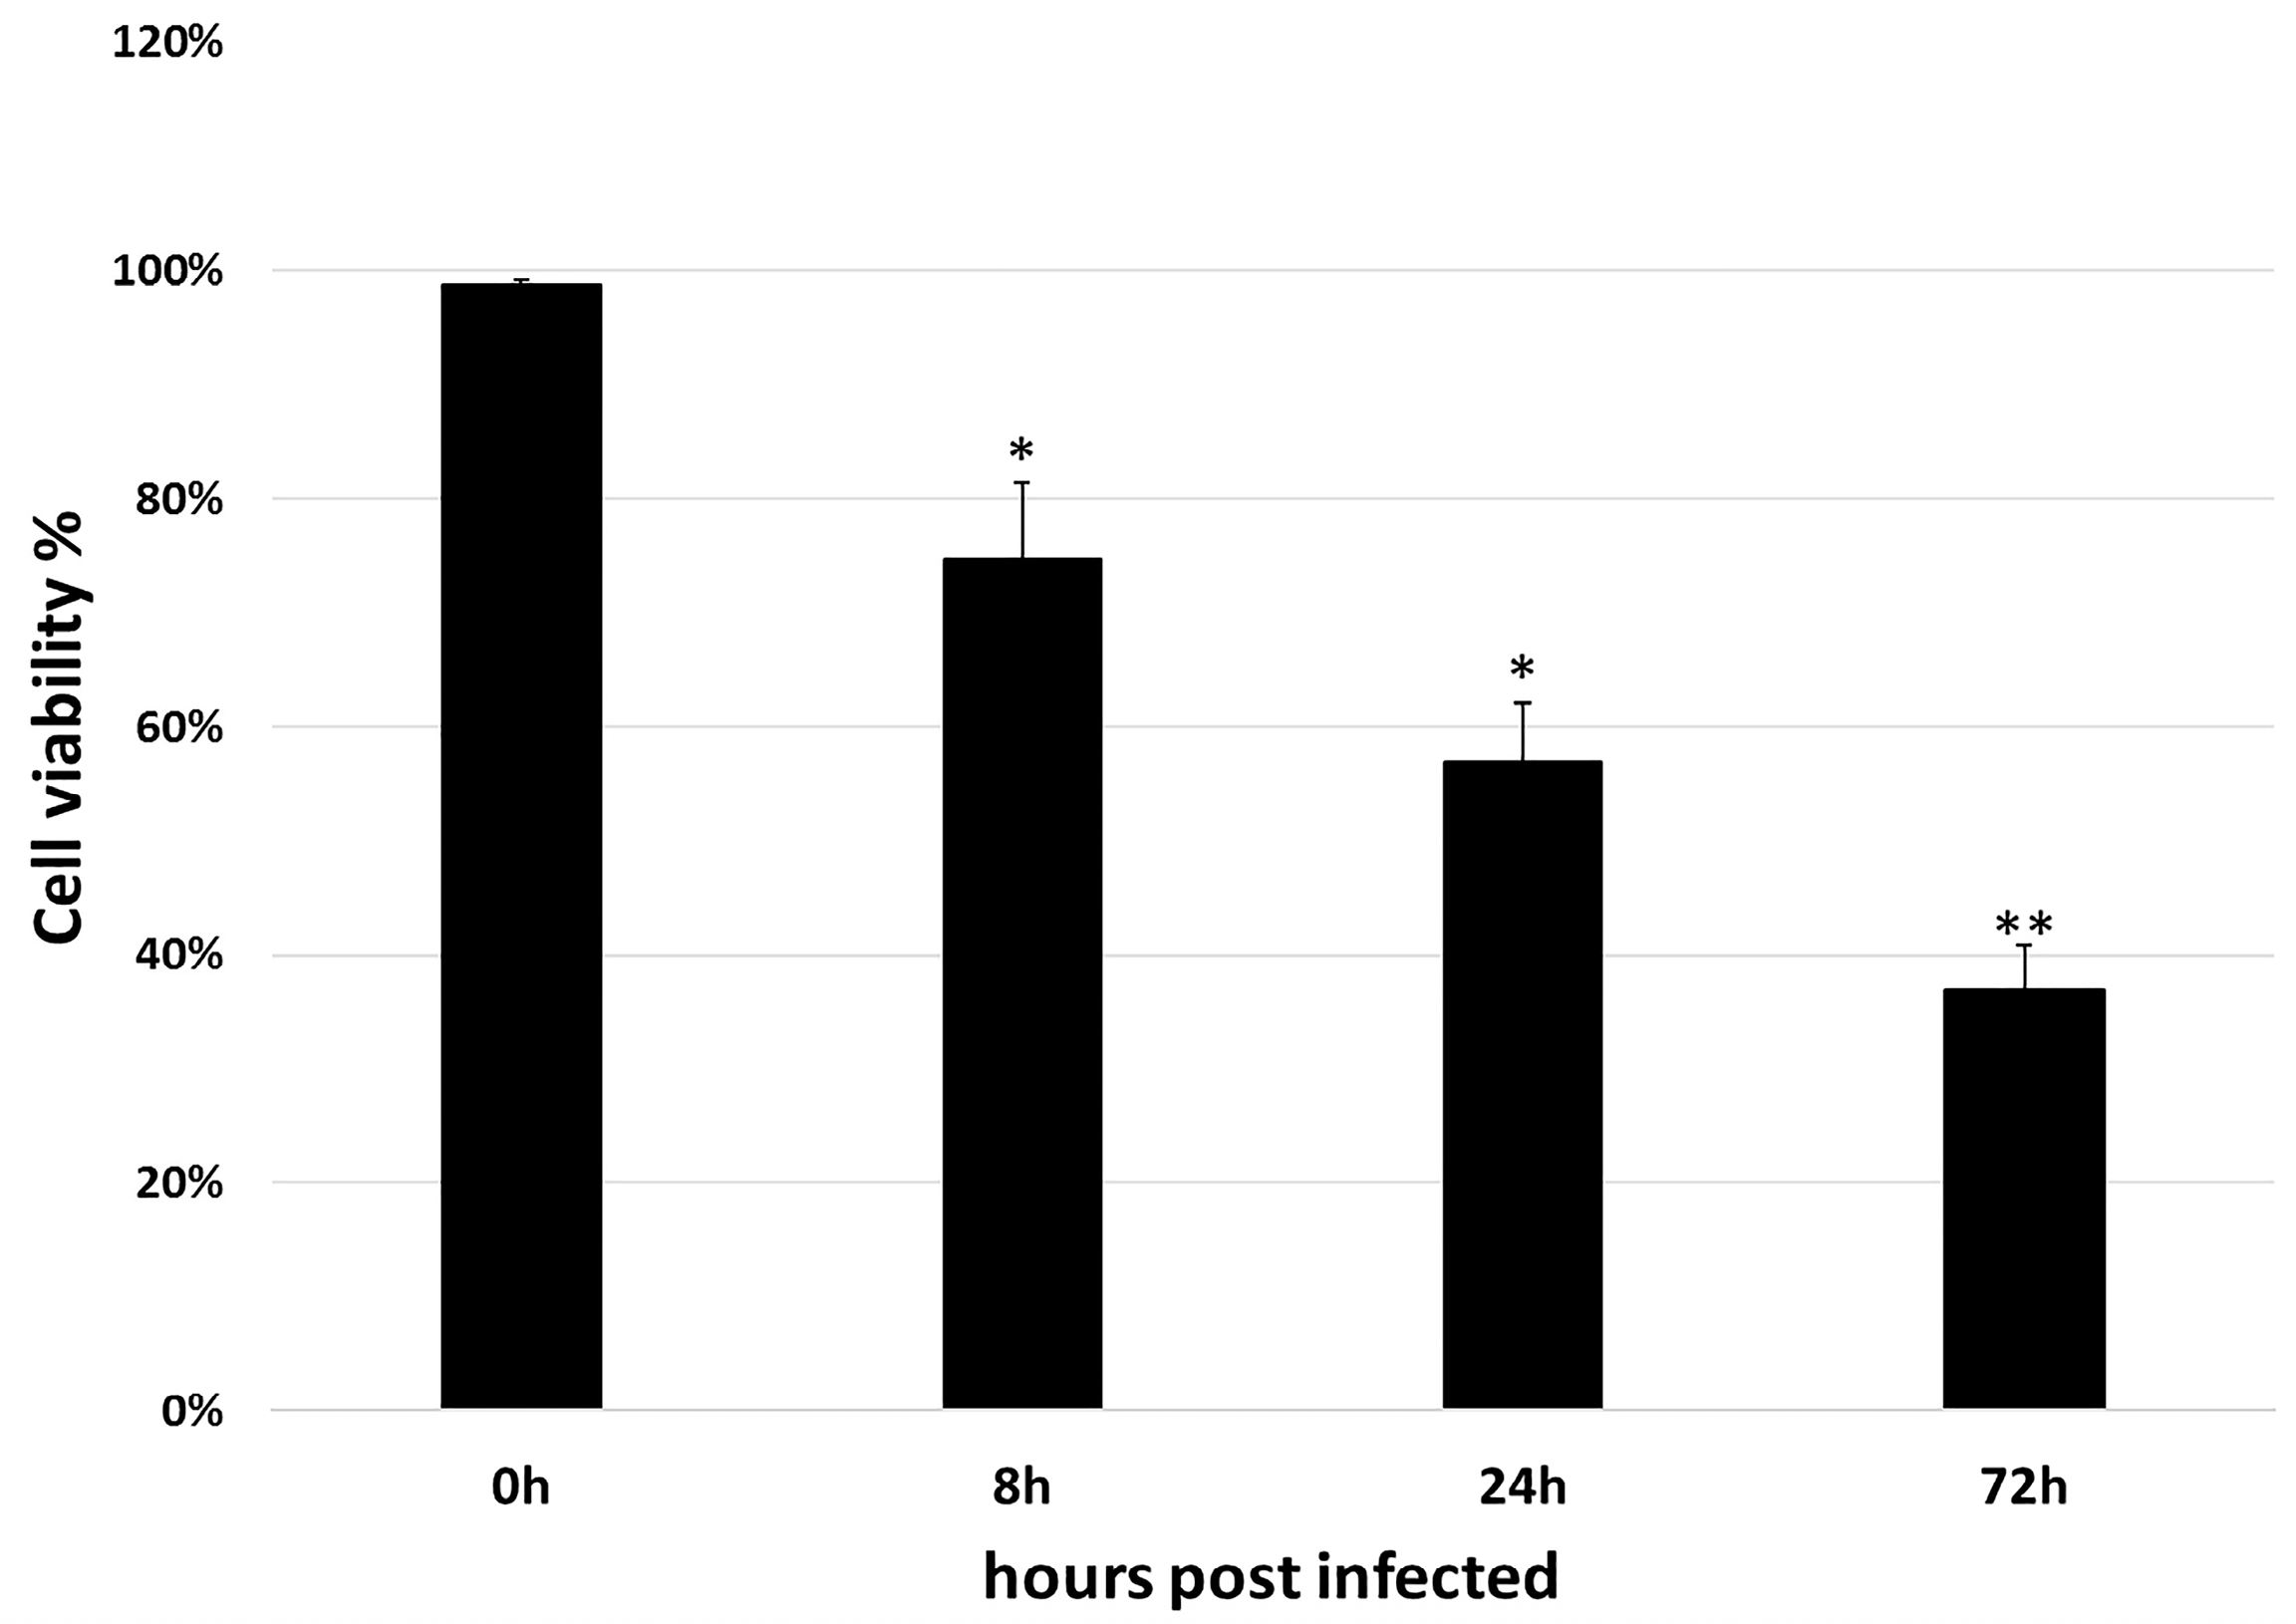
2.2. Cell Counting Kit-8 Assay
2.3. Preliminary Analysis of Transcriptomics Sequencing Data
2.4. Identification of Differently Expressed Genes (DEGs)
2.5. GO and KEGG Enrichment Analysis
2.6. Expression of DEGs in Key KEGG Pathways
2.7. Key DEGs Identified in the Three Stages of Infection
2.8. Expression Patterns of Key Interferon-Related Genes
2.9. Validation of Selected DEGs by RT-qPCR
3. Discussion
4. Materials and Methods
4.1. Cells, Virus and Virus Infection
4.2. CCK-8 Assay
4.3. RNA Isolation, Library Construction, and Sequencing
4.4. Data Analysis
4.5. Differential Expression Analysis
4.6. Validation of DEGs by RT-qPCR
5. Conclusions
Supplementary Materials
Acknowledgments
Author Contributions
Conflicts of Interest
References
- Food and Agriculture Organization of the United Nations. Fishery and Aquaculture Statistics Yearbook; Food and Agriculture Organization of the United Nations: Rome, Italy, 2017. [Google Scholar]
- Rao, Y.; Su, J. Insights into the antiviral immunity against grass carp (Ctenopharyngodon idella) reovirus (GCRV) in grass carp. J. Immunol. Res. 2015, 2015, 670437. [Google Scholar] [CrossRef] [PubMed]
- Attoui, H.; Mertens, P.P.; Becnel, J.; Belaganahalli, S.; Bergoin, M.; Brussaard, C.P.; Chappell, J.D.; Ciarlet, M.; del Vas, M.; Dermody, T.S.; et al. Family Reoviridae. In Virus Taxonomy: Ninth Report of the International Committee on Taxonomy of Viruses; King, A.M.Q., Adams, M.J., Carstens, E.B., Lefkowitz, E.J., Eds.; Elsevier: San Diego, CA, USA, 2012; pp. 538–637. [Google Scholar]
- Rao, Y.; Su, J.; Yang, C.; Peng, L.; Feng, X.; Li, Q. Characterizations of two grass carp Ctenopharyngodon idella hmgb2 genes and potential roles in innate immunity. Dev. Comp. Immunol. 2013, 41, 164–177. [Google Scholar] [CrossRef] [PubMed]
- Pei, Y.Y.; Huang, R.; Li, Y.M.; Liao, L.J.; Zhu, Z.Y.; Wang, Y.P. Characterizations of four toll-like receptor 4s in grass carp Ctenopharyngodon idellus and their response to grass carp reovirus infection and lipopolysaccharide stimulation. J. Fish Biol. 2015, 86, 1098–1108. [Google Scholar] [CrossRef] [PubMed]
- Lu, J.; Wang, H.; Zhang, Y.; Li, Y.; Lu, L. Grass carp reovirus ns26 interacts with cellular lipopolysaccharide-induced tumor necrosis factor-alpha factor, LITAF. Virus Genes 2016, 52, 789–796. [Google Scholar] [CrossRef] [PubMed]
- Liu, W.; Wang, H.; Yu, F.; Lu, L. Grass carp reovirus outer capsid proteins vp5 and vp7 interact in vitro. Arch. Virol. 2017, 162, 2375–2380. [Google Scholar] [CrossRef] [PubMed]
- Zhu, B.; Liu, G.L.; Gong, Y.X.; Ling, F.; Song, L.S.; Wang, G.X. Single-walled carbon nanotubes as candidate recombinant subunit vaccine carrier for immunization of grass carp against grass carp reovirus. Fish Shellfish Immunol. 2014, 41, 279–293. [Google Scholar] [CrossRef] [PubMed]
- Tian, Y.; Ye, X.; Zhang, L.; Deng, G.; Bai, Y. Development of a novel candidate subunit vaccine against grass carp reovirus Guangdong strain (GCRV-GD108). Fish Shellfish Immunol. 2013, 35, 351–356. [Google Scholar] [CrossRef] [PubMed]
- Jin, C.; Cai, L.; Rong, H.; Du, F.; Liao, L.; Zhu, Z. Transcriptomics analysis of head kidney in grass carp and discovery of immune-related genes. BMC Vet. Res. 2012, 8, 108. [Google Scholar]
- Dang, Y.; Xu, X.; Shen, Y.; Hu, M.; Zhang, M.; Li, L. Transcriptomics analysis of the innate immunity-related complement system in spleen tissue of Ctenopharyngodon idella infected with Aeromonas hydrophila. PLoS ONE 2016, 11, e0157413. [Google Scholar] [CrossRef] [PubMed]
- Xu, B.H.; Zhong, L.; Liu, Q.L.; Xiao, T.Y.; Su, J.M.; Chen, K.J. Characterization of grass carp spleen transcriptome during GCRV infection. Genet. Mol. Res. GMR 2016, 15. [Google Scholar] [CrossRef] [PubMed]
- Wan, Q.; Su, J. Transcriptome analysis provides insights into the regulatory function of alternative splicing in antiviral immunity in grass carp (Ctenopharyngodon idella). Sci. Rep. 2015, 5, 12946. [Google Scholar] [CrossRef] [PubMed]
- Shi, M.; Huang, R.; Du, F.; Pei, Y.; Liao, L.; Zhu, Z. RNA-seq profiles from grass carp tissues after reovirus (GCRV) infection based on singular and modular enrichment analyses. Mol. Immunol. 2014, 61, 44–53. [Google Scholar] [CrossRef] [PubMed]
- Hu, X.; Fu, X.; Li, N.; Dong, X.; Zhao, L.; Lan, J. Transcriptomic analysis of mandarin fish brain cells infected with infectious spleen and kidney necrosis virus with an emphasis on retinoic acid-inducible gene 1-like receptors and apoptosis pathways. Fish Shellfish Immunol. 2015, 45, 619–629. [Google Scholar] [CrossRef] [PubMed]
- Flori, L.; Rogelgaillard, C.; Cochet, M.; Lemonnier, G.; Hugot, K.; Chardon, P. Transcriptomic analysis of the dialogue between Pseudorabies virus and porcine epithelial cells during infection. BMC Genom. 2008, 9, 123. [Google Scholar] [CrossRef] [PubMed] [Green Version]
- Chen, C.S.; Alonso, J.L.; Ostuni, E.; Whitesides, G.M.; Ingber, D.E. Cell shape provides global control of focal adhesion assembly. Biochem. Biophys. Res. Commun. 2003, 307, 355–361. [Google Scholar] [CrossRef]
- Fouquet, B.; Nikolic, J.; Larrous, F.; Bourhy, H.; Wirblich, C.; Lagaudrière-Gesbert, C.; Blondel, D. Focal Adhesion Kinase Is Involved in Rabies Virus Infection through Its Interaction with Viral Phosphoprotein P. J. Virol. 2015, 89, 1640–1651. [Google Scholar] [CrossRef] [PubMed]
- Elbahesh, H.; Cline, T.; Baranovich, T.; Govorkova, E.A.; Schultzcherry, S.; Russell, C.J. Novel roles of focal adhesion kinase in cytoplasmic entry and replication of influenza A viruses. J. Virol. 2014, 88, 6714–6728. [Google Scholar] [CrossRef] [PubMed]
- Barth, H.; Schafer, C.; Adah, M.I.; Zhang, F.; Linhardt, R.J.; Toyoda, H. Cellular binding of hepatitis c virus envelope glycoprotein e2 requires cell surface heparan sulfate. J. Biol. Chem. 2003, 278, 41003–41012. [Google Scholar] [CrossRef] [PubMed]
- Giroglou, T.; Florin, L.; Schäfer, F.; Streeck, R.E.; Sapp, M. Human papillomavirus infection requires cell surface heparan sulfate. J. Virol. 2001, 75, 1565–1570. [Google Scholar] [CrossRef] [PubMed]
- Sully, V.; Pownall, S.; Vincan, E. Functional abnormalities in protein tyrosine phosphatase epsilon-deficient macrophages. Biochem. Biophys. Res. Commun. 2001, 286, 184–188. [Google Scholar] [CrossRef] [PubMed]
- Wang, Y. The autoimmunity-associated gene PTPN22 potentiates toll-like receptor-driven, type 1 interferon-dependent immunity. Immunity 2013, 39, 111–122. [Google Scholar] [CrossRef] [PubMed]
- Taillé, C.; Grootenboer-Mignot, S.; Estellat, C. Periplakin is a target for autoimmunity in asthma. Respir. Res. 2016, 17, 126. [Google Scholar] [CrossRef] [PubMed]
- Deretic, V.; Levine, B. Autophagy, Immunity, and Microbial Adaptations. Cell Host Microbe 2009, 5, 527–549. [Google Scholar] [CrossRef] [PubMed]
- Stewart, P.L.; Nemerow, G.R. Cell integrins: Commonly used receptors for diverse viral pathogens. Trends Microbiol. 2007, 15, 500–507. [Google Scholar] [CrossRef] [PubMed]
- Maginnis, M.S.; Forrest, J.C.; Kopecky-Bromberg, S.A.; Dickeson, S.K.; Santoro, S.A.; Zutter, M.M.; Nemerow, G.R.; Bergelson, J.M.; Dermody, T.S. β1 Integrin Mediates Internalization of Mammalian Reovirus. J. Virol. 2006, 80, 2760–2770. [Google Scholar] [CrossRef] [PubMed]
- Raymond, T.; Gorbunova, E.; Gavrilovskaya, I.N.; Mackow, E.R. Pathogenic hantaviruses bind plexin-semaphorin-integrin domains present at the apex of inactive, bent alphavbeta3 integrin conformers. Proc. Natl. Acad. Sci. USA 2005, 102, 1163–1168. [Google Scholar] [CrossRef] [PubMed]
- Kapadia, S.B.; Barth, H.; Baumert, T.; Mckeating, J.A.; Chisari, F.V. Initiation of hepatitis c virus infection is dependent on cholesterol and cooperativity between cd81 and scavenger receptor B type I. J. Virol. 2007, 81, 374–383. [Google Scholar] [CrossRef] [PubMed]
- Jahn, R.; Scheller, R.H. SNAREs—Engines for membrane fusion. Nat. Rev. Mol. Cell Biol. 2006, 7, 631–643. [Google Scholar] [CrossRef] [PubMed]
- Syed, G.H.; Khan, M.; Yang, S.; Siddiqui, A. Hepatitis C virus lipoviroparticles (HCV-LVP) assemble in the endoplasmic reticulum (ER) and bud off from the ER to Golgi in COPII vesicles. J. Virol. 2017, 91, e00499-17. [Google Scholar] [CrossRef] [PubMed]
- Zhao, Y.; Holmgren, B.T.; Hinas, A. The conserved snare sec-22 localizes to late endosomes and negatively regulates RNA interference in Caenorhabditis elegans. RNA 2017, 23, 297–307. [Google Scholar] [CrossRef] [PubMed]
- Lepesheva, G.I.; Waterman, M.R. Sterol 14α-Demethylase Cytochrome P450 (CYP51), a P450 in All Biological Kingdoms. Biochim. Biophys. Acta 2008, 1770, 467–477. [Google Scholar] [CrossRef] [PubMed]
- Daum, G.; Lees, N.D.; Bard, M.; Dickson, R. Biochemistry, Cell Biology and Molecular Biology of Lipids of Saccharomyces cerevisiae. Yeast 1998, 14, 1471–1510. [Google Scholar] [CrossRef]
- Abe, F.; Usui, K.; Hiraki, T. Fluconazole modulates membrane rigidity, heterogeneity, and water penetration into the plasma membrane in Saccharomyces cerevisiae. Biochemistry 2009, 48, 8494–8504. [Google Scholar] [CrossRef] [PubMed]
- Martin, M. Cut adapt removes adapter sequences from high-throughput sequencing reads. Embnet J. 2011, 17. [Google Scholar] [CrossRef]
- Wang, Y.; Lu, Y.; Zhang, Y.; Ning, Z.; Li, Y.; Zhao, Q. The draft genome of the grass carp (Ctenopharyngodon idellus) provides insights into its evolution and vegetarian adaptation. Nat. Genet. 2015, 47, 625–631. [Google Scholar] [CrossRef] [PubMed]
- Kim, D.; Pertea, G.; Trapnell, C.; Pimentel, H.; Kelley, R.; Salzberg, S.L. TopHat2: Accurate alignment of the transcriptome in the presence of insertions, deletions and gene fusions. Genome Biol. 2013, 14, R36. [Google Scholar] [CrossRef] [PubMed] [Green Version]
- Anders, S.; Pyl, P.T.; Huber, W. HTSeq-A Python framework to work with high-throughput sequencing data. Bioinformatics 2015, 31, 166–169. [Google Scholar] [CrossRef] [PubMed]
- Mortazavi, A.; Williams, B.A.; McCue, K.; Schaeffer, L.; Wold, B. Mapping and quantifying mammalian transcriptome by RNA-Seq. Nat. Methods 2008, 5, 621–628. [Google Scholar] [CrossRef] [PubMed]
- Anders, S.; Huber, W. Differential expression analysis for sequence count data. Genome Boil. 2010, 11, R106. [Google Scholar] [CrossRef] [PubMed]
- Bindea, G.; Mlecnik, B.; Hackl, H.; Charoentong, P.; Tosolini, M.; Kirilovsky, A. Clue GO: A Cytoscape plug-in to decipher functionally grouped gene ontology and pathway annotation networks. Bioinformatics 2009, 25, 1091–1093. [Google Scholar] [CrossRef] [PubMed]
- Bindea, G.; Galon, J.; Mlecnik, B. CluePedia Cytoscape plugin: Pathway insights using integrated experimental and in silico data. Bioinformatics 2013, 29, 661–663. [Google Scholar] [CrossRef] [PubMed]
- Kanehisa, M.; Araki, M.; Goto, S.; Hattori, M.; Hirakawa, M.; Itoh, M. KEGG for linking genomes to life and the environment. Nucleic Acids Res. 2008, 36, D480–D484. [Google Scholar] [CrossRef] [PubMed]
- Livak, K.J.; Schmittgen, T.D. Analysis of relative gene expression data using real-time quantitative PCR and the 2−ΔΔCt Method. Methods 2001, 25, 402–408. [Google Scholar] [CrossRef] [PubMed]


| Sample | Raw Reads | Clean Reads | Clean Data (bp) | Q20 (%) | Q30 (%) | Mapped (%) |
|---|---|---|---|---|---|---|
| C0 | 47,178,538 | 46,732,668 | 6,905,828,036 | 97.24 | 93.27 | 87.96 |
| C8 | 45,666,538 | 45,217,760 | 6,679,552,386 | 96.98 | 92.7 | 87.24 |
| C24 | 41,778,528 | 41,398,026 | 6,111,817,194 | 97.21 | 93.15 | 88.07 |
| C72 | 41,012,162 | 40,628,112 | 6,014,381,958 | 97.15 | 93.07 | 87.40 |
| Case | Control | Up-Regulated Genes | Down-Regulated Genes | Total DEGs |
|---|---|---|---|---|
| C8 | C0 | 35 | 41 | 76 |
| C24 | C8 | 463 | 90 | 553 |
| C72 | C24 | 150 | 134 | 284 |
| Time | Category | GO_Term | Gene Num. |
|---|---|---|---|
| 0−8 h | Biological_process | Iron ion homeostasis | 3 |
| Cellular_component | Inclusion body | 2 | |
| molecular_function | FAD binding | 2 | |
| biological_process | Transition metal ion homeostasis | 3 | |
| Biological_process | Carbohydrate biosynthetic process | 3 | |
| 8−24 h | Cellular_component | Vacuole | 16 |
| Molecular_function | Iron ion binding | 13 | |
| Biological_process | Organic acid biosynthetic process | 12 | |
| Molecular_function | Oxidoreductase activity | 13 | |
| Cellular_component | Lysosome | 10 | |
| 24−72 h | Biological_process | Lipid biosynthetic process | 19 |
| Biological_process | Steroid metabolic process | 11 | |
| Biological_process | Alcohol biosynthetic metabolic process | 8 | |
| Biological_process | Isoprenoid biosynthetic process | 6 | |
| Biological_process | Steroid metabolic process | 8 |
| Time | Pathway | DEGs | p-Value |
|---|---|---|---|
| 0−8 h | ECM-receptor interaction | 3 | 0.002216 |
| Focal adhesion | 4 | 0.005585 | |
| Mineral absorption | 2 | 0.008391 | |
| Glutathione metabolism | 2 | 0.012446 | |
| Cytokine-cytokine receptor interaction | 3 | 0.01791 | |
| 8−24 h | Collecting duct acid secretion | 4 | 0.0017689 |
| Lysosome | 10 | 0.0019208 | |
| Phagosome | 10 | 0.0023994 | |
| Hippo signaling pathway | 11 | 0.0052756 | |
| Sphingolipid metabolism | 5 | 0.0138641 | |
| 24−72 h | Steroid biosynthesis | 11 | 1.58 × 10⁻¹⁶ |
| Terpenoid backbone biosynthesis | 7 | 7.96 × 10⁻⁹ | |
| Metabolism of xenobiotics by cytochrome P450 | 5 | 0.000122 | |
| Sesquiterpenoid and triterpenoid biosynthesis | 2 | 0.000187 | |
| Carbon fixation pathways in prokaryotes | 3 | 0.001499 |
| Pathway | Gene Name | Log2 Fold Change | ||
|---|---|---|---|---|
| 8 h | 24 h | 72 h | ||
| ECM-receptor interaction | col5a1 (collagen_alpha-1(V)_chain) | 1.27 | 0.79 | −0.49 |
| itgb7 (integrin_beta-7-like) | 1.52 | −0.40 | −0.42 | |
| itga7 (integrin_alpha-7) | 0.76 | −0.16 | 0.27 | |
| Focal adhesion | col5a1 (collagen_alpha-1(V)_chain) | 1.27 | 0.79 | −0.49 |
| itgb7 (integrin_beta-7-like) | 1.52 | −0.40 | −0.42 | |
| itga7 (integrin_alpha-7) | 0.76 | −0.16 | 0.27 | |
| sptbn5 (spectrin_beta_chain,_non-erythrocytic_5-like) | 0.77 | −0.09 | −0.31 | |
| Lysosome | arsd (arylsulfatase_D_isoform_X2) | −0.69 | 1.13 | 1.30 |
| glb1l2 (beta-galactosidase-1-like_protein_2-like) | −1.83 | 1.21 | 1.49 | |
| Asah1 (N-acylsphingosine_amidohydrolase_1_precursor) | −1.15 | 1.06 | 1.54 | |
| neu3.2 (Sialidase-3-like) | −1.01 | 1.29 | 1.15 | |
| arsk (arylsulfatase_K_isoform_X1) | −0.75 | 0.83 | 0.19 | |
| atp6v0a1 (V-type proton ATPase 116 kDa subunit a-like) | −1.06 | 1.23 | 1.54 | |
| sel1l (Protein sel-1 homolog 1 precursor) | −0.43 | 1.05 | 1.20 | |
| abcg2c (ATP binding cassette subfamily G member 2) | −1.25 | 1.58 | 1.83 | |
| ctsc (dipeptidyl_peptidase_1_precursor) | −1.13 | 0.83 | 0.47 | |
| dnase2 (deoxyribonuclease-2-beta-like) | −1.06 | 0.97 | 1.13 | |
| Phagosome | itgb2 (Integrin beta-2-like) | −1.73 | 2.33 | 2.76 |
| atp6v1d (V-type proton ATPase subunit D) | −1.00 | 0.79 | 1.09 | |
| srb1 (scavenger receptor class B member 1) | −0.81 | 0.83 | 0.44 | |
| atp6v1e1 (V-type proton ATPase subunit E 1-like) | −1.09 | 0.68 | 0.63 | |
| atp6v0a1 (V-type proton ATPase 116 kDa subunit a-like) | −1.06 | 1.23 | 1.54 | |
| sec22b (Vesicle-trafficking protein SEC22b-A-like) | −0.93 | 0.85 | 1.62 | |
| atp6v1c1b (ATPase, H+ transporting, lysosomal, V1 subunit C1b) | −1.90 | 1.18 | 1.82 | |
| ctsl (Cathepsin L1-like) | −1.13 | 0.83 | 0.47 | |
| Time Period | Gene Name | Log2 Fold Change | Description | |
|---|---|---|---|---|
| 0−8 h | Up | ptpε | 6.01 | Protein tyrosine phosphatase epsilon |
| itga7 | 5.49 | Integrin alpha7 | ||
| hspg2 | 4.64 | Heparan sulfate proteoglycan 2 | ||
| leprel4 | 4.12 | Synaptonemal complex protein SC65 | ||
| ppl | 3.86 | Periplakin | ||
| Down | cxcl10 | −7.11 | C–X–C motif chemokine 10-like | |
| tnfrsf9 | −5.51 | Tumour necrosis factor receptor superfamily member 9-like | ||
| plaur | −5.39 | Urokinase plasminogen activator surface receptor-like | ||
| ubl1 | −4.71 | Ubquitin-like protein 1 | ||
| ifi27 | −4.63 | Interferon alpha-inducible protein 27-like | ||
| 8−24 h | Up | itgb2 | 6.84 | Integrin beta-2 |
| viperin | 4.71 | Virus inhibitory protein | ||
| tap1 | 3.81 | Antigen peptide transporter 1 | ||
| tlr3 | 3.05 | Toll-like receptor 3 | ||
| irf11 | 2.97 | Interferon regulatory factor 11 | ||
| Down | angptl2 | −5.78 | Angiopoietin-related protein 2-like | |
| pgp | −5.22 | Phosphoglycolate phosphatase | ||
| mical3b | −4.9 | Protein-methionine sulfoxide oxidase mical3b | ||
| hspb11 | −4.45 | Heat shock protein beta-11 | ||
| rap1gap1 | −2.73 | rap1 GTPase-activating protein 1 | ||
| 24−72 h | Up | tnfrsf9 | 2.68 | Tumour necrosis factor receptor superfamily member 9 |
| hspa | 2.42 | Heat shock 70 kDa protein | ||
| fbw7 | 2.35 | F-box/WD repeat-containing protein 7 | ||
| nfil3 | 1.87 | Nuclear factor, interleukin 3 regulated | ||
| osbp1 | 1.57 | Oxysterol-binding protein 1 | ||
| Down | lss | −2.95 | Lanosterol synthase | |
| sc5d | −2.19 | Lathosterol oxidase | ||
| cyp51a1 | −1.9 | Lanosterol 14α-demethylase | ||
| ablim1 | −1.11 | Actin-binding LIM protein 1 | ||
| cyr61 | −1.08 | Cyr61 protein | ||
© 2018 by the authors. Licensee MDPI, Basel, Switzerland. This article is an open access article distributed under the terms and conditions of the Creative Commons Attribution (CC BY) license (http://creativecommons.org/licenses/by/4.0/).
Share and Cite
Chen, G.; He, L.; Luo, L.; Huang, R.; Liao, L.; Li, Y.; Zhu, Z.; Wang, Y. Transcriptomics Sequencing Provides Insights into Understanding the Mechanism of Grass Carp Reovirus Infection. Int. J. Mol. Sci. 2018, 19, 488. https://doi.org/10.3390/ijms19020488
Chen G, He L, Luo L, Huang R, Liao L, Li Y, Zhu Z, Wang Y. Transcriptomics Sequencing Provides Insights into Understanding the Mechanism of Grass Carp Reovirus Infection. International Journal of Molecular Sciences. 2018; 19(2):488. https://doi.org/10.3390/ijms19020488
Chicago/Turabian StyleChen, Geng, Libo He, Lifei Luo, Rong Huang, Lanjie Liao, Yongming Li, Zuoyan Zhu, and Yaping Wang. 2018. "Transcriptomics Sequencing Provides Insights into Understanding the Mechanism of Grass Carp Reovirus Infection" International Journal of Molecular Sciences 19, no. 2: 488. https://doi.org/10.3390/ijms19020488
APA StyleChen, G., He, L., Luo, L., Huang, R., Liao, L., Li, Y., Zhu, Z., & Wang, Y. (2018). Transcriptomics Sequencing Provides Insights into Understanding the Mechanism of Grass Carp Reovirus Infection. International Journal of Molecular Sciences, 19(2), 488. https://doi.org/10.3390/ijms19020488