Prediction of Tacrolimus Exposure by CYP3A5 Genotype and Exposure of Co-Administered Everolimus in Japanese Renal Transplant Recipients

 ,
,
Abstract
:
1. Introduction
2. Results
3. Discussion
4. Materials and Methods
4.1. Patients and Protocols
4.2. Sample Collection and Analytical Methods
4.3. Genotyping
4.4. Pharmacokinetic Analysis
4.5. Statistical Procedures
Acknowledgments
Author Contributions
Conflict of interest
References
- Staatz, C.E.; Tett, S.E. Clinical pharmacokinetics and pharmacodynamics of tacrolimus in solid organ transplantation. Clin. Pharmacokinet. 2004, 43, 623–653. [Google Scholar] [CrossRef] [PubMed]
- Staatz, C.E.; Tett, S.E. Clinical Pharmacokinetics of Once-Daily Tacrolimus in Solid-Organ Transplant Patients. Clin. Pharmacokinet. 2015, 54, 993–1025. [Google Scholar] [CrossRef] [PubMed]
- Hustert, E.; Haberl, M.; Burk, O.; Wolbold, R.; He, Y.Q.; Klein, K.; Nuessler, A.C.; Neuhaus, P.; Klattig, J.; Eiselt, R.; et al. The genetic determinants of the CYP3A5 polymorphism. Pharmacogenetics 2001, 11, 773–779. [Google Scholar] [CrossRef] [PubMed]
- Birdwell, K.A.; Decker, B.; Barbarino, J.M.; Peterson, J.F.; Stein, C.M.; Sadee, W.; Wang, D.; Vinks, A.A.; He, Y.; Swen, J.J.; et al. Clinical Pharmacogenetics Implementation Consortium (CPIC) Guidelines for CYP3A5 Genotype and Tacrolimus Dosing. Clin. Pharmacol. Ther. 2015, 98, 19–24. [Google Scholar] [CrossRef] [PubMed] [Green Version]
- Chan, L.; Greenstein, S.; Hardy, M.A.; Hardy, M.A.; Hartmann, E.; Bunnapradist, S.; Cibrik, D.; Shaw, L.M.; Munir, L.; Ulbricht, B.; et al. Multicenter, randomized study of the use of everolimus with tacrolimus after renal transplantation demonstrates its effectiveness. Transplantation 2008, 85, 821–826. [Google Scholar] [CrossRef] [PubMed]
- Chan, L.; Hartmann, E.; Cibrik, D.; Cooper, M.; Shaw, L.M. Optimal everolimus concentration is associated with risk reduction for acute rejection in de novo renal transplant recipients. Transplantation 2010, 90, 31–37. [Google Scholar] [CrossRef] [PubMed]
- Langer, R.M.; Hené, R.; Vitko, S.; Christiaans, M.; Tedesco-Silva, H., Jr.; Ciechanowski, K.; Cassuto, E.; Rostaing, L.; Vilatoba, M.; Machein, U.; et al. Everolimus plus early tacrolimus minimization: A phase III, randomized, open-label, multicentre trial in renal transplantation. Transpl. Int. 2012, 25, 592–602. [Google Scholar] [CrossRef] [PubMed]
- Sageshima, J.; Ciancio, G.; Chen, L.; Dohi, T.; El-Hinnawi, A.; Paloyo, S.; Misawa, R.; Ekwenna, O.; Yatawatta, A.; Burke, G.W., III. Everolimus with low-dose tacrolimus in simultaneous pancreas and kidney transplantation. Clin. Transplant. 2014, 28, 797–801. [Google Scholar] [CrossRef] [PubMed]
- Shihab, F.; Qazi, Y.; Mulgaonkar, S.; McCague, K.; Patel, D.; Peddi, V.R.; Shaffer, D. Association of clinical events with everolimus exposure in kidney transplant patients receiving low doses of tacrolimus. Am. J. Transplant. 2017, 17, 2363–2371. [Google Scholar] [CrossRef] [PubMed]
- Kirchner, G.I.; Meier-Wiedenbach, I.; Manns, M.P. Clinical pharmacokinetics of everolimus. Clin. Pharmacokinet. 2004, 43, 83–95. [Google Scholar] [CrossRef] [PubMed]
- Moes, D.J.; Press, R.R.; den Hartigh, J.; van der Straaten, T.; de Fijter, J.W.; Guchelaar, H.J. Population pharmacokinetics and pharmacogenetics of everolimus in renal transplant patients. Clin. Pharmacokinet. 2012, 51, 467–480. [Google Scholar] [CrossRef] [PubMed]
- Hesselink, D.A.; Bouamar, R.; Elens, L.; van Schaik, R.H.; van Gelder, T. The role of pharmacogenetics in the disposition of and response to tacrolimus in solid organ transplantation. Clin. Pharmacokinet. 2014, 53, 123–139. [Google Scholar] [CrossRef] [PubMed]
- Moes, D.J.; Swen, J.J.; den Hartigh, J.; van der Straaten, T.; van der Heide, J.J.; Sanders, J.S.; Bemelman, F.J.; de Fijter, J.W.; Guchelaar, H.J. Effect of CYP3A4*22, CYP3A5*3, and CYP3A combined genotypes on cyclosporine, everolimus, and tacrolimus pharmacokinetics in renal transplantation. CPT Pharmacomet. Syst. Pharmacol. 2014, 3, e100. [Google Scholar] [CrossRef] [PubMed]
- Hiratsuka, M.; Takekuma, Y.; Endo, N.; Narahara, K.; Hamdy, S.I.; Kishikawa, Y.; Matsuura, M.; Agatsuma, Y.; Inoue, T.; Mizugaki, M. Allele and genotype frequencies of CYP2B6 and CYP3A5 in the Japanese population. Eur. J. Clin. Pharmacol. 2002, 58, 417–421. [Google Scholar] [CrossRef] [PubMed]
- Niioka, T.; Kagaya, H.; Saito, M.; Inoue, T.; Numakura, K.; Yamamoto, R.; Akamine, Y.; Habuchi, T.; Satoh, S.; Miura, M. Influence of everolimus on the pharmacokinetics of tacrolimus in Japanese renal transplant patients. Int. J. Urol. 2016, 23, 484–490. [Google Scholar] [CrossRef] [PubMed]
- Picard, N.; Rouguieg-Malki, K.; Kamar, N.; Rostaing, L.; Marquet, P. CYP3A5 genotype does not influence everolimus in vitro metabolism and clinical pharmacokinetics in renal transplant recipients. Transplantation 2011, 91, 652–656. [Google Scholar] [CrossRef] [PubMed]
- Thummel, K.E.; O’Shea, D.; Paine, M.F.; Shen, D.D.; Kunze, K.L.; Perkins, J.D.; Wilkinson, G.R. Oral first-pass elimination of midazolam involves both gastrointestinal and hepatic CYP3A-mediated metabolism. Clin. Pharmacol. Ther. 1996, 59, 491–502. [Google Scholar] [CrossRef]
- Gorski, J.C.; Jones, D.R.; Haehner-Daniels, B.D.; Hamman, M.A.; O’Mara, E.M., Jr.; Hall, S.D. The contribution of intestinal and hepatic CYP3A to the interaction between midazolam and clarithromycin. Clin. Pharmacol. Ther. 1998, 64, 133–143. [Google Scholar] [CrossRef]
- De Jonge, H.; de Loor, H.; Verbeke, K.; Vanrenterghem, Y.; Kuypers, D.R. In vivo CYP3A4 activity, CYP3A5 genotype, and hematocrit predict tacrolimus dose requirements and clearance in renal transplant patients. Clin. Pharmacol. Ther. 2012, 92, 366–375. [Google Scholar] [CrossRef] [PubMed]
- De Jonge, H.; Vanhove, T.; de Loor, H.; Verbeke, K.; Kuypers, D.R. Progressive decline in tacrolimus clearance after renal transplantation is partially explained by decreasing CYP3A4 activity and increasing haematocrit. Br. J. Clin. Pharmacol. 2015, 80, 548–559. [Google Scholar] [CrossRef] [PubMed]
- Niioka, T.; Kagaya, H.; Miura, M.; Numakura, K.; Saito, M.; Inoue, T.; Habuchi, T.; Satoh, S. Pharmaceutical and genetic determinants for interindividual differences of tacrolimus bioavailability in renal transplant recipients. Eur. J. Clin. Pharmacol. 2013, 69, 1659–1665. [Google Scholar] [CrossRef] [PubMed]
- Satoh, S.; Niioka, T.; Kagaya, H.; Numakura, K.; Inoue, T.; Saito, M.; Komine, N.; Narita, S.; Tsuchiya, N.; Habuchi, T.; et al. Pharmacokinetic and CYP3A5 pharmacogenetic differences between once- and twice-daily tacrolimus from the first dosing day to 1 year after renal transplantation. Pharmacogenomics 2014, 15, 1495–1506. [Google Scholar] [CrossRef] [PubMed]
- Vanhove, T.; Bouillon, T.; de Loor, H.; Annaert, P.; Kuypers, D. Fexofenadine, a Putative In Vivo P-glycoprotein Probe, Fails to Predict Clearance of the Substrate Tacrolimus in Renal Recipients. Clin. Pharmacol. Ther. 2017. [Google Scholar] [CrossRef] [PubMed]
- Staatz, C.E.; Goodman, L.K.; Tett, S.E. Effect of CYP3A and ABCB1 single nucleotide polymorphisms on the pharmacokinetics and pharmacodynamics of calcineurin inhibitors: Part II. Clin. Pharmacokinet. 2010, 49, 207–221. [Google Scholar] [CrossRef] [PubMed]
- Staatz, C.E.; Goodman, L.K.; Tett, S.E. Effect of CYP3A and ABCB1 single nucleotide polymorphisms on the pharmacokinetics and pharmacodynamics of calcineurin inhibitors: Part I. Clin. Pharmacokinet. 2010, 49, 141–175. [Google Scholar] [CrossRef] [PubMed]
- Lemaitre, F.; Bezian, E.; Goldwirt, L.; Fernandez, C.; Farinotti, R.; Varnous, S.; Urien, S.; Antignac, M. Population pharmacokinetics of everolimus in cardiac recipients: comedications, ABCB1, and CYP3A5 polymorphisms. Ther. Drug Monit. 2012, 34, 686–694. [Google Scholar] [CrossRef] [PubMed]
- Tsuchiya, N.; Satoh, S.; Tada, H.; Li, Z.; Ohyama, C.; Sato, K.; Suzuki, T.; Habuchi, T.; Kato, T. Influence of CYP3A5 and MDR1 (ABCB1) Polymorphisms on the Pharmacokinetics of Tacrolimus in Renal Transplant Recipients. Transplantation 2004, 78, 1182–1187. [Google Scholar] [CrossRef] [PubMed]


| Items | 1 Month after Transplantation | 1 Year after Transplantation | ||
|---|---|---|---|---|
| Gender | ||||
| Male | 30 | (60.0%) | 20 | (64.5%) |
| Female | 20 | (40.0%) | 11 | (35.5%) |
| Tacrolimus single dose (mg) | 8.0 | (5.0–12.0) | 4.0 | (3.0–6.0) |
| Tacrolimus C0 (ng/mL) | 7.0 | (5.9–8.5) | 4.5 | (4.0–6.0) |
| Everolimus single dose (mg) | 0.75 | 0.75 | (0.50–0.75) | |
| Everolimus C0 (ng/mL) | 3.2 | (2.4–4.1) | 3.5 | (3.0–4.5) |
| Age (year) | 55.0 | (47.0–61.0) | 58.0 | (52.5–62.5) |
| Body weight (kg) | 56.3 | (47.2–63.3) | 59.9 | (53.9–66.0) |
| Aspartate aminotransferase (IU/L) | 14 | (11–17) | 22 | (17–25) |
| Alanine aminotransferase (IU/L) | 14 | (9–21) | 16 | (12–24) |
| Hemoglobin (g/dL) | 10.4 | (9.6–11.4) | 11.9 | (10.8–13.3) |
| Serum albumin (g/dL) | 3.8 | (3.5–4.0) | 4.1 | (3.8–4.4) |
| Creatinine clearance (mL/min) | 50.3 | (41.3–60.3) | 54.2 | (39.4–63.9) |
| CYP3A5 genotype | ||||
| *1/*1 | 5 | (10.0%) | 3 | (9.7%) |
| *1/*3 | 20 | (40.0%) | 10 | (32.2%) |
| *3/*3 | 25 | (50.0%) | 18 | (58.1%) |
| Tacrolimus | 1 Month after Transplantation | 1 Year after Transplantation | ||||||
|---|---|---|---|---|---|---|---|---|
| AUC0–24/D (ng·h/mL/mg) | p-Value | C0/D (ng/mL/mg) | p-Value | AUC0–24/D (ng·h/mL/mg) | p-Value | C0/D (ng/mL/mg) | p-Value | |
| Gender | 0.428 | 0.663 | 0.113 | 0.261 | ||||
| Male | 35.8 (23.1–46.6) | 0.89 (0.71–1.36) | 59.0 (30.4–73.7) | 1.42 (0.90–2.46) | ||||
| Female | 32.2 (22.8–39.2) | 0.86 (0.63–1.17) | 34.9 (30.6–48.1) | 1.03 (0.93–1.43) | ||||
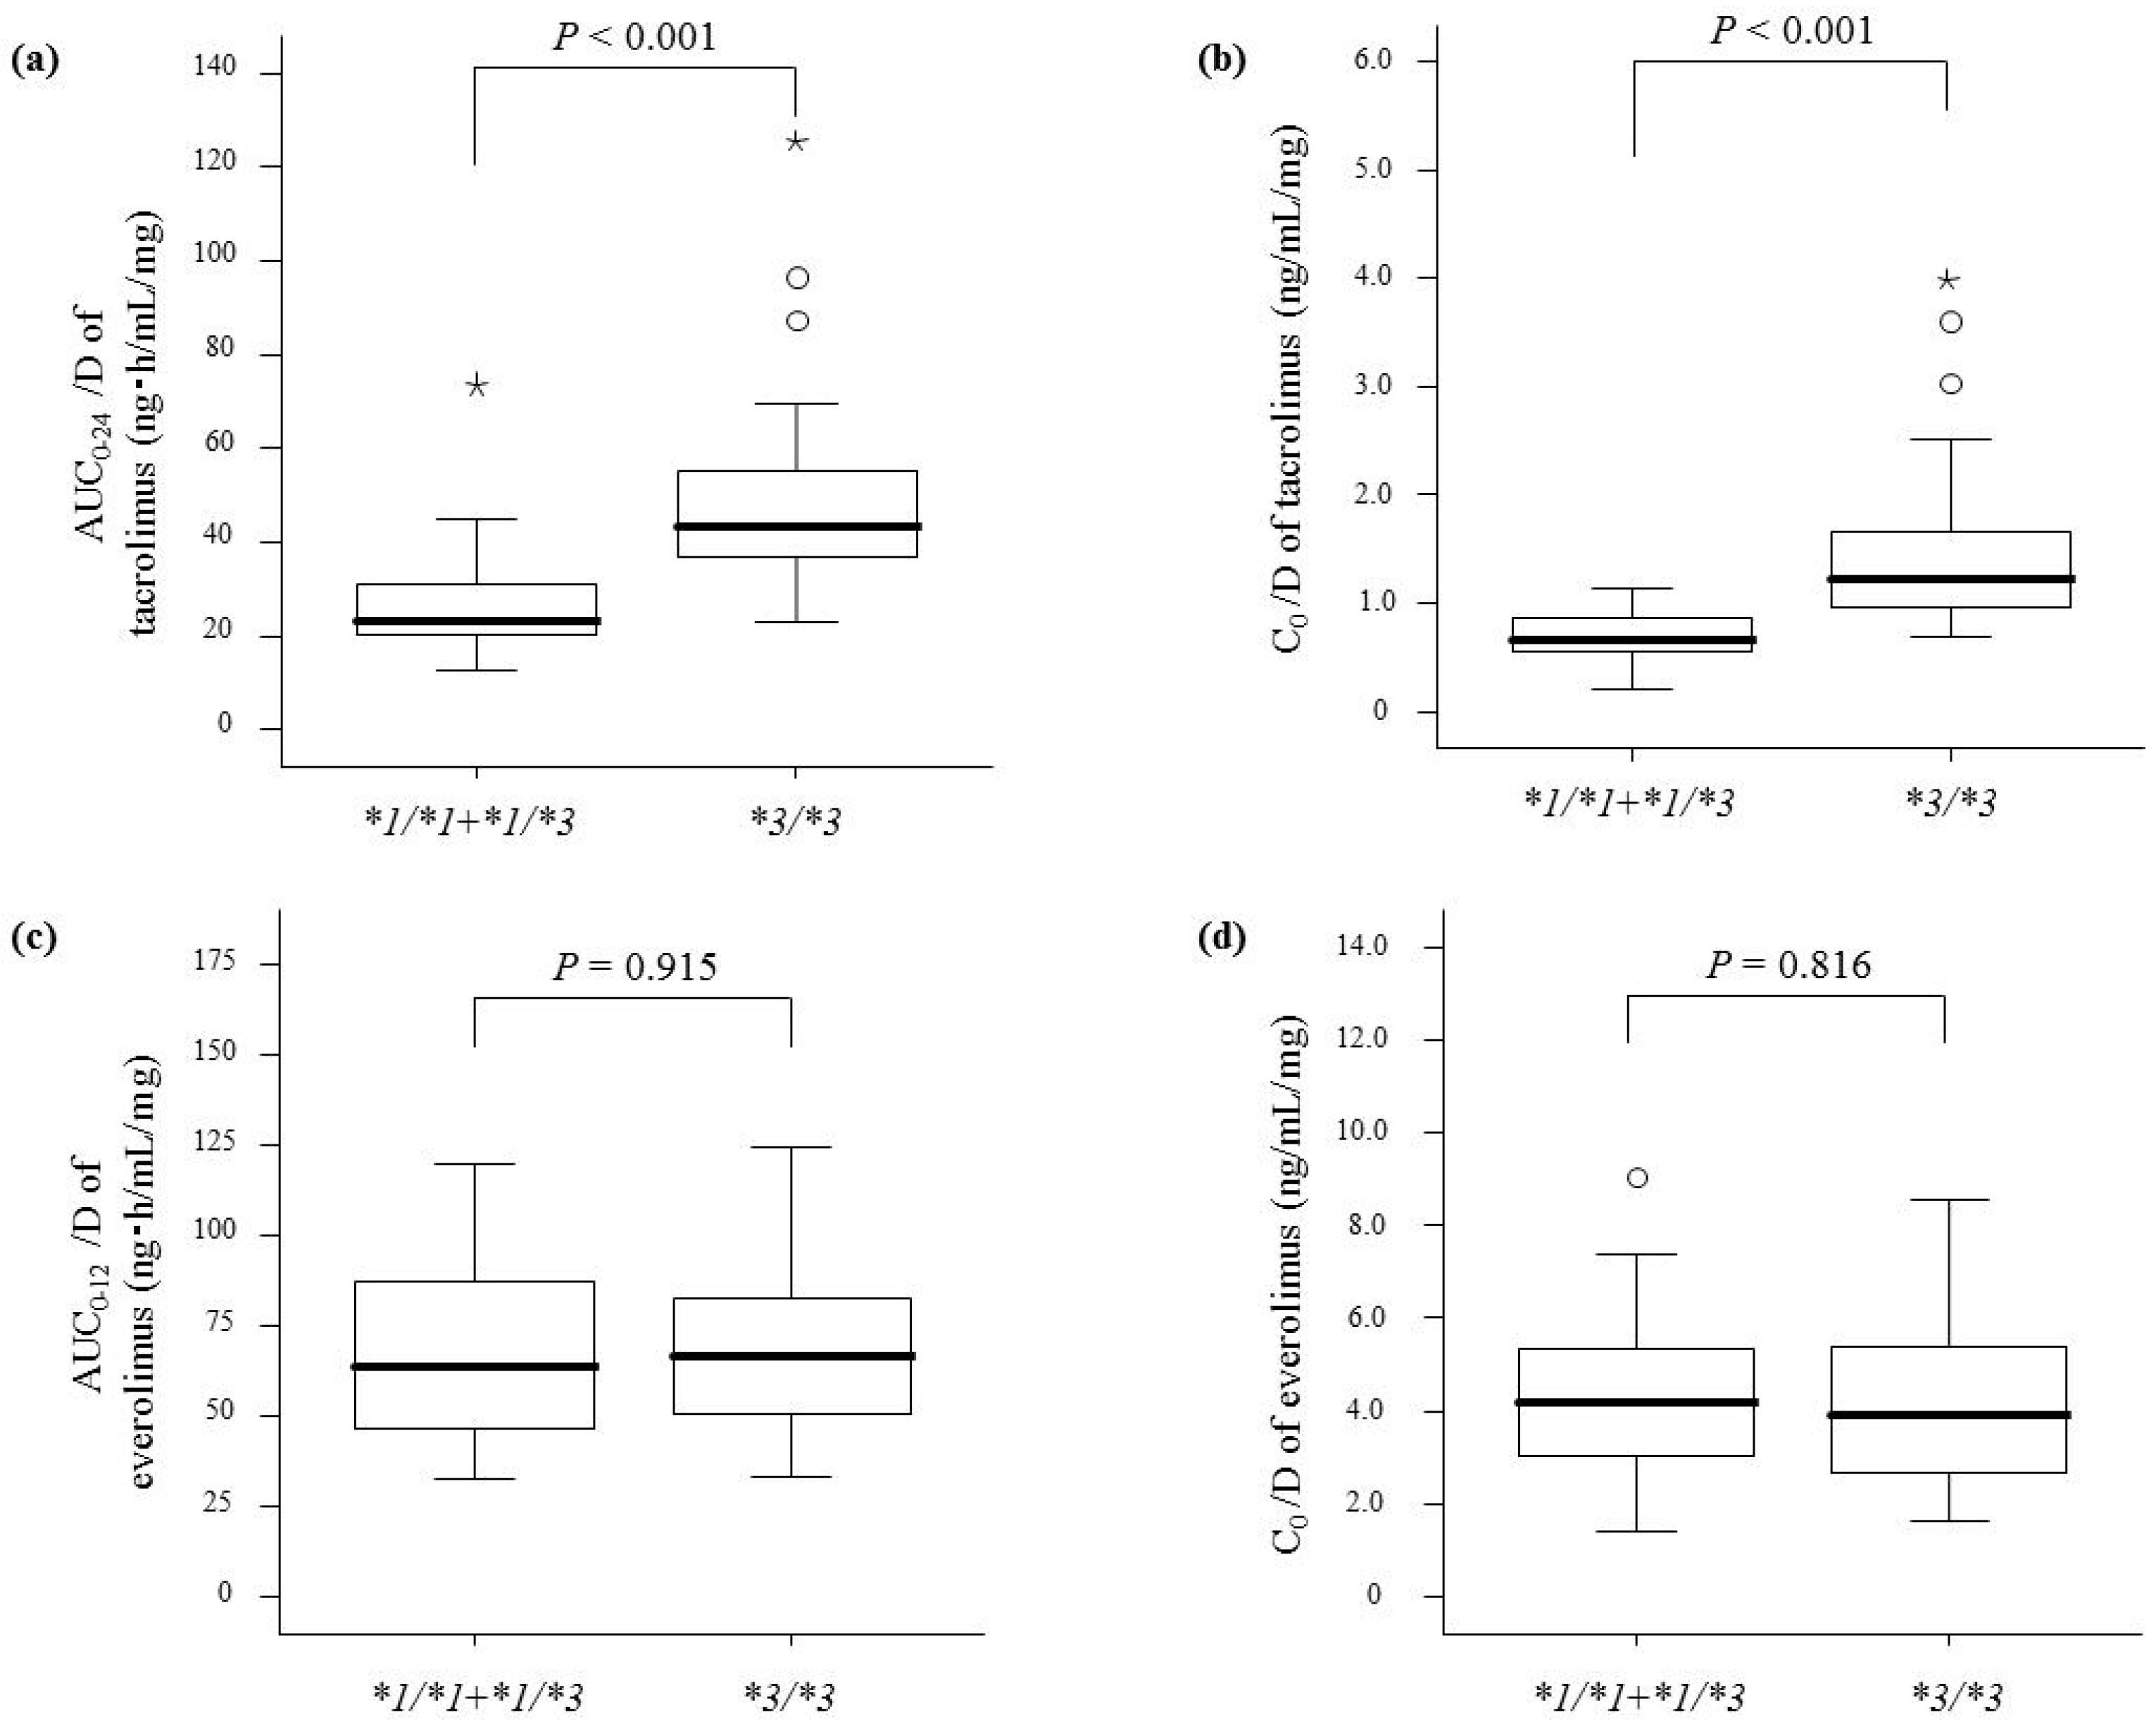
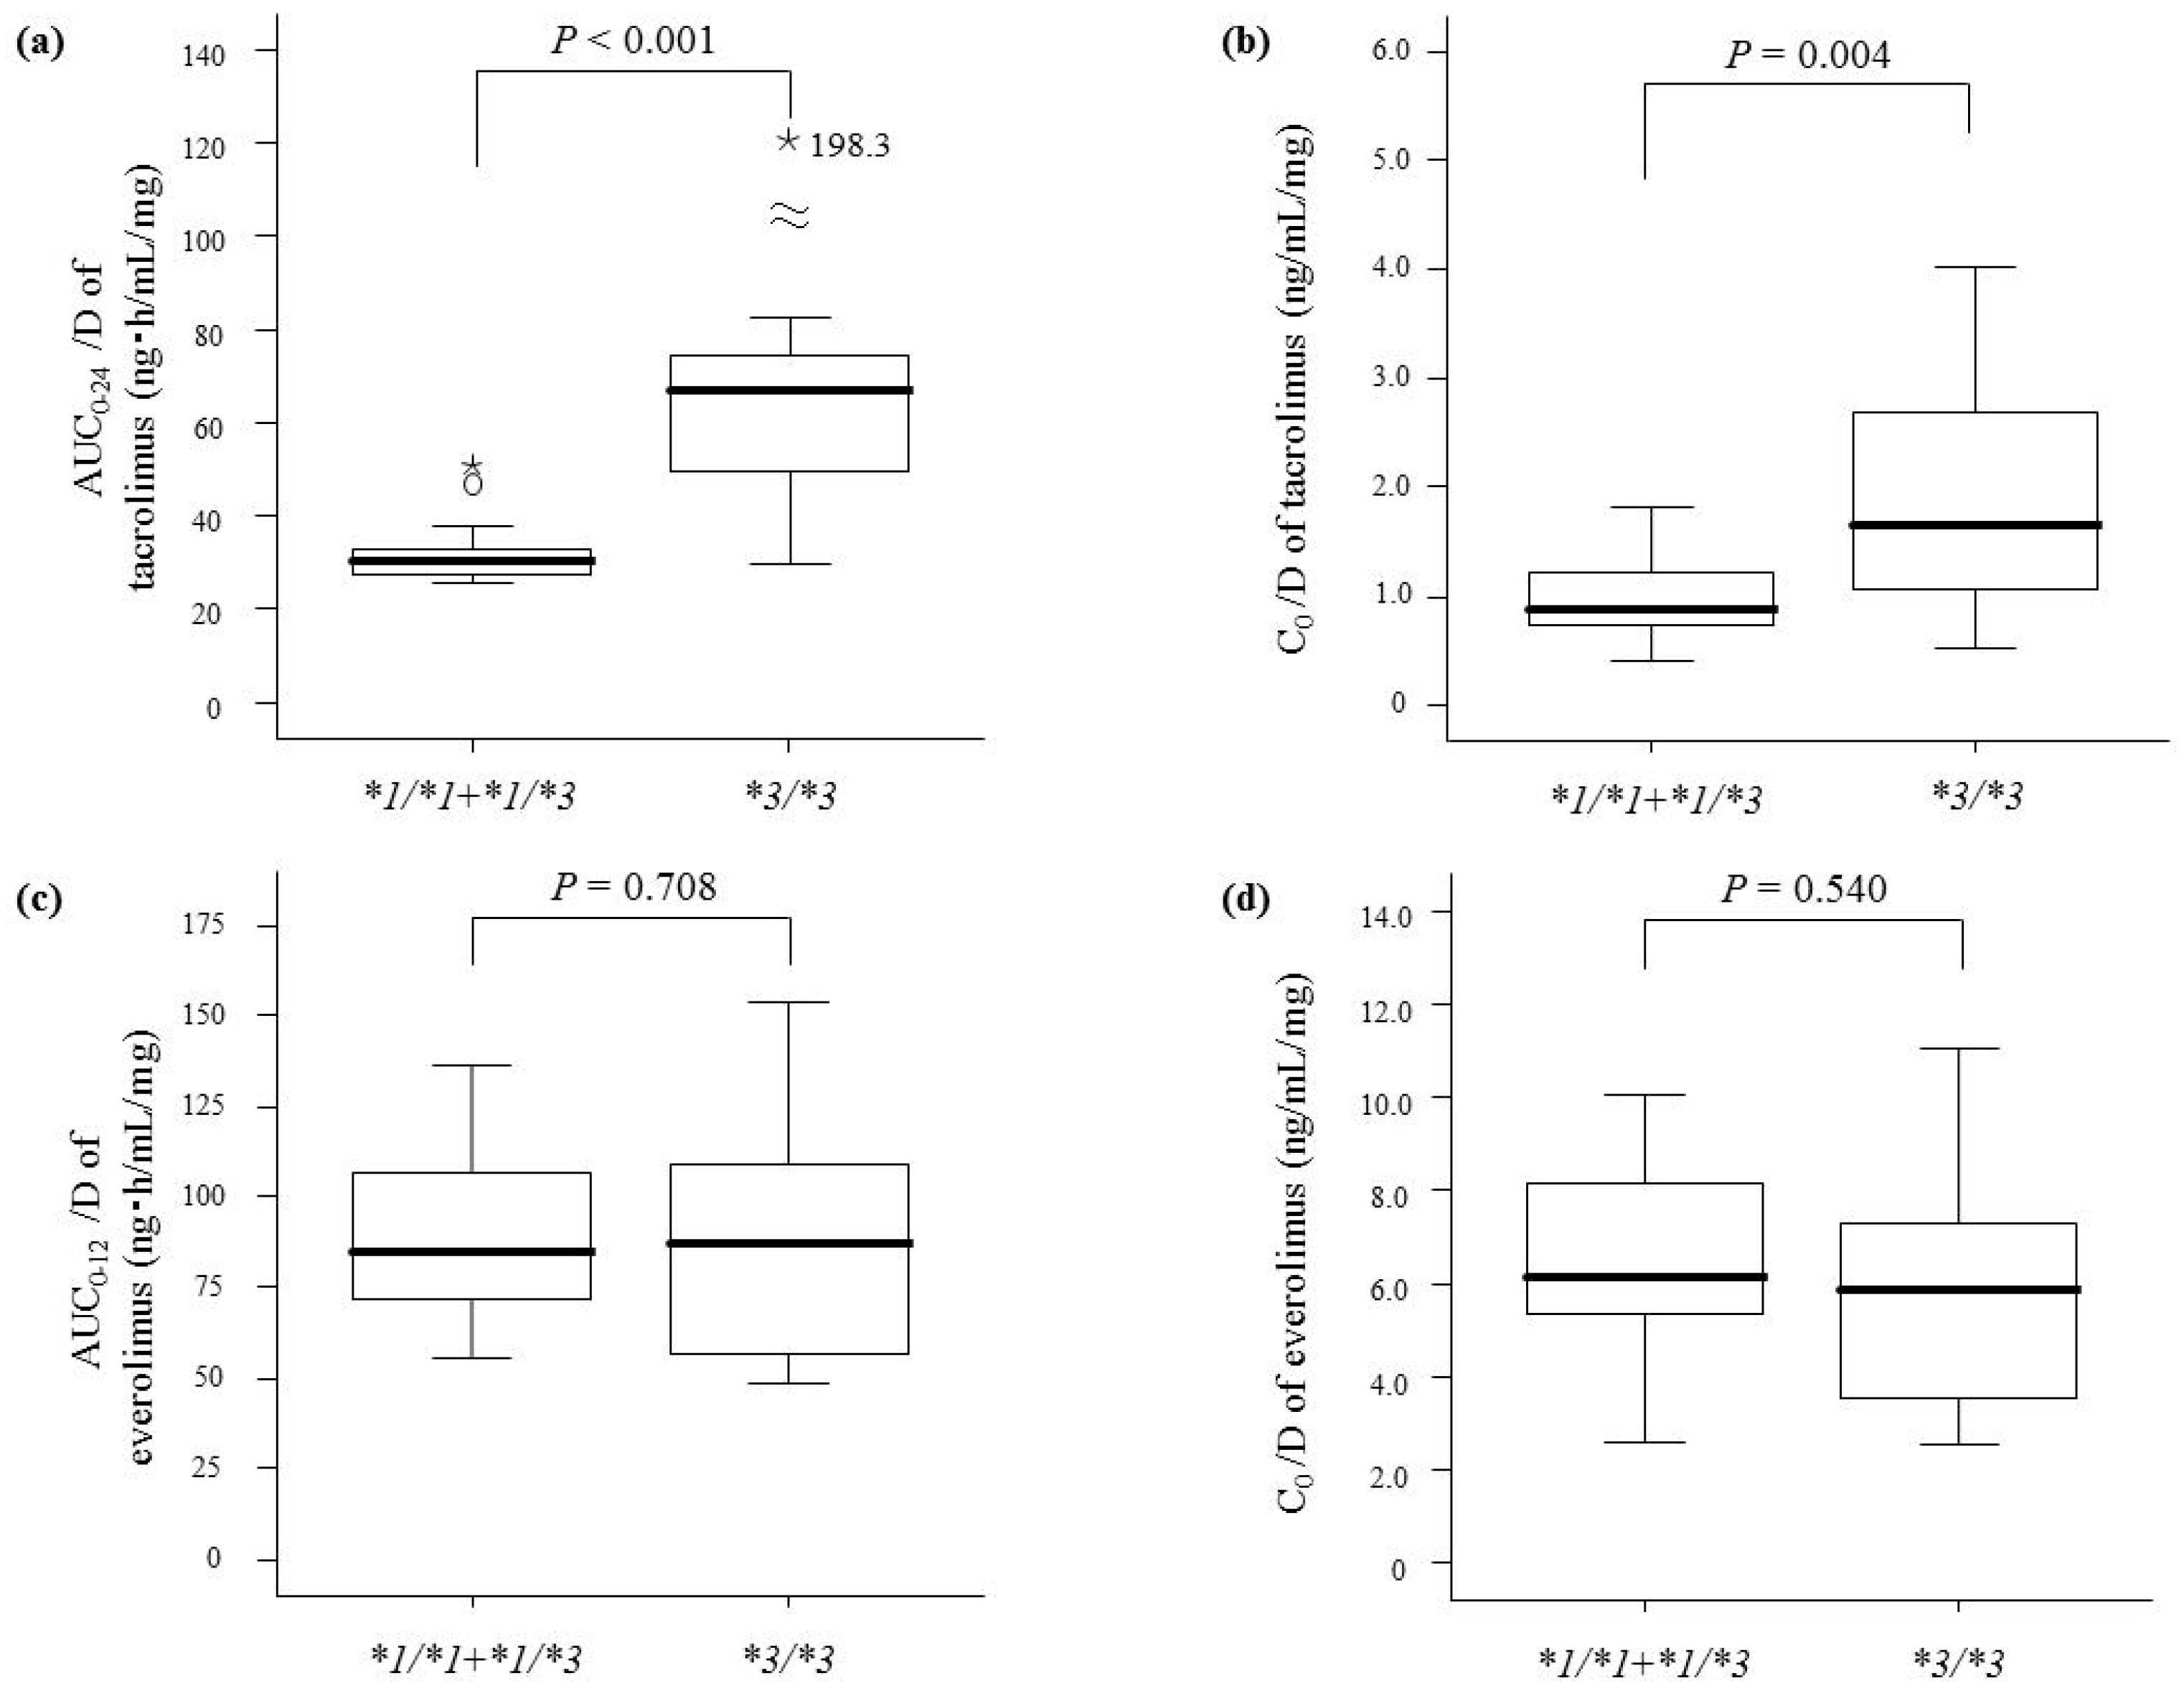
| CYP3A5 genotype | <0.001 | <0.001 | <0.001 | 0.019 | ||||
| *1/*1 | 20.3 (15.7–22.3) | 0.58 (0.42–0.59) | 27.5 (26.6–29.2) | 0.80 (0.59–1.15) | ||||
| *1/*3 | 26.0 (21.3–31.3) | 0.72 (0.57–0.87) | 30.6 (27.3–37.7) | 0.93 (0.72–1.20) | ||||
| *3/*3 | 43.1 (36.7–54.8) | 1.20 (0.97–1.66) | 66.6 (49.6–74.5) | 1.63 (1.03–2.67) | ||||
| Correlation coefficient (r) | p-Value | Correlation coefficient (r) | p-Value | Correlation coefficient (r) | p-Value | Correlation coefficient (r) | p-Value | |
| Age (year) | 0.219 | 0.127 | 0.236 | 0.100 | 0.345 | 0.058 | 0.307 | 0.092 |
| Body weight (kg) | 0.021 | 0.883 | −0.018 | 0.903 | 0.038 | 0.839 | 0.122 | 0.515 |
| Aspartate aminotransferase (IU/L) | 0.346 | 0.014 | 0.345 | 0.014 | 0.167 | 0.370 | −0.139 | 0.457 |
| Alanine aminotransferase (IU/L) | 0.436 | 0.002 | 0.392 | 0.005 | 0.150 | 0.421 | −0.019 | 0.919 |
| Hemoglobin (g/dL) | 0.145 | 0.315 | 0.274 | 0.054 | −0.024 | 0.900 | 0.008 | 0.965 |
| Serum albumin (g/dL) | −0.014 | 0.921 | 0.073 | 0.615 | −0.156 | 0.401 | −0.141 | 0.448 |
| Creatinine clearance (mL/min) | 0.116 | 0.423 | 0.115 | 0.426 | −0.259 | 0.160 | −0.054 | 0.772 |
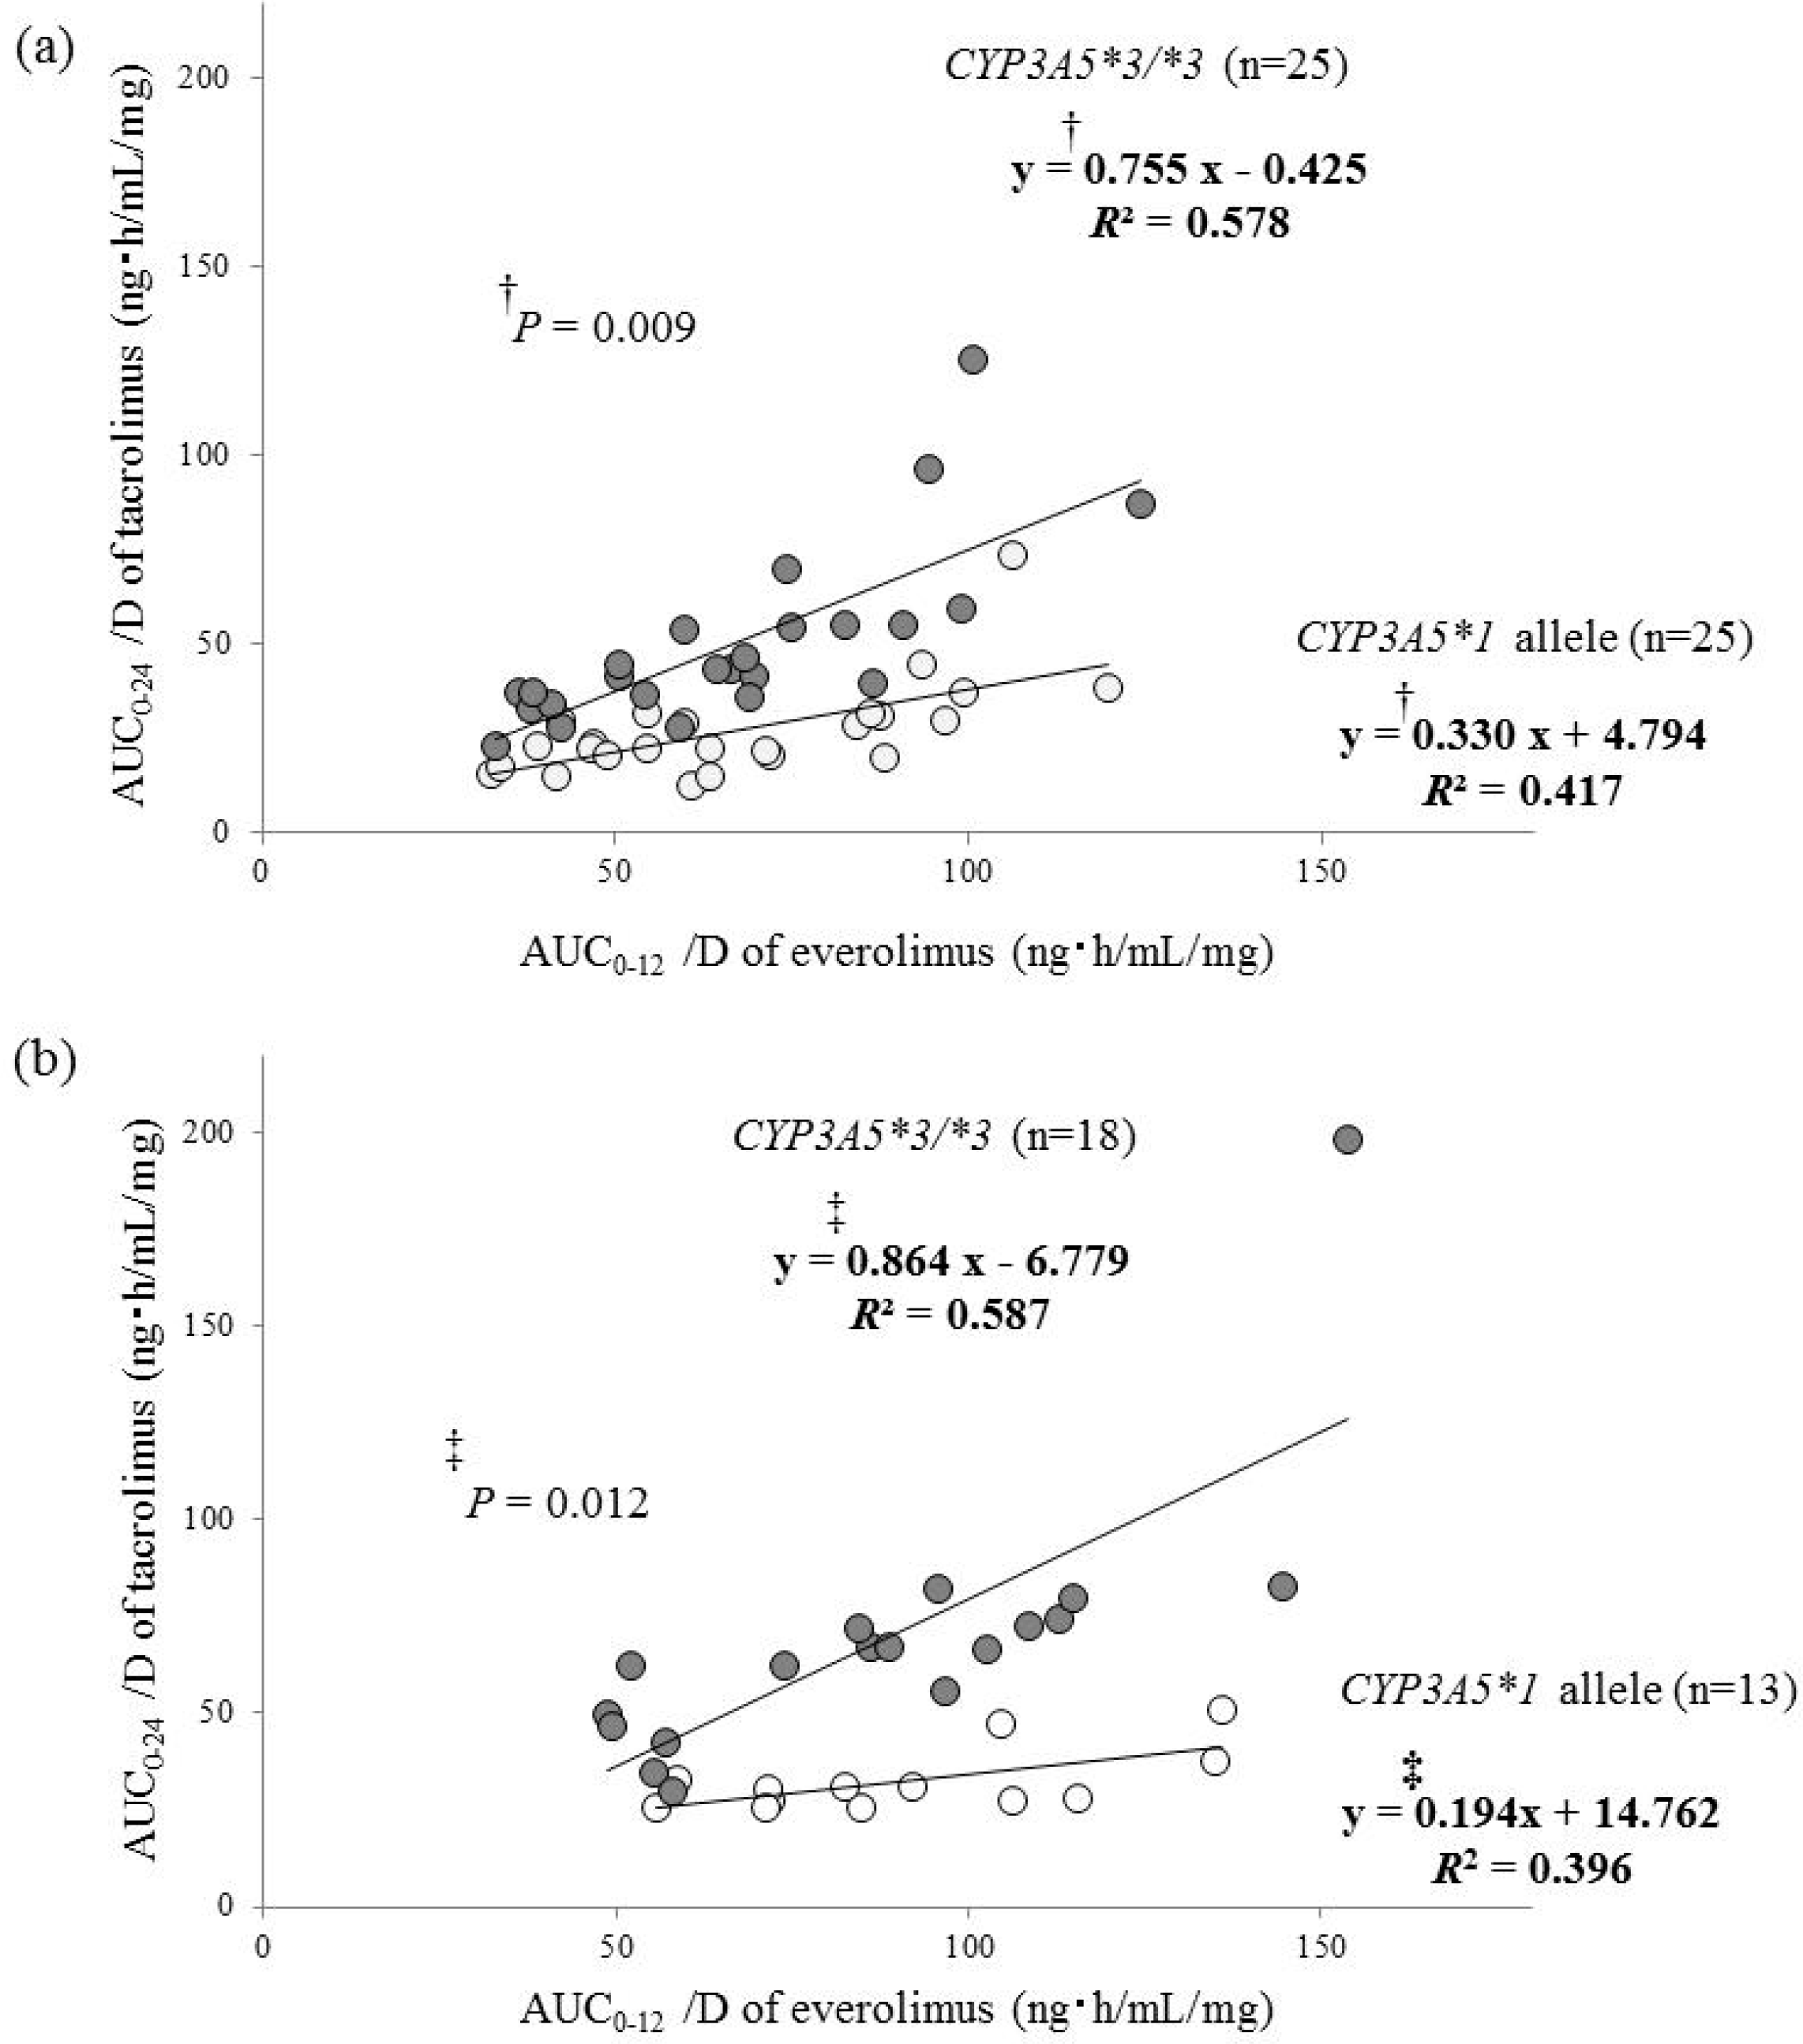
| Everolimus pharmacokinetics | 0.527 * | <0.001 | 0.526 ** | <0.001 | 0.442 * | 0.013 | 0.258 ** | 0.161 |
| Objective Variable | Explanatory Variable | Slope | SE | SRC | p-Value | R2 |
|---|---|---|---|---|---|---|
| AUC0–24/D of tacrolimus at 1 month after transplantation (ng·h/mL/mg) | 0.616 | |||||
| AUC0–12/D of everolimus (ng·h/mL/mg) | 0.534 | 0.083 | 0.581 | <0.001 | ||
| CYP3A5 genotype (*3/*3 = 1) | 23.360 | 3.917 | 0.539 | <0.001 | ||
| Intercept = | −9.038 | 6.27 | ||||
| C0/D of tacrolimus at 1 month after transplantation (ng/mL/mg) | 0.643 | |||||
| C0/D of everolimus (ng/mL/mg) | 0.246 | 0.034 | 0.627 | <0.001 | ||
| CYP3A5 genotype (*3/*3 = 1) | 0.792 | 0.135 | 0.510 | <0.001 | ||
| Intercept = | −0.379 | 0.181 | ||||
| AUC0–24/D of tacrolimus at 1 year after transplantation (ng·h/mL/mg) | 0.633 | |||||
| CYP3A5 genotype (*3/*3 = 1) | 38.899 | 7.563 | 0.590 | <0.001 | ||
| AUC0–12/D of everolimus (ng·h/mL/mg) | 0.641 | 0.130 | 0.568 | <0.001 | ||
| Intercept = | −26.058 | 13.137 | ||||
| C0/D of tacrolimus at 1 year after transplantation (ng/mL/mg) | 0.427 | |||||
| CYP3A5 genotype (*3/*3 = 1) | 0.943 | 0.252 | 0.539 | 0.001 | ||
| C0/D of everolimus (ng/mL/mg) | 0.160 | 0.053 | 0.435 | 0.005 | ||
| Intercept = | −0.025 | 0.387 | ||||
| CYP3A5 Genotype | Cmax/D | Elimination Half-Life | ||
|---|---|---|---|---|
| Correlation Coefficient (r) | p-Value | Correlation Coefficient (r) | p-Value | |
| 1 month after transplantation | ||||
| CYP3A5*1allele | 0.603 | <0.001 | 0.459 | 0.021 |
| *3/*3 | 0.659 | <0.001 | 0.587 | 0.002 |
| 1 year after transplantation | ||||
| CYP3A5*1allele | 0.349 | 0.243 | 0.099 | 0.748 |
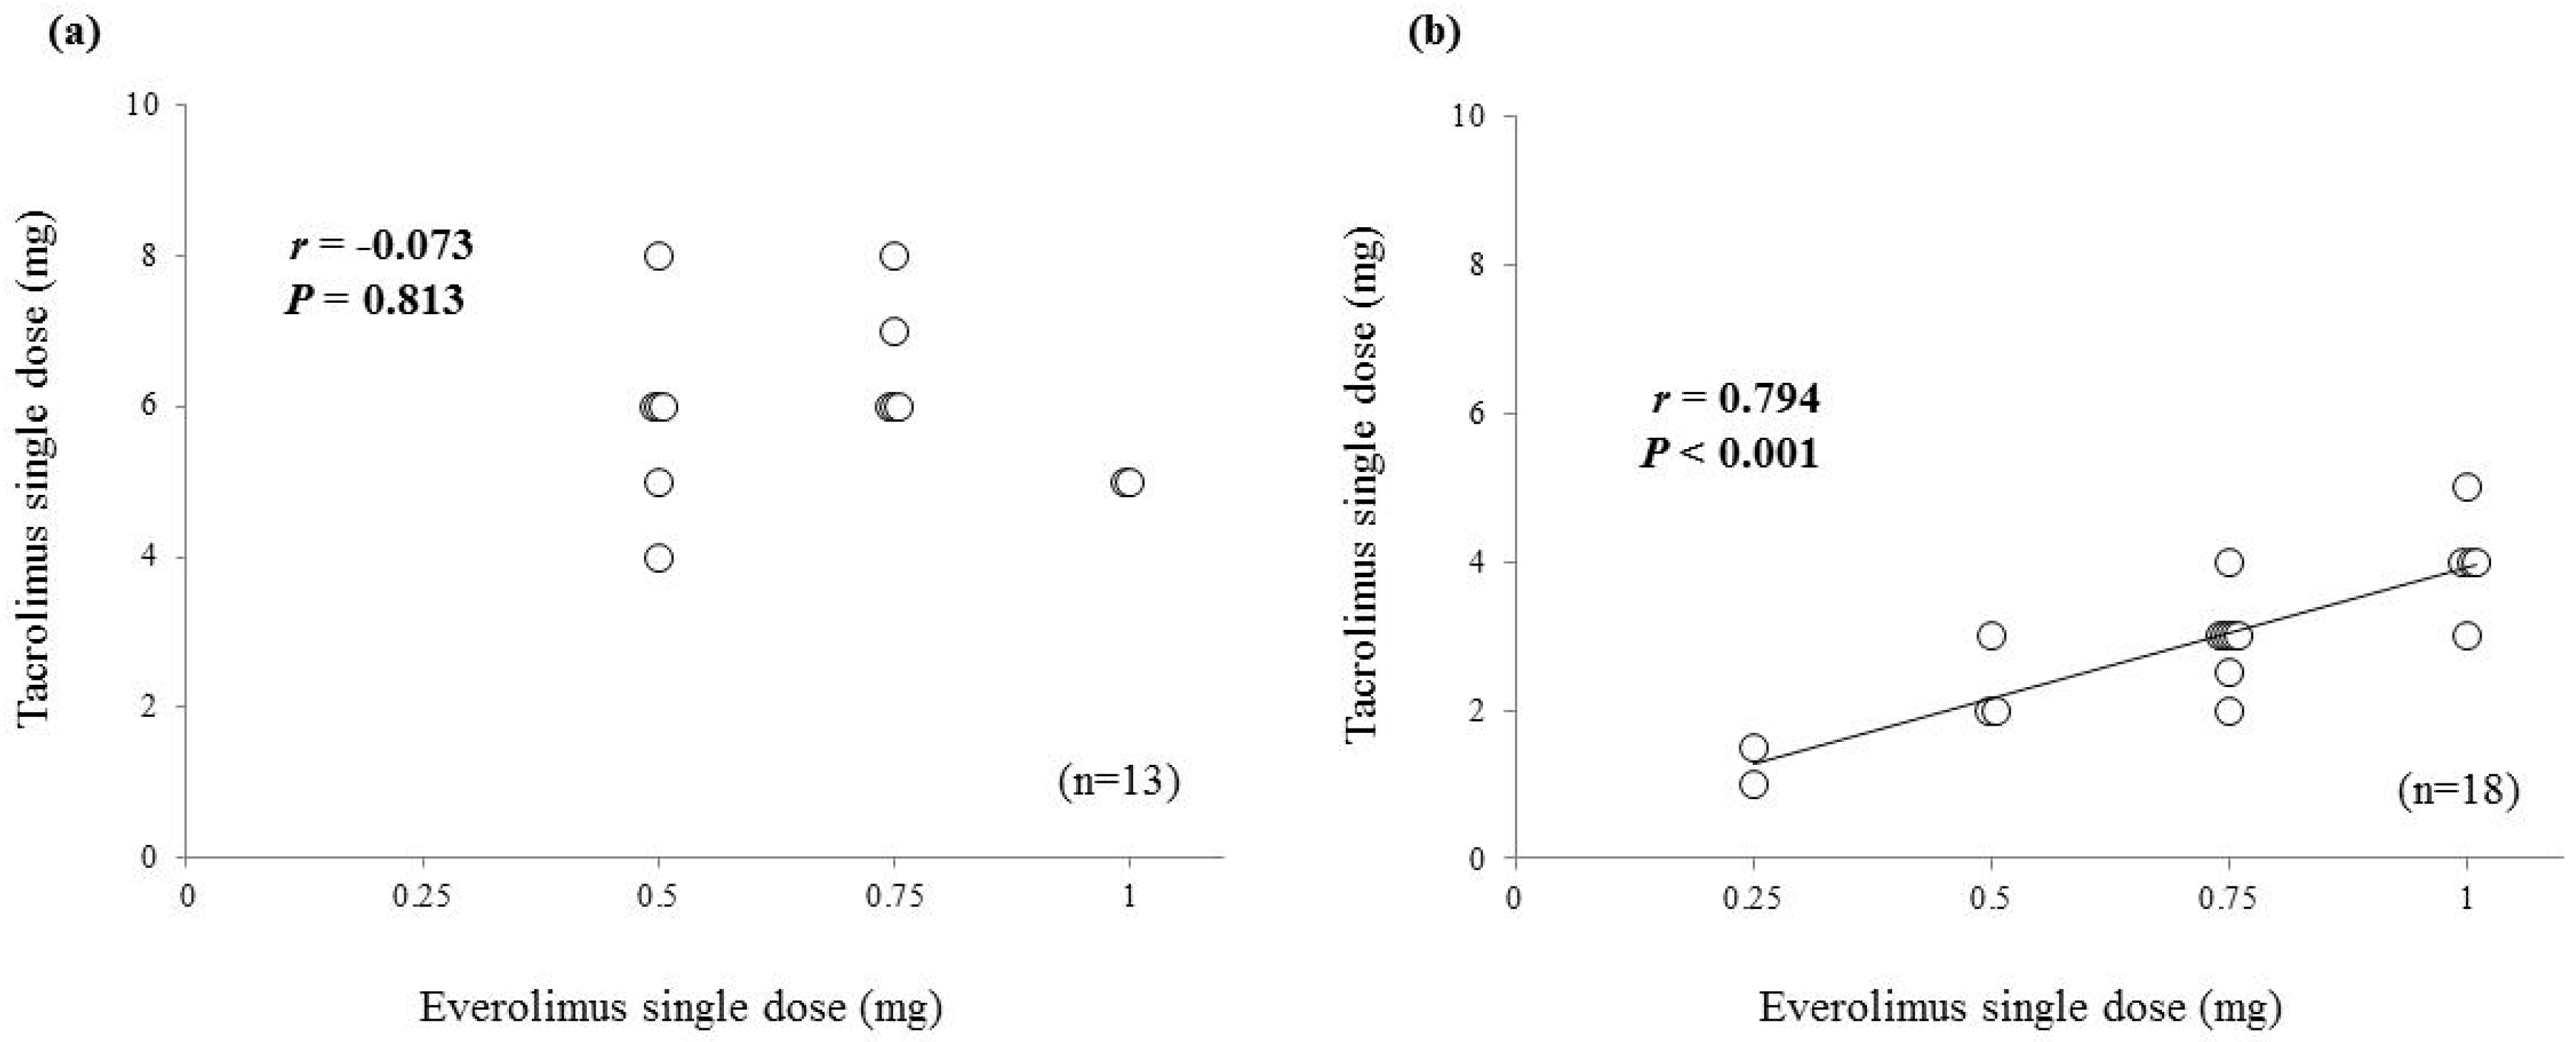
| *3/*3 | 0.769 | <0.001 | 0.341 | 0.181 |
© 2018 by the authors. Licensee MDPI, Basel, Switzerland. This article is an open access article distributed under the terms and conditions of the Creative Commons Attribution (CC BY) license (http://creativecommons.org/licenses/by/4.0/).
Share and Cite
Kagaya, H.; Niioka, T.; Saito, M.; Inoue, T.; Numakura, K.; Yamamoto, R.; Akamine, Y.; Habuchi, T.; Satoh, S.; Miura, M. Prediction of Tacrolimus Exposure by CYP3A5 Genotype and Exposure of Co-Administered Everolimus in Japanese Renal Transplant Recipients. Int. J. Mol. Sci. 2018, 19, 882. https://doi.org/10.3390/ijms19030882
Kagaya H, Niioka T, Saito M, Inoue T, Numakura K, Yamamoto R, Akamine Y, Habuchi T, Satoh S, Miura M. Prediction of Tacrolimus Exposure by CYP3A5 Genotype and Exposure of Co-Administered Everolimus in Japanese Renal Transplant Recipients. International Journal of Molecular Sciences. 2018; 19(3):882. https://doi.org/10.3390/ijms19030882
Chicago/Turabian StyleKagaya, Hideaki, Takenori Niioka, Mitsuru Saito, Takamitsu Inoue, Kazuyuki Numakura, Ryohei Yamamoto, Yumiko Akamine, Tomonori Habuchi, Shigeru Satoh, and Masatomo Miura. 2018. "Prediction of Tacrolimus Exposure by CYP3A5 Genotype and Exposure of Co-Administered Everolimus in Japanese Renal Transplant Recipients" International Journal of Molecular Sciences 19, no. 3: 882. https://doi.org/10.3390/ijms19030882