2.1. Proteins That Are Overexpressed at High Temperatures Are Enriched in Electrostatically Charged Amino Acids and Depleted in Polar and Hydrophobic Amino Acids
We grew
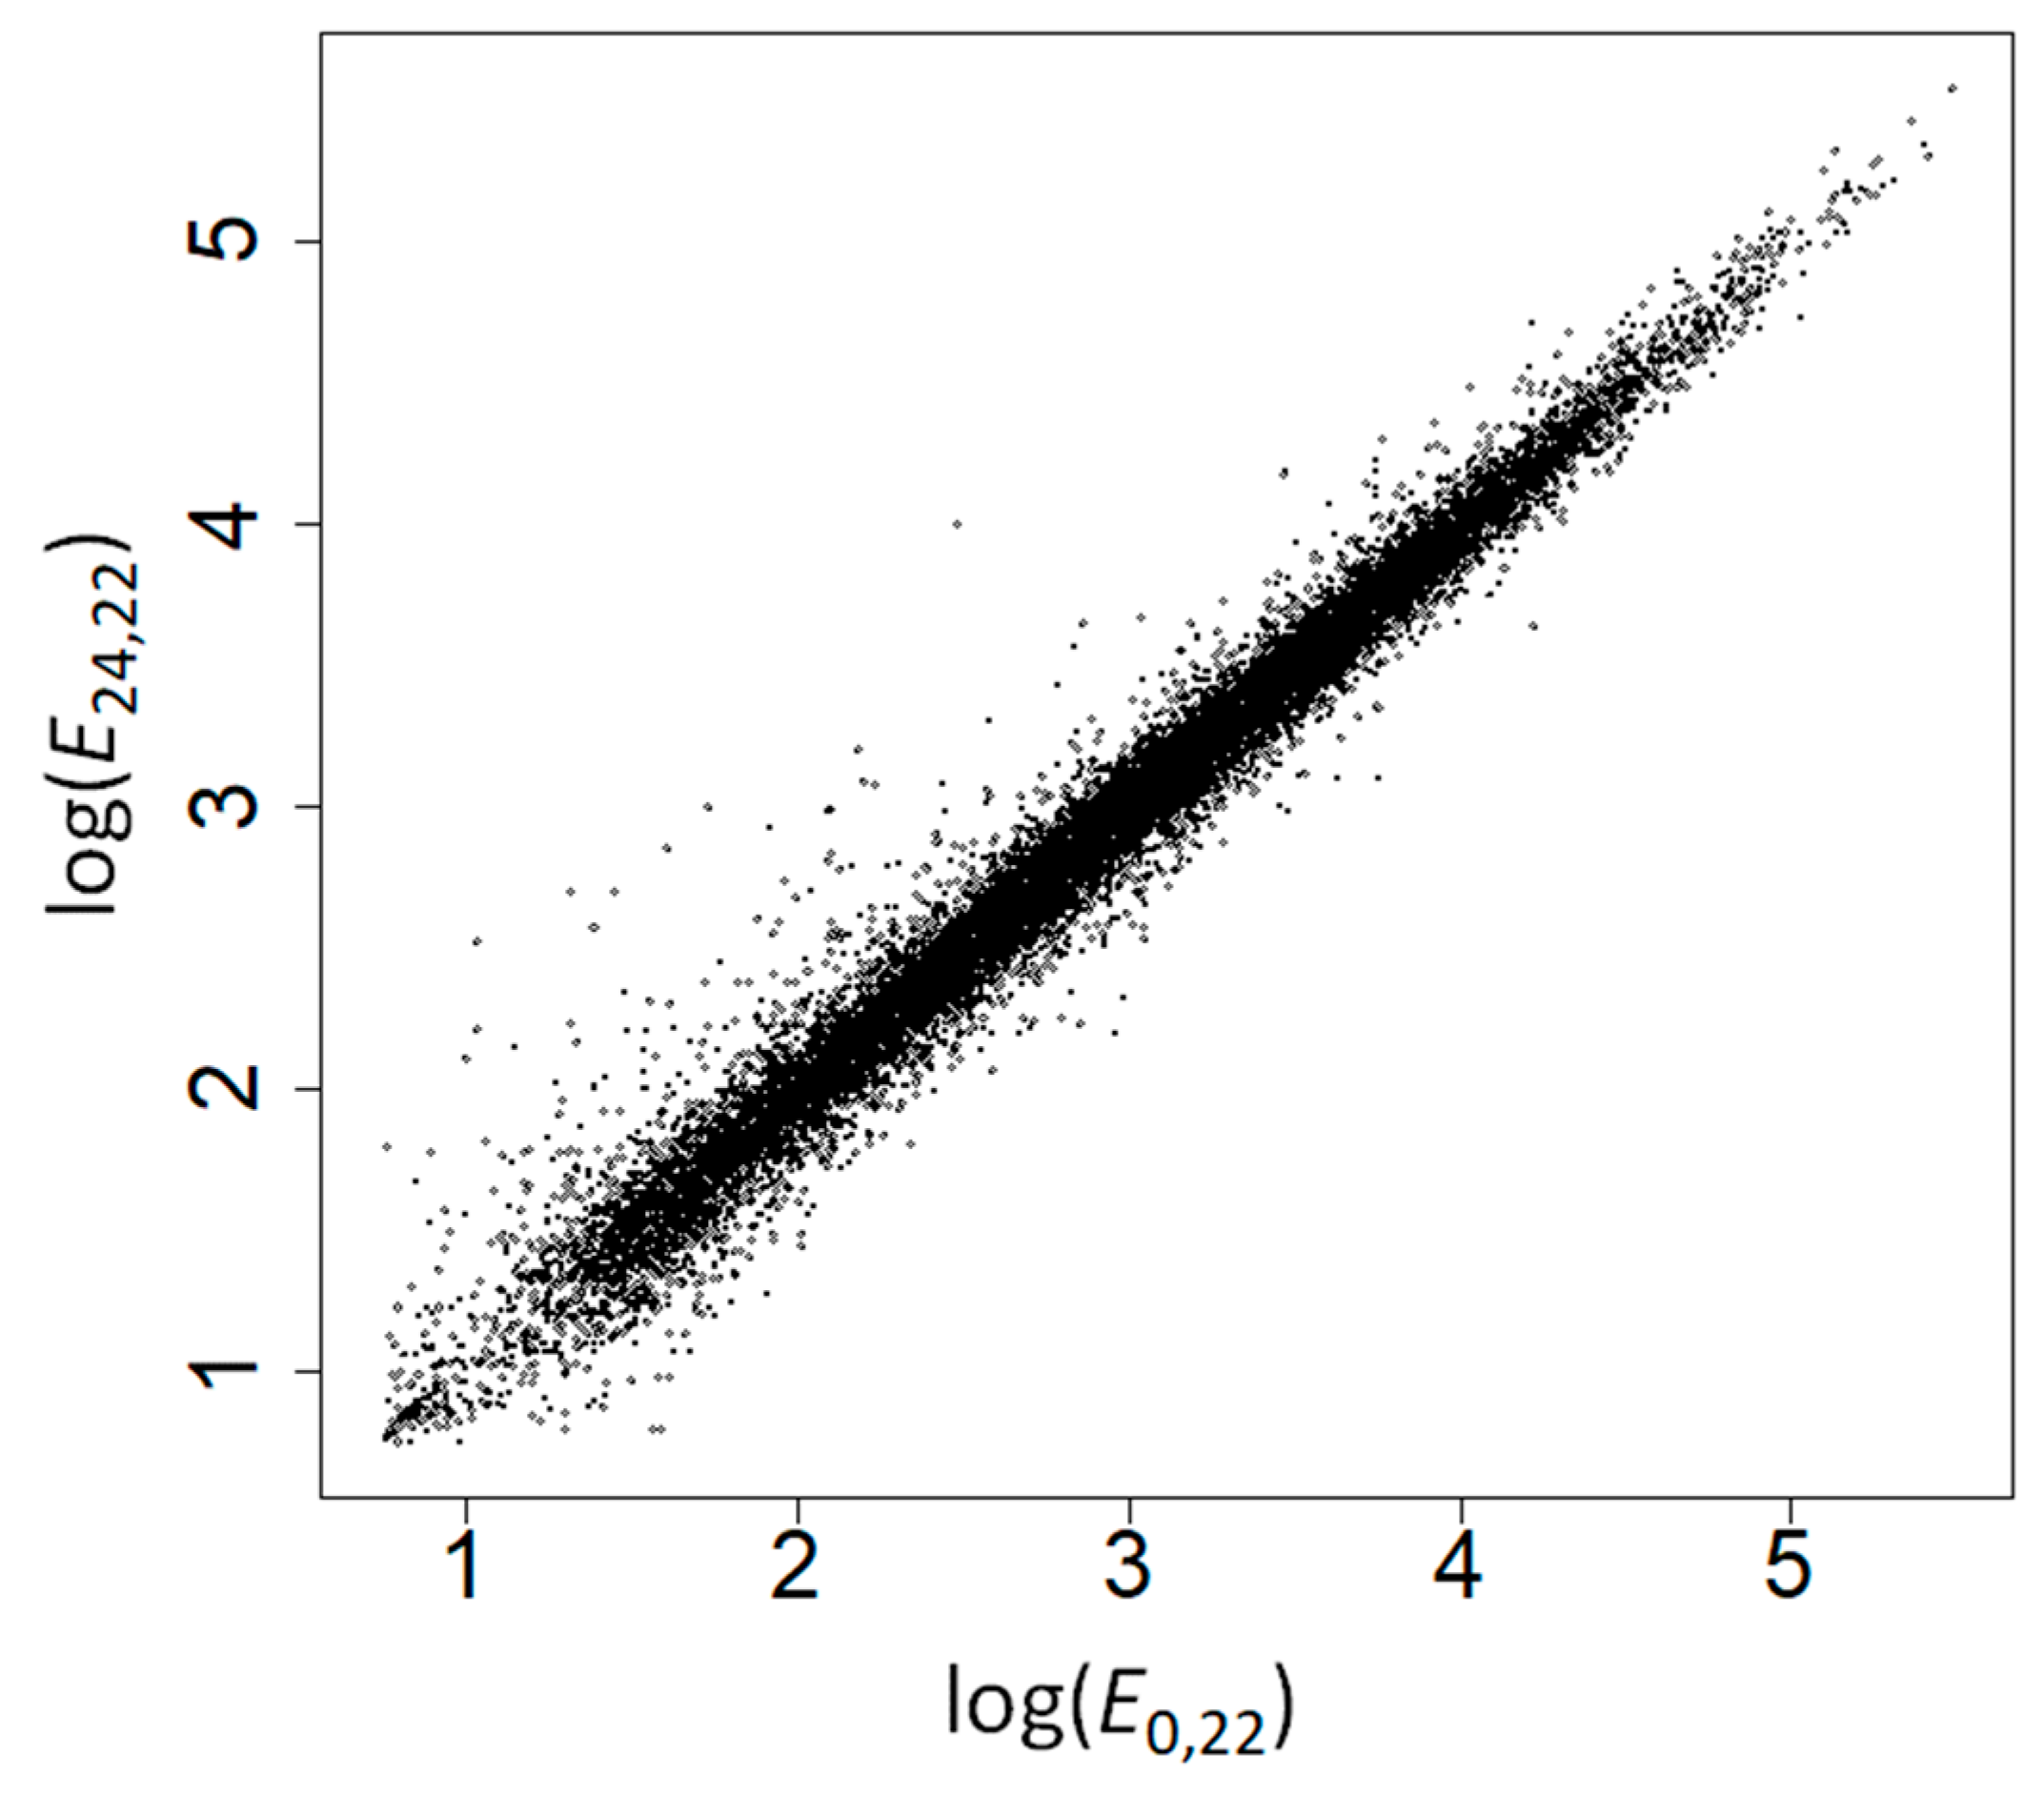
Arabidopsis plants at 22 and 37 °C for 24 h, and performed microarray analyses to measure gene expression levels at the beginning of the experiment (
E0,22 = expression at time 0 and 22 °C) and at the end of the experiment (
E24,22 and
E24,37).
E0,22 strongly correlated with
E24,22 (Spearman’s rank correlation coefficient,
ρ = 0.991,
p < 10
−200;
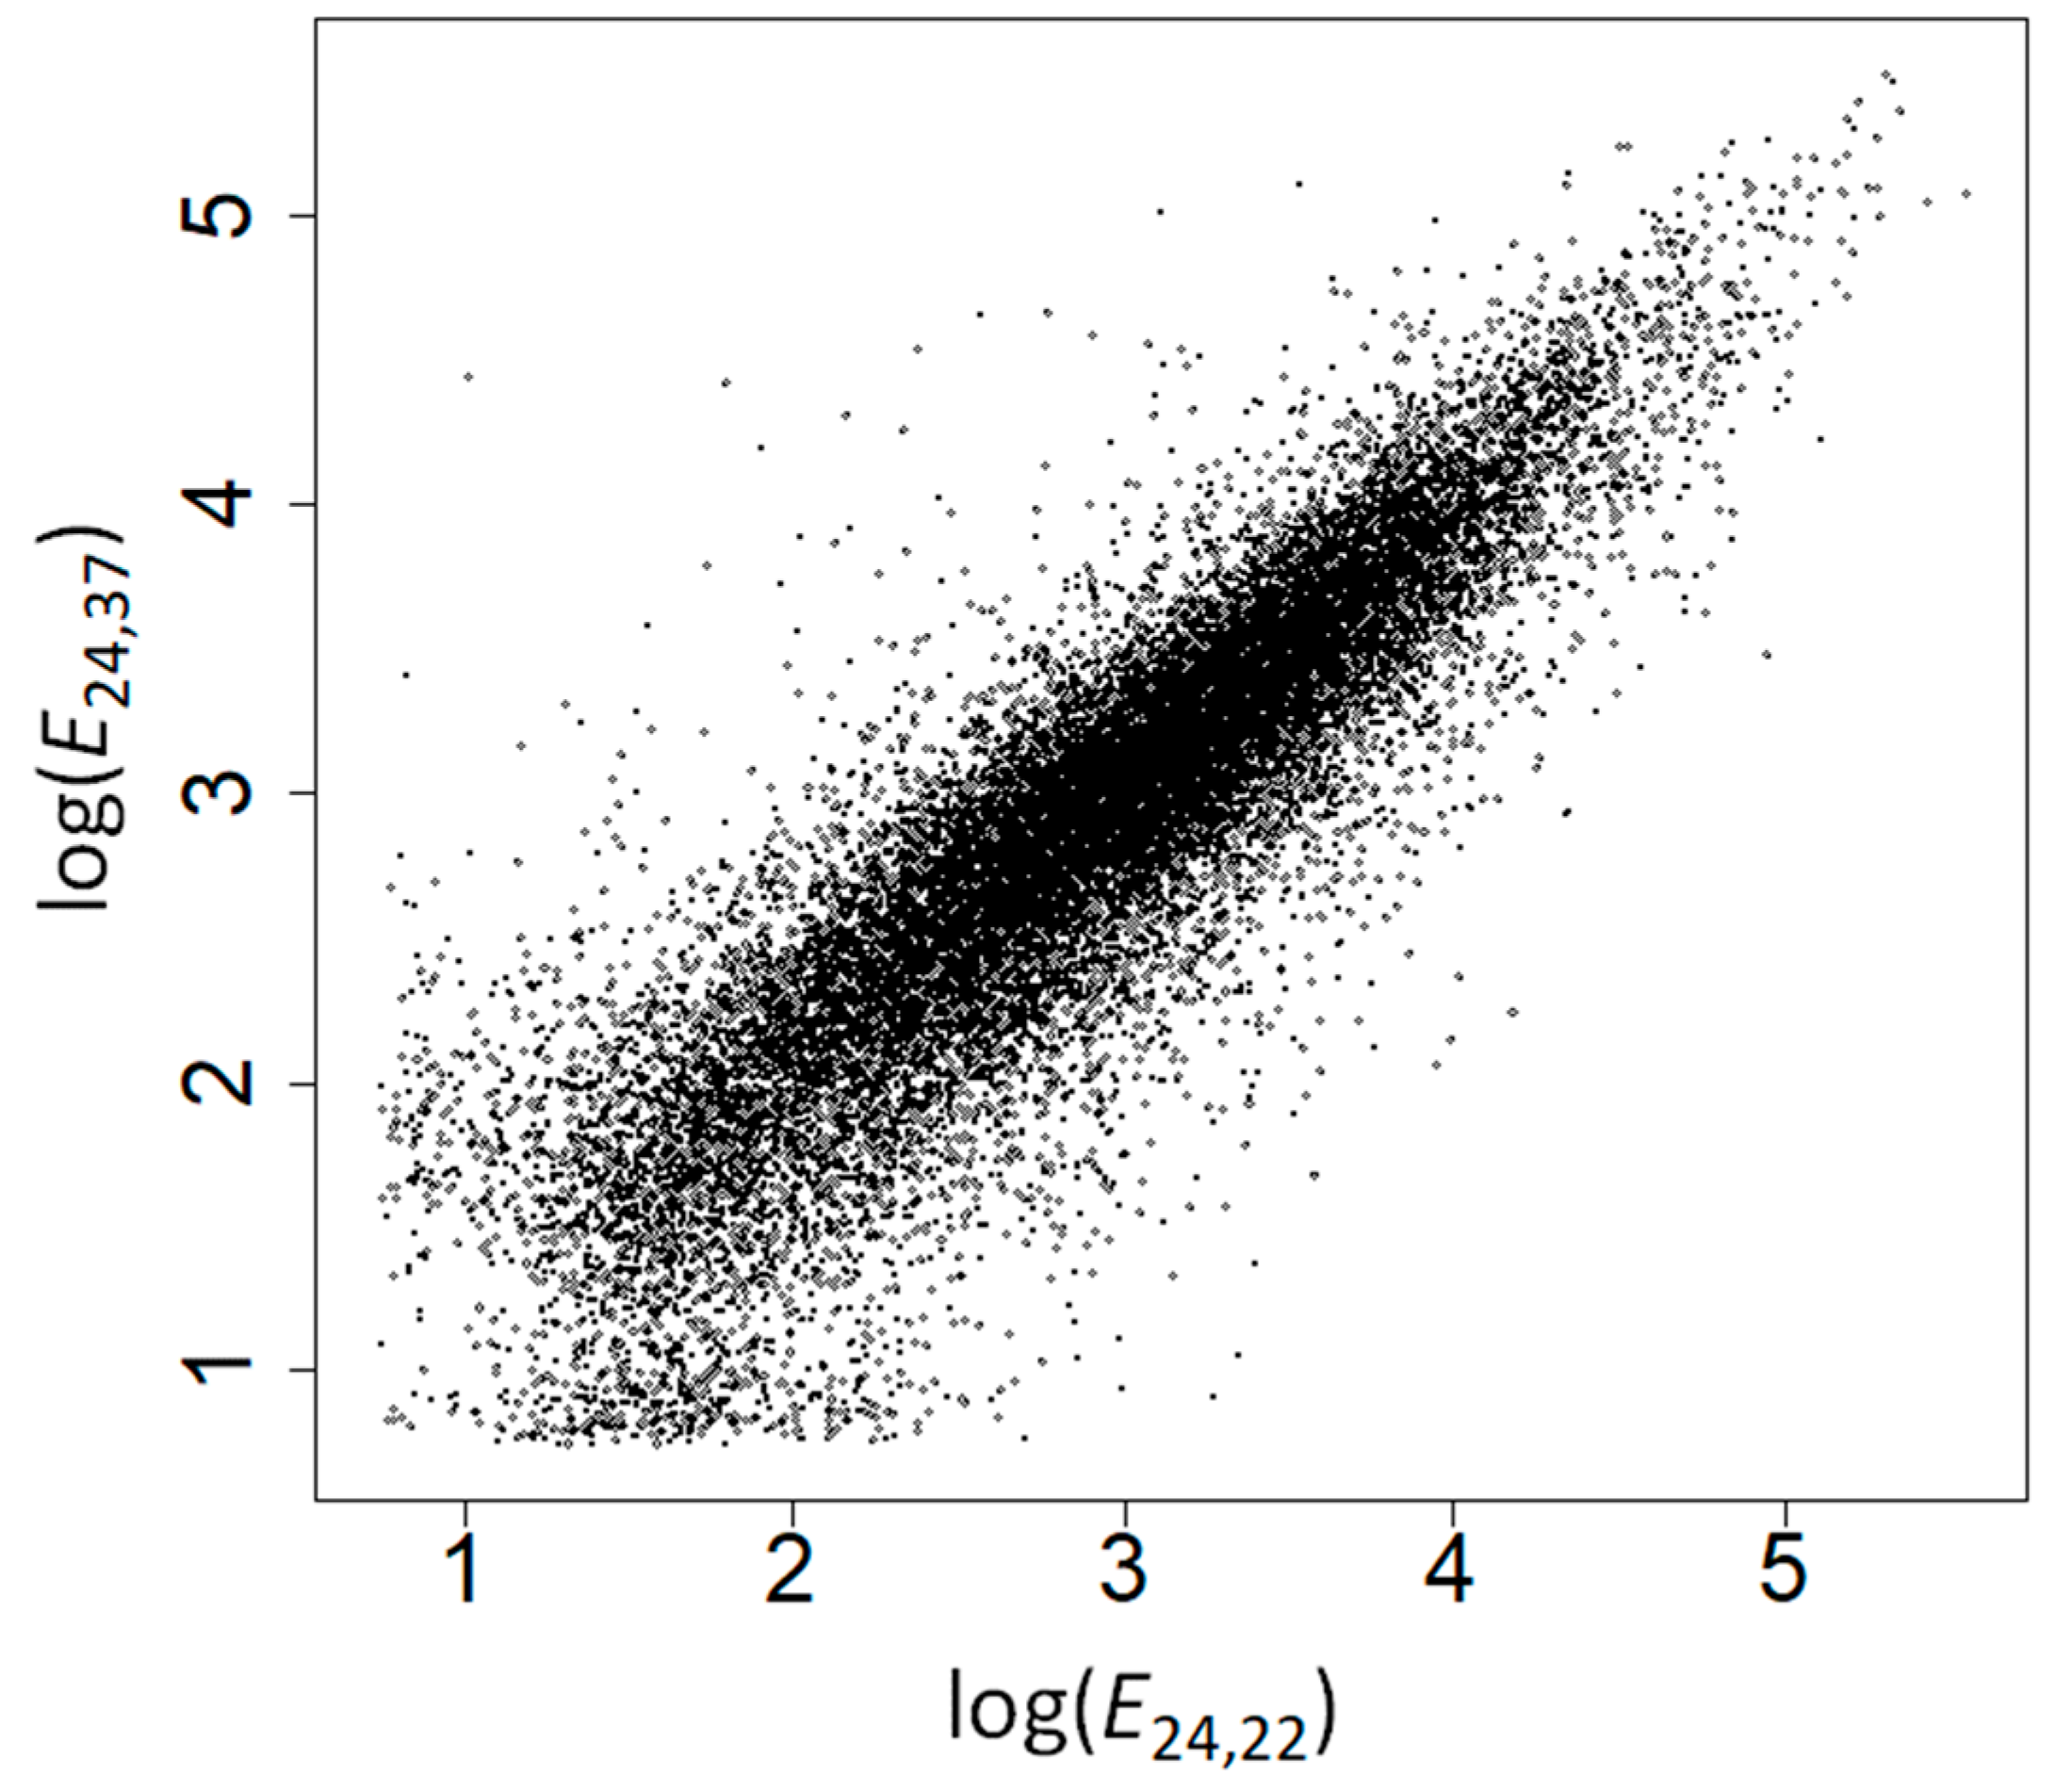
Figure 1) supporting the robustness of our gene expression measures—the small differences between gene expression at both time points could be due to differences in gene expression during development and to measurement errors. The correlation between
E24,22 and
E24,37 was weaker (
ρ = 0.897,
p = 10
−200;
Figure 2), highlighting the effect of heat stress on the expression of many genes.
For each gene with available probes (
n = 20,491), we computed a response to heat stress (
R) as the logarithm in base 2 of the ratio of expression levels at 37 and 22 °C (following formula 1). Genes with
R > 0 are overexpressed at high temperatures, and genes with
R < 0 are repressed. Genes with
R > 1 (strongly overexpressed) are enriched in Gene Ontology biological processes “protein refolding”, “protein folding”, “chaperone cofactor-dependent protein refolding”, “chaperone-mediated protein folding”, “de novo posttranslational protein folding”, “de novo protein folding”, “cellular response to heat”, “response to heat”, “response to temperature stimulus”, and “heat acclimation”. They are also enriched in molecular functions “misfolded protein binding”, “heat shock protein binding”, “protein binding involved in protein folding”, and “unfolded protein binding” (
Tables S1–S3).
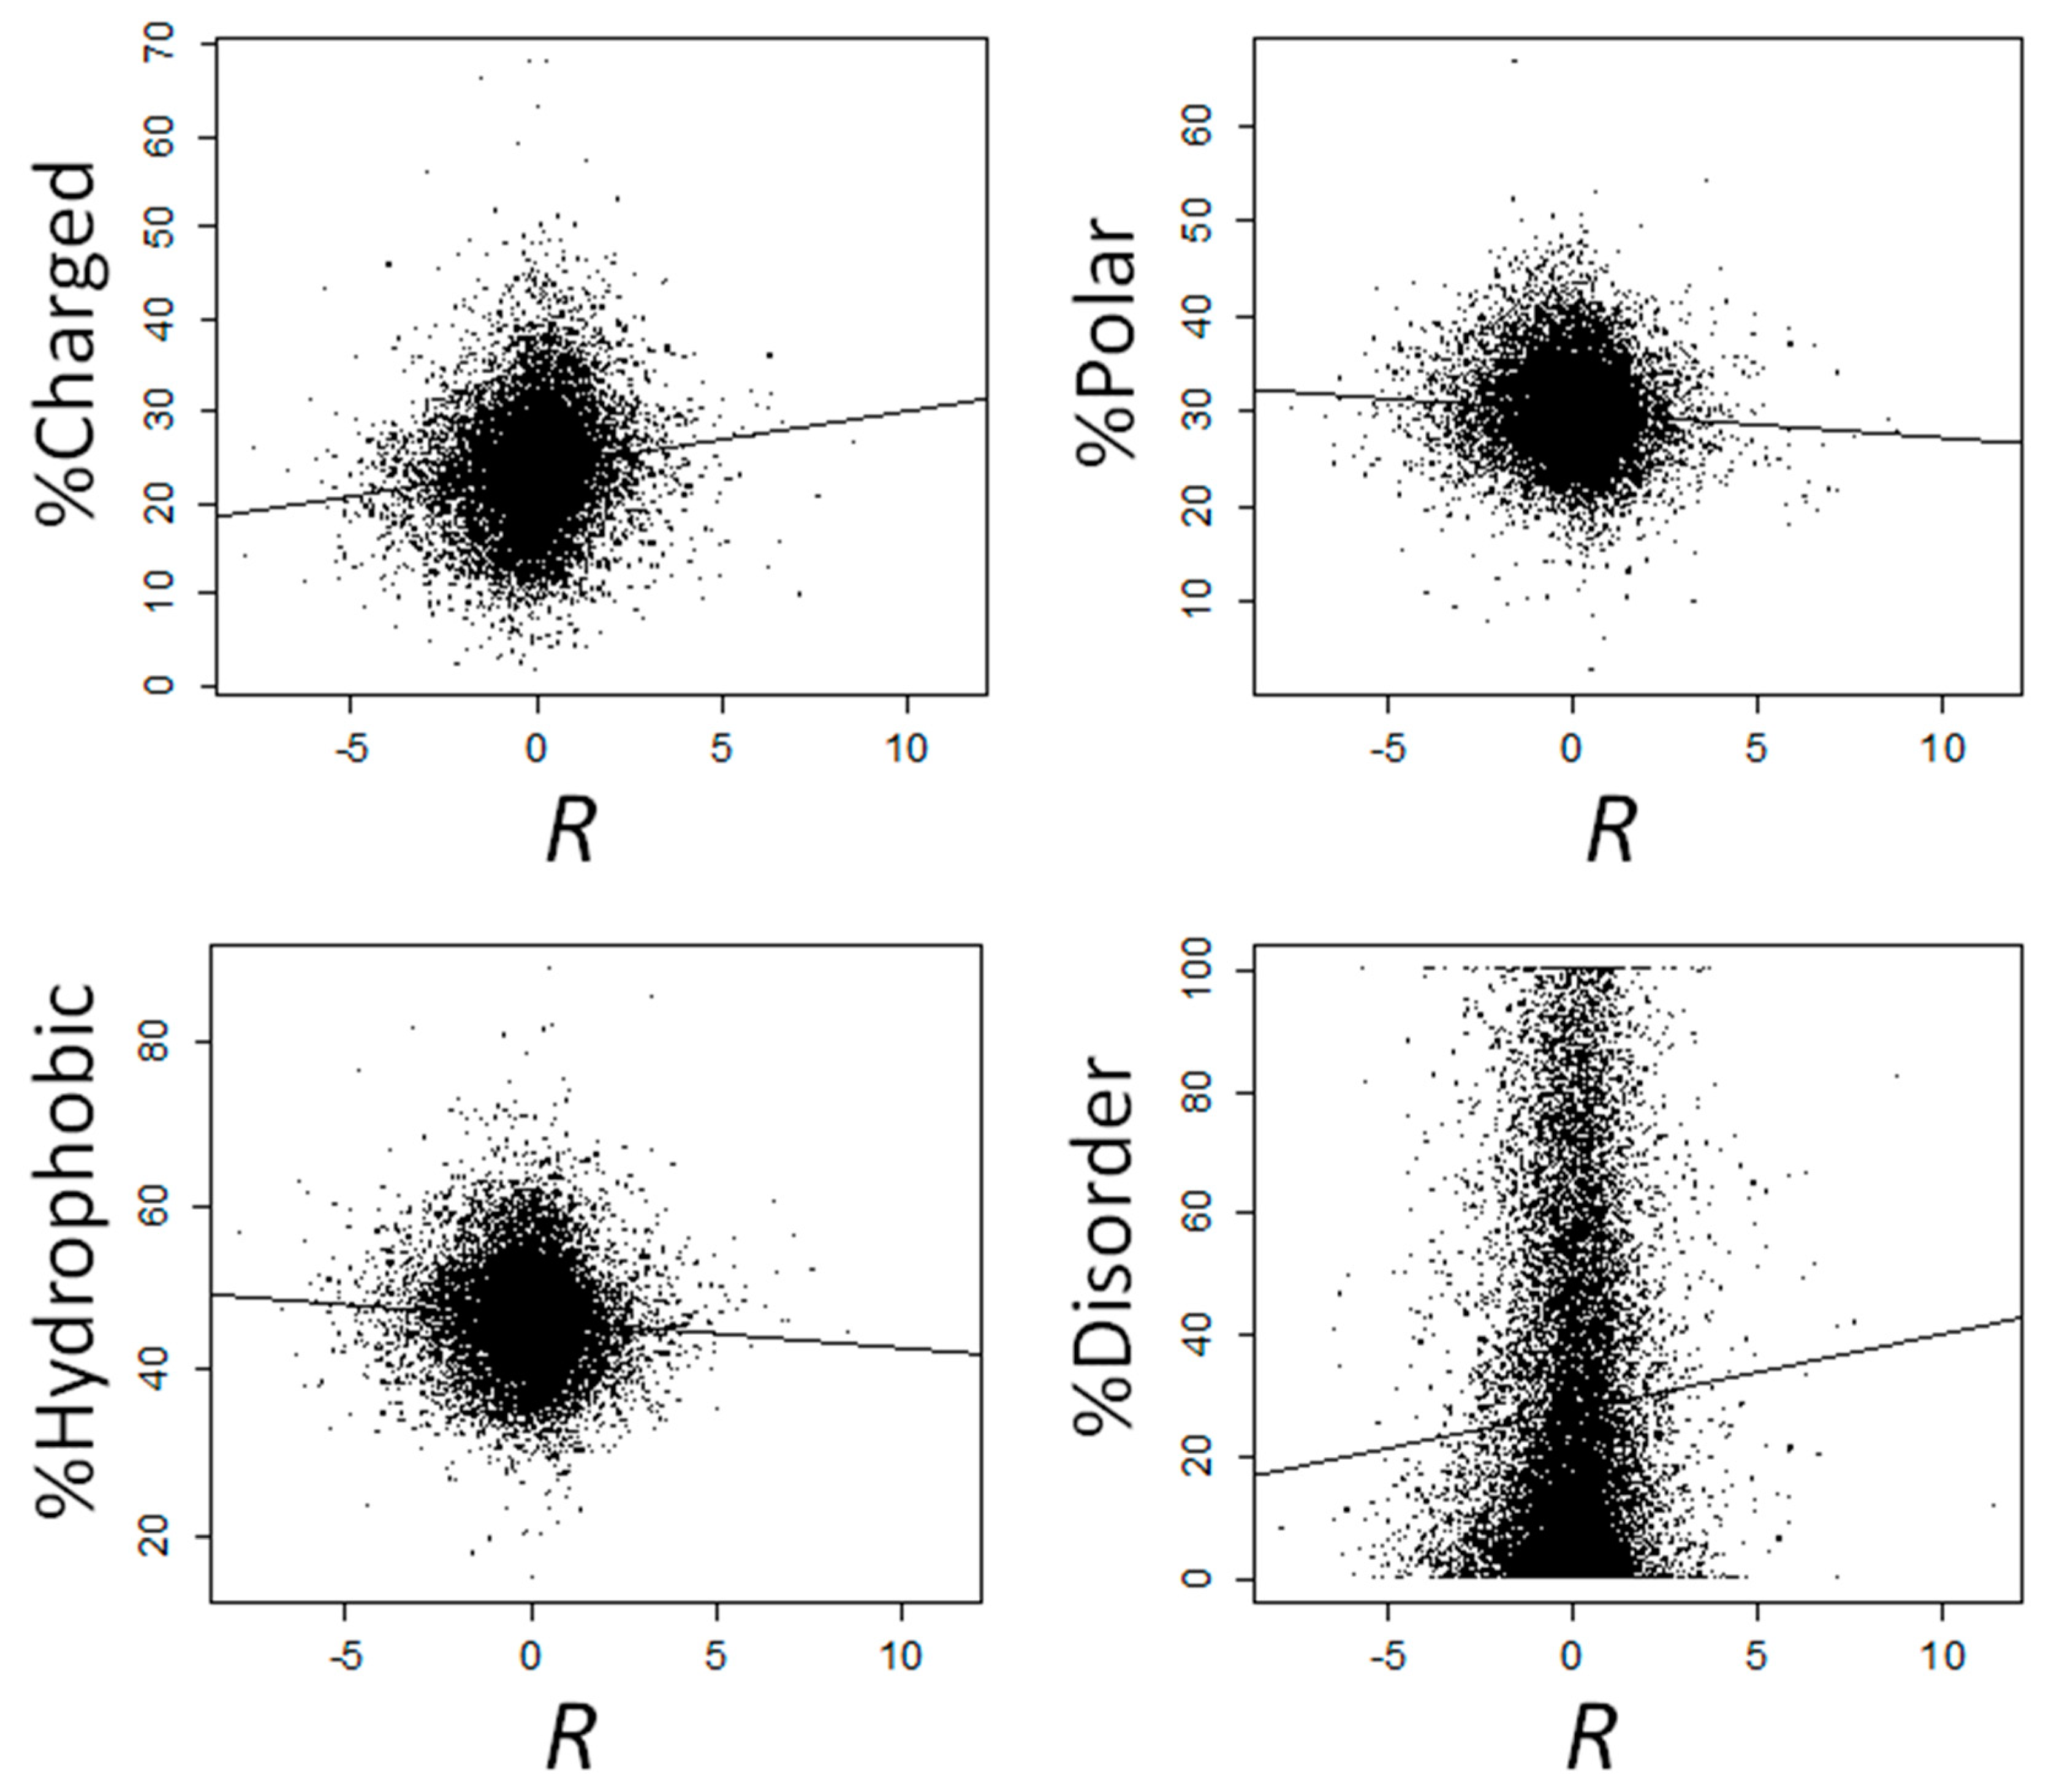
We observed a positive correlation between
R and the fraction of charged amino acids (
ρ = 0.146,
p = 2.47 × 10
−98), and negative correlations between
R and both the fraction of polar (
ρ = −0.076,
p = 1.72 × 10
−27) and hydrophobic (
ρ = −0.084,
p = 4.08 × 10
−33) amino acids (
Figure 3). We next computed the correlation between
R and the frequency of each amino acid separately. The correlation was significantly positive for all four charged amino acids (Arg, Asp, Glu, and Lys), negative for all hydrophobic amino acids (significant for Gly, Ile, Phe, Pro, and Val), except Met (for which the correlation was non-significantly positive), and negative for all polar amino acids (significant for Asn, Ser, Thr, Trp and Tyr), except for Gln, for which the correlation was significantly positive (
Table 1). All these correlations remained significant after controlling for multiple testing (
Table 1).
Next, we compared the amino acid composition of proteins encoded by genes that are overexpressed (
R > 0,
n = 10,728) vs. proteins encoded by genes that are repressed (
R < 0,
n = 9763) at 37 °C. Overexpressed proteins were enriched in charged amino acids (median percent in overexpressed proteins: 24.32%; median percent in repressed proteins: 23.20%; Mann-Whitney’s
U test,
p = 1.90 × 10
−66) and depleted in both polar (median percent in overexpressed proteins: 29.54%; median percent in repressed proteins: 30.04%;
p = 2.53 × 10
−20) and hydrophobic (median percent in overexpressed proteins: 45.77%; median percent in repressed proteins: 46.43%;
p = 6.56 × 10
−21) amino acids. In almost perfect agreement with our correlation analyses, proteins encoded by overexpressed genes were significantly enriched in Arg, Asp, Gln, Glu, and Lys, and significantly depleted in Asn, Gly, Ile, Phe, Pro, Ser, Thr, and Trp (
Table 2).
Similar results were obtained when using a more stringent threshold to classify genes as overexpressed (
R > 2,
n = 826) or repressed (
R < −2,
n = 1214) at 37 °C. Overexpressed proteins are enriched in charged amino acids (median percent in overexpressed proteins: 25.30%; median percent in repressed proteins: 22.54%;
p = 1.50 × 10
−26) and depleted in both polar (median percent in overexpressed proteins: 29.74%; median percent in repressed proteins: 30.17%;
p = 3.20 × 10
−8) and hydrophobic (median percent in overexpressed proteins: 45.20%; median percent in repressed proteins: 47.24%;
p = 6.04 × 10
−11) amino acids. More specifically, overexpressed proteins are significantly enriched in Arg, Asp, Gln, Glu, and Lys, and significantly depleted in Asn, Cys, Gly, His, Ile, Phe, Pro, Thr, Trp, and Tyr (
Table 3).
2.2. The Amino Acid Composition of Heat-Induced Proteins Is Not due to Covariation of Amino Acid Composition with GC Content, Gene Expression Levels, or Subcellular Location
We considered whether our results could be affected by confounding factors. First, GC content is known to affect amino acid composition [
24], and
R significantly correlates with GC content (
ρ = 0.088,
p = 9.76 × 10
−37). Combined, these correlations alone might potentially explain the observed trends. To discard this possibility, we computed partial correlations between
R and the frequency of each amino acid, while controlling for GC content, with very similar results. The correlation continued to be significantly positive for charged amino acids and significantly negative for polar and hydrophobic ones (
Table 1). More specifically, the correlation was significantly positive for Arg, Asp, Gln, Glu, and Lys and significantly negative for Asn, Gly, Ile, Phe, Pro, Ser, Thr, Trp, Tyr, and Val. Both the negative correlation between
R and Ala frequency and the positive correlation between
R and Met frequency, which were initially not significant, became significant after controlling for GC content (
Table 1).
Second, highly expressed proteins resemble proteins from thermophiles in their amino acid composition [
25], and expression levels correlate with
R (expression level at 22 °C:
ρ = −0.156,
p = 4.88 × 10
−112; expression level at 37 °C:
ρ = 0.241,
p = 1.18 × 10
−268). To discard the potential confounding effects of expression levels, we computed partial correlations between
R and the frequency of each amino acid, while controlling for expression levels, again with very similar results. When controlling for expression levels at 22 °C,
R correlated positively with the frequencies of Ala, Arg, Asp, Gln, Glu, and Lys and negatively with the frequencies of Asn, Cys, Gly, His, Ile, Leu, Phe, Pro, Ser, Thr, Trp, and Tyr. When controlling for expression levels at 37 °C,
R correlated positively with the frequencies of Arg, Asp, Cys, Gln, Glu, Leu, Lys, and Met and negatively with the frequencies of Ala, Gly, Ile, Phe, Pro, Thr, Trp, Tyr, and Val. In both cases, the positive correlations between
R and the frequency charged amino acids and the negative correlations between
R and the frequencies of polar and hydrophobic amino acids remained significant (
Table 1).
Proteins locating to different parts of the cell differ in their amino acid compositions and in their response to heat stress ([
26,
27];
Table 4). To discard subcellular location as a confounding factor, we analyzed the correlation between
R and the amino acid composition separately for proteins locating to 10 different subcellular compartments (
Table 5). The correlation between
R and the fraction of charged amino acids was positive in nine of the compartments, which represents a significant departure from the 50% expected at random (one-tailed binomial test,
p = 0.011). The correlation was significantly positive for the cytosol, the plastid (the compartments with the higher number of known/inferred proteins), and the mitochondrion. The correlation between
R and the fraction of hydrophobic amino acids was negative in eight of the compartments (one-tailed binomial test,
p = 0.055), significantly negative in the plastid and the mitochondrion, and significantly positive in the nucleus. The correlation between
R and the fraction of polar amino acids was negative in half of the compartments, and significantly negative in the cytosol and the nucleus. These results suggest that the enrichment of heat-induced proteins in charged amino acids and their depletion in hydrophobic amino acids are not a byproduct of covariation of both
R and amino acid composition with subcellular location. The lack of significance in most of the individual correlations is probably due to the low number of proteins for which location information is available, ranging from 720 for the plastid to 63 in the peroxisome (
Table 4), which is expected to greatly reduce the statistical power of our compartment-specific analyses. However, we note an exception: among nuclear proteins
R exhibits a significantly positive correlation with the percent of hydrophobic residues (
Table 5).
2.3. Proteins That Are Overexpressed at High Temperatures Are Highly Disordered
For each
Arabidopsis protein, we computed the percentage of amino acids that belong to IDRs using IUPred [
28]. This percentage correlates positively with
R (
ρ = 0.059,
p = 4.93 × 10
−17;
Figure 3). Genes that are overexpressed at 37 °C (
R > 0) encode proteins that are more disordered than those that are repressed (
R < 0), with median disorder percent of 19.19% and 16.51% for induced and repressed genes, respectively (Mann-Whitney’s
U test,
p = 2.01 × 10
−35). The differences are more solid when comparing genes that are strongly overexpressed at 37 °C (
R > 2) vs. those that are strongly repressed (
R < −2), with percentages of median disorder of 21.54% and 11.51% for induced and repressed genes, respectively (Mann-Whitney’s
U test,
P = 2.03 × 10
−23).
In agreement with previous works [
29,
30], we found a positive correlation between GC content and the percent of disordered residues (
ρ = 0.044,
p = 2.84 × 10
−10). In addition, GC content positively correlates with
R (
ρ = 0.088,
p = 9.76 × 10
−37), making it possible that the positive correlation between
R and disorder might be due to the covariation of both parameters with GC content. The correlation between
R and disorder, however, is significant, even after controlling for GC content (
ρ = 0.055,
p = 3.44 × 10
−15).
Likewise, intrinsic disorder positively correlates with expression levels (at 22 °C:
ρ = 0.040,
p = 1.03 × 10
−8; and at 37 °C:
ρ = 0.072,
p = 7.75 × 10
−25), in agreement with previous results in
Escherichia coli [
31], but in contrast with observations in yeasts [
32,
33]. Disorder, however, significantly correlates with
R after controlling for expression levels (at 22 °C:
ρ = 0.066,
p = 4.64 × 10
−21; and at 37 °C:
ρ = 0.043,
p = 1.03 × 10
−9).
Both intrinsic disorder and
R substantially vary among proteins locating to different subcellular compartments (
Table 4), thus raising the possibility that covariation of both factors with subcellular location may account for the observed enrichment of stress-induced proteins in IDRs. We analyzed the correlation between intrinsic disorder and
R separately for proteins locating to 10 different subcellular compartments. The correlation was positive for eight of the tissues (significantly positive for the cytosol, endoplasmic reticulum, and the vacuole) and significantly negative for the nucleus and the plasma membrane (
Table 5). These results indicate that the positive correlation between disorder and
R, while generalized, does not apply to proteins locating to all compartments.


 ,
, 


