3.1. On the presence of two copper species
The first step on the understanding of the reaction mechanism is the knowledge of the number and the kind of species present in reaction ambient. To answer to this question we have coupled UV-Vis and EPR spectroscopy on the whole set of catalysts.
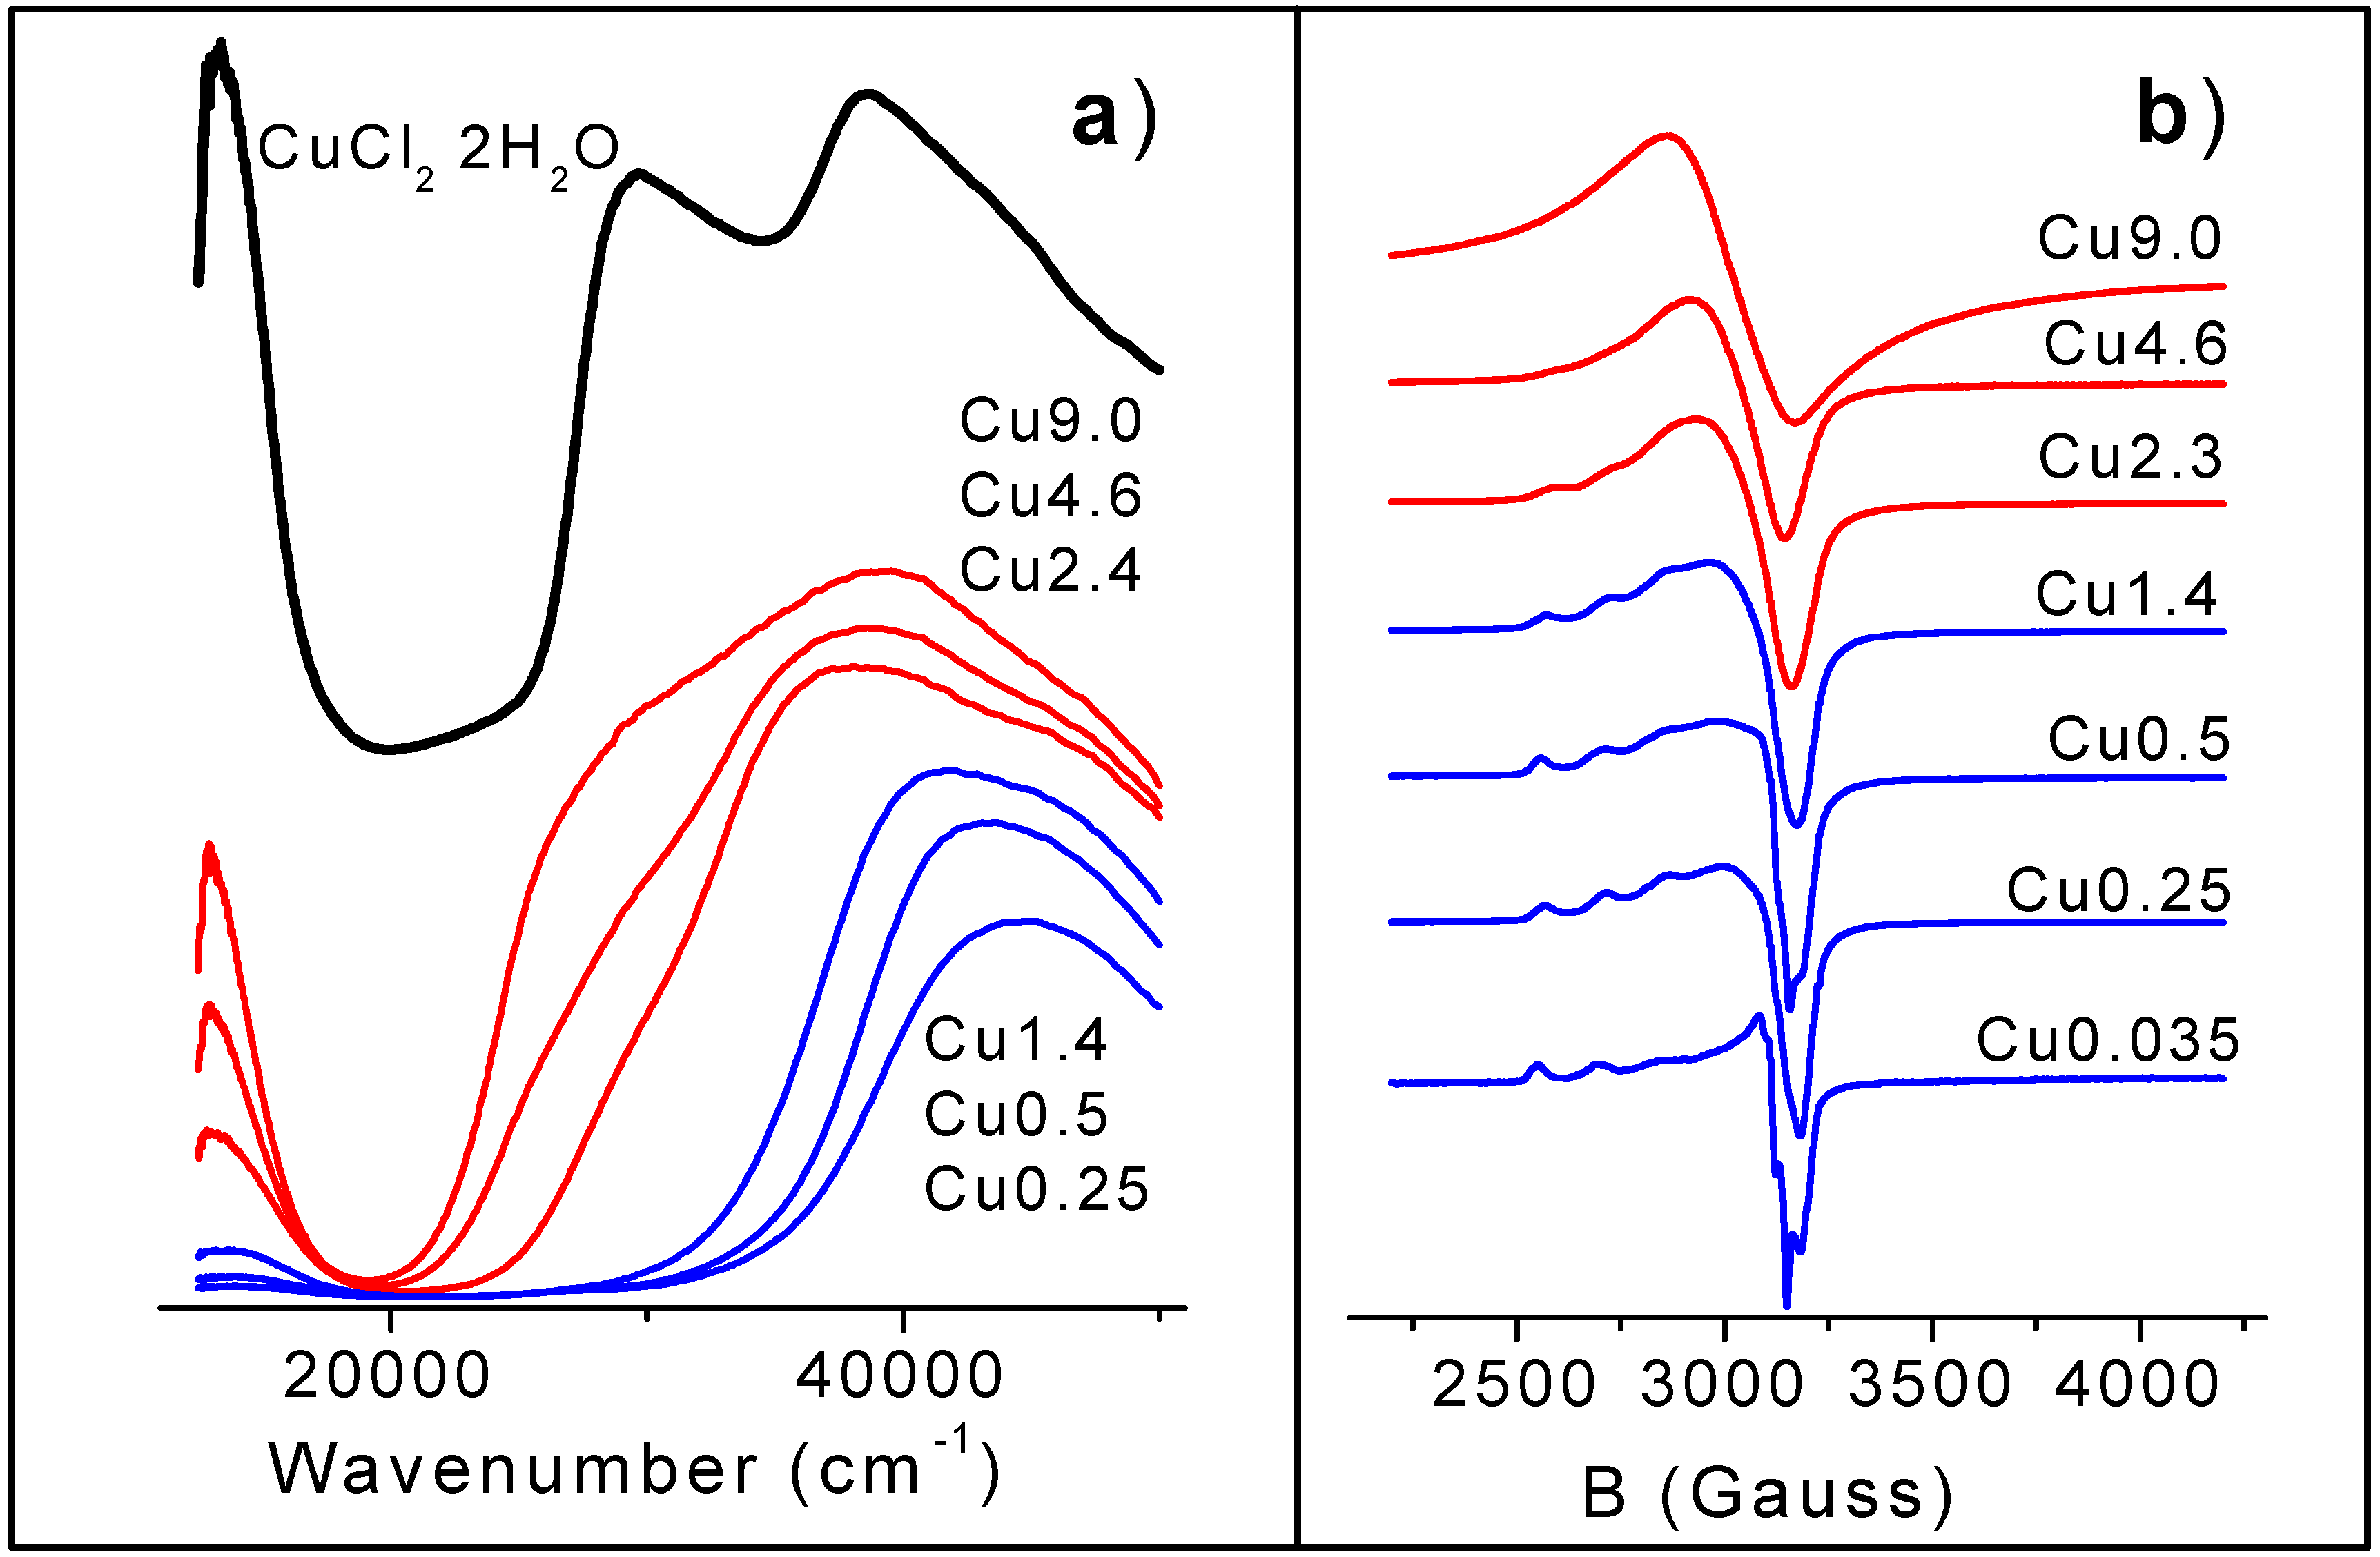
The UV-Vis range reported in
Figure 2a can be divided into two parts: 10000-22000 cm
−1 and 22000-50000 cm
−1. In the first range, a
d-d band with a maximum at about 13000 cm
−1, characteristic of Cu(II) ions in octahedral complexes [
36], is observed. In the second range, a wide and complex absorption with a charge transfer (CT) character is found. This absorption is fully located in the UV part of the spectra for low copper loaded samples (blue spectra). For high Cu concentrated samples (red spectra) it covers the visible part also. The intensity of the
d-d transition increases with Cu content, but the trend is far to be linear, showing a sharp increase between 1.4 and 2.3 wt% Cu. This behavior can be attributed to an abrupt change in the ligand sphere [
24]. In the CT region only one band is observed on samples with low Cu loading, in the 40000-43000 cm
−1 range (samples Cu0.25 - Cu1.4), typical of Cu
2+O
2-→ Cu
+O
− CT. While samples with Cu concentration higher than 2.3 wt%, show a new CT band with maximum in the 28000-31000 cm
−1 range (typical of Cu
2+Cl
−→ Cu
+Cl CT), which develops progressively as copper concentration increases. It is worth underlining that the simultaneous presence on high Cu loaded samples of both CT bands, indicates the co-presence of two different Cu(II) species. The comparison of the results concerning the
d-d and CT regions suggests that the first shell ligands of Cu(II) species present in the 0.25-1.4 wt.% samples and those formed starting form Cu2.5 sample are different. The species present at low Cu concentration are characterized by an high frequency (40000-43000 cm
−1) CT transition and by a low intensity
d-d band typical of an octahedral species containing chemically equivalent ligands. The species dominating at high Cu concentration show an additional low frequency (28000-31000 cm
−1) CT transition and a high intensity
d-d band. Similar features characterize the UV-Vis spectrum of CuCl
2.2H
2O (black curve in
Fig. 2a).
Figure 2.
Part (a) UV-Vis DRS spectra of from top to bottom: CuCl2·H2O (black), Cu9.0, Cu4.6, Cu2.3 (red) Cu1.4, Cu0.5 and Cu0.25 (blue). Part (b): LNT EPR spectra of all samples. Cu content increases, from bottom to top. The amplitude of the EPR signal of all samples has been multiplied by different factors for graphical reasons.
A further proof of the existence of two kinds of copper species arises from the study of the progressive evolution of the EPR signal (
Figure 2b), as a function of the Cu loading. Even from a superficial investigation, it is evident that spectra of low loaded samples are typical of Cu(II) ions in axial symmetry (g
xx = g
yy ≡ g
⊥ and g
zz ≡ g
//) [
5,
6,
7,
8,
9,
10]. For samples Cu0.25, Cu0.5 and Cu1.4, the splitting into quartets, due the hyperfine interaction between the unpaired electron and the copper nucleus (both
63Cu and
65Cu nuclei have a 3/2 nuclear spin [
37]), is clearly visible only in the parallel component, while the perpendicular one exhibits only shoulders (samples Cu0.25, Cu0.5) or is completely unresolved (sample Cu1.4). Moving to high loaded samples, any vestige of the hyperfine structure is progressively lost, being totally absent for Cu9.0. This sample exhibits a broad EPR spectrum with a slope typical of an isotropic g tensor (g
xx = g
yy = g
zz ≡ g
iso) [
5,
6,
7,
8,
9,
10]. We can so conclude that, in agreement with the EPR data reported in the literature, we have observed (upon increasing the copper loading) the progressive overshadowing of the axial signal observed on low Cu concentrated samples by a broad EPR signal attributed to a different family of Cu(II) species probing either a symmetrical magnetic environment or a strongly broadened one, again with axial symmetry. A systematic simulations of the whole set of spectra is in progress.
On the basis of EXAFS (vide 3.5 section) and solubility measures, not reported for brevity, the two species have been ascribed to a superficial Cu aluminate, where the Cupric cations are located on superficial vacancies of alumina, and an extremely dispersed phase of CuCl
2 [
24,
25]. The former is the only species present at low load of Cu and the latter start to be present after the complete saturation of γ-alumina surface sites at about at 1.6 wt%.
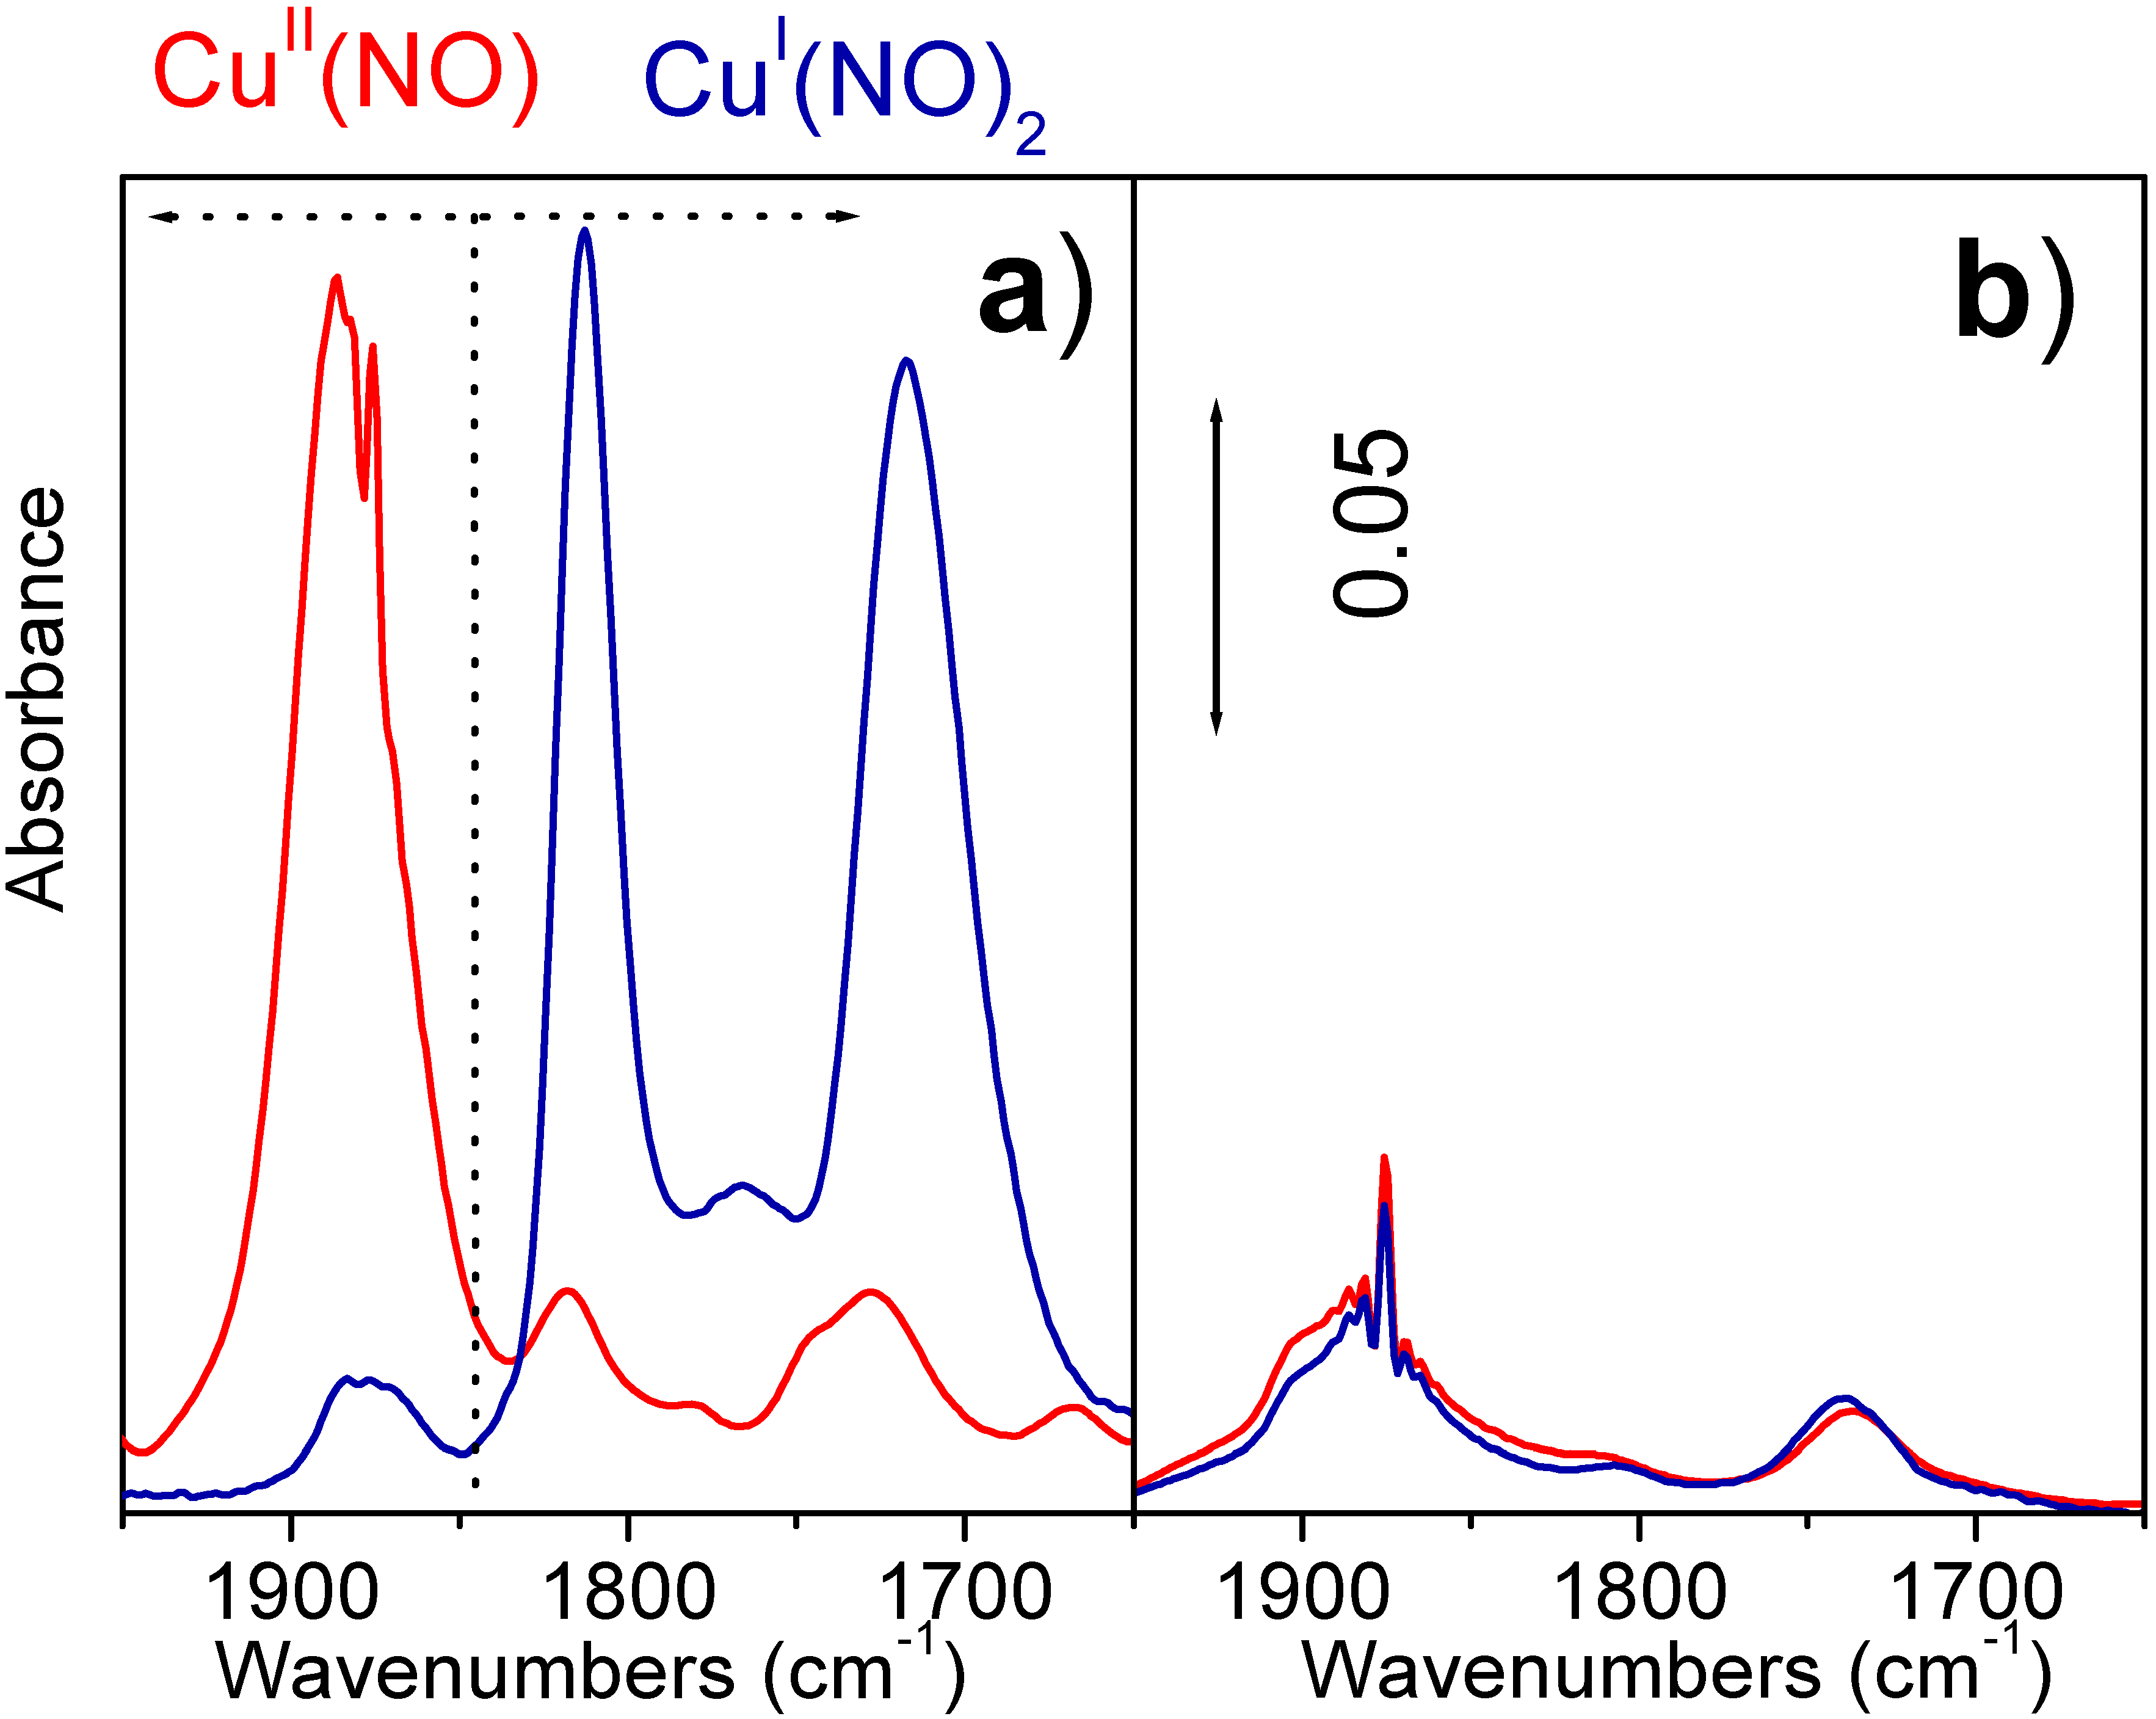
3.3. Determination of the active phase
Hypothesis (3-5) holds only if cupric chloride is the active phase. To demonstrate this thesis ethylene has been feed at 500 K on Cu0.25 and Cu5.0 and catalysts, the former contains only the Cu aluminate phase, the latter containing CuCl
2 also. The effect of this treatment has been monitored on both catalysts by IR spectroscopy of NO dosed at LNT, which is able to discriminate between Cu
2+ and Cu
+ species [
31].
On sample Cu5.0 (
Figure 3a) before interaction with ethylene (red line in
Figure 3a) a single component at 1885 cm
−1 strongly characterize the spectrum, this band from literature data is ascribed to Cu(II)…NO complexes [
31]. The exposure of sample to ethylene causes a remarkable decrease of cupric cations detected by NO adsorption (blue line in
Figure 3a) and the appearance of a new doublet at 1813 and 1717 cm
−1 ascribed to a Cu(I)…(NO)
2 complex. This spectroscopic features are attributed to the reduction of CuCl
2 phase, following the reaction (3), owing to the fact that sample Cu0.25 (containing only the Cu aluminate phase) shows an IR spectrum insensitive to the interaction with C
2H
4 (
Figure 3b).
Figure 3.
Part (a): IR spectra of NO on Cu5.0 before and after interaction with ethylene at 500 K red and blue curves respectively. Part (b) as part (a) for Cu0.25 catalyst.
Figure 3.
Part (a): IR spectra of NO on Cu5.0 before and after interaction with ethylene at 500 K red and blue curves respectively. Part (b) as part (a) for Cu0.25 catalyst.
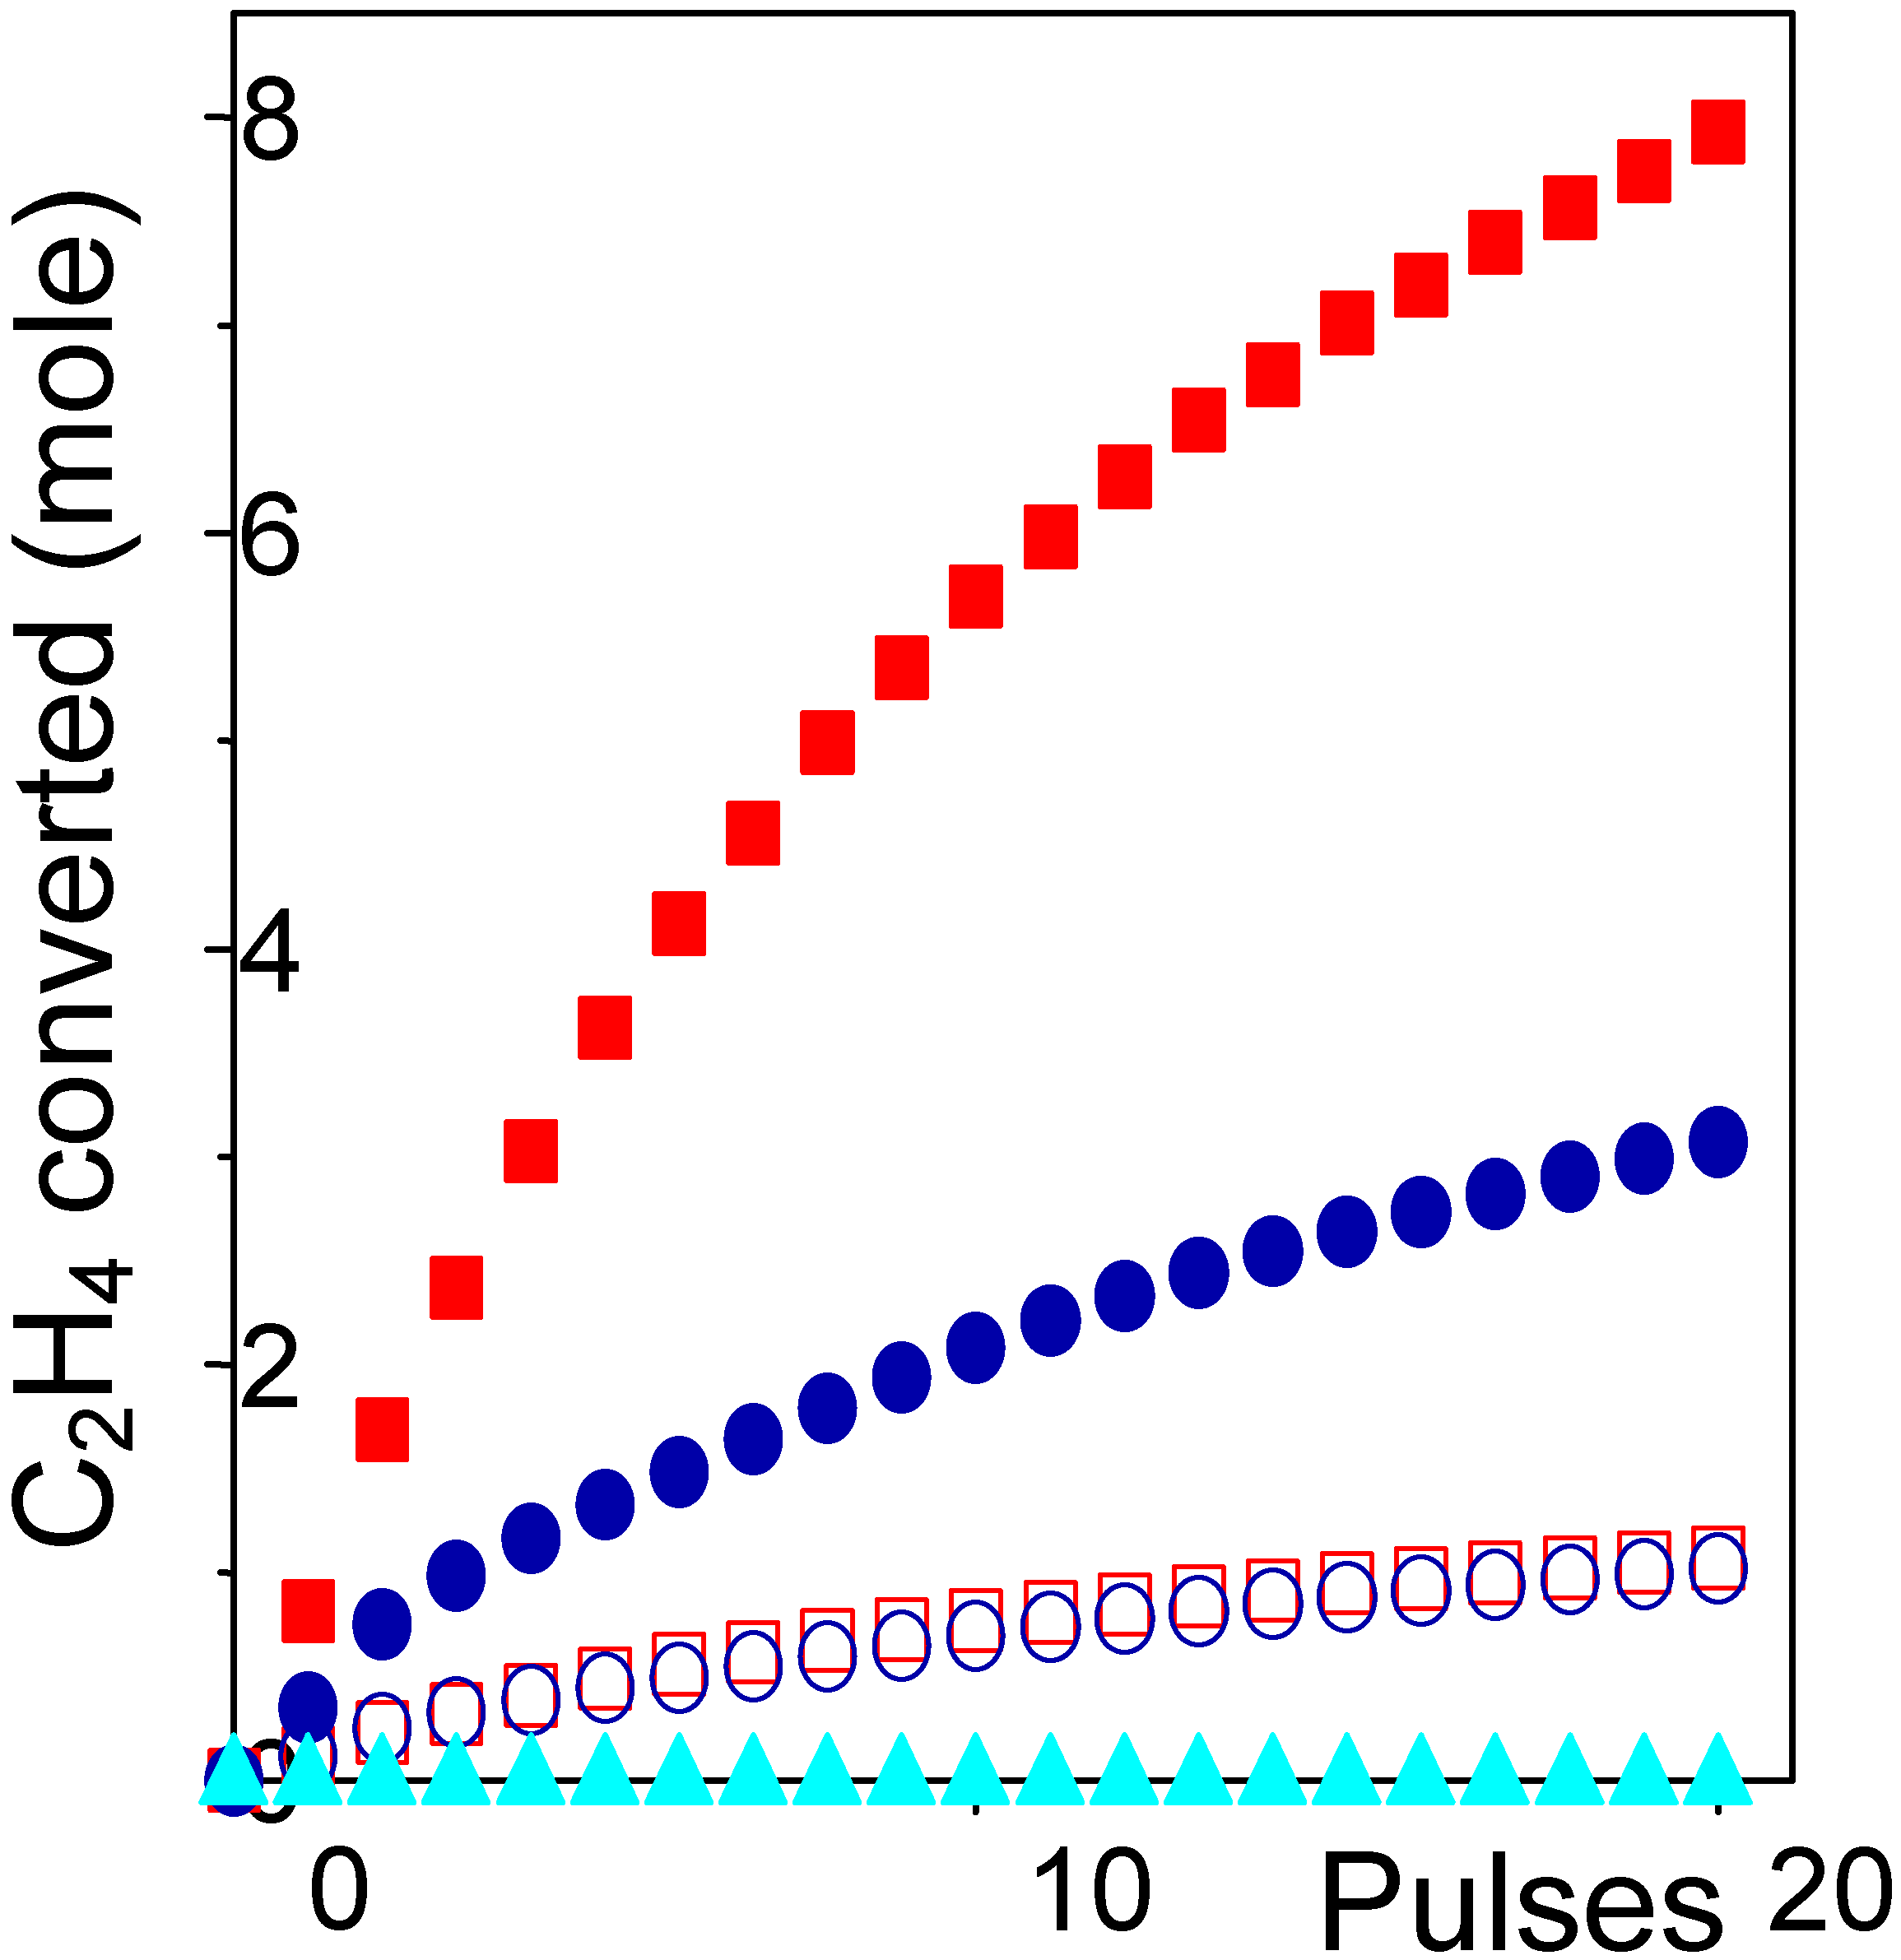
The definitive evidence that CuCl
2 is the only active phase is given by depletion tests, where ethylene is sent on the sample in absence of O
2 and HCl reactants. In such a way the only chlorine source, available for the C
2H
4 conversion into C
2H
4Cl
2, is on the catalyst itself. The ethylene conversion obtained on Cu9.0, Cu4.6 and Cu1.4 catalysts are reported in
Figure 4 (full symbols) as a function of the number of pulses. We observe that only high loaded catalysts are active, while Cu1.4 catalyst has a null activity. The activity per pulse of both Cu9.0 and Cu4.6 is reduced by increasing the number of pulses due to the progressive consumption of chlorine. It is worth noticing that the increment of conversion measured by moving from Cu4.6 to Cu9.0 catalyst is higher than directly proportional to the increment of copper. This can be explained by the fact that the fraction of Cu forming the surface aluminate is inactive: this means that the fraction of active copper species in samples Cu4.6 to Cu9.0 is only 3.1 and 7.5 wt% Cu respectively. By re-plotting the activity curves of samples Cu4.6 to Cu9.0, renormalized by factors 1/3.1 and 1/7.5, we see that they overlaps rather well, see
Figure 4 (open symbols), giving a further proofs of the validity of our hypothesis.
In
section 3.4 we will show that the catalysts exhibit a very high dispersion of the active phase, while in
section 3.5 we will prove that the reduction (3) holds for all the CuCl
2 phase (both surface and bulk sites).
Figure 4.
Ethylene conversion to 1,2-dichloroethane versus the number of pulses on 9.0, 4.6 and 1.4 wt% samples: (
![Ijms 02 00230 i001]()
,
![Ijms 02 00230 i002]()
and
![Ijms 02 00230 i003]()
symbols respectively). Open symbols
![Ijms 02 00230 i004]()
Πand
![Ijms 02 00230 i005]()
refers to 9.0 and 4.6 wt% loaded samples normalized by “active” Cu concentration, see text.
3.4. Quantitative determination of surface copper sites by CO chemisorption
With the aim to quantify the amount of surface active copper sites on Cu9.0 and Cu 4.6 catalysts we have performed chemisorption measurements. Due to the strong affinity of carbon monoxide with Cu(I) sites [
27,
31,
44,
45], CO has been chosen as molecule to be used in chemisorption experiments. As a consequence, chemisorption measurements have been performed on the catalysts before reduction in ethylene, see equation (3). The validity of reaction (3) will be demonstrated in
section 3.5.
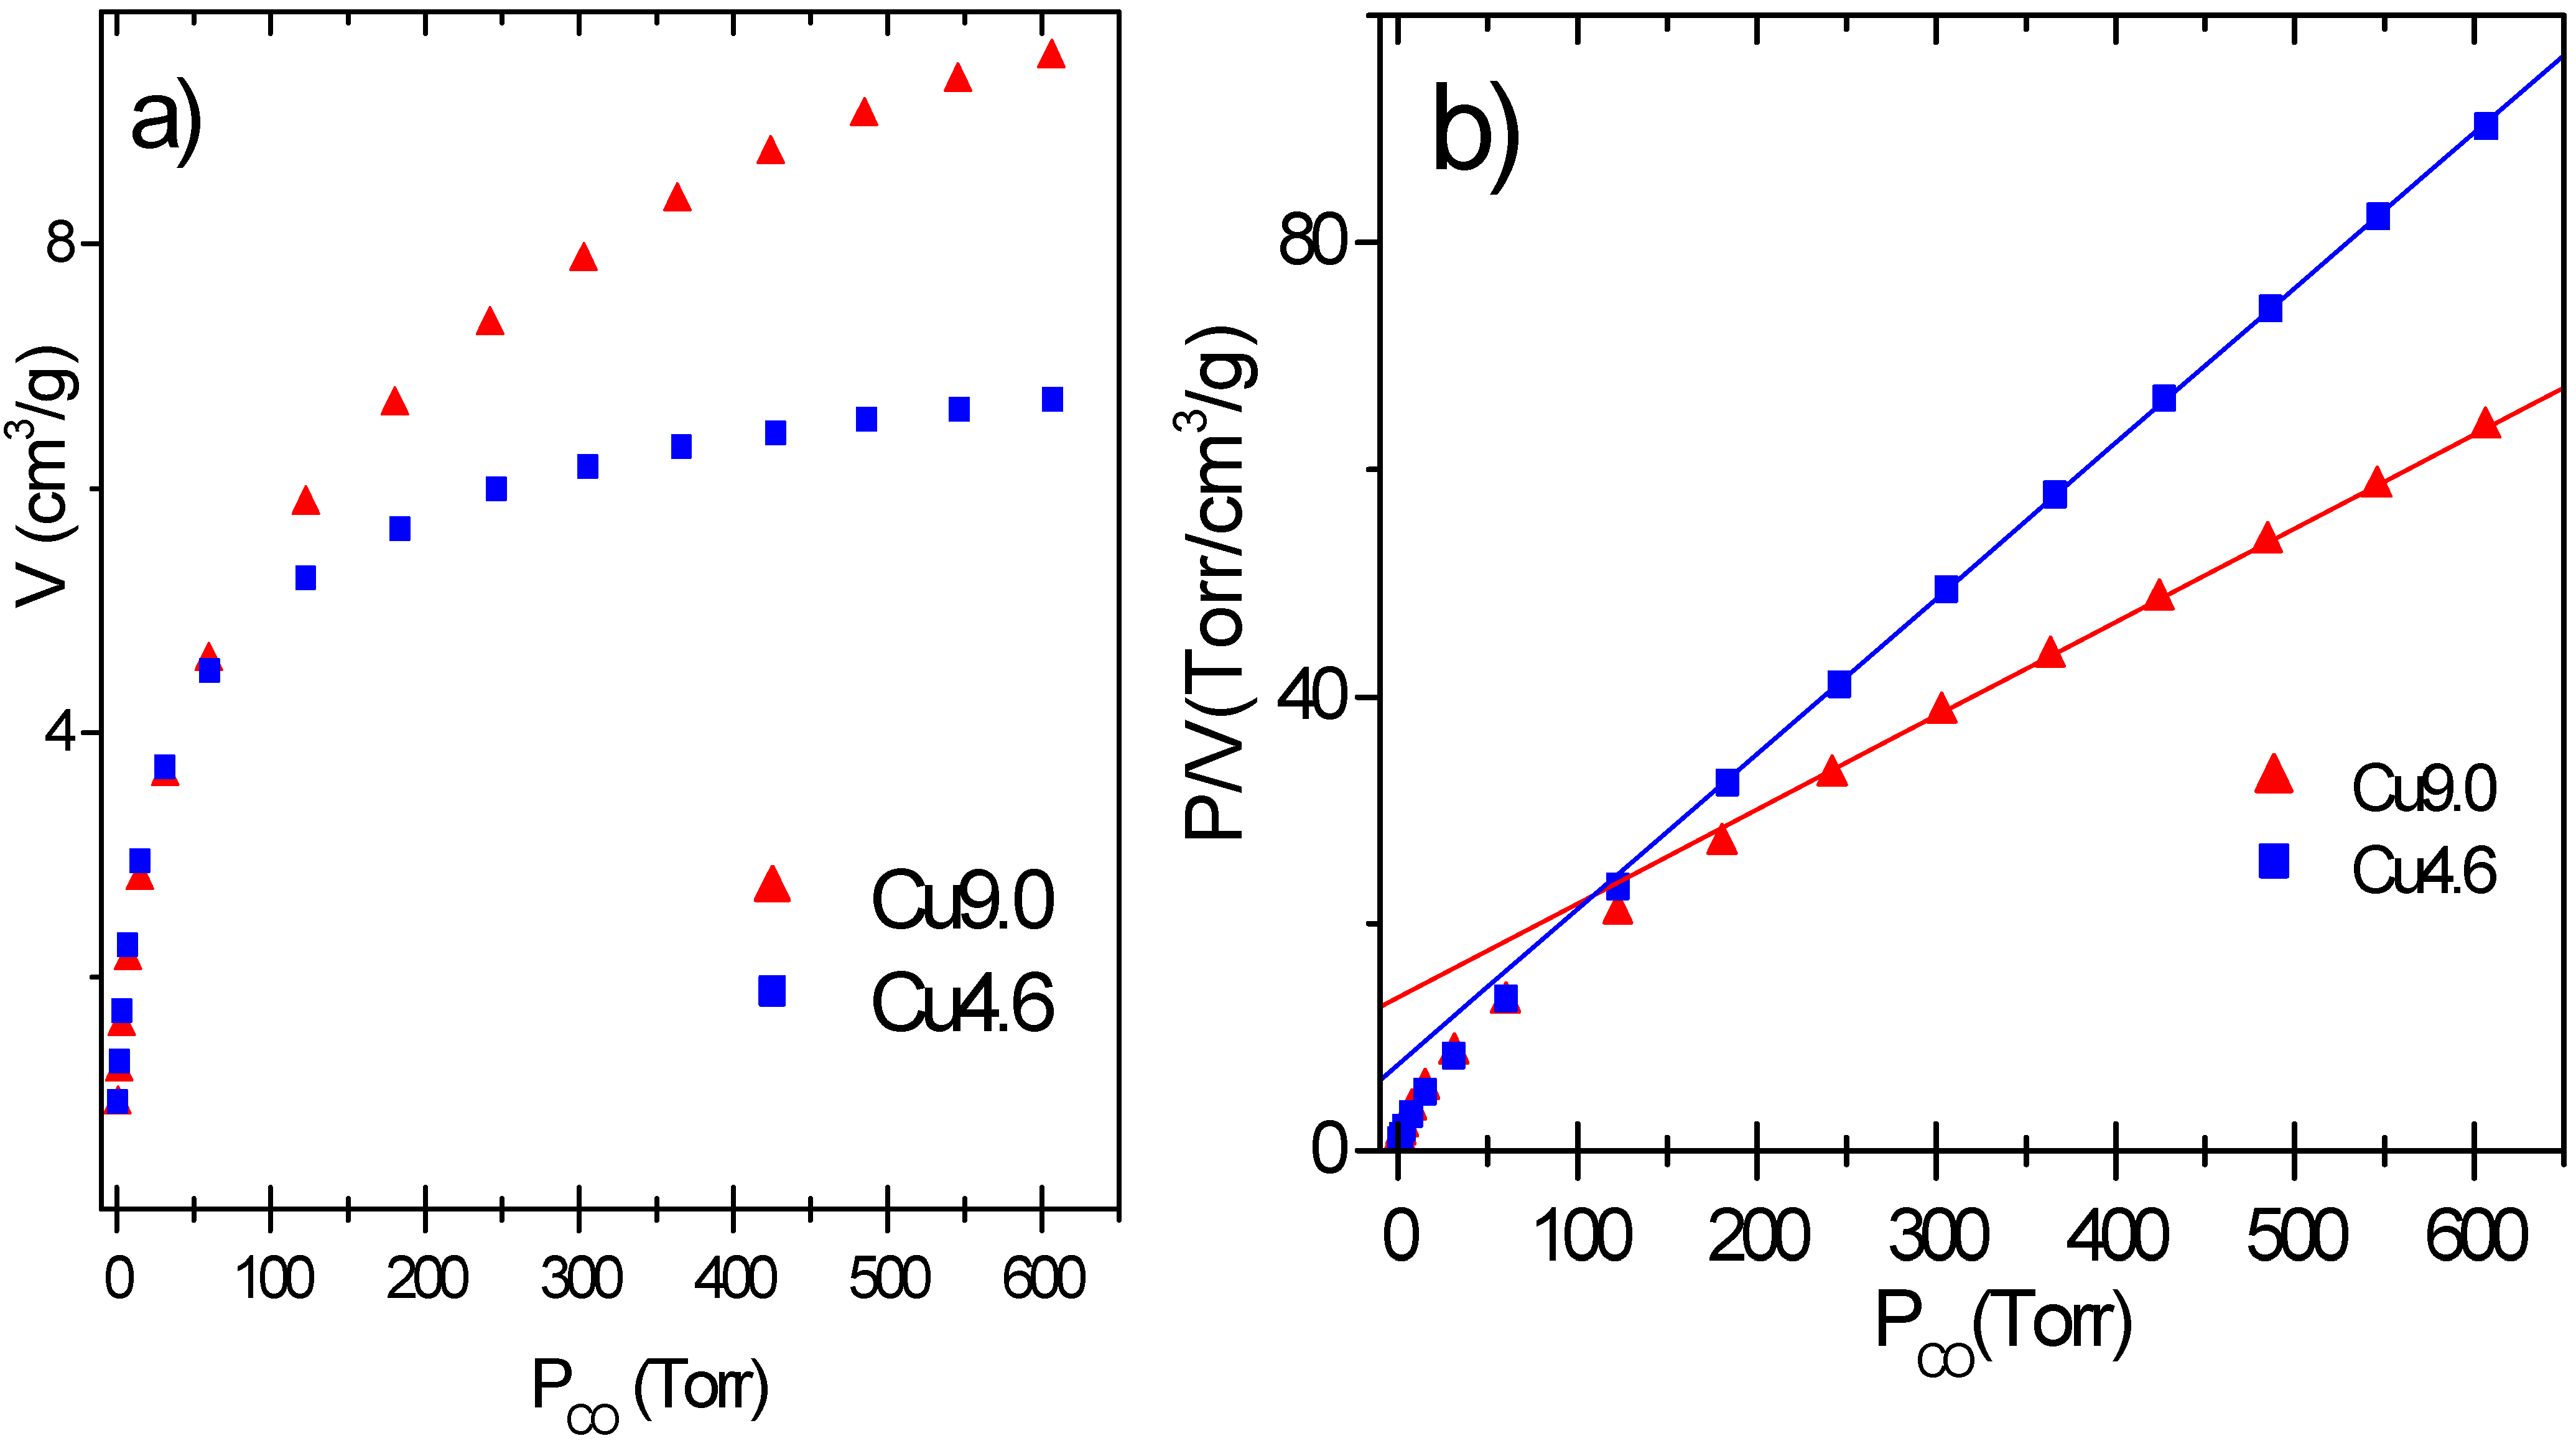
The adsorption isotherms of samples Cu9.0 and Cu 4.6 are reported in
Figure 5a. The amount of physisorbed CO per unit surface area has been estimated to be 0.00275 cm
3 m
−2, on the basis of chemisorption measurements performed on the bare Al
2O
3 support [
27]. The absorption due to Cu(I)…CO adduct has thus been obtained by subtracting from the total absorption the contribution of physisorption: 0.00275 cm
3 m
−2 multiplied by the surface area of the sample. The curves reported in
Figure 5a represent the corrected isotherms obtained on catalysts Cu9.0 and Cu4.6.
The isotherms show a slow increase of adsorbed volume with pressure. This does not allow to evaluate the adsorption volume correspondent to θ = 1 by the usually adopted back extrapolation to 0 pressure and makes necessary to analyze the isotherms with a proper model of the adsorption process [
27,
47]. The Langmuir equation, has given reliable results (
Figure 5b) and was thus adopted to process the experimental data. The equation is able to linearize the data from 80-150 to 600 Torr for all catalysts. On these samples, having a large surface heterogeneity as probed by IR experiments [
27], CO occupies first the sites able to give a stronger interaction (low P
CO down deviation of the experimental data), while at higher pressure CO covers progressively the weaker and more uniform sites. In conclusion the volume of adsorbed CO correspondent to θ = 1 (hereinafter V
m) can be evaluated by linearizing the adsorption isotherm with the Langmuir equation in the 150–600 Torr range. The knowledge of Vm allows to calculate the number of Cu(I) ions exposed to the surface (Cu(I)
s), then the dispersion (D):
where Cu(I)
tot represents the number of the Cu(I) ions in the sample. A further evaluation leads to the estimation of the surface area of CuCl (S
CuCl):
where a
CuCl (11.64 Å
2 as estimated from the chemical density ρ
CuCl) is the average area per Cu(I) at the surface of CuCl.
Table 1 summarizes the results obtained on Cu9.0 and Cu4.6 catalysts. Both samples exhibit a high dispersion (0.455, 0.381). Even higher D values (0.715 and 0.468) are obtained by dividing Cu(I)
s by the fraction of copper in the CuCl phase, which is the only one contributing significantly to the chemisorption process. These results quantify the very high Cu dispersion.
Figure 5.
Part a: volumetric data of CO adsorbed at RT on Cu9.0 and Cu4.6 catalysts previously reduced with ethylene at 500 K. Part b: Corresponding Langmuir plots.
Figure 5.
Part a: volumetric data of CO adsorbed at RT on Cu9.0 and Cu4.6 catalysts previously reduced with ethylene at 500 K. Part b: Corresponding Langmuir plots.
Table 1.
Volume of CO adsorbed at 308 K and 500 Torr and results of static-volumetric measurements of CO adsorption on CuCl2/γ-Al2O3 catalysts after reduction in ethylene at 500 K.
Table 1.
Volume of CO adsorbed at 308 K and 500 Torr and results of static-volumetric measurements of CO adsorption on CuCl2/γ-Al2O3 catalysts after reduction in ethylene at 500 K.
| Sample | Adsorbed volume cm3g−1 | Surface area m2g−1 | Adsorbed volume cm3m−2 | Vm cm3g−1 | D | SCuCl m2g−1 |
| Cu4.6 | 6.83 | 161 | 0.0424 | 7.4 | 0.455 | 23.1 |
| Cu9.0 | 9.38 | 142 | 0.0660 | 12.1 | 0.381 | 37.9 |
3.5. Spectroscopic demonstration of the hypothesized reaction steps
In order to demonstrate the reaction path (3-5), the oxidation and the coordination state of the Cu species present on catalyst have been followed during the successively feeding the three reagent, with EPR, XANES and EXAFS techniques.
Being the electronic configuration of Cu(I) and Cu(II) ions d
10 and d
9 respectively, only the latter is involved in EPR spectroscopy and thus the integrated value of EPR signal can be considered proportional, as a first approximation, to the amount of isolated Cu(II) [
46,
48].
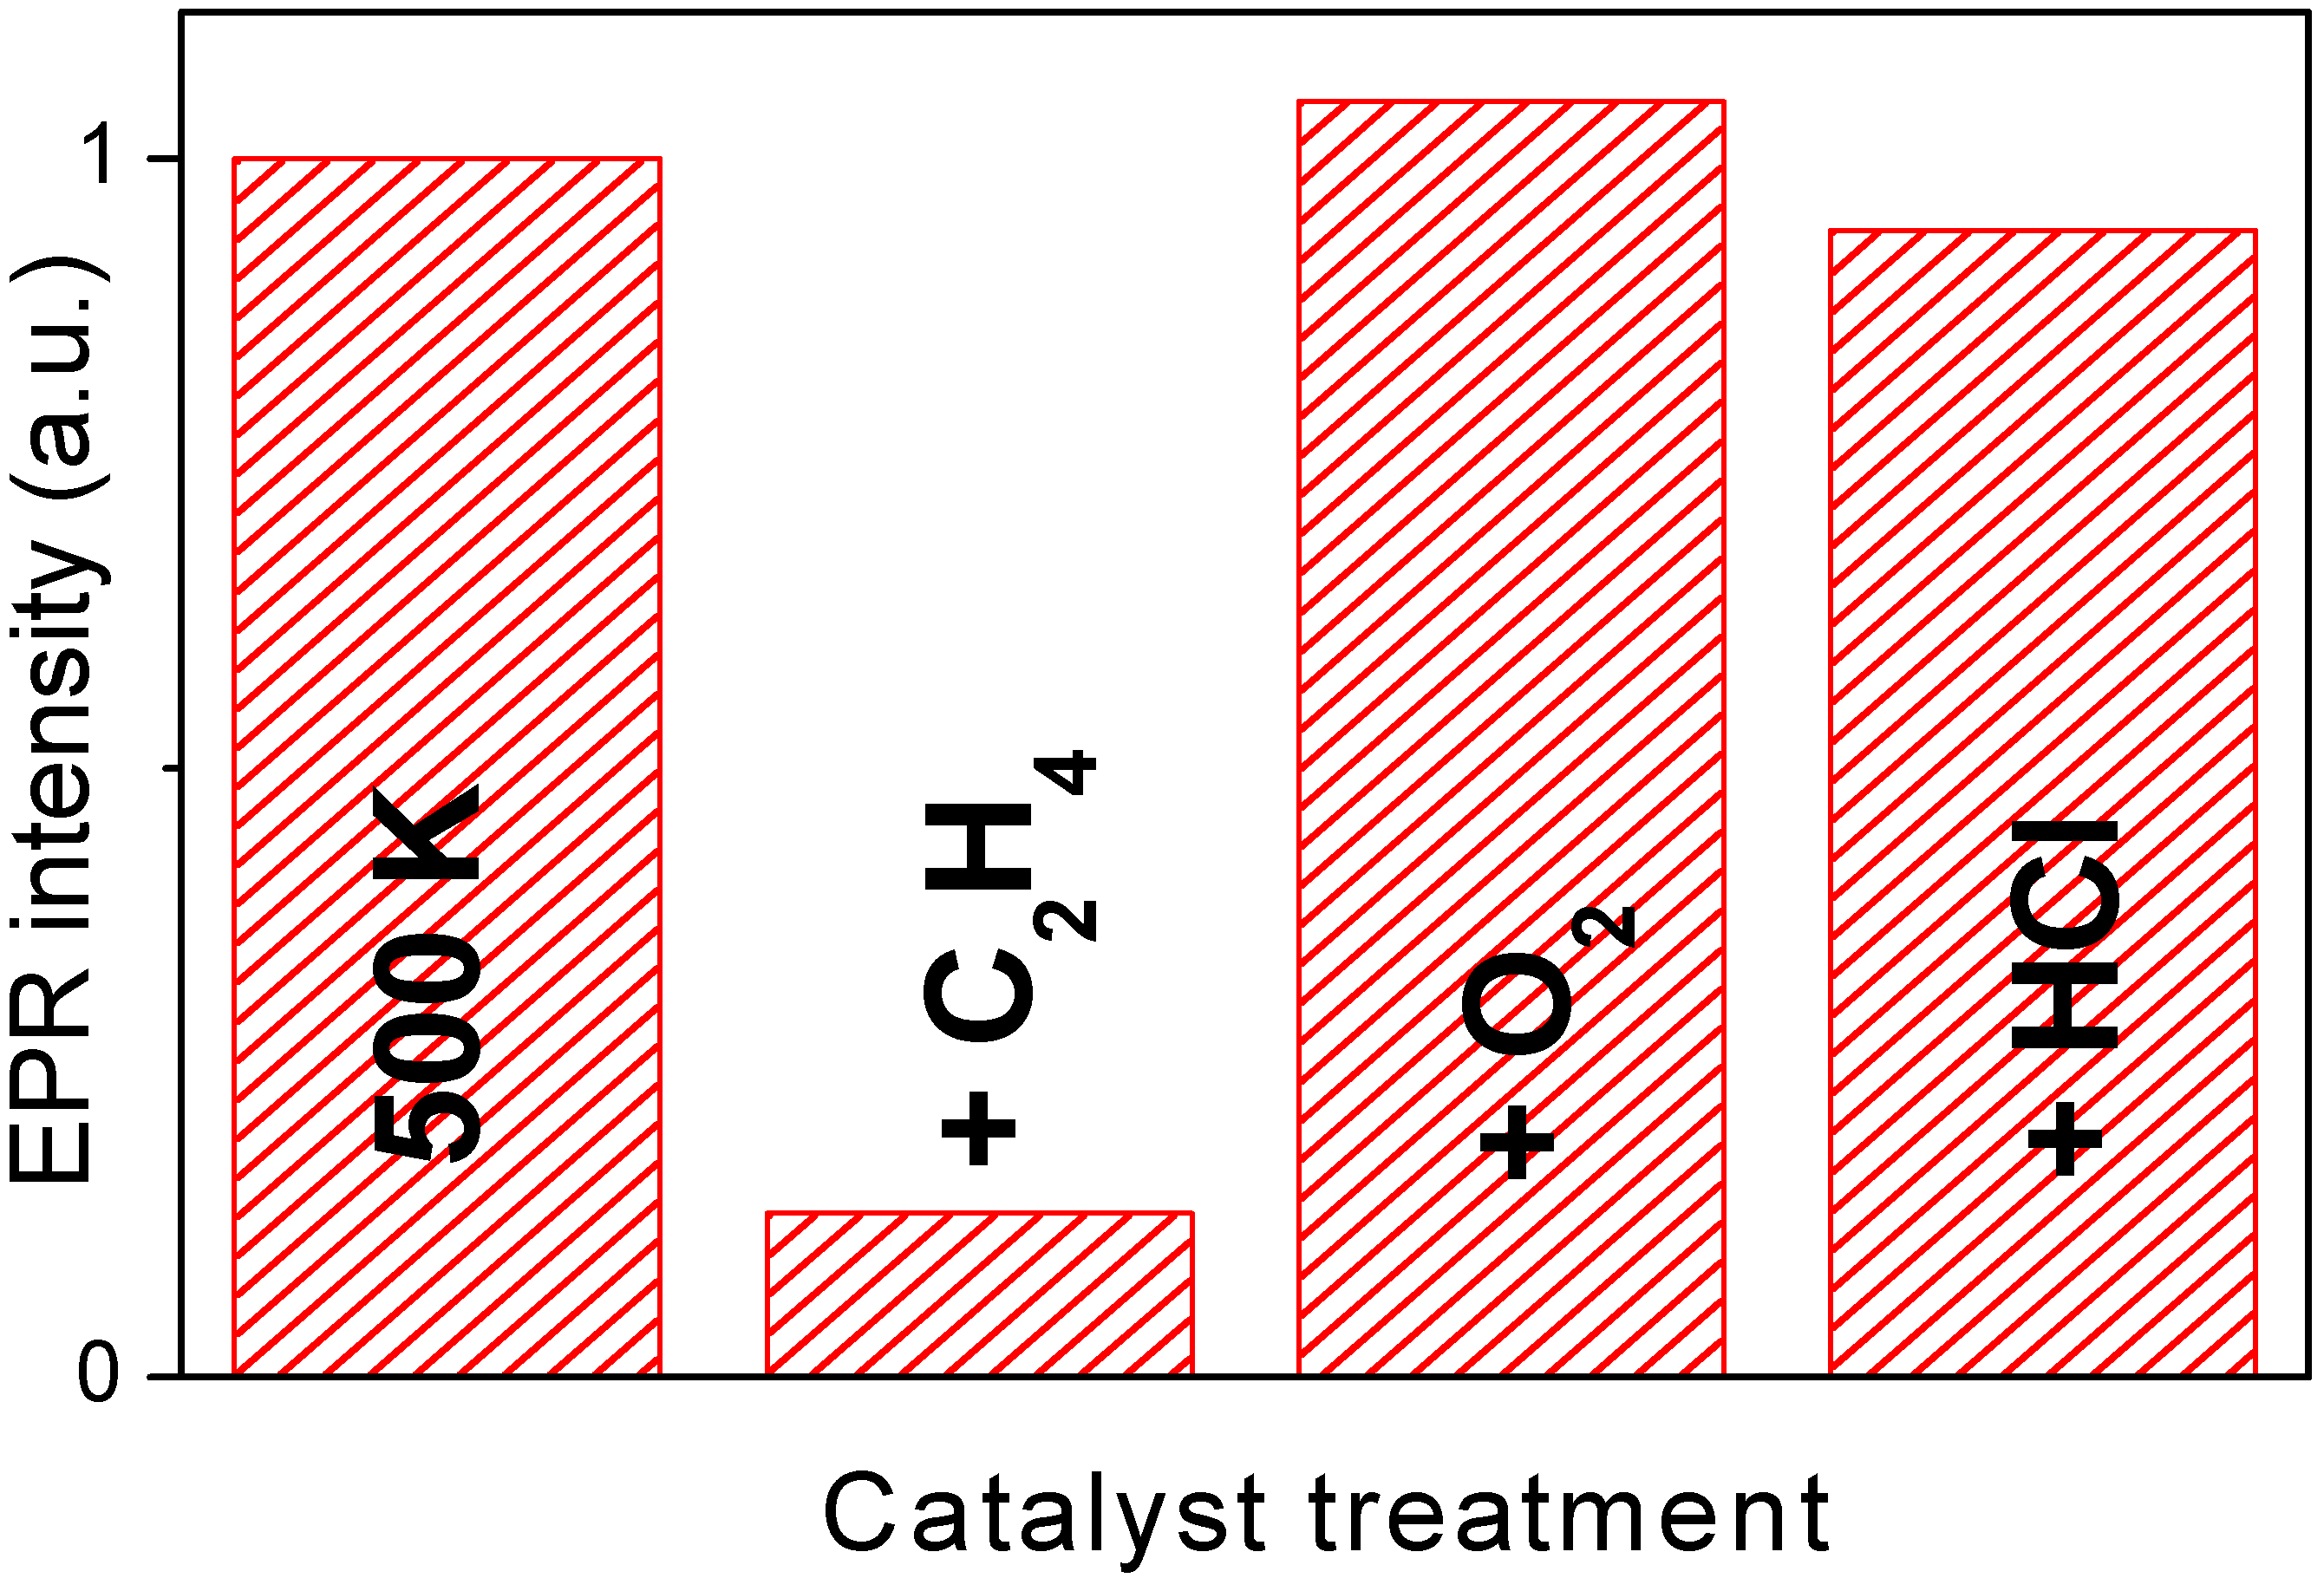
Figure 6 reports the integrated area of the EPR signal measured on catalyst Cu7.5 after activation at 500 K and along the catalytic path foreseen by equations (3-5). The integrated value obtained from the first spectrum has been arbitrarily set to 1.0. The evolution of the integrated EPR signal can be summarized as follows: (i) interaction with ethylene causes a strong decrement; (ii) interaction with O
2 yields to a value even higher than the original one; (iii) finally, interaction with HCl, bring back the signal to a value very close to the original one.
Figure 6.
Integrated signal extracted from the EPR spectra collected at 77 K on Cu5.0 catalyst along the catalytic path. Sample activated at RT, at 500 K and after interaction with C2H4, O2 and HCl. The value obtained on the catalyst activated at RT has been arbitrarily set to 1.0.
Figure 6.
Integrated signal extracted from the EPR spectra collected at 77 K on Cu5.0 catalyst along the catalytic path. Sample activated at RT, at 500 K and after interaction with C2H4, O2 and HCl. The value obtained on the catalyst activated at RT has been arbitrarily set to 1.0.
As extensively discussed by
Leofanti et al. [
27], XANES spectroscopy is sensitive to both oxidation and coordination states of Cu. The position of the Cu k-edge is mainly determined by the oxidation state of copper, occurring for Cu(I) species at 4-6 eV below that measured for Cu(II) species. A variation of the coordination sphere results in a less relevant edge shift and in a consistent modification of the near edge structures.
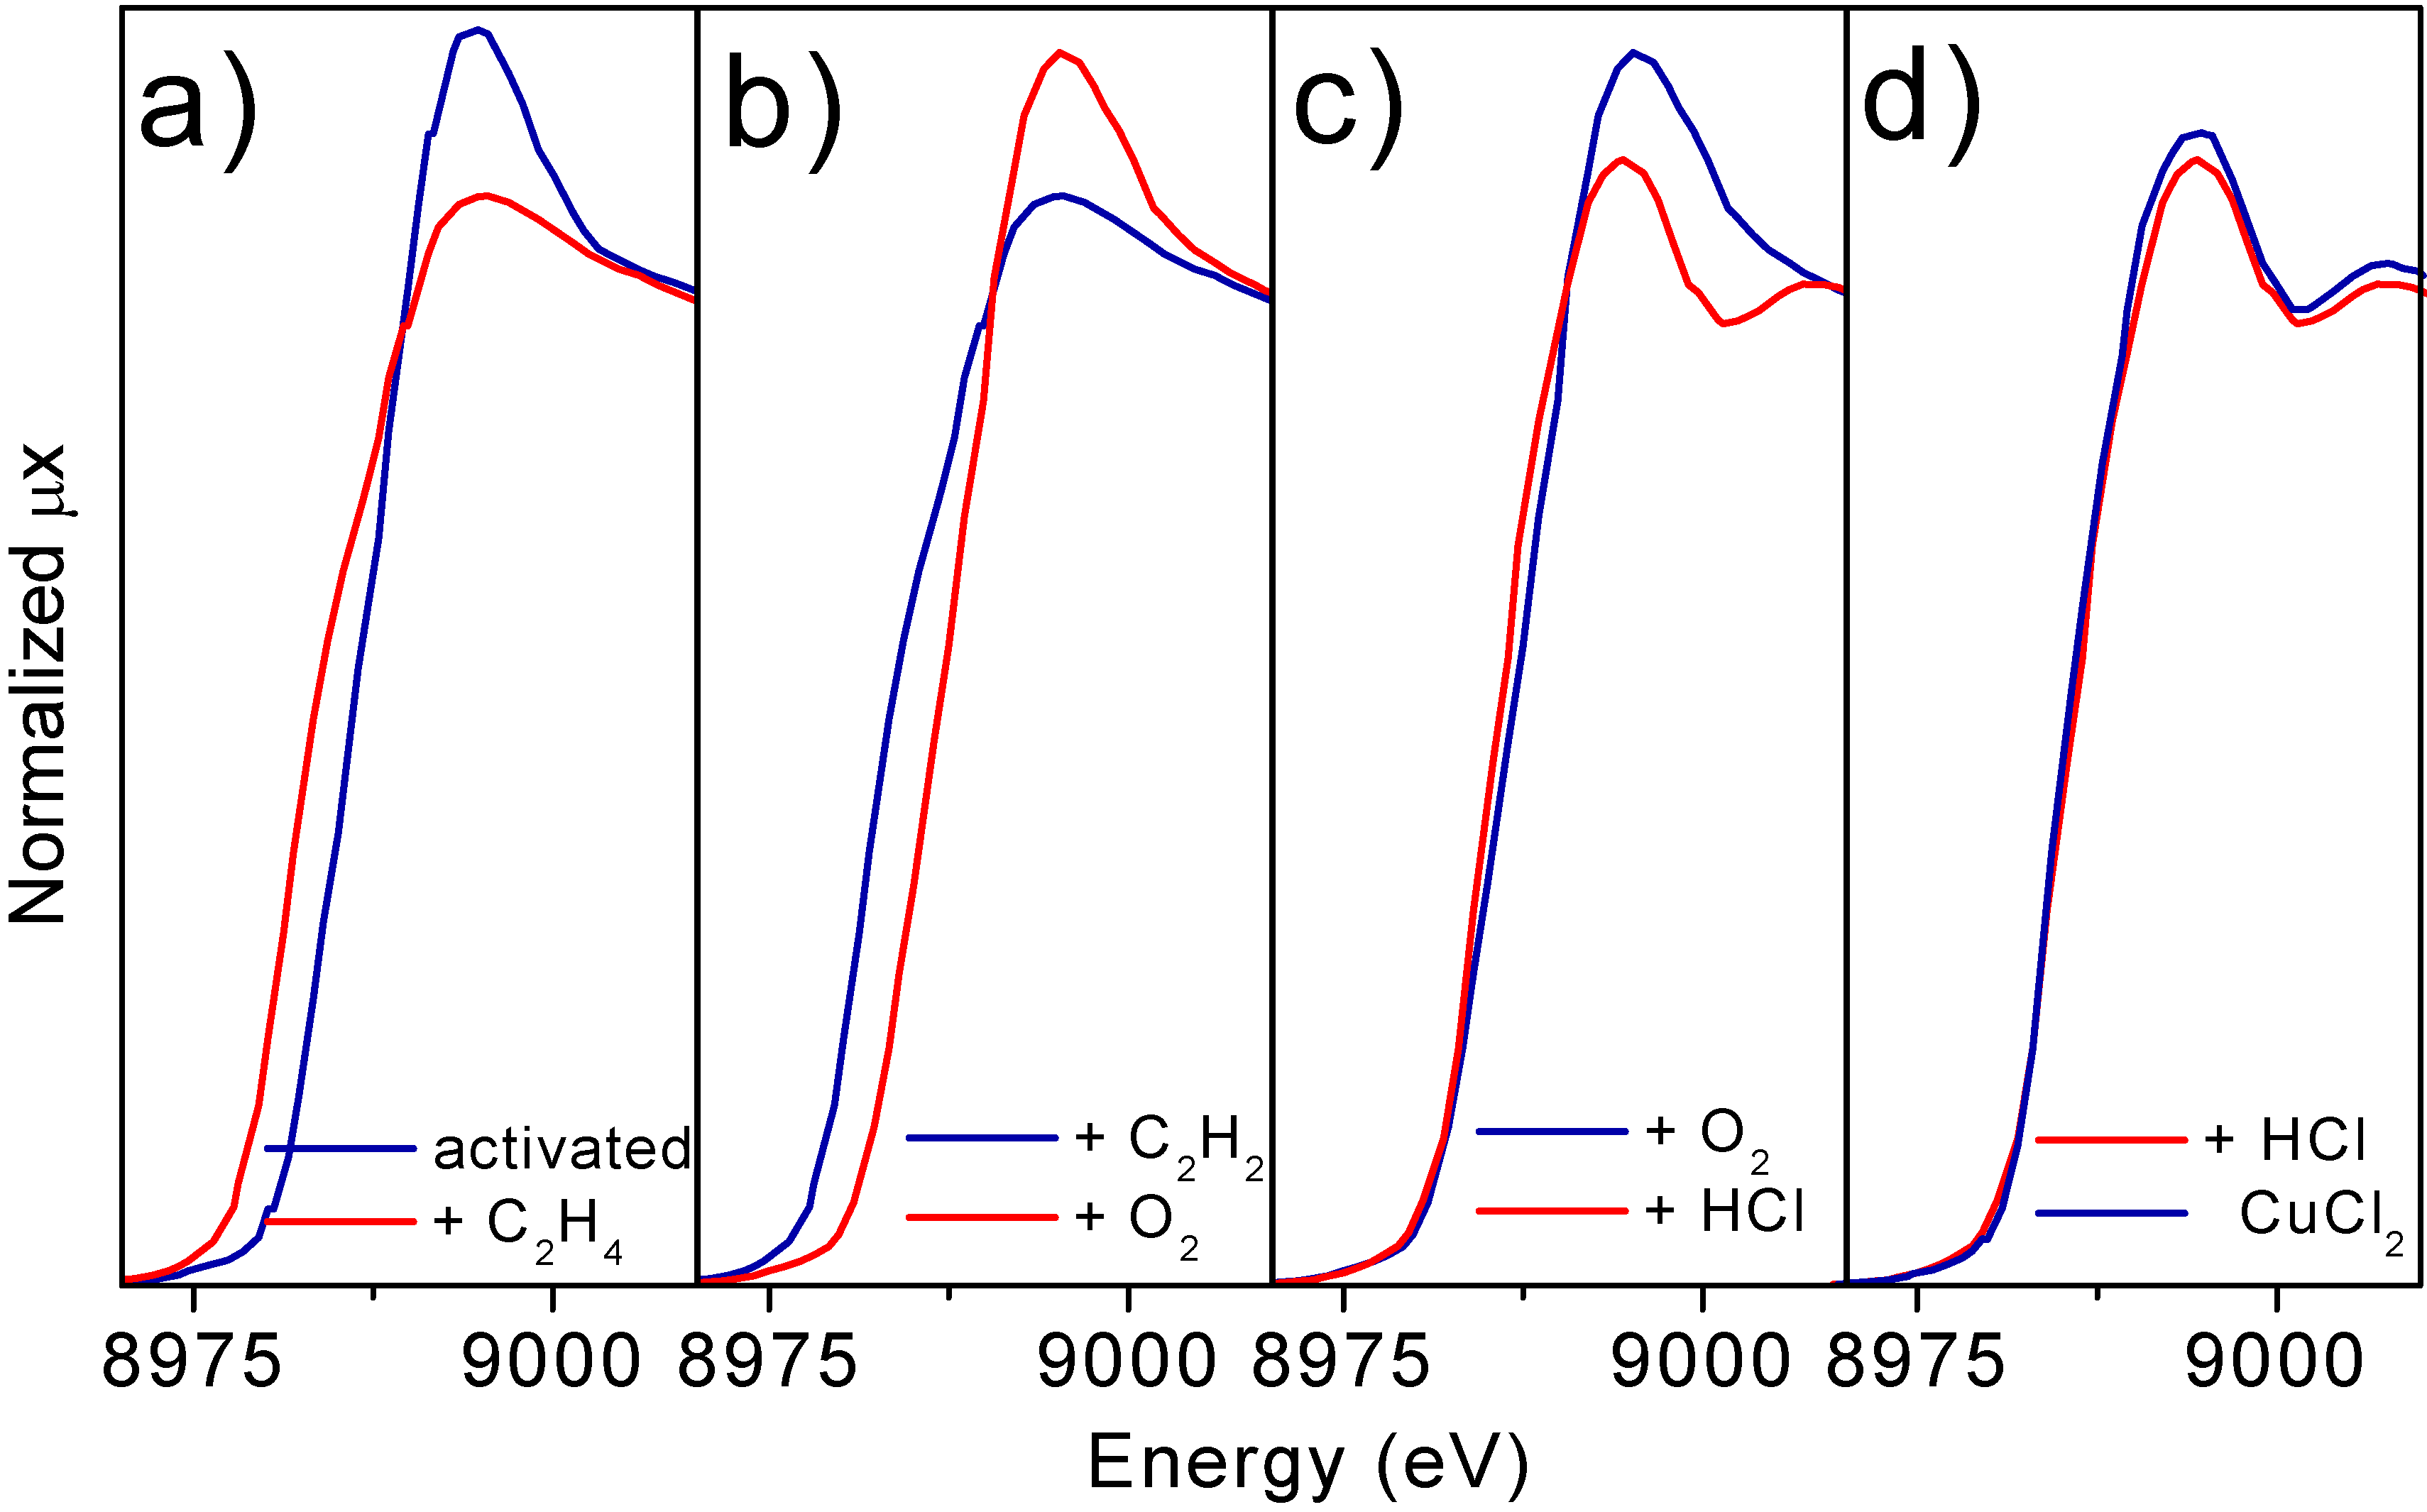
Parts a) to c) of
Figure 7 report the progressive evolutions undergone by the XANES spectrum of the Cu7.5 catalyst following the sequence described by equations (3-5). Interaction with ethylene implies a red shift of the edge from ≈ 8984 eV to ≈ 8979 eV (Part a), while an opposite shift is observed after interaction with O
2 (Part b). Interaction with HCl does not modify appreciably the edge position but causes a modification of the near edge features, both of white line intensity and first oscillation shape.
If the re-chlorination experiment is performed at higher temperature (600 K) the XANES spectrum of the catalyst becomes very close to that of anhydrous CuCl
2 model compound (
Figure 6d).
Figure 7.
Parts a-c): Evolution of the XANES spectra of the Cu7.5 catalyst, along the catalytic path at 500 K. In particular. Parts a) effect of exposure to C2H4. Part b): effect of exposure to O2. Part c): effect of exposure to HCl. Part d) compares the spectrum of the catalyst after a successive interaction with HCl at 600 K (dashed line) with that of bulk anhydrous CuCl2 model compound.
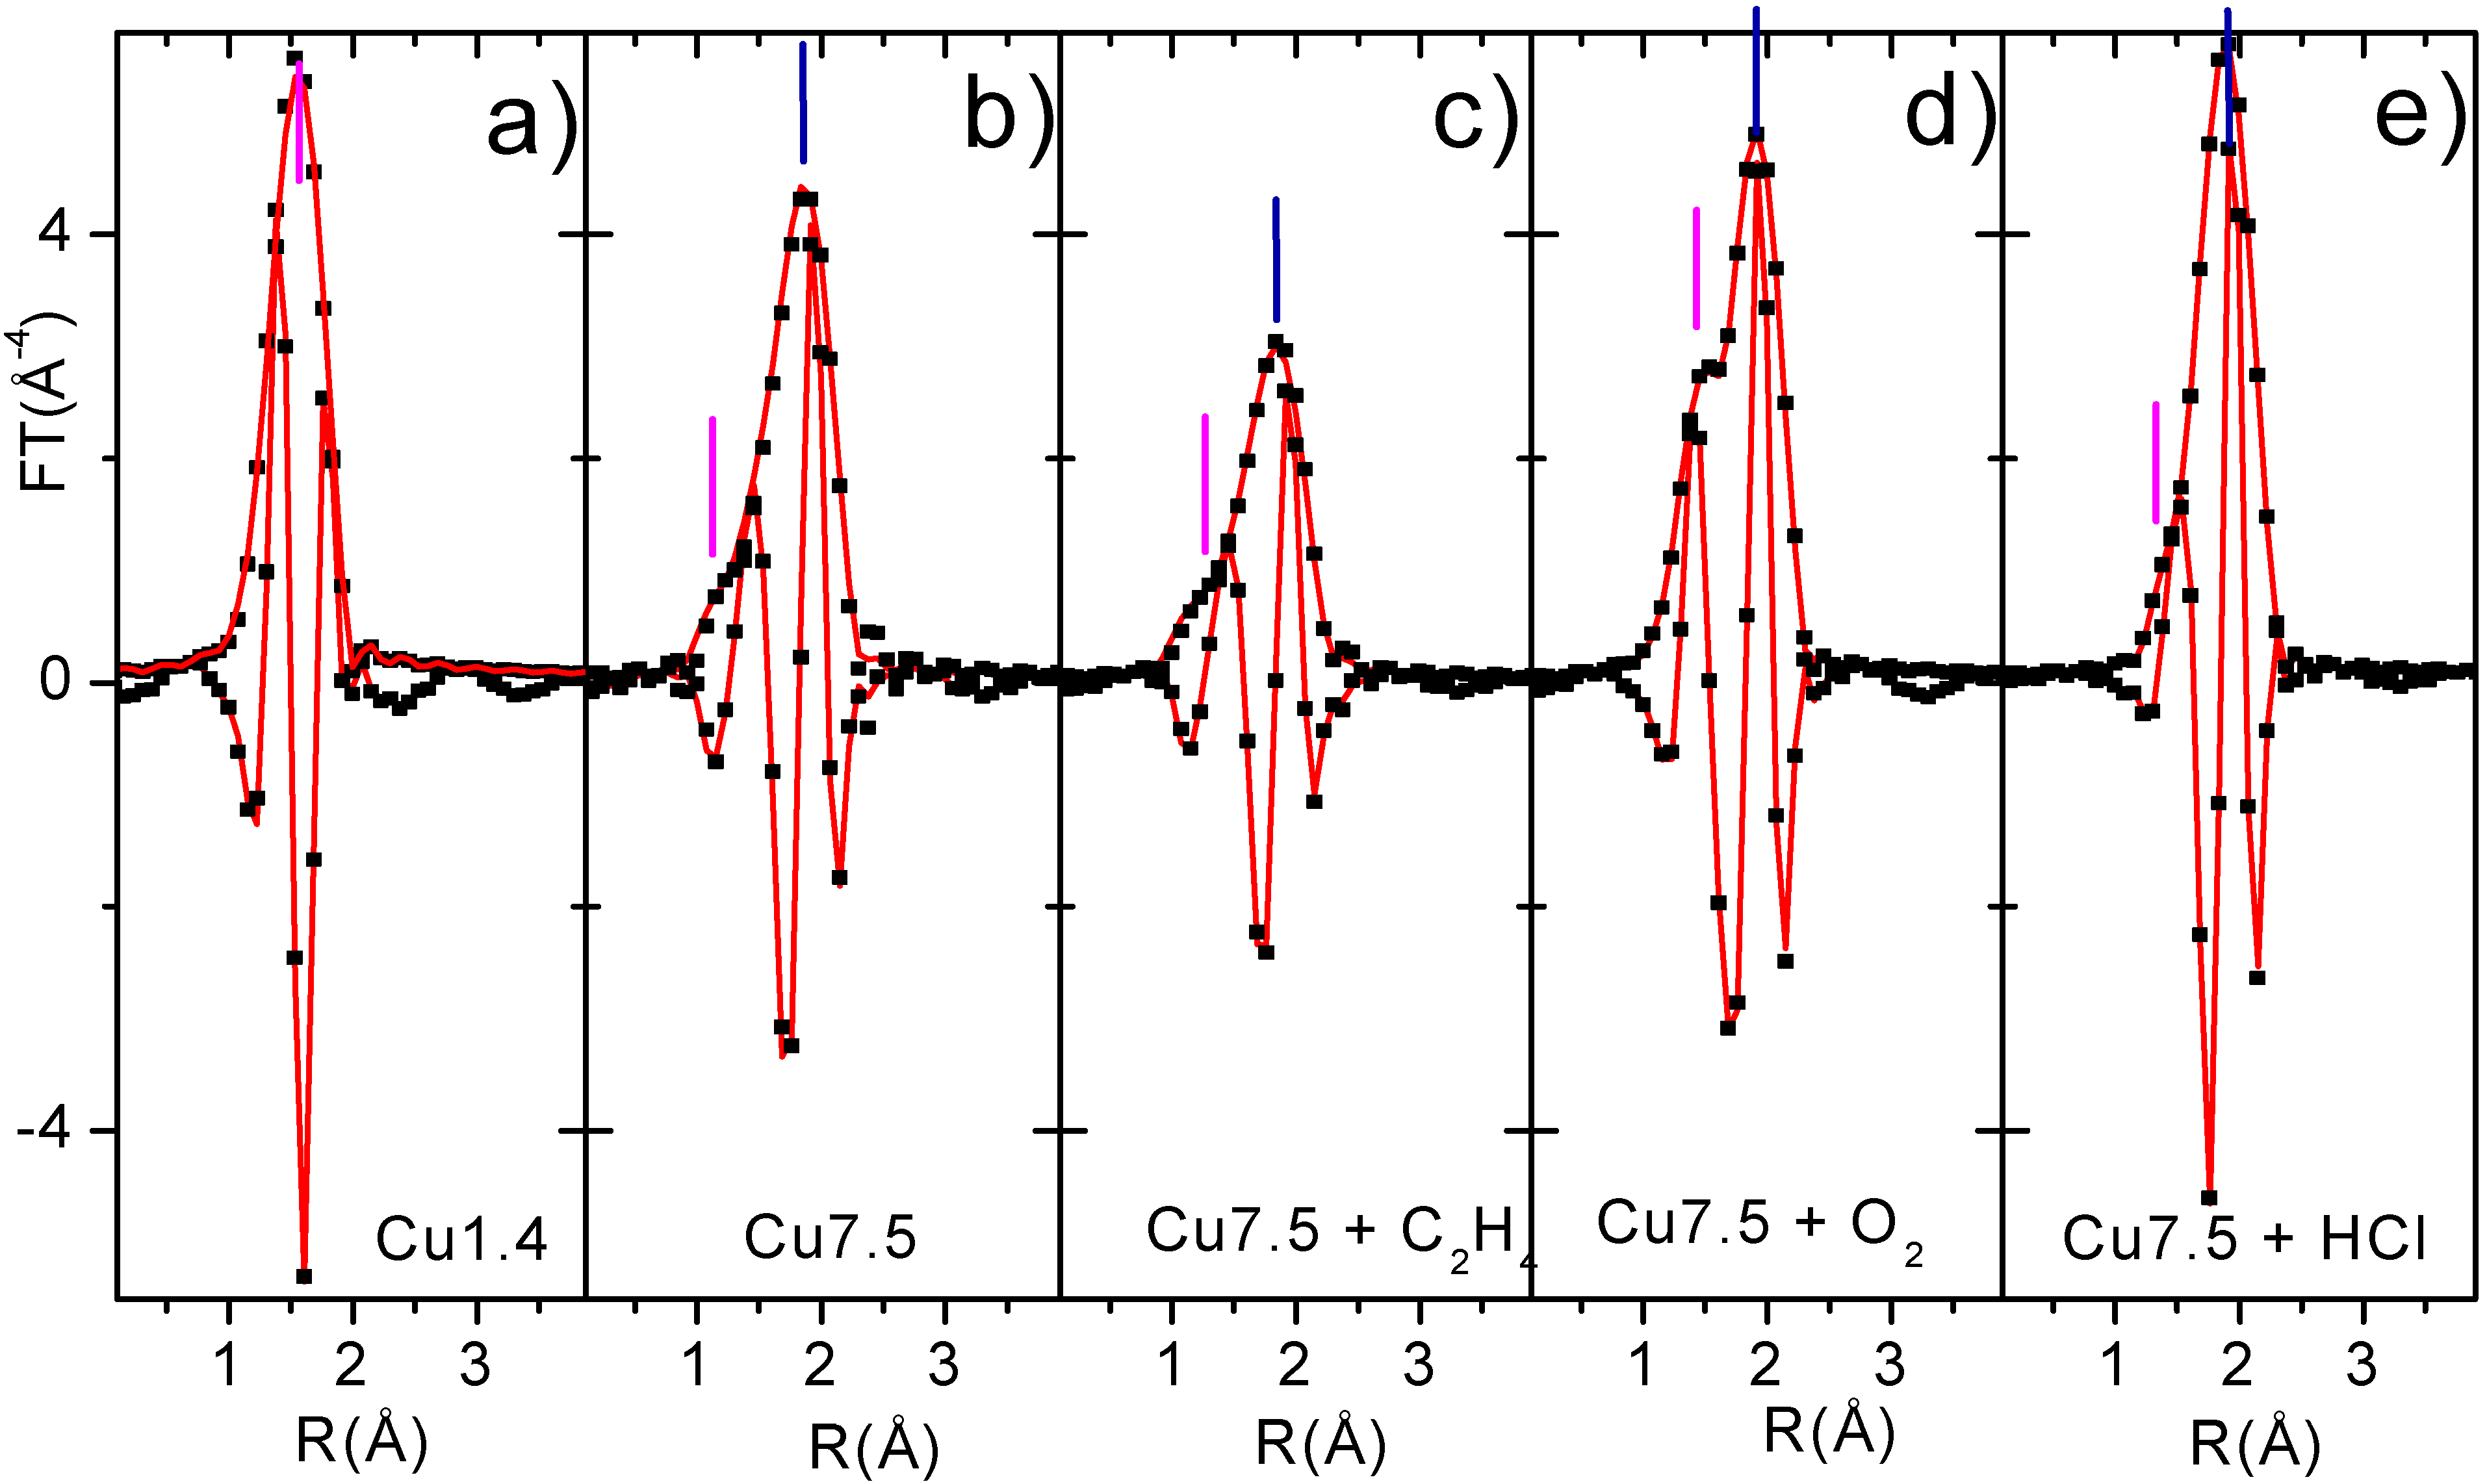
EXAFS spectroscopy has been a key technique in the determination of presence of O or Cl in the first coordination sphere of copper species present in the CuCl
2/Al
2O
3 catalyst along the interaction with reagents [
24,
25,
26,
27]. In fact, the Cu-O contribution (magenta bars) gives rise, in the phase uncorrected FT, to a peak in the 1.5 Å zone. This can be easily noted in
Figure 8a for the Cu1.4 sample which has only oxygen atoms in its first coordination shell. While Cu-Cl (blue bars) results in a peak at around 1.9 Å. Moreover, the Cu-O phase is shifted of about π, with respect to the Cu-Cl one, along nearly all the k region of interest, which makes easier the recognition of the two contributions [
24,
25,
31].
The EXAFS data analysis on sample Cu1.4 can be performed in a straightforward manner, since only one Cu phase is present on it. The numerical values obtained for the coordination number of Cu(II) ions (N) and Cu-O bond length were as follows; N=4.8(±0.5), r(Cu-O)=1.94(±0.02) Å, which together with EPR and UV-Vis data (
Section 3.1), allow us to demonstrate that in the low concentration samples copper is present as a surface Cu aluminate species formed as a consequence of the occupancy from the Cu(II) cations of some octahedral vacancies of alumina surface, where a coordination sphere is formed by five oxygen atoms. The unreactive character of this phase (
Section 3.3) will allow us to fix the Cu aluminate parameters for samples containing both phases (
e.g. Cu7.5) along the whole catalytic cycle. Since for Cu7.5 catalyst two phases are present, a reliable EXAFS data analysis must be done using two different models: the former for the copper aluminate phase (already determined) and the latter for the active phase. The structural data obtained from this approach are summarised in
Table 2, while corresponding fits are reported (in R space) in
Figure 8.
Table 2.
Filtering ranges and EXAFS results for first coordination sphere of the γ-Al2O3 supported CuCl2 catalysts: Δk (interval of k-space to R-space FT); ΔR (R-space interval selected to perform the first shell-filtered Back FT into k-space); R (bond distance); N (coordination number); σ (relative Debye-Waller factor); ΔE (energy shifts). Non optimized parameters can be discriminated by the absence of the corresponding error bars.
| Catalyst | Δk (Å−1) | ΔR (Å) | scattering
atom | R (Å) | N | σ (10−2 Å) | ΔE (eV) |
| Cu1.4 | 3.34-14.31 | 1.07-1.84 | Cu-O | 1.94 ± 0.01 | 4.98 ± 0.25 | 5.8 ± 0.6 | -1 ± 2 |
| Cu7.5 | 2.93-14.09 | 0.92-2.30 | Cu-O | 1.94 | 1.07 | 5.8 | -1 |
| activated | | | Cu-Cl | 2.25 ± 0.02 | 3.15 | 7.0± 1 | -1 ± 2 |
| Cu7.5 | 2.93-14.09 | 0.90-2.34 | Cu-O | 1.94 | 1.07 | 5.8 | +3 ± 2 |
| +C2H4 | | | Cu-Cl | 2.25 ± 0.02 | 3.15 | 8.4 ± 1.3 | -1 ± 2 |
| Cu7.5 | 2.93-14.09 | 0.84-2.34 | Cu-O | 1.94 | 1.07 | 5.8 | -1 |
| +O2 | | | Cu-O | 1.93 ± 0.02 | 1.7± 0.3 | 7.3 ± 1 | -1 |
| | | | Cu-Cl | 2.26 ± 0.02 | 2.0± 0.3 | 5.6 ± 1 | -1 ± 2 |
| Cu7.5 | 2.93-14.09 | 0.90-2.30 | Cu-O | 1.94 | 1.07 | 5.8 | -1 |
| +HCl | | | Cu-Cl | 2.24 ± 0.02 | 3.15 | 7.4 ± 1 | -1 ± 2 |
As discussed in detail in Refs. [
27,
48], when more than a Cu phase is present on the samples, the N values obtained from the EXAFS fit (
Table 2) are not the
true coordination numbers but are only proportional to them. The proportionality constant is the inverse of the relative fraction of the phase. The activated Cu7.5 catalyst has 1.6 Cu wt% as surface copper aluminate and the remaining 5.9 Cu wt% as dispersed copper chloride, resulting in a relative percentage of 21% and 79% respectively [
24,
25,
26,
27]. Copper ions in the surface aluminate phase exhibit a first coordination shell formed by 5 oxygens. Copper ions of the dispersed copper chloride phase have a first coordination formed by 4 chlorine atoms. The EXAFS signal of the activated Cu7.5 catalyst before and after exposure to ethylene have been successfully modeled (
Figure 7b and
Figure 7c) as the sum of 21% (N
Cu-O = 1.07, instead of 5) of the EXAFS signal of the surface Cu aluminate phase and of 79% (N
Cu-Cl = 3.15, instead of 4) of the copper chloride phase, optimizing only four parameters (two ΔE, the R
Cu-Cl and σ
Cu-Cl: second and third catalyst in
Table 2). The same approach holds for the EXAFS data analysis of the catalyst after interaction with O
2 and HCl.
Figure 8.
Modulus and imaginary parts of the phase-uncorrected, k3-weighted, FT of first shell EXAFS data: experimental (dotted black) best fits (full lines). Part a: sample Cu1.4 (only aluminate phase). Part b activated Cu7.5 catalyst. Parts c,d,e): sample Cu7.5 the along the catalytic path.
Figure 8.
Modulus and imaginary parts of the phase-uncorrected, k3-weighted, FT of first shell EXAFS data: experimental (dotted black) best fits (full lines). Part a: sample Cu1.4 (only aluminate phase). Part b activated Cu7.5 catalyst. Parts c,d,e): sample Cu7.5 the along the catalytic path.
These overall experimental features concord with the hypothesised reaction path (3-5). For the interaction with ethylene, the first step (3) predict the reduction of CuCl
2 to CuCl. EPR and XANES show that Cu changes its oxidation state from +2 to +1 (
Figure 6 and
Figure 7 respectively). Moreover, EXAFS obtains a first coordination shell compatible with the CuCl structure (
Table 2). For the interaction with oxygen, the second step (4) predict the oxidation of CuCl
2 to Cu
2OCl
2. The opposite change of oxidation state is confirmed by EPR and XANES, while EXAFS shows the insertion of oxygen atoms in the first coordination shell. This last evidence proves the formation of an oxychloride phase. For the final step, the equation (5) hypothesises the rechlorination of the oxychloride phase resulting in the restoration of CuCl
2, demonstrating the closure of the catalytic cycle. XANES spectrum shows a remarkable similarities with those of anhydrous CuCl
2 model compound. EXAFS data confirm this similarities, showing the disappearance of the contribution of oxygen in the first shell of the Cu in the dispersed phase.
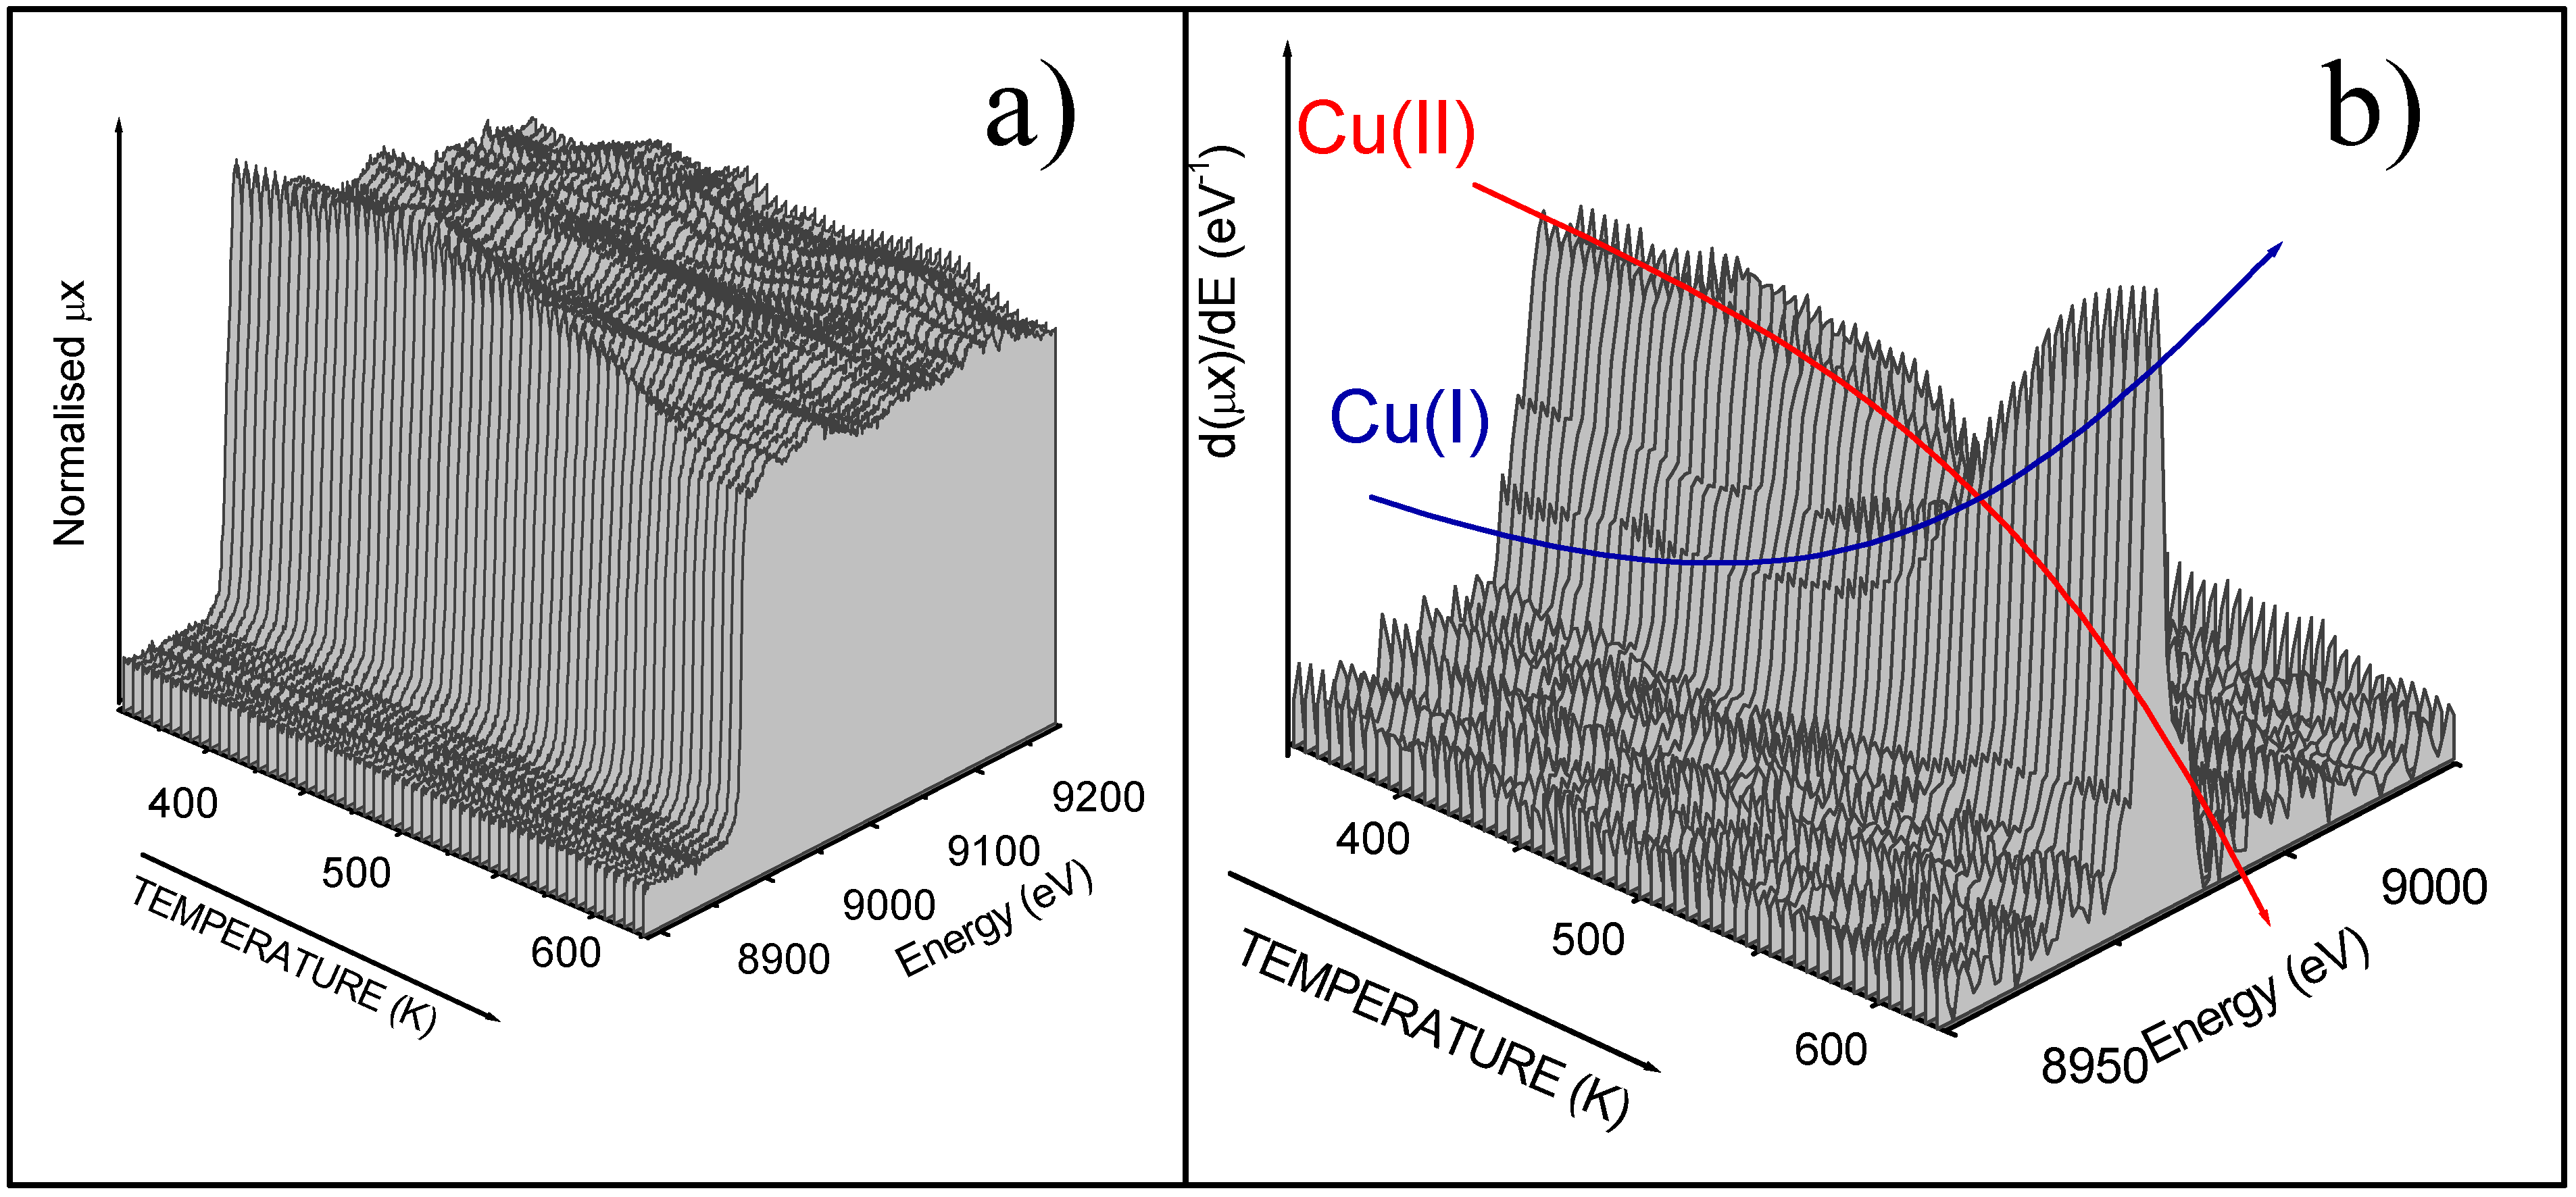
3.6. Future developments
In order to obtain some information about the kinetic of the catalytic cycle in conditions as close as possible to the true catalytic conditions in the industrial reactors, a time resolved,
in situ experiment has been conceived. We have located an
ad hoc designed reactor inside the experimental hutch of the ID24 dispersive EXAFS beamline of the ESRF, where the three reagents have been feed simultaneously to the catalyst together with N
2 carrier gas (in the same percentage than that used in the fixed bed reactors). The overall pressure was 1 atm. In such conditions we were potentially able to acquire a XANES spectrum at the Cu K-edge in less than 1 s. The temperature of the catalyst was increased from 350 K (a temperature when the catalyst is not active) to 630 K by 12 Kmin
−1 ramp.
In situ XANES spectra allows us to monitor the average oxidation state of copper as a function of the temperature in conditions close to the reaction one [
49,
50].
Figure 9 shows the spectra obtained on Cu5.0 catalysts: part (a) raw XANES data, part (b) corresponding derivative spectra. Comparison with the results obtained under static conditions on samples exhibiting a well defined oxidation state (
Figure 7) allows to affirm that the catalyst undergoes a complete Cu(II) → Cu(I) reduction in the investigated temperature range. The change of the oxidation state of copper is particularly evident in the first derivative spectra where the progressive growing of the strong Cu(I) peak at 8982 eV (blue arrow) is accompanied by the parallel decrement of the 8986-8992 Cu(II) doublet (red arrow).
Figure 9.
Time resolved X-ray absorption experiments. Part a): raw XANES spectra. Part b): corresponding first derivative.
Figure 9.
Time resolved X-ray absorption experiments. Part a): raw XANES spectra. Part b): corresponding first derivative.
A detailed analysis of the whole set of spectra, accompanied by the combined catalytic activity followed in situ by measuring the gas output with a mass spectrometer, will allow to get important information on the interplay between catalyst activity and oxidation state of the active phase.


 ,
,  and
and  symbols respectively). Open symbols
  Πand
Πand  refers to 9.0 and 4.6 wt% loaded samples normalized by “active” Cu concentration, see text.


