Renal Regenerative Potential of Extracellular Vesicles Derived from miRNA-Engineered Mesenchymal Stromal Cells

 , ,
, ,
Abstract
1. Introduction
2. Results
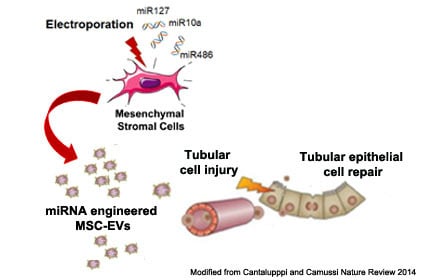
2.1. Identification of Pro-Regenerative miRNAs Carried by EVs
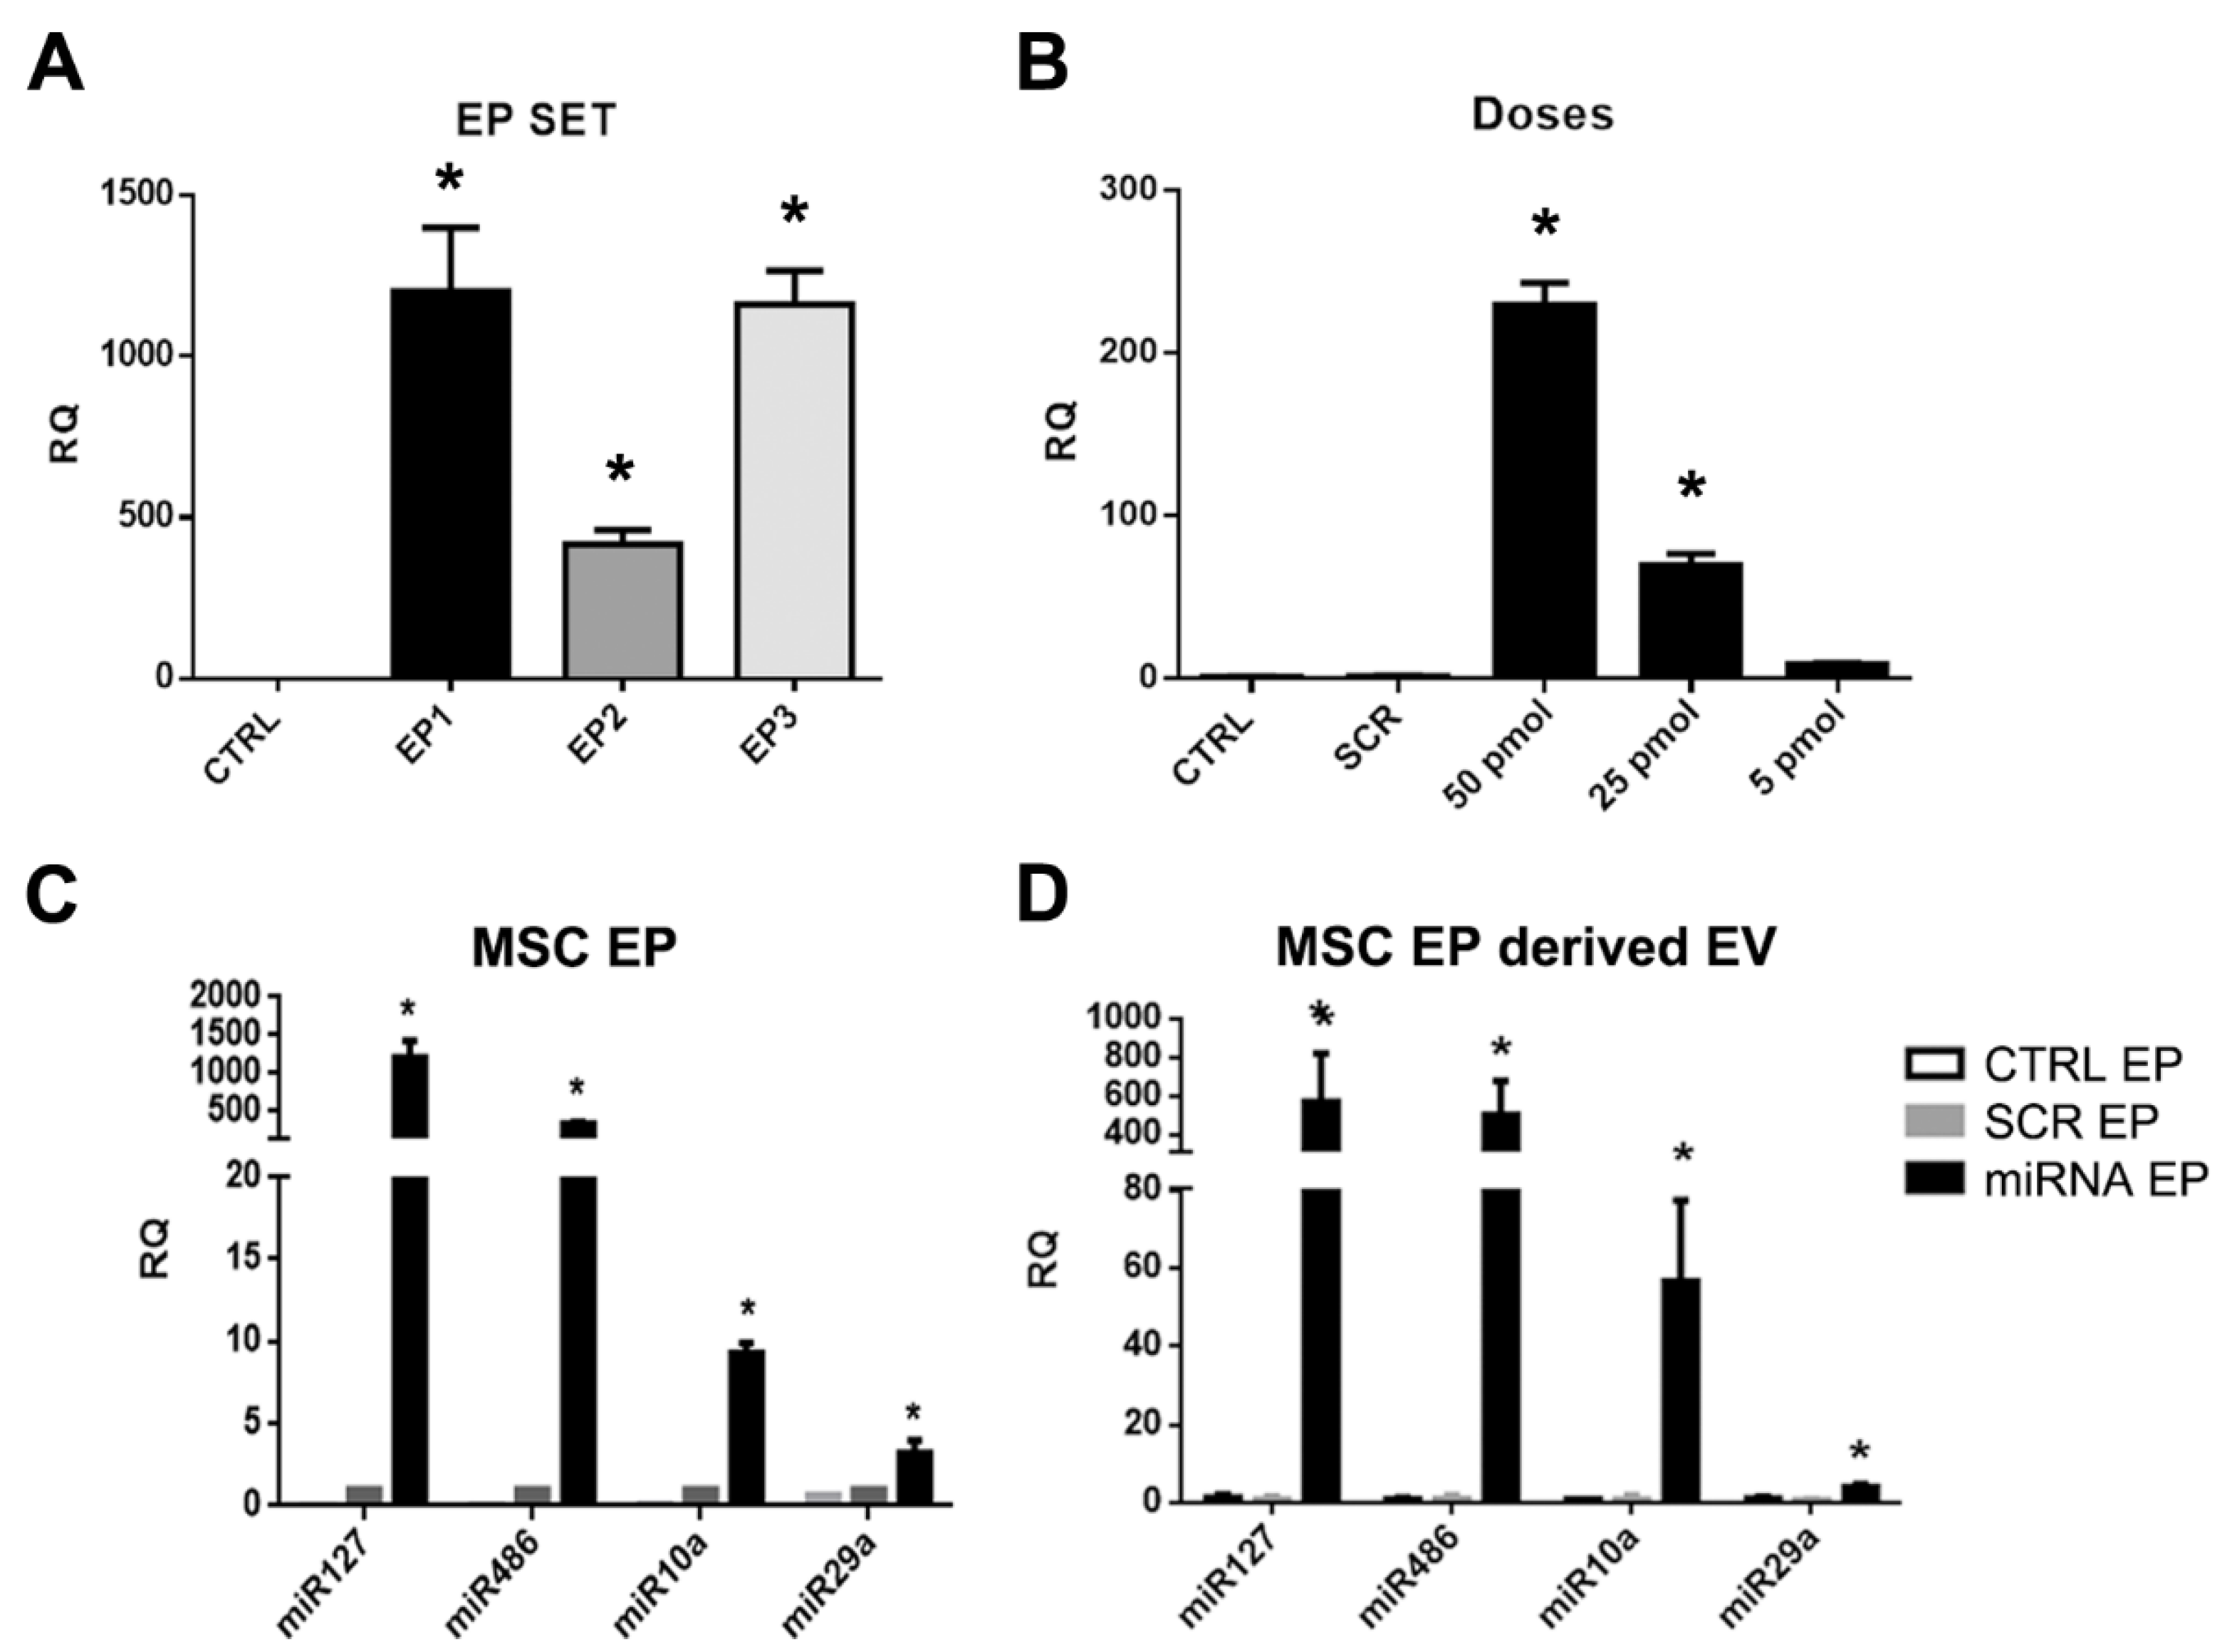
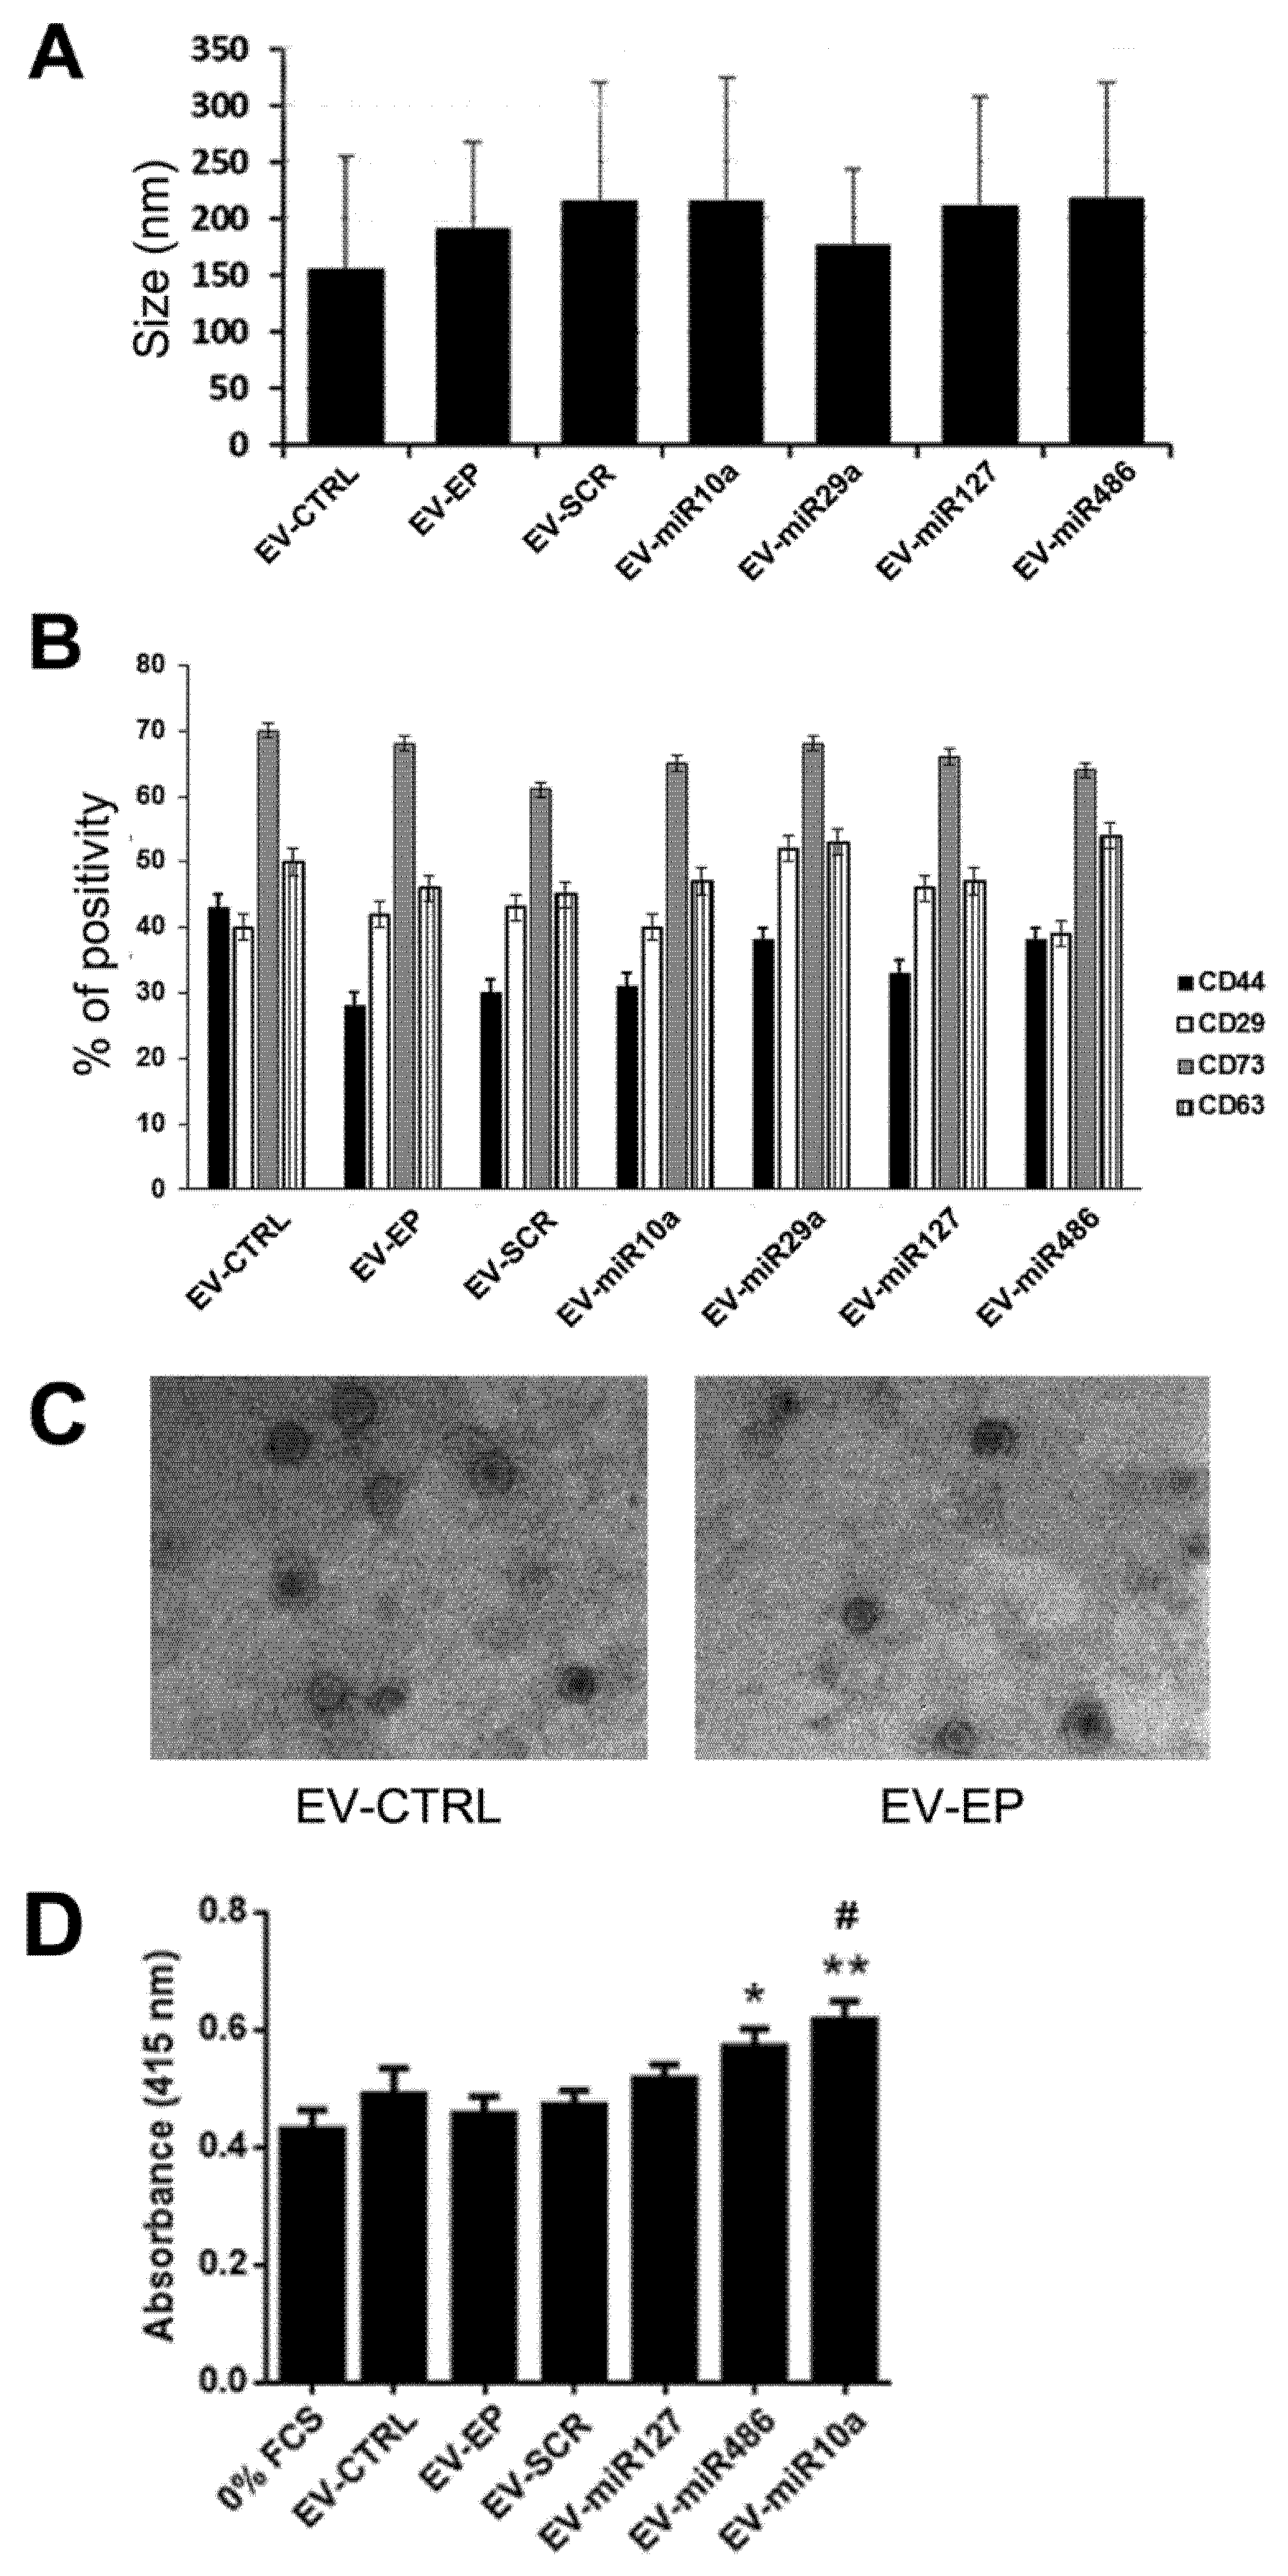
2.2. Generation of MSCs and Derived EVs Engineered with miRNAs
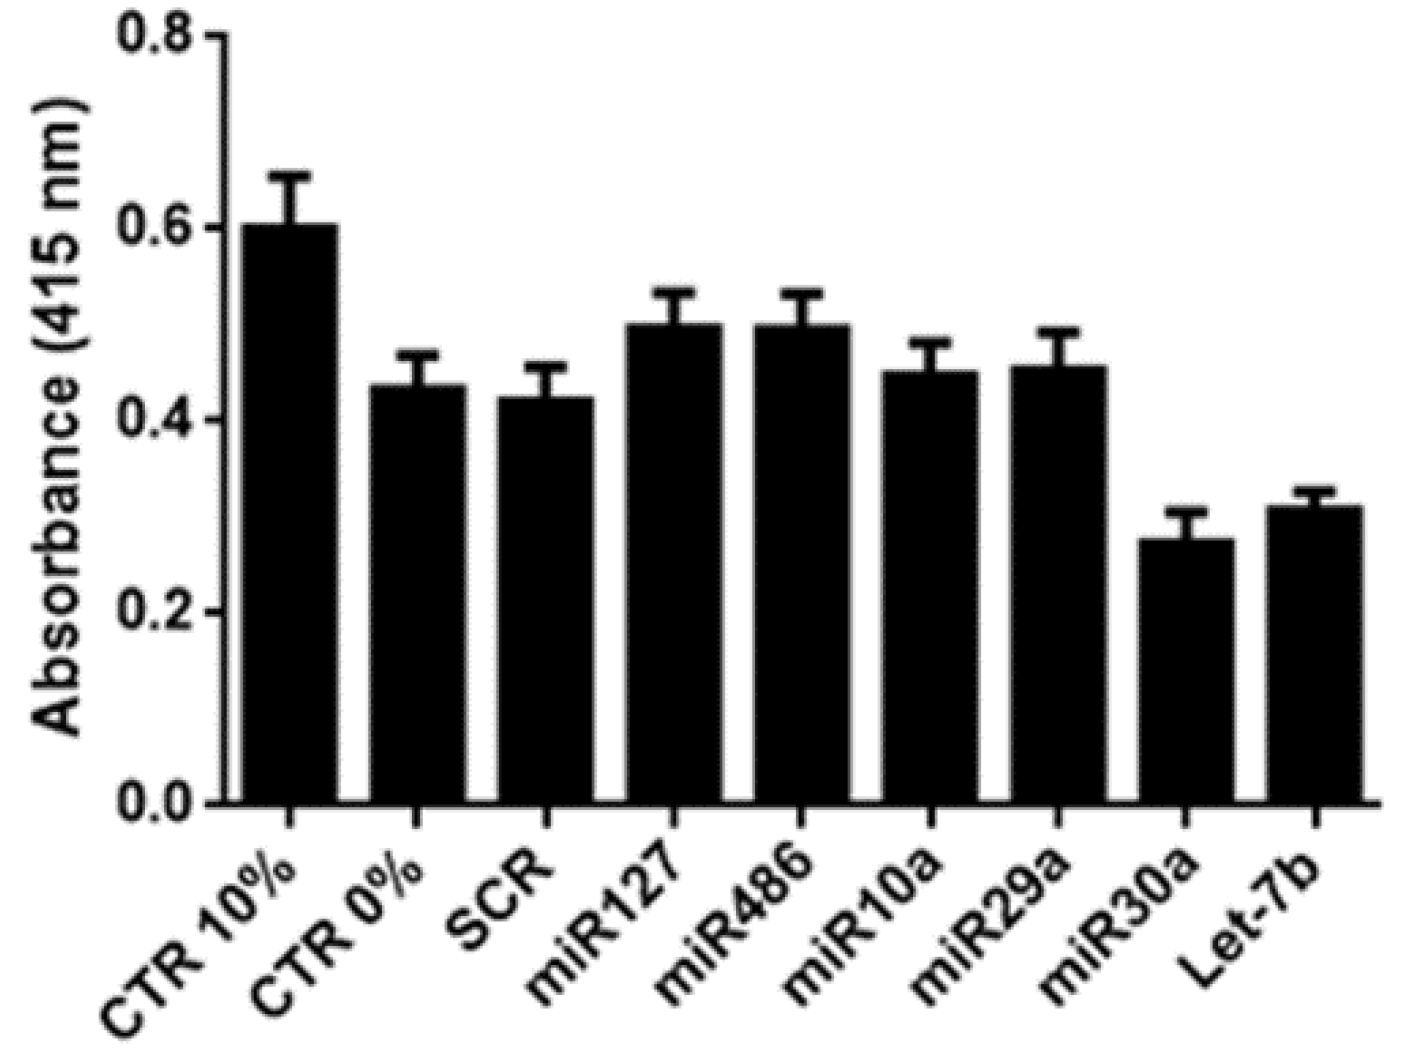
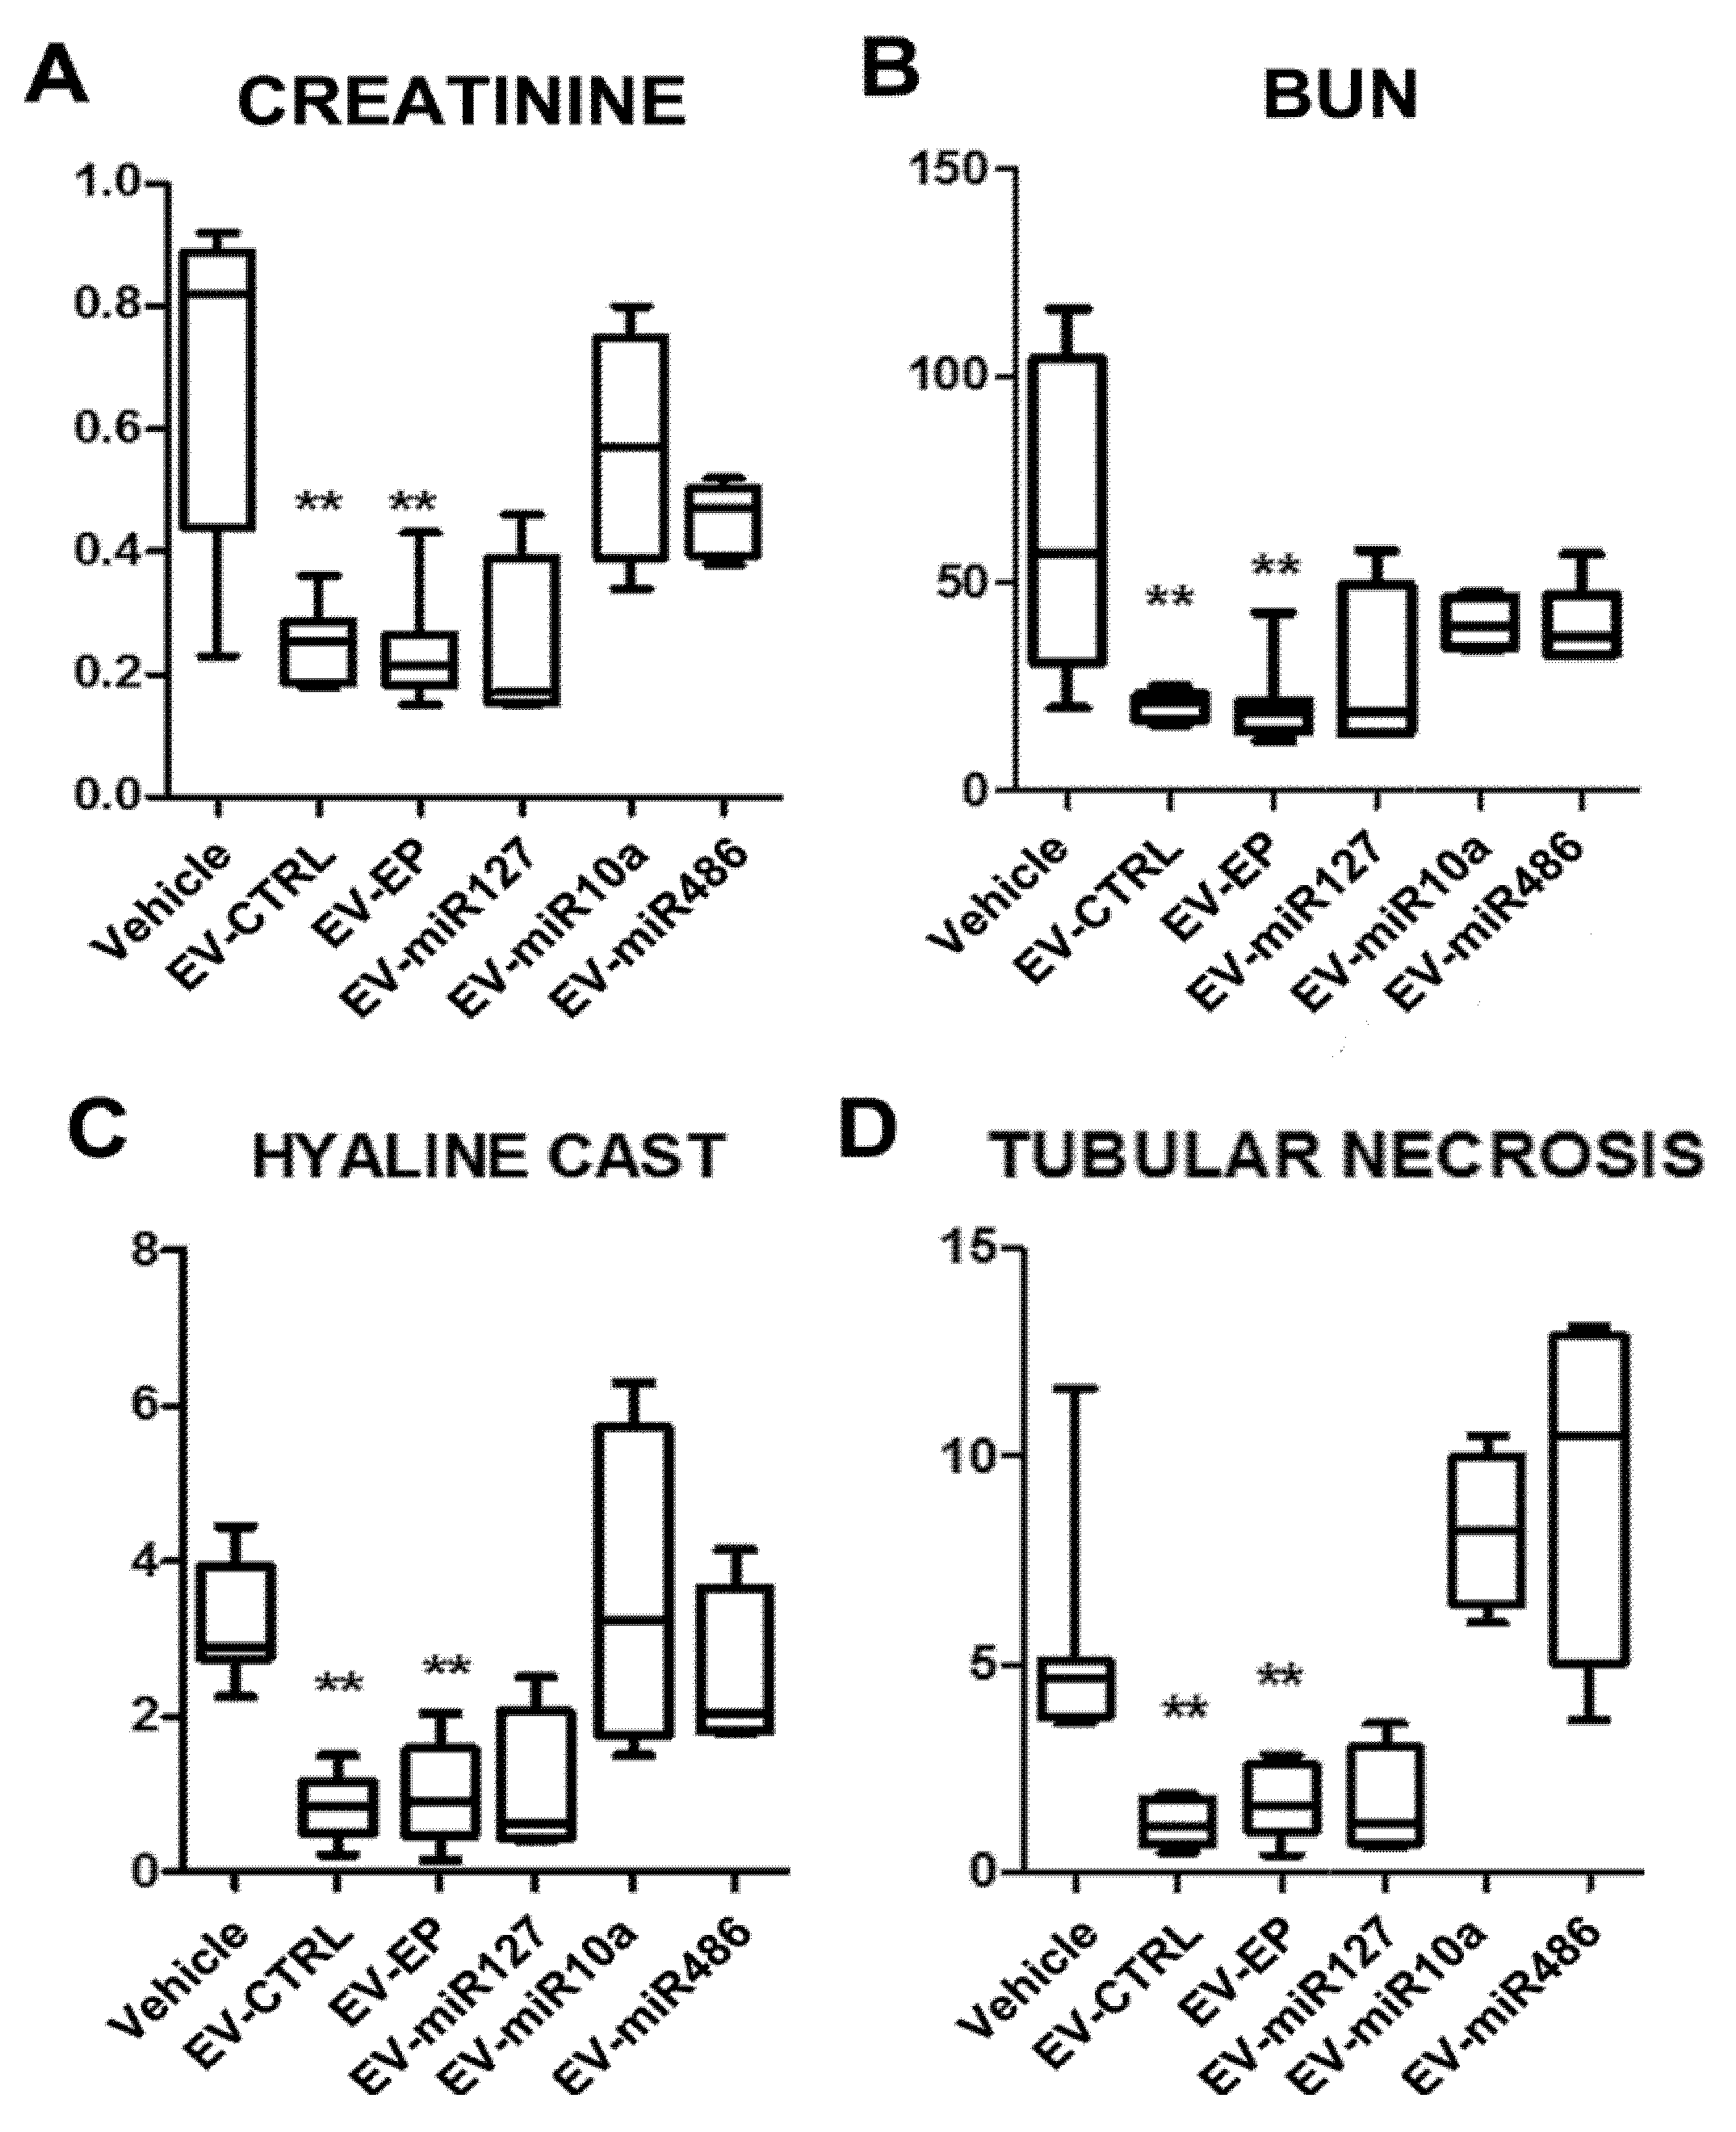
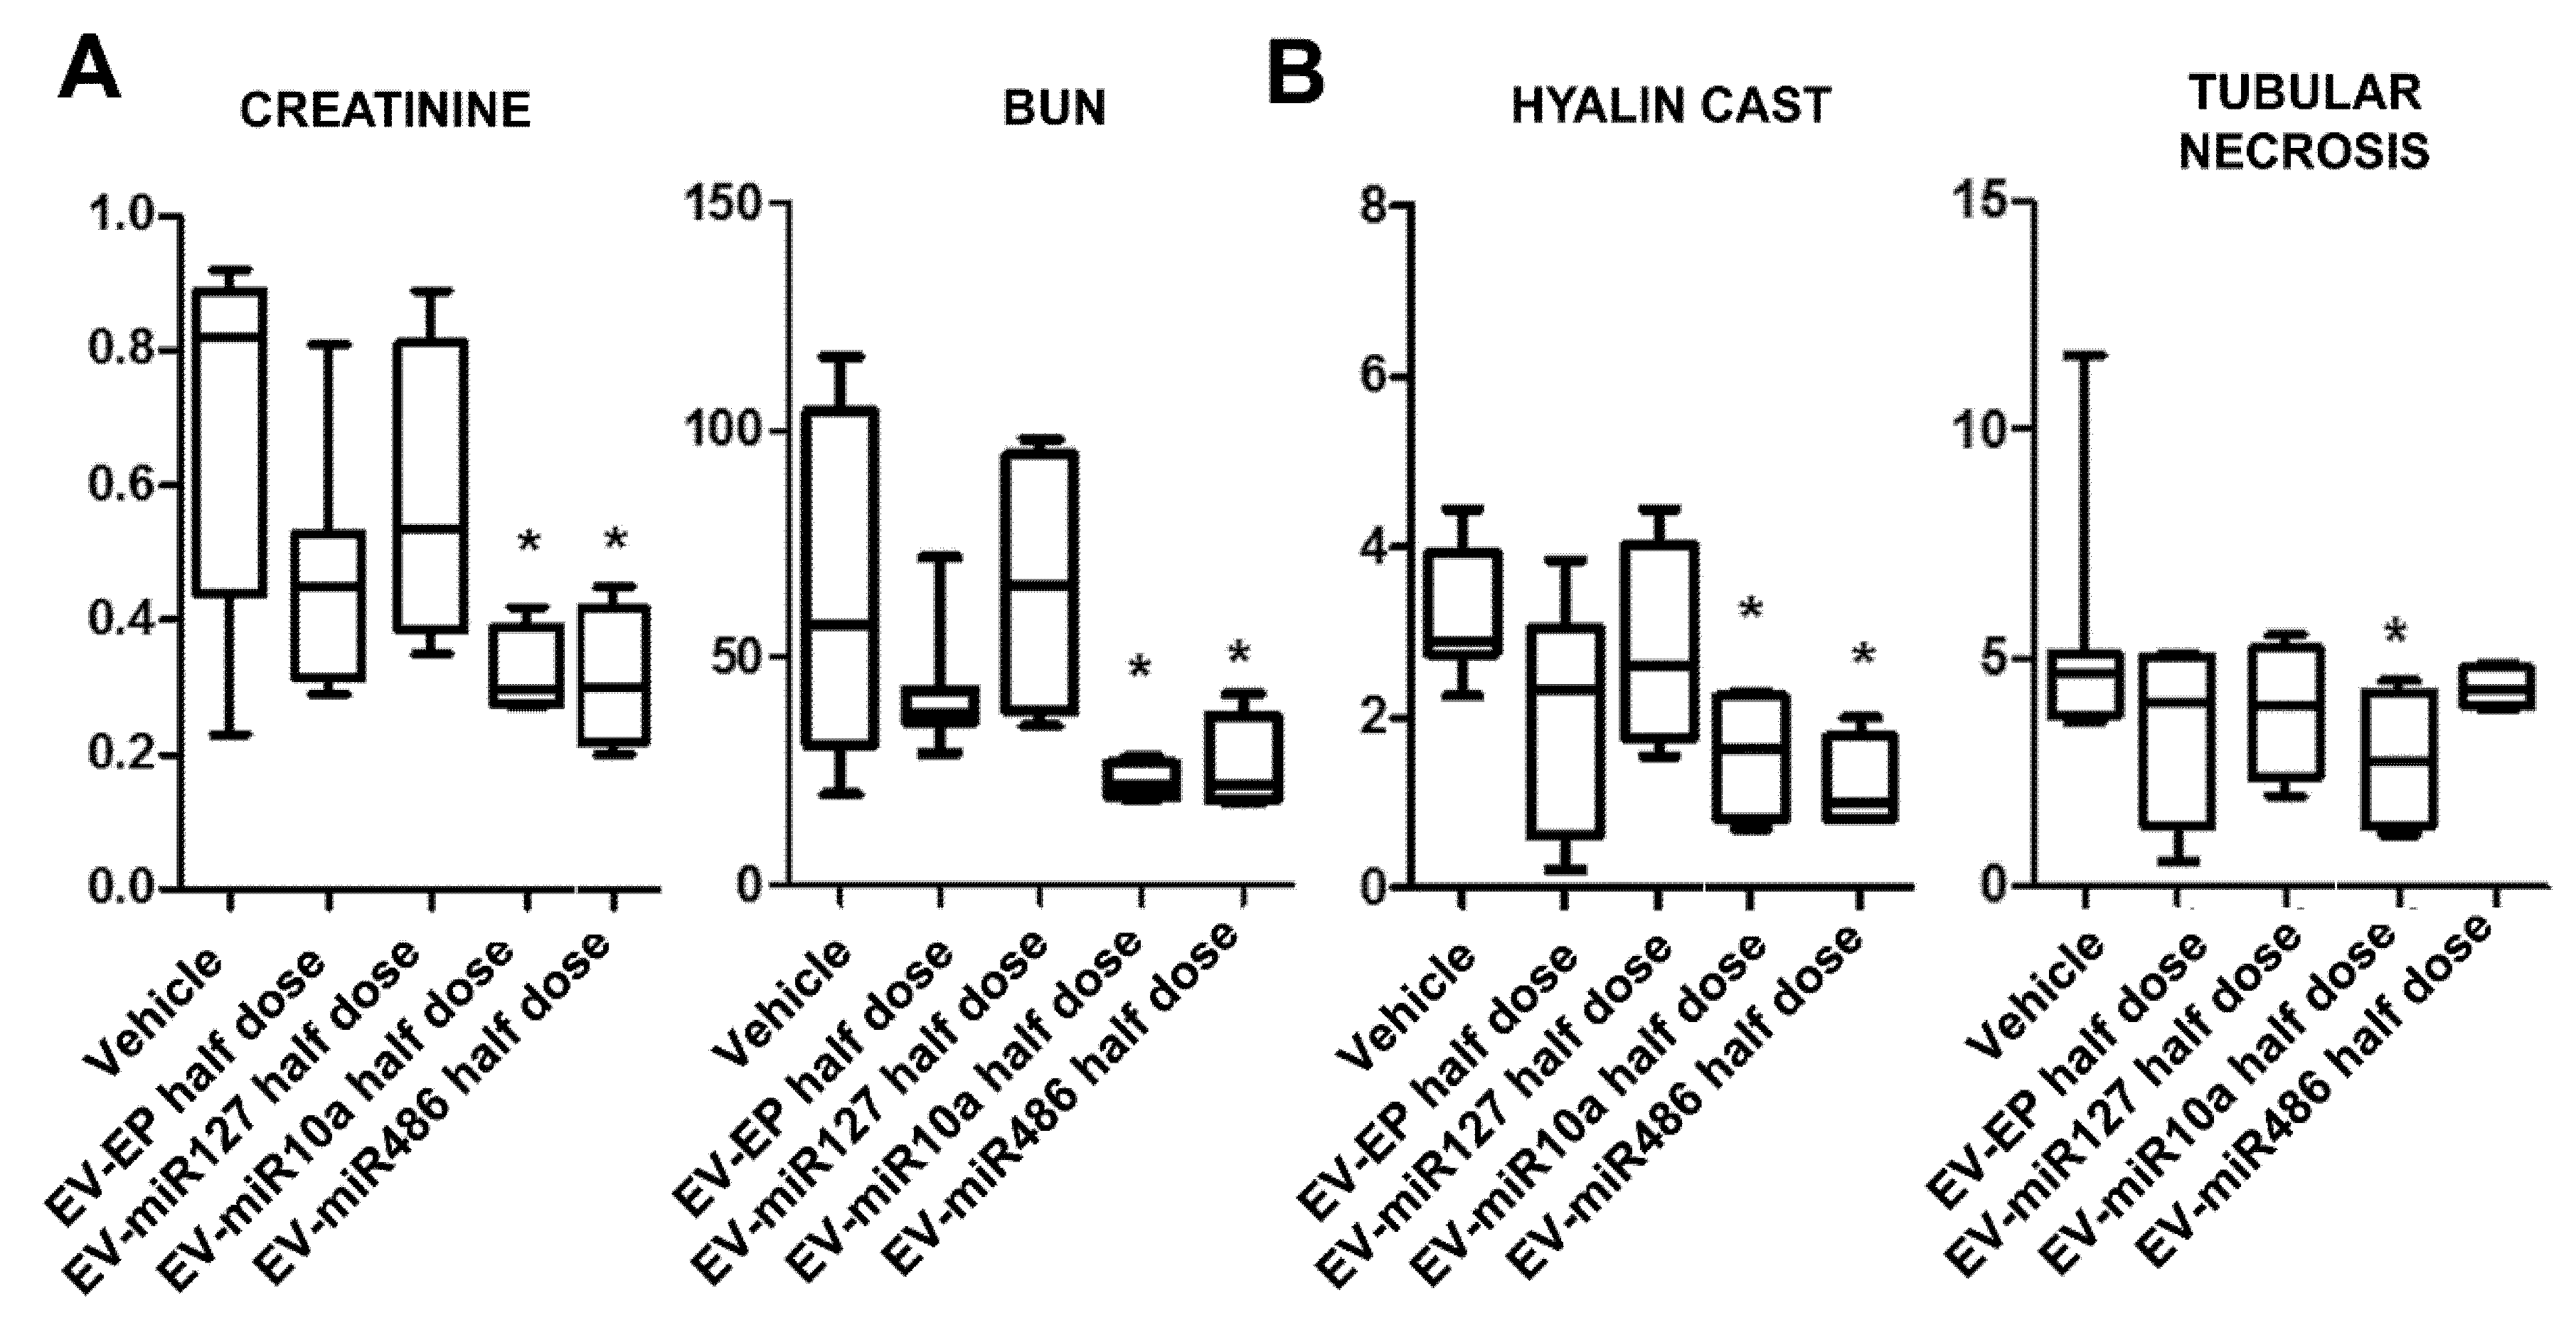
2.3. In Vitro and In Vivo Effects of EVs
3. Discussion
4. Materials and Methods
4.1. Cell Cultures and EV-CTRL Isolation
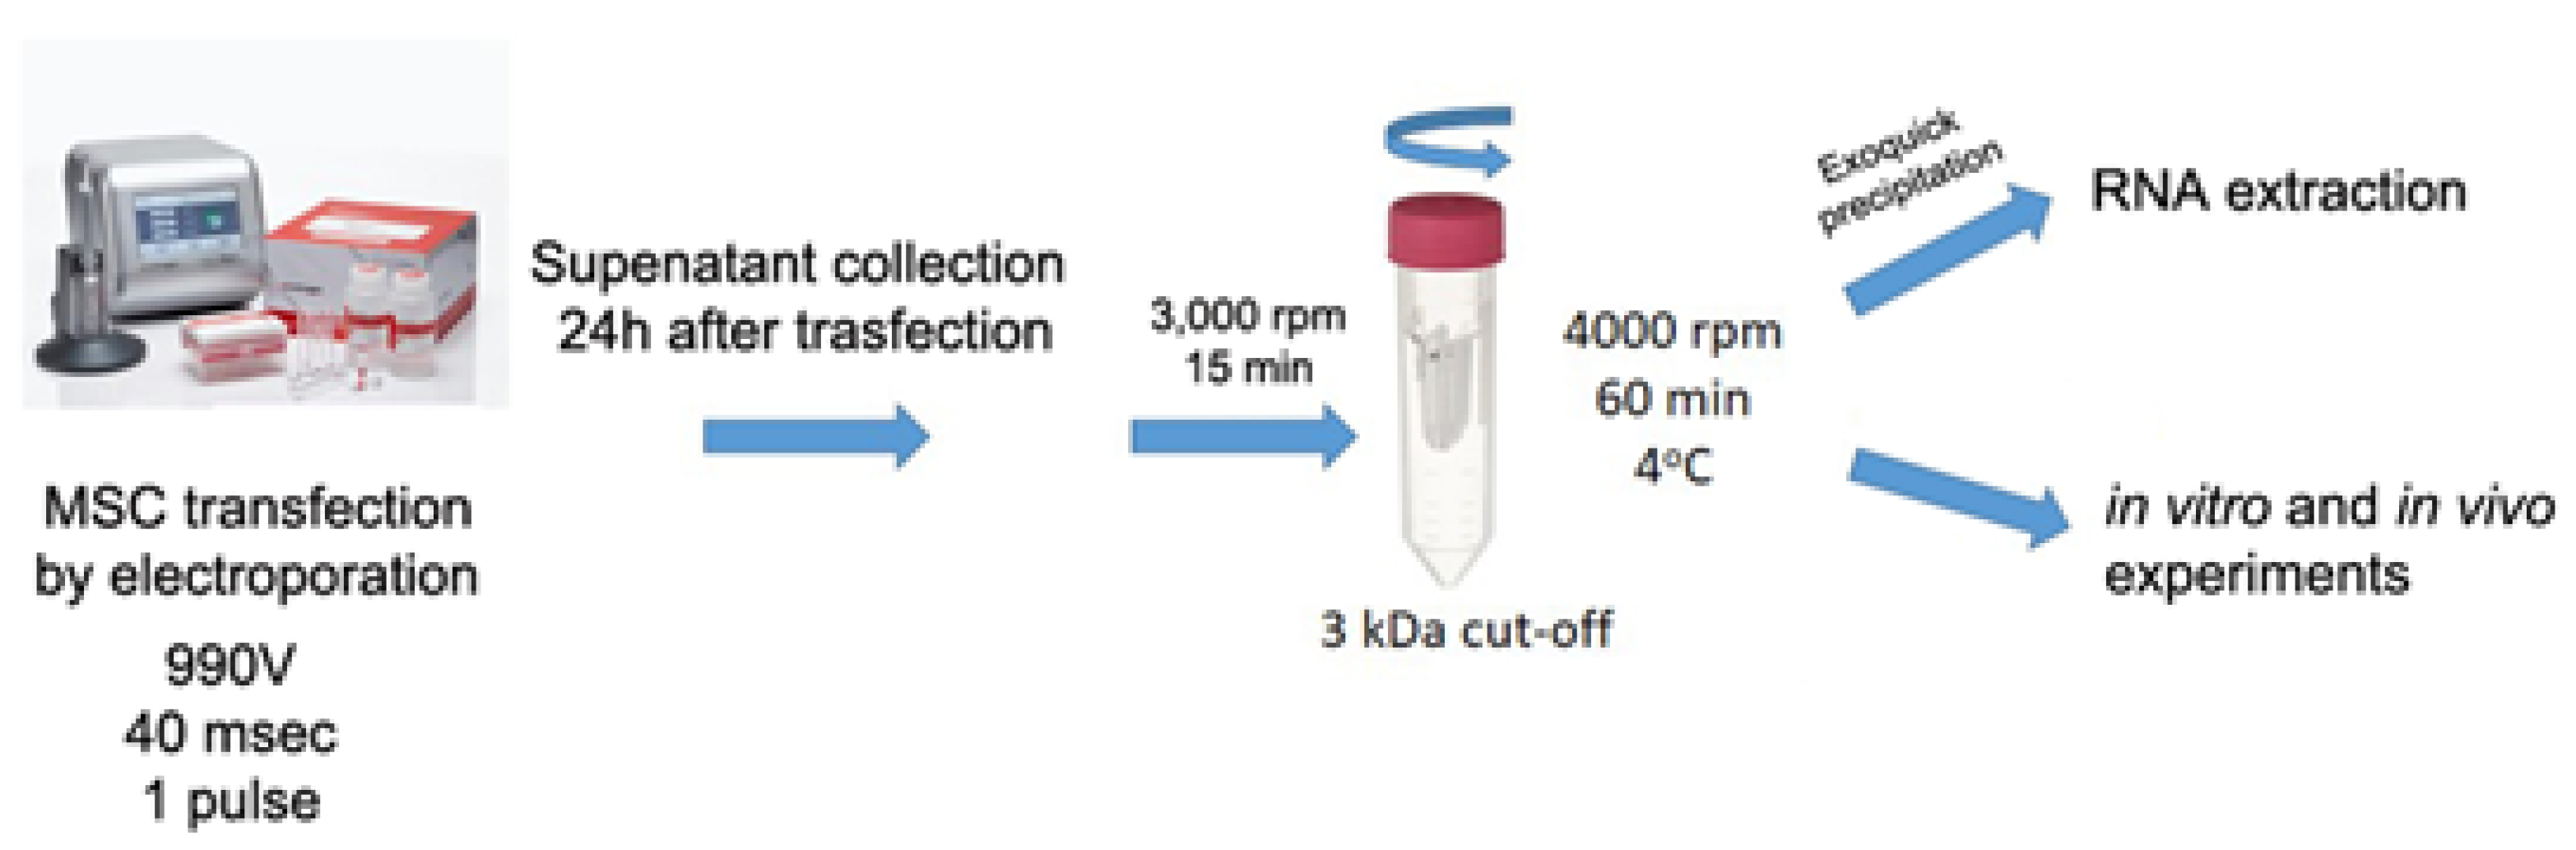
4.2. MSC Transfection and Collection of Engineered MSC-EVs
4.3. EV Characterization
4.4. RNA Analysis
4.5. Integrating miRNA Expression in MSC EVs and RNA Analysis in AKI Animals
4.6. mTEC Proliferation Assay
4.7. SCID Mouse Model of AKI
4.8. Statistical Analyses
Author Contributions
Funding
Acknowledgments
Conflicts of Interest
References
- Heldring, N.; Mager, I.; Wood, M.J.A.; Le Blanc, K.; Andaloussi, S.E. Therapeutic potential of multipotent mesenchymal stromal cells and their extracellular vesicles. Hum. Gene Ther. 2015, 26, 506–517. [Google Scholar] [CrossRef]
- Lamichhane, T.N.; Sokic, S.; Schardt, J.S.; Raiker, R.S.; Lin, J.W.; Jay, S.M. Emerging roles for extracellular vesicles in tissue engineering and regenerative medicine. Tissue Eng. Part B Rev. 2015, 21, 45–54. [Google Scholar] [CrossRef]
- Robbins, P.D.; Morelli, A.E. Regulation of immune responses by extracellular vesicles. Nat. Rev. Immunol. 2014, 14, 195–208. [Google Scholar] [CrossRef]
- Wang, Y.; He, J.; Pei, X.; Zhao, W. Systematic review and meta-analysis of mesenchymal stem/stromal cells therapy for impaired renal function in small animal models. Nephrology 2013, 8, 201–218. [Google Scholar] [CrossRef] [PubMed]
- Grange, C.; Iampietro, C.; Bussolati, B. Stem cell extracellular vesicles and kidney injury. Stem Cell Investig. 2017, 4, 90. [Google Scholar] [CrossRef]
- Bruno, S.; Tapparo, M.; Collino, F.; Chiabotto, G.; Deregibus, M.C.; Soares Lindoso, R.; Neri, F.; Kholia, S.; Giunti, S.; Wen, S.; et al. Renal Regenerative Potential of Different Extracellular Vesicle Populations Derived from Bone Marrow Mesenchymal Stromal Cells. Tissue Eng. Part A 2017, 23, 1262–1273. [Google Scholar] [CrossRef]
- Tao, S.C.; Yuan, T.; Zhang, Y.L.; Yin, W.J.; Guo, S.C.; Zhang, C.Q. Exosomes derived from miR-140-5p-overexpressing human synovial mesenchymal stem cells enhance cartilage tissue regeneration and prevent osteoarthritis of the knee in a rat model. Theranostics 2017, 7, 180–195. [Google Scholar]
- Lou, G.; Yang, Y.; Liu, F.; Ye, B.; Chen, Z.; Zheng, M.; Liu, Y. MiR-122 modification enhances the therapeutic efficacy of adipose tissue-derived mesenchymal stem cells against liver fibrosis. J. Cell Mol. Med. 2017, 21, 2963–2973. [Google Scholar] [CrossRef] [PubMed]
- Song, J.L.; Zheng, W.; Chen, W.; Qian, Y.; Ouyang, Y.M.; Fan, C.Y. Lentivirus-mediated microRNA-124 gene-modified bone marrow mesenchymal stem cell transplantation promotes the repair of spinal cord injury in rats. Exp. Mol. Med. 2017, 49, e332. [Google Scholar] [CrossRef] [PubMed]
- Li, D.; Zhang, P.; Yao, X.; Li, H.; Shen, H.; Li, X.; Wu, J.; Lu, X. Exosomes Derived From miR-133b-Modified Mesenchymal Stem Cells Promote Recovery After Spinal Cord Injury. Front. Neurosci. 2018, 22, 845. [Google Scholar] [CrossRef] [PubMed]
- Shen, H.; Yao, X.; Li, H.; Li, X.; Zhang, T.; Sun, Q.; Ji, C.; Chen, G. Role of Exosomes Derived from miR-133b Modified MSCs in an Experimental Rat Model of Intracerebral Hemorrhage. J. Mol. Neurosci. 2018, 64, 421–430. [Google Scholar] [CrossRef]
- Collino, F.; Bruno, S.; Incarnato, D.; Dettori, D.; Neri, F.; Provero, P.; Pomatto, M.; Oliviero, S.; Tetta, C.; Quesenberry, P.J.; et al. AKI Recovery Induced by Mesenchymal Stromal Cell-Derived Extracellular Vesicles Carrying MicroRNAs. J. Am. Soc. Nephrol. 2015, 26, 2349–2360. [Google Scholar] [CrossRef]
- Mentkowski, K.I.; Snitzer, J.D.; Rusnak, S.; Lang, J.K. Therapeutic Potential of Engineered Extracellular Vesicles. AAPS J. 2018, 20, 50. [Google Scholar] [CrossRef]
- Janas, T.; Janas, M.M.; Sapoñ, K.; Janas, T. Mechanisms of RNA loading into exosomes. FEBS Lett. 2015, 589, 1391–1398. [Google Scholar] [CrossRef] [PubMed]
- Wang, B.; Yao, K.; Huuskes, B.M.; Shen, H.H.; Zhuang, J.; Godson, C.; Brennan, E.P.; Wilkinson-Berka, J.L.; Wise, A.F.; Ricardo, S.D. Mesenchymal Stem Cells Deliver Exogenous MicroRNA-let7c via Exosomes to Attenuate Renal Fibrosis. Mol. Ther. 2016, 24, 1290–1301. [Google Scholar] [CrossRef]
- Sutaria, D.S.; Badawi, M.; Phelps, M.A.; Schmittgen, T.D. Achieving the promise of therapeutic extracellular vesicles: The devil is in details of therapeutic loading. Pharm. Res. 2017, 34, 1053–1066. [Google Scholar] [CrossRef] [PubMed]
- Lou, G.; Song, X.; Yang, F.; Wu, S.; Wang, J.; Chen, Z.; Liu, Y. Exosomes derived from miR-122-modified adipose tissue derived MSCs increase chemosensitivity of hepatocellular carcinoma. J. Hematol. Oncol. 2015, 8, 122. [Google Scholar] [CrossRef] [PubMed]
- Viñas, J.L.; Burger, D.; Zimpelmann, J.; Haneef, R.; Knoll, W.; Campbell, P.; Gutsol, A.; Carter, A.; Allan, D.S.; Burns, K.D. Transfer of microRNA-486-5p from human endothelial colony forming cell-derived exosomes reduces ischemic kidney injury. Kidney Int. 2016, 90, 1238–1250. [Google Scholar] [CrossRef] [PubMed]
- Bruno, S.; Grange, C.; Deregibus, M.C.; Calogero, R.A.; Saviozzi, S.; Collino, F.; Morando, L.; Busca, A.; Falda, M.; Bussolati, B.; et al. Mesenchymal stem cell-derived microvesicles protect against acute tubular injury. J. Am. Soc. Nephrol. 2009, 20, 1053–1067. [Google Scholar] [CrossRef]
- Grange, C.; Tapparo, M.; Bruno, S.; Chatterjee, D.; Quesenberry, P.J.; Tetta, C.; Camussi, G. Biodistribution of mesenchymal stem cell-derived extracellular vesicles in a model of acute kidney injury monitored by optical imaging. Int. J. Mol. Med. 2014, 33, 1055–1063. [Google Scholar] [CrossRef]
- Lindoso, R.S.; Collino, F.; Bruno, S.; Araujo, D.S.; Sant’Anna, J.F.; Tetta, C.; Provero, P.; Quesenberry, P.J.; Vieyra, A.; Einicker-Lamas, M.; et al. Extracellular vesicles released from mesenchymal stromal cells modulate miRNA in renal tubular cells and inhibit ATP depletion injury. Stem Cells Dev. 2014, 23, 1809–1819. [Google Scholar] [CrossRef] [PubMed]
- Deregibus, M.C.; Figliolini, F.; D’Antico, S.; Manzini, P.M.; Pasquino, C.; De Lena, M.; Tetta, C.; Brizzi, M.F.; Camussi, G. Charge-based precipitation of extracellular vesicles. Int. J. Mol. Med. 2016, 38, 1359–1366. [Google Scholar] [CrossRef] [PubMed]


| FC Non-Targets | FC Targets | p | Rank | |
|---|---|---|---|---|
| miR-10abc/10a-5p | 0.03 | 0.06 | 0.0313 | 1 |
| let-7/98/4458/4500 | 0.03 | 0.06 | 0.0476 | 2 |
| miR-127/127-3p | 0.03 | 0.25 | 0.0431 | 12 |
| miR-30abcdef/30abe-5p/384-5p | 0.03 | 0.07 | 0.0003 | 13 |
| miR-29abcd | 0.03 | 0.07 | 0.0047 | 24 |
| miR-192/215 | 0.03 | 0.14 | 0.0035 | 50 |
| miR-140/140-5p/876-3p/1244 | 0.03 | 0.10 | 0.0177 | 72 |
| miR-377 | 0.03 | 0.08 | 0.0203 | 96 |
| miR-202-3p | 0.03 | 0.08 | 0.0060 | 124 |
| EP1 | EP2 | EP3 | |
|---|---|---|---|
| Voltage | 990 | 1100 | 990 |
| msec | 40 | 30 | 30 |
| Pulse | 1 | 1 | 2 |
© 2019 by the authors. Licensee MDPI, Basel, Switzerland. This article is an open access article distributed under the terms and conditions of the Creative Commons Attribution (CC BY) license (http://creativecommons.org/licenses/by/4.0/).
Share and Cite
Tapparo, M.; Bruno, S.; Collino, F.; Togliatto, G.; Deregibus, M.C.; Provero, P.; Wen, S.; Quesenberry, P.J.; Camussi, G. Renal Regenerative Potential of Extracellular Vesicles Derived from miRNA-Engineered Mesenchymal Stromal Cells. Int. J. Mol. Sci. 2019, 20, 2381. https://doi.org/10.3390/ijms20102381
Tapparo M, Bruno S, Collino F, Togliatto G, Deregibus MC, Provero P, Wen S, Quesenberry PJ, Camussi G. Renal Regenerative Potential of Extracellular Vesicles Derived from miRNA-Engineered Mesenchymal Stromal Cells. International Journal of Molecular Sciences. 2019; 20(10):2381. https://doi.org/10.3390/ijms20102381
Chicago/Turabian StyleTapparo, Marta, Stefania Bruno, Federica Collino, Gabriele Togliatto, Maria Chiara Deregibus, Paolo Provero, Sicheng Wen, Peter J. Quesenberry, and Giovanni Camussi. 2019. "Renal Regenerative Potential of Extracellular Vesicles Derived from miRNA-Engineered Mesenchymal Stromal Cells" International Journal of Molecular Sciences 20, no. 10: 2381. https://doi.org/10.3390/ijms20102381
APA StyleTapparo, M., Bruno, S., Collino, F., Togliatto, G., Deregibus, M. C., Provero, P., Wen, S., Quesenberry, P. J., & Camussi, G. (2019). Renal Regenerative Potential of Extracellular Vesicles Derived from miRNA-Engineered Mesenchymal Stromal Cells. International Journal of Molecular Sciences, 20(10), 2381. https://doi.org/10.3390/ijms20102381