Quantitative Structure–Retention Relationships with Non-Linear Programming for Prediction of Chromatographic Elution Order


Abstract
:1. Introduction
2. Results and Discussion
3. Methodology
3.1. Chromatographic Experiments
3.2. QSRR Model Development
3.3. QSRR Model Validation
3.3.1. External Validation
3.3.2. Applicability Domain
3.4. Elution Order Prediction
4. Conclusions
Supplementary Materials
Author Contributions
Funding
Acknowledgments
Conflicts of Interest
References
- Kaliszan, R. QSRR: Quantitative Structure-(Chromatographic) Retention Relationships. Chem. Rev. 2007, 107, 3212–3246. [Google Scholar] [CrossRef] [PubMed]
- Kaliszan, R. Quantitative Structure-(Chromatographic)-Retention Relationships. Anal. Chem. 1992, 64, 619A–631A. [Google Scholar] [CrossRef]
- Žuvela, P.; Skoczylas, M.; Jay Liu, J.; Ba̧czek, T.; Kaliszan, R.; Wong, M.W.; Buszewski, B. Column Characterization and Selection Systems in Reversed-Phase High-Performance Liquid Chromatography. Chem. Rev. 2019, 119, 3674–3729. [Google Scholar] [CrossRef] [PubMed]
- Žuvela, P.; Alipuly, A.; Liu, J.J.; Wong, M.W.; Bączek, T. Prediction of chromatographic elution order of analytical mixtures from quantitative structure–retention relationships through multiobjective optimization. 2019; submitted for publication. [Google Scholar]
- Vorslova, S.; Golushko, J.; Galushko, S.; Viksna, A. Prediction of Reversed-Phase Liquid Chromatography Retention Parameters for Phenylisothiocyanate Derivatives of Amino Acids. Latv. J. Chem. 2014, 52, 61–70. [Google Scholar] [CrossRef]
- Shinoda, K.; Sugimoto, M.; Yachie, N.; Sugiyama, N.; Masuda, T.; Robert, M.; Soga, T.; Tomita, M. Prediction of Liquid Chromatographic Retention Times of Peptides Generated by Protease Digestion of the Escherichia coli Proteome Using Artificial Neural Networks. J. Proteome Res. 2006, 5, 3312–3317. [Google Scholar] [CrossRef] [PubMed]
- Bach, E.; Szedmak, S.; Brouard, C.; Böcker, S.; Rousu, J. Liquid-chromatography retention order prediction for metabolite identification. Bioinformatics 2018, 34, i875–i883. [Google Scholar] [CrossRef] [PubMed]
- Holland, J.H. Genetic Algorithms. Sci. Am. 1992, 267, 66–72. [Google Scholar] [CrossRef]
- Forrest, S. Genetic algorithms: principles of natural selection applied to computation. Science 1993, 261, 872–878. [Google Scholar] [CrossRef]
- Efroymson, M.A. Multiple regression analysis. In Mathematical Methods for Digital Computers; WILEY-VCH Verlag: New York, NY, USA, 1960; pp. 191–203. [Google Scholar]
- Shinoda, K.; Sugimoto, M.; Tomita, M.; Ishihama, Y. Informatics for peptide retention properties in proteomic LC-MS. Proteomics 2008, 8, 787–798. [Google Scholar] [CrossRef]
- Žuvela, P.; Macur, K.; Liu, J.J.; Bączek, T. Exploiting non-linear relationships between retention time and molecular structure of peptides originating from proteomes and comparing three multivariate approaches. J. Pharm. Biomed. Anal. 2016, 127, 94–100. [Google Scholar] [CrossRef]
- Baczek, T.; Kaliszan, R.; Novotná, K.; Jandera, P. Comparative characteristics of HPLC columns based on quantitative structure–retention relationships (QSRR) and hydrophobic-subtraction model. J. Chromatogr. A 2005, 1075, 109–115. [Google Scholar] [CrossRef] [PubMed]
- Ba̧czek, T.; Wiczling, P.; Marszałł, M.; Heyden, Y.V.; Kaliszan, R. Prediction of Peptide Retention at Different HPLC Conditions from Multiple Linear Regression Models. J. Proteome Res. 2005, 4, 555–563. [Google Scholar] [CrossRef] [PubMed]
- Foster, J.P.; Weinhold, F. Natural hybrid orbitals. J. Am. Chem. Soc. 1980, 102, 7211–7218. [Google Scholar] [CrossRef]
- Reed, A.E.; Curtiss, L.A.; Weinhold, F. Intermolecular interactions from a natural bond orbital, donor-acceptor viewpoint. Chem. Rev. 1988, 88, 899–926. [Google Scholar] [CrossRef]
- Kohn, W.; Sham, L.J. Self-consistent equations including exchange and correlation effects. Phys. Rev. 1965, 140, 1133–1138. [Google Scholar] [CrossRef]
- Yu, H.S.; He, X.; Li, S.L.; Truhlar, D.G. MN15: A Kohn–Sham global-hybrid exchange–correlation density functional with broad accuracy for multi-reference and single-reference systems and noncovalent interactions. Chem. Sci. 2016, 7, 5032–5051. [Google Scholar] [CrossRef] [PubMed]
- Rassolov, V.A.; Ratner, M.A.; Pople, J.A.; Redfern, P.C.; Curtiss, L.A. 6-31G*basis set for third-row atoms. J Comput Chem 2001, 22, 976–984. [Google Scholar] [CrossRef]
- Marenich, A.V.; Cramer, C.J.; Truhlar, D.G. Universal Solvation Model Based on Solute Electron Density and on a Continuum Model of the Solvent Defined by the Bulk Dielectric Constant and Atomic Surface Tensions. J. Phys. Chem. B 2009, 113, 6378–6396. [Google Scholar] [CrossRef]
- Kennard, R.W.; Stone, L.A. Computer Aided Design of Experiments. Technometrics 1969, 11, 137–148. [Google Scholar] [CrossRef]
- Žuvela, P.; Liu, J.J.; Macur, K.; Bączek, T. Molecular Descriptor Subset Selection in Theoretical Peptide Quantitative Structure–Retention Relationship Model Development Using Nature-Inspired Optimization Algorithms. Anal. Chem. 2015, 87, 9876–9883. [Google Scholar] [CrossRef]
- Taraji, M.; Haddad, P.R.; Amos, R.I.J.; Talebi, M.; Szucs, R.; Dolan, J.W.; Pohl, C.A. Error measures in quantitative structure–retention relationships studies. J. Chromatogr. A 2017, 1524, 298–302. [Google Scholar] [CrossRef] [PubMed]
- Žuvela; David; Yang; Huang; Wong Non-Linear Quantitative Structure–Activity Relationships Modelling, Mechanistic Study and In-Silico Design of Flavonoids as Potent Antioxidants. Int. J. Mol. Sci. 2019, 20, 2328. [CrossRef] [PubMed]
- Potra, F.A.; Wright, S.J. Interior-point methods. J. Comput. Appl. Math. 2000, 124, 281–302. [Google Scholar] [CrossRef] [Green Version]
- Wright, M.H. The interior-point revolution in optimization: History, recent developments, and lasting consequences. Bull. Am. Math. Soc. 2004, 42, 39–57. [Google Scholar] [CrossRef]


| Statistics | %RMSE(tR) MLR | %RMSE(tR) MLR-NLP |
|---|---|---|
| Mean | 26.635 | 36.848 |
| Variance | 135.67 | 490.97 |
| Observations | 19 | 19 |
| Pearson Correlation | 0.961 | |
| Df | 18 | |
| t Stat | −3.897 | |
| P(T<=t) one-tail | 0.00053 | |
| t Critical one-tail | 1.734 | |
| P(T<=t) two-tail | 0.00106 | |
| t Critical two-tail | 2.100 |
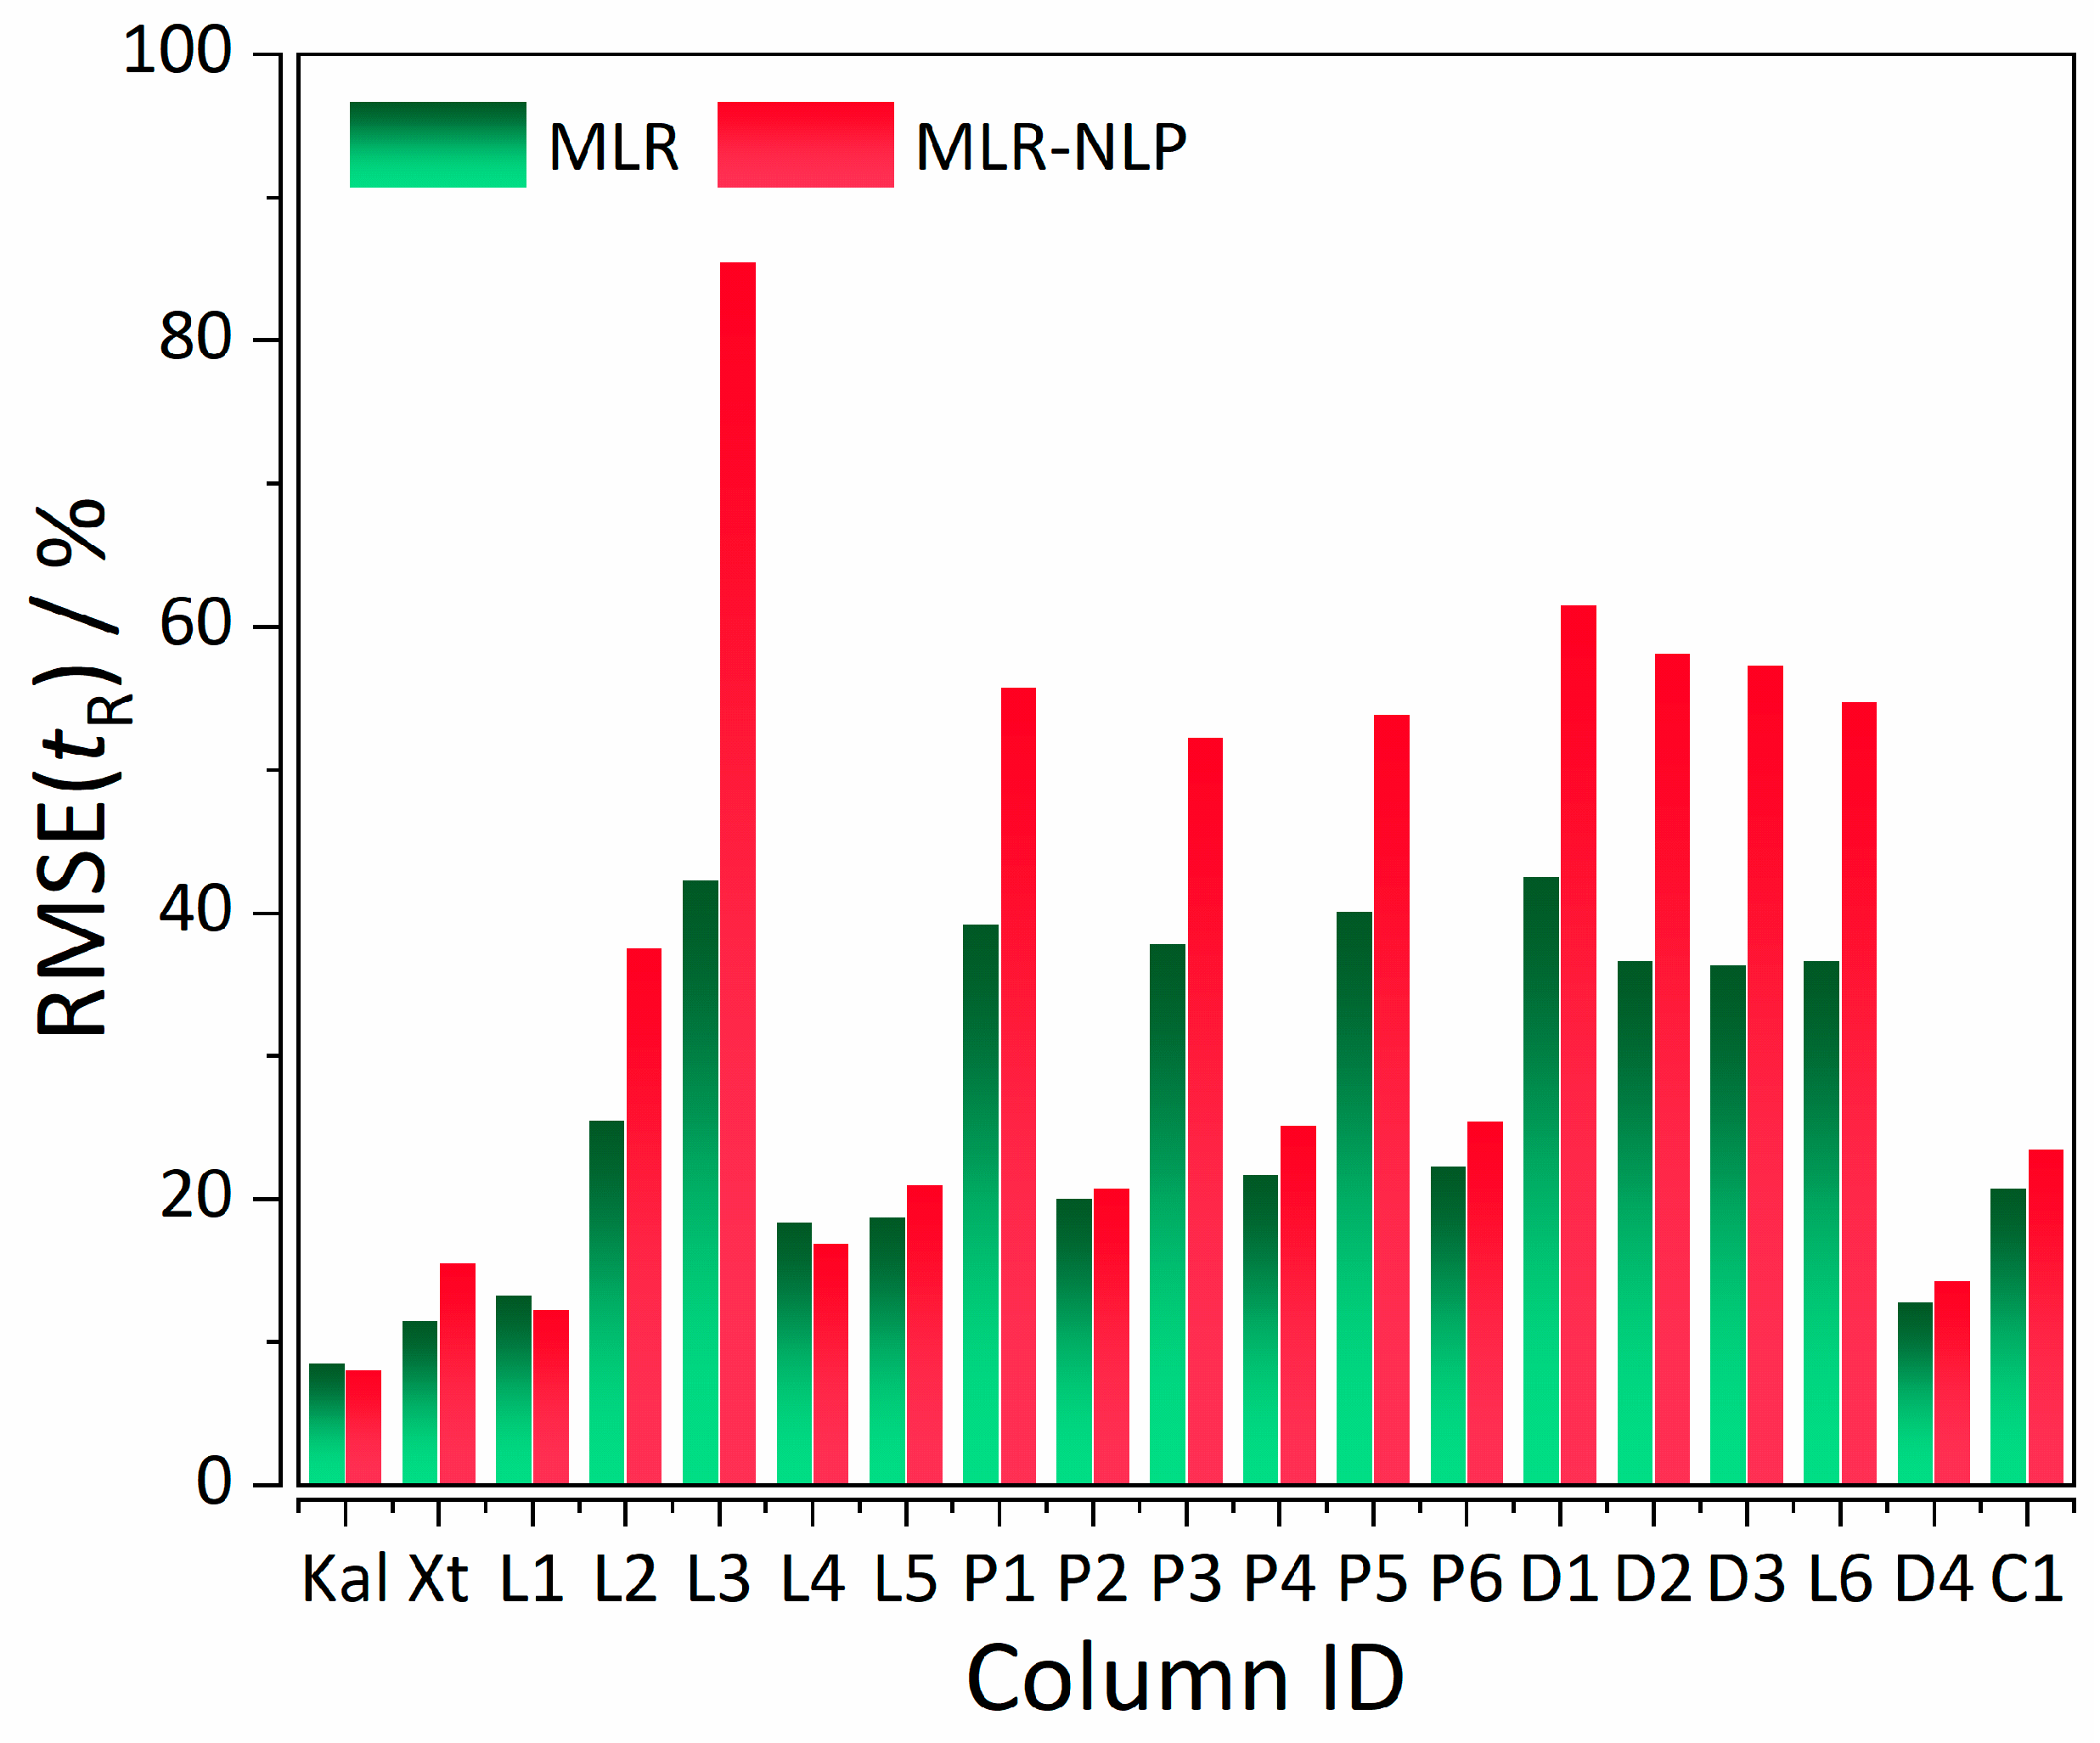
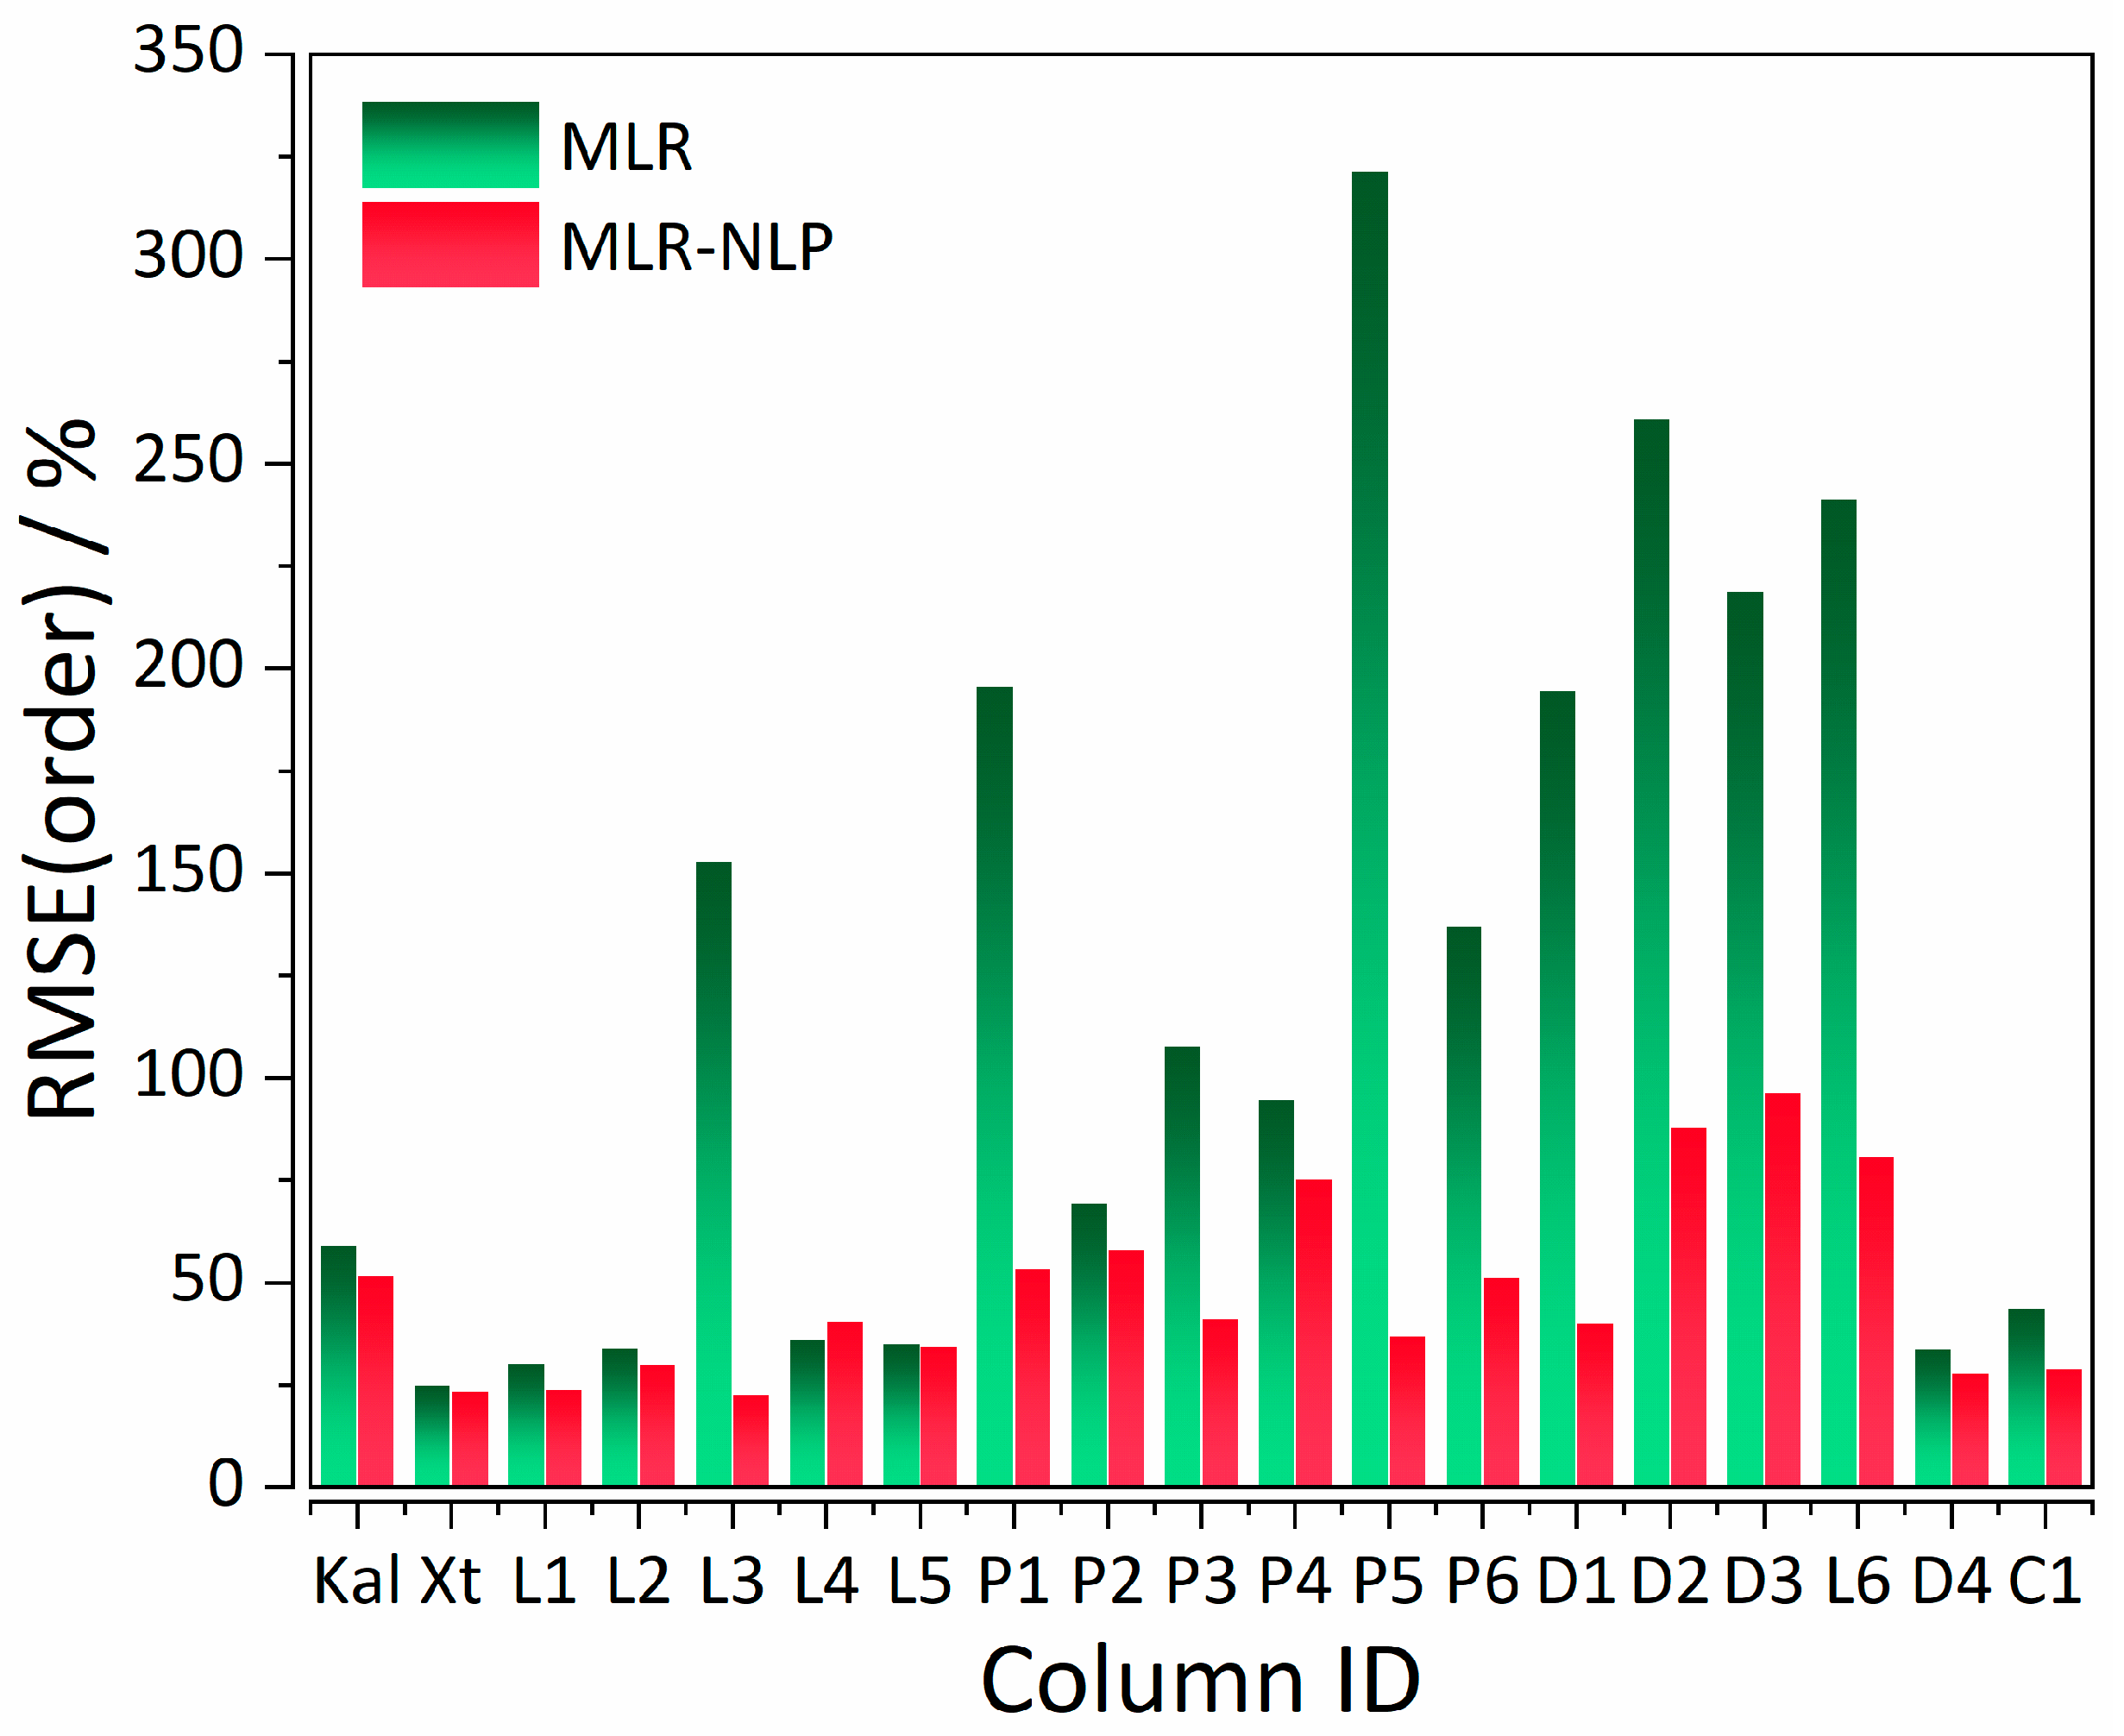
| CS a | Column | Analysis Parameters b | Model | %RMSE(tR) | %RMSE(order) |
|---|---|---|---|---|---|
| I | Supelcosil | tG = 10 min, T = 35 °C | MLR (control) | 8.57 | 59.07 |
| MLR-NLP | 8.07 | 51.77 | |||
| II | Xterra | tG = 20 min, T = 40 °C | MLR (control) | 11.50 | 25.01 |
| MLR-NLP | 15.17 | 22.40 | |||
| II | Licrospher | tG = 20 min, T = 40 °C | MLR (control) | 13.25 | 30.28 |
| MLR-NLP | 12.42 | 39.59 | |||
| II | Licrospher | tG = 60 min, T = 40 °C | MLR (control) | 25.60 | 34.11 |
| MLR-NLP | 37.94 | 30.10 | |||
| II | Licrospher | tG = 120 min, T = 40 °C | MLR (control) | 42.31 | 153.00 |
| MLR-NLP | 85.62 | 25.17 | |||
| II | Licrospher | tG = 20 min, T = 60 °C | MLR (control) | 18.45 | 36.12 |
| MLR-NLP | 16.86 | 40.70 | |||
| II | Licrospher | tG = 20 min, T = 80 °C | MLR (control) | 18.82 | 35.25 |
| MLR-NLP | 21.06 | 34.65 | |||
| II | Licrospher | tG = 20 min, T = 40 °C | MLR (control) | 39.28 | 195.82 |
| MLR-NLP | 55.53 | 53.45 | |||
| II | PRP | tG = 20 min, T = 40 °C | MLR (control) | 20.07 | 69.44 |
| MLR-NLP | 20.72 | 58.09 | |||
| II | PRP | tG = 60 min, T = 40 °C | MLR (control) | 37.92 | 107.94 |
| MLR-NLP | 52.40 | 41.33 | |||
| II | PRP | tG = 20 min, T = 60 °C | MLR (control) | 21.75 | 94.97 |
| MLR-NLP | 24.06 | 82.54 | |||
| II | PRP | tG = 60 min, T = 60 °C | MLR (control) | 40.11 | 321.65 |
| MLR-NLP | 54.35 | 37.16 | |||
| II | PRP | tG = 20 min, T = 80 °C | MLR (control) | 22.36 | 137.16 |
| MLR-NLP | 26.19 | 53.30 | |||
| II | PRP | tG = 60 min, T = 80 °C | MLR (control) | 42.60 | 194.56 |
| MLR-NLP | 61.56 | 40.18 | |||
| II | Discovery | tG = 20 min, T = 40 °C | MLR (control) | 36.73 | 261.22 |
| MLR-NLP | 58.07 | 91.81 | |||
| II | Discovery | tG = 20 min, T = 60 °C | MLR (control) | 36.37 | 219.01 |
| MLR-NLP | 57.16 | 96.70 | |||
| II | Discovery | tG = 20 min, T = 80 °C | MLR (control) | 36.74 | 241.63 |
| MLR-NLP | 54.75 | 81.05 | |||
| II | Discovery | tG = 20 min, T = 40 °C | MLR (control) | 12.81 | 34.00 |
| MLR-NLP | 13.84 | 28.12 | |||
| II | Chromolith | tG = 20 min, T = 40 °C | MLR (control) | 20.82 | 43.81 |
| MLR-NLP | 24.36 | 28.55 |
© 2019 by the authors. Licensee MDPI, Basel, Switzerland. This article is an open access article distributed under the terms and conditions of the Creative Commons Attribution (CC BY) license (http://creativecommons.org/licenses/by/4.0/).
Share and Cite
Liu, J.J.; Alipuly, A.; Bączek, T.; Wong, M.W.; Žuvela, P. Quantitative Structure–Retention Relationships with Non-Linear Programming for Prediction of Chromatographic Elution Order. Int. J. Mol. Sci. 2019, 20, 3443. https://doi.org/10.3390/ijms20143443
Liu JJ, Alipuly A, Bączek T, Wong MW, Žuvela P. Quantitative Structure–Retention Relationships with Non-Linear Programming for Prediction of Chromatographic Elution Order. International Journal of Molecular Sciences. 2019; 20(14):3443. https://doi.org/10.3390/ijms20143443
Chicago/Turabian StyleLiu, J. Jay, Alham Alipuly, Tomasz Bączek, Ming Wah Wong, and Petar Žuvela. 2019. "Quantitative Structure–Retention Relationships with Non-Linear Programming for Prediction of Chromatographic Elution Order" International Journal of Molecular Sciences 20, no. 14: 3443. https://doi.org/10.3390/ijms20143443