Abstract
Peroxidases play prominent roles in antioxidant responses and stress tolerance in plants; however, their functions in soybean tolerance to salt stress remain unclear. Here, we investigated the role of a peroxidase gene from the wild soybean (Glycine soja), GsPRX9, in soybean tolerance to salt stress. GsPRX9 gene expression was induced by salt treatment in the roots of both salt-tolerant and -sensitive soybean varieties, and its relative expression level in the roots of salt-tolerant soybean varieties showed a significantly higher increase than in salt-sensitive varieties after NaCl treatment, suggesting its possible role in soybean response to salt stress. GsPRX9-overexpressing yeast (strains of INVSc1 and G19) grew better than the control under salt and H2O2 stress, and GsPRX9-overexpressing soybean composite plants showed higher shoot fresh weight and leaf relative water content than control plants after NaCl treatment. Moreover, the GsPRX9-overexpressing soybean hairy roots had higher root fresh weight, primary root length, activities of peroxidase and superoxide dismutase, and glutathione level, but lower H2O2 content than those in control roots under salt stress. These findings suggest that the overexpression of the GsPRX9 gene enhanced the salt tolerance and antioxidant response in soybean. This study would provide new insights into the role of peroxidase in plant tolerance to salt stress.
1. Introduction
Soil salinization is an important abiotic factor affecting agricultural production and the environment [1]. Soil salinization can cause decreased soil osmotic potential, ion imbalance, disrupted physiological processes, and inhibited growth and development of plants, leading to reduced crop quality and yield, and even plant death in areas with severe salt–alkali stress [1,2]. Plants adapt to salt stress by three main mechanisms: osmotic stress tolerance, ion exclusion, and tissue tolerance [1]. Soybean plants experience two stages of salt stress: in the early stage, the young leaves of soybean seedlings wilt due to water loss in the initial few hours of salt stress; then soybean plants produce molecular substances that participate in osmotic regulation to help the wilted leaves recover [2]. In the second stage, Na+ accumulation affects photosynthesis and damages the leaves [1,2,3]. Soybean tolerance to salt stress is controlled by multiple genes. Overexpression of GmCHX1 improved salt tolerance by regulating Na+/K+ balance in soybeans under salt stress [3]. A salt-responsive gene, GmPIP1;6, may be a multifunctional aquaporin involved in root water transport [4]. Overexpression of GmbZIP1 enhanced plant tolerance to salt stress [5]. More genes related to salt tolerance in soybeans need to be discovered.
Peroxidases with different structures play various roles in diverse organisms [6,7]. Phylogenetically, the peroxidases fall into three classes (class I–III) of proteins [6,8]. Class I peroxidases, including cytochrome-c peroxidases (CcPs), catalase peroxidases (CPs), ascorbate peroxidases (APxs), and the hybrid APx–CcPs, are the most abundant peroxidases in plants, fungi, and prokaryotes [7,9]. These peroxidases are not glycosylated and do not have signal peptides, calcium ions, or disulfide bridges [9]. Class II peroxidases are fungal secretory peroxidases, primarily comprising lignin peroxidases (LiPs), manganese-dependent peroxidases (MnPs), versatile peroxidases (VPs), and other secreted fungal heme peroxidases [10,11]. Class III peroxidases (Prxs), are a group of secretory glycoproteins that have been found in all green plants [8,12].
Prxs are classical peroxidases and play key roles in many plant physiological functions, either by forming stable plant structures or by adapting the organisms to a more oxygenated environments [13,14]. Prxs have been confirmed to catalyze hydrogen peroxide (H2O2) oxidoreduction by transferring electrons from various donor molecules [12,15,16,17]. Due to their nonspecific reactions with different hydrogen donors, Prxs participate in diverse plant processes [15,16,18] such as auxin metabolism [19], lignin biosynthesis [12], suberin metabolism [20], cell wall elongation [21], seed coat mucilage extrusion [22], stress tolerance [23], testa/endosperm rupture [24], and pathogen defense [25]. Overexpression of AtPRX3 enhanced plant salt tolerance [23]. AtPRX17 affected the lignin and xylan accumulation in the cell wall via reactive oxygen species (ROS) signaling [12]. A recent study suggests that some Prxs were involved in housekeeping functions to scavenge ROS and H2O2 in rice [26].
In our previous transcriptomic study (unpublished) using a salt-tolerant wild soybean variety, we identified a salt-responsive gene (corresponding to Glyma.14g070800 in the reference genome of soybean variety Williams 82), which encodes a Class III peroxidase, and is designated as GsPRX9. Here we investigate the role of GsPRX9 in salt tolerance by comparing the relative expression level of GsPRX9 gene in salt-tolerant and -sensitive soybean varieties, and overexpression of GsPRX9 in soybean hairy roots, composite plants and yeast (strains of INVSc1 and G19), respectively. The salt tolerance mechanism of GsPRX9 was investigated by analyzing the activities of peroxidase (POD), superoxide dismutase (SOD), H2O2 content, glutathione (GSH) level, and the expression levels of potential oxidation-reduction related genes in GsPRX9-overexprssing soybean hairy roots under salt stress, to demonstrate its positive roles in scavenging ROS under salt stress. This study aims to provide new insights into the role of Prxs in soybean tolerance to salt stress and the possible underlying mechanisms.
2. Results
2.1. Molecular Characteristics of GsPRX9
The coding sequence (CDS) of GsPRX9 from the wild soybean (G. soja) in this study was found to be identical to the sequence of Glyma.14g070800 from the soybean reference genome (https://phytozome.jgi.doe.gov/pz/portal.html), which is 1035 bp in length and encodes 344 amino acids with a peroxidase domain consisting of 247 amino acids. Phylogenetic analysis of soybean PRX9, together with the 159 seed sequences (with 201 to 350 amino acids in length) of the peroxidases protein superfamily (Table S1), was performed. According to the functional annotation (Table S2) and classification [8] of the peroxidases superfamily, these 160 proteins were grouped into three classes (Figure 1). GsPRX9 was classified into the Class III peroxidases (Prxs).
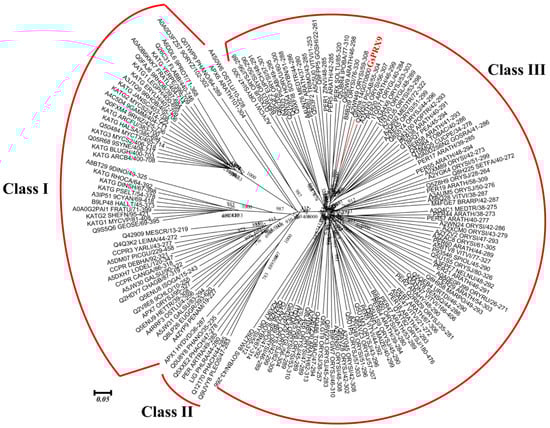
Figure 1.
Phylogenetic tree of the 159 seed sequences of peroxidases superfamily and GsPRX9. The 159 seed sequences of peroxidases protein superfamily were downloaded from PFAM and the protein sequence of soybean PRX9 was downloaded from the Phytozome database. Unrooted phylogenetic tree was constructed using MEGA6.0 based on the Maximum Likelihood (ML) algorithm with 1000 bootstraps.
2.2. Relative Expression of GsPRX9 in Response to NaCl in Salt-Tolerant and -Sensitive Soybean Varieties
After seven days of 180 mM NaCl stress, the phenotypic difference between the four soybean varieties was obvious (Figure 2A): the leaves of Tianlong1 and “LY01-06” became yellow and dead, and therefore are salt-sensitive soybean varieties; the leaves of “LY16-08” and “LY01-10” were still green and normal, and so belong to salt-tolerant soybean varieties. The relative expression levels of GsPRX9 in response to salt stress (180 mM NaCl) in these four soybean varieties were investigated using qRT-PCR. GsPRX9 gene expression was induced by 180 mM NaCl treatment in the roots of all soybean varieties (Figure 2B). The relative expression level of GsPRX9 gene in the roots of “LY16-08” (salt-tolerant) showed a significantly (p < 0.05 by Duncan’s multiple range test) greater increase at 9 and 12 h after salt treatment than the two salt-sensitive soybean varieties, and there was significantly (p < 0.05 by Duncan’s multiple range test) greater upregulation in the roots of “LY01-10” (salt-tolerant) at 6 and 12 h in response to salt stress than the two salt-sensitive soybean varieties. These results suggested that GsPRX9 might play important roles in the soybean response to salt stress.
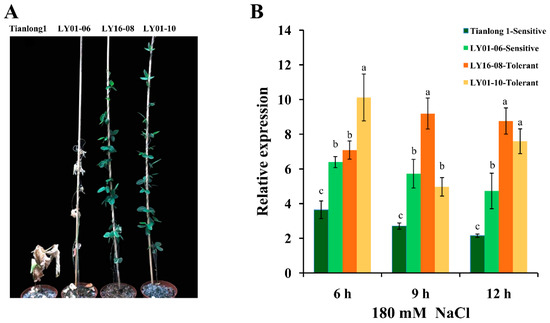
Figure 2.
Phenotype and relative expression of GsPRX9 in the roots of four soybean varieties under salt stress. (A) Phenotypes of four soybean varieties at seven days after 180 mM NaCl stress. (B) Relative expression of GsPRX9 in response to salt stress. Soybean seedlings were treated with 0 or 180 mM NaCl for 6 h, 9 h, and 12 h and the root samples were collected. Roots receiving 0 mM NaCl treatment at each time point were used as controls. Data represent mean and standard deviation of three repeats (n = 3). Data with the same letters in lowercases (a, b, and c) above bars indicate no significant differences at the 0.05 level between soybean varieties at each time point according to Duncan’s multiple range test.
2.3. Overexpression of GsPRX9 Improved Yeast Tolerance to NaCl and H2O2 Stress
The growth characteristics of yeast (strains of INVSc1 and G19), containing pYES2-GsPRX9 plasmid or pYES2 empty vector, respectively, on a yeast extract-peptone–dextrose (YPD) medium with different concentrations of NaCl (0, 0.5, 0.8, and 1 M) or H2O2 (0, 3, 3.2, and 3.4 mM) were compared. There was no obvious difference between the yeast containing pYES2-GsPRX9 and the yeast with pYES2 empty vector on normal (0 M NaCl and 0 mM H2O2) YPD medium (Figure 3). The pYES2-GsPRX9-transformed INVSc1 yeast grew better than the pYES2 empty-vector-transformed INVSc1 yeast on a YPD medium containing 0.5 or 0.8 M NaCl (Figure 3A). In addition, when the salt-sensitive yeast mutant G19 was used, pYES2-GsPRX9-transformed yeast showed better growth than the pYES2 empty-vector-transformed G19 yeast on YPD containing 0.5, 0.8, or 1 M NaCl (Figure 3A). Under H2O2 stress, pYES2-GsPRX9-transformed yeast (strains of INVSc1 and G19) exhibited better growth than the pYES2 empty-vector-transformed yeast (Figure 3B). These results revealed that overexpression of GsPRX9 improved the tolerance of INVSc1 and G19 yeasts to NaCl and H2O2 stress.
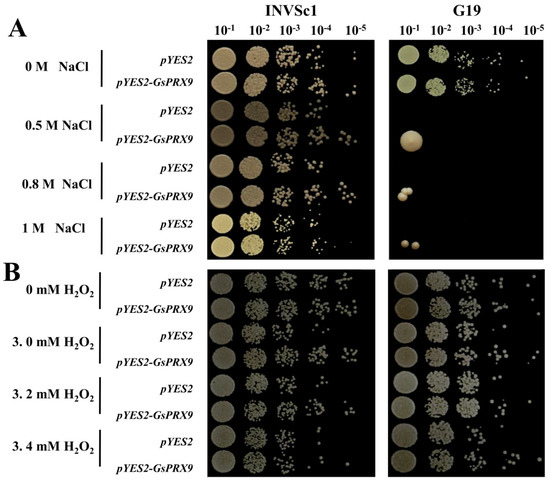
Figure 3.
Effect of GsPRX9 overexpression on the tolerance of yeast strains of INVSc1 and G19 to salt (A) and H2O2 (B) stress. pYES2 represents the yeast with empty vector and pYES2–GsPRX9 represents the yeast overexpressing GsPRX9. Photos were taken after 72 h of incubation at 30 °C. The dilution rates of YPD medium containing the yeast transformants were 10−1, 10−2, 10−3, 10−4, and 10−5.
2.4. GsPRX9-Overexpressing Soybean Composite Plants Showed Better Tolerance to NaCl Stress
The transgenic soybean composite plants were obtained by Agrobacterium rhizogenes K599-mediated transformation of pBinGFP4–GsPRX9 or pBinGFP4 (empty vector, containing the green fluorescence protein, GFP) into soybean hypocotyls, to investigate the effect of GsPRX9 overexpression on the salt tolerance of soybean plants. The positive transgenic soybean composite plants (indicated by green fluorescence, Figure 4A) overexpressing GsPRX9 or the empty vector pBinGFP4 with similar root length and root volume were treated with 0 or 100 mM NaCl for seven days. The composite plants showed better growth under 0 mM NaCl than those under 100 mM NaCl treatment (Figure 4B). Under 100 mM NaCl treatment, the soybean composite plants with GsPRX9 overexpression showed better growth than composite plants with the empty vector pBinGFP4 (Figure 4B and Figure S1A–C). The average shoot fresh weight and leaf relative water content of GsPRX9-overexpressing soybean composite plants were significantly (p < 0.01 by t-test) higher than those of composite plants with the empty vector under 100 mM NaCl treatment (Figure 4C,D and Figure S1D–I). No significant differences (p > 0.05 by t-test) were found in shoot fresh weight and leaf relative water content between GsPRX9-overexpressing plants and plants with empty vector under normal condition (0 mM NaCl). These results demonstrated that overexpression of GsPRX9 could improve the tolerance of soybean plants to salt stress.
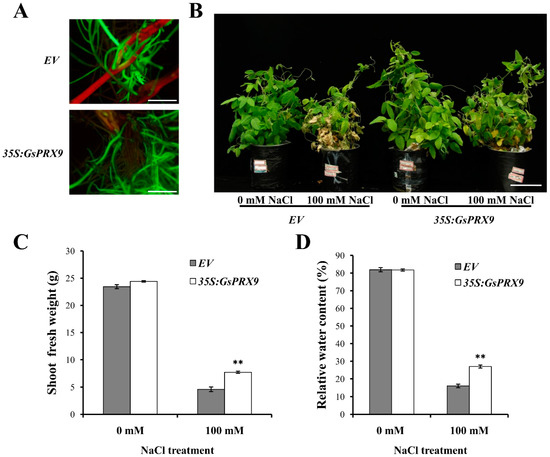
Figure 4.
Salt tolerance analyses of transgenic soybean composite plants. (A) Identification of positive transgenic soybeans by green fluorescence using a stereoscopic fluorescence microscope. Bar = 1 cm. (B–D) Phenotype, shoot fresh weight, and leaf relative water content of transgenic soybean composite plants under 0 mM or 100 mM NaCl for seven days, respectively. Bar = 5 cm. EV represents plants with the empty vector pBinGFP4 and 35S:GsPRX9 represents plants with the recombinant vector pBinGFP4–GsPRX9 (GsPRX9 was expressed in fusion with GFP, driven by a CaMV 35S promoter). Data represent the mean ± standard deviation of three biological replications and each repeat contained 10 independent transgenic plants (n = 3 × 10 = 30). ** represents significant difference between EV and 35S:GsPRX9 under the same conditions at the 0.01 level by Student’s t-test.
2.5. Overexpression of GsPRX9 Enhanced the Salt Tolerance of Soybean Hairy Roots
To further confirm the effect of GsPRX9 overexpression on salt tolerance of soybean, we transformed soybean cotyledons with A. rhizogenes K599 containing pBinGFP4-GsPRX9 plasmid or the empty vector pBinGFP4. After 14 days of 150 mM NaCl treatment, the soybean hairy roots overexpressing GsPRX9 showed better growth than the control (hairy roots transformed by the empty vector pBinGFP4; Figure 5A,B and Figure S2A–D). In comparison with the hairy roots transformed by the empty vector, the fresh weight of GsPRX9-overexpressing soybean hairy roots was significantly (p < 0.01 by t-test) higher under 150 mM NaCl treatment (Figure 5C and Figure S2E–H), while no significant difference (p > 0.05 by t-test) was observed under 0 mM NaCl conditions.
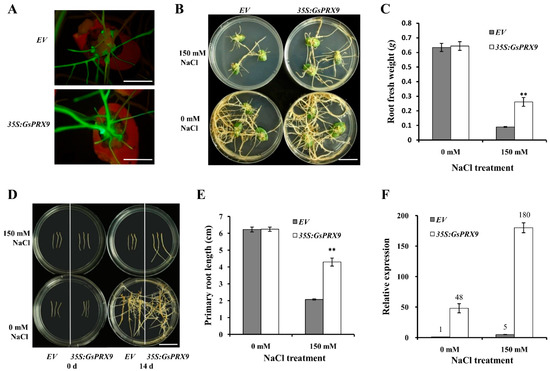
Figure 5.
Salt tolerance analyses of transgenic soybean hairy roots. (A) Identification of positive transgenic soybean hairy roots by green fluorescence using a stereoscopic fluorescence microscope. Bar = 1 cm. (B,C) Phenotype and root fresh weight of transgenic soybean cotyledon hairy roots receiving 0 or 150 mM NaCl treatment for 14 days, respectively. Bar = 1 cm. (D,E) Phenotype and primary root length of re-generated transgenic soybean hairy roots under 0 or 150 mM NaCl treatment for 14 days, respectively. Bar = 1 cm. (F) The relative expression level of GsPRX9 in transgenic soybean hairy roots at 24 h after 0 or 150 mM NaCl treatment. EV represents roots with the empty vector pBinGFP4, and 35S:GsPRX9 represents roots with the recombinant vector pBinGFP4-GsPRX9 (GsPRX9 was expressed in fusion with GFP, driven by a CaMV 35S promoter). The relative expression level of GsPRX9 in transgenic soybean hairy roots was in comparison to that in soybean hairy roots containing the empty vector under 0 mM NaCl (control). Data represent the mean ± standard deviation of four biological replications and each repeat contained at least three independent transgenic hairy roots (n ≥ 12). ** represents significant difference between EV and 35S:GsPRX9 under the same condition at the 0.01 level by Student’s t-test.
Furthermore, we investigated the effect of GsPRX9 overexpression on the re-generated soybean hairy roots in response to salt stress. Root tips of 3 cm in length were cut off from the positive hairy roots with pBinGFP4-GsPRX9 or pBinGFP4, respectively, and transferred on the medium containing 0 mM or 150 mM NaCl to grow for 14 days (Figure 5D and Figure S3A–D). The average primary root length of soybean hairy roots overexpressing GsPRX9 was significantly (p < 0.01 by t-test) longer than that of the hairy roots containing the pBinGFP4 empty vector grown on a medium containing 150 mM NaCl (Figure 5E and Figure S3E–H), but no obvious difference was observed for soybean hairy roots grown on a medium containing 0 mM NaCl. By qRT-PCR, we confirmed that the relative expression level of GsPRX9 in soybean hairy roots transformed by pBinGFP4-GsPRX9 was much higher than the level in soybean hairy roots transformed by a pBinGFP4 empty vector, under either 0 or 150 mM NaCl treatment (Figure 5F and Figure S3I–L). These results suggest that overexpression of GsPRX9 enhanced the salt tolerance of soybean hairy roots.
2.6. Overexpression of GsPRX9 Enhanced the Antioxidant Response in Soybean Hairy Roots
The annotation of GsPRX9 suggests it is involved in the oxidation–reduction process and the response to oxidative stress, and overexpression of GsPRX9 gene enhanced the salt tolerance of soybean hairy roots; therefore, we proposed that overexpression of GsPRX9 might enhance the antioxidant responses of soybean hairy roots under salt stress. To investigate this, we measured the content of H2O2 (Figure 6A and Figure S4A–D), the activity of POD (Figure 6B and Figure S4E–H), the activity of SOD (Figure 6C and Figure S4I–L), and the GSH level (Figure 6D and Figure S4M–P) in transgenic soybean hairy roots at 0 h, 6 h, 12 h, 1 d (day), 2 d, 3 d, 5 d, and 7 d after 150 mM NaCl treatment. The H2O2 content increased rapidly with the duration of salt stress at early time points, and reached a peak at 12 h, then decreased during 12 h to 2 d of salt stress, and remained relative low levels after 2 d (Figure 6A). Correspondingly, the POD activity also increased rapidly at early time points (6 h) and reached a peak at 12 h or 1 d, following with relatively stable levels after 1 d until the end of the experiment (Figure 6B). The SOD activity showed a relatively steady increase after salt stress and reached a peak at 3 d, then decreased after 3 d (Figure 6C). The GSH level peaked at 12 h after salt treatment (Figure 6D). As expected, we found that GsPRX9-overexpressing soybean hairy roots had lower H2O2 content (Figure 6A and Figure S4A–D), but higher POD and SOD activity, as well as higher GSH level than those in the soybean hairy roots with the empty vector pBinGFP4 (Figure 6B–D and Figure S4E–P). The above results suggest that GsPRX9 participates in the ROS scavenging process, and overexpression of GsPRX9 can improve the activities of POD and SOD, and the GSH level, thus enhancing the antioxidant response and salt tolerance of soybean hairy roots by manipulating the ROS balance during salt stress.
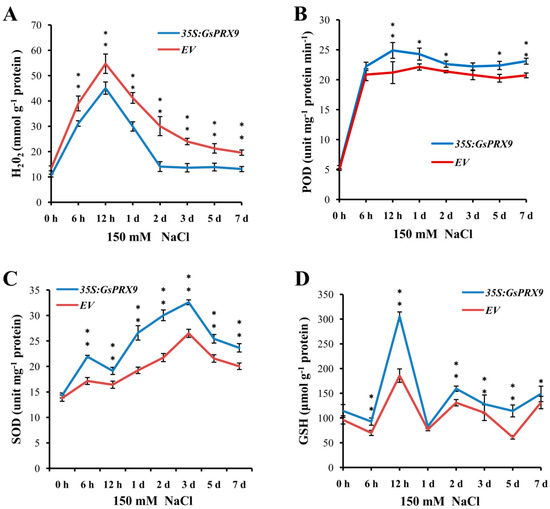
Figure 6.
Effect of GsPRX9 overexpression on H2O2 content (A), POD activity (B), SOD activity (C), and GSH level (D) in transgenic soybean hairy roots under salt stress. EV represents soybean hairy roots with the empty vector pBinGFP4, and 35S:GsPRX9 represents roots with the recombinant vector pBinGFP4–GsPRX9 (GsPRX9 was expressed in fusion with GFP, driven by a CaMV 35S promoter). The content of hydrogen peroxide (H2O2), activity of peroxidase (POD), superoxide dismutase (SOD), and glutathione level (GSH) in soybean hairy roots were measured at 0 h, 6 h, 12 h, 1 d, 2 d, 3 d, 5 d, and 7 d after 150 mM NaCl treatment. Data represent the mean ± standard deviation of four biological replications and each repeat contained three independent transgenic hairy roots (n = 4 × 3 = 12). * and ** represents a significant difference between EV and 35S:GsPRX9 for each time point at the 0.05 or 0.01 level by Student’s t-test, respectively.
3. Discussion
3.1. GsPRX9 Overexpression Can Improve the Tolerance of Yeasts and Soybeans to NaCl Stress
Plant growth and development may be influenced by biotic and abiotic stresses, such as insects, drought, cold, and high salinity [27]. In this study, a peroxidase gene from the wild soybean, GsPRX9, was found to be involved in the salt tolerance of soybean. GsPRX9 expression can be induced by NaCl treatment (Figure 2), suggesting its possible role in soybean tolerance to salt stress. In order to quickly test if GsPRX9 plays a role in salt tolerance, we overexpressed GsPRX9 in yeasts. Yeasts have been used to study the functions of plant genes in salt tolerance [28,29]. Overexpression of GmCLC1 can enhance the survival rate of yeast gef1 mutant with different chloride salts (MnCl2, KCl, NaCl) [28]. Yeast overexpressing OsLOL5 exhibited better growth than yeast transformed with the empty vector pYES2 [29]. In this work, GsPRX9-overexpressing yeasts grew better than yeasts transformed by the empty vectors under NaCl and H2O2 (Figure 3). Therefore, GsPRX9 overexpression can enhance yeast (strains of INVSc1 and G19) tolerance to salt and H2O2 stress.
Next, we confirmed the effect of GsPRX9 on salt tolerance in soybean hairy roots. Plant roots have evolved various defense mechanisms against salt stress at morphological, physiological and molecular levels, such as root architecture adaptation, osmotic adjustment, enhancement of antioxidant defense, maintenance of cell membrane stability, and expression of salt responsive genes and proteins [30,31,32,33,34,35]. Therefore, soybean hairy roots can be used to further verify the gene functions in salt tolerance. In a previous study, PgTIP1 overexpressing soybean hairy roots displayed superior salt tolerance compared to the empty-vector-transformed ones [36]. In this study, we employed soybean hairy roots to investigate the role of GsPRX9 in salt tolerance (Figure 5 and Figure S2). We found that overexpression of GsPRX9 in soybean hairy roots increased the root fresh weight (Figure 5C and Figure S2E–H) and primary root length (Figure 5D,E and Figure S3A–H). GsPRX9 overexpression can also protect the shoots from salt damage as demonstrated by the transgenic soybean composite plants (Figure 4 and Figure S1). Taken together, these results revealed that overexpression of GsPRX9 gene enhanced the salt tolerance of soybean hairy roots and composite plants.
3.2. GsPRX9 Mediates the ROS Regulation Network
ROS plays a critical role in different plant species [37,38]. Prxs have the interesting capacity to both scavenge and produce ROS [39]. Increased ROS/H2O2 detoxification and osmotic adjustment in plants improved their tolerance to abiotic stresses [34,40,41,42,43]. It has been reported that class III peroxidases function as ROS regulators, co-localized with ROS production at the germination stage of Arabidopsis thaliana, and notably AtPRX07, are involved in controlling the H2O2 concentration [39]. OsPrx24 functions as a ROS scavenger and is highly expressed in guard cells [26].
In our present study, lower H2O2 content (Figure 6A and Figure S4A–D), higher activities of POD (Figure 6B and Figure S4E–H) and SOD (Figure 6C and Figure S4I–L), and a higher GSH level were observed in GsPRX9 overexpressing soybean hairy roots compared with soybean hairy roots transformed by the empty vector. POD and SOD are protective enzymes in organisms and play important roles in scavenging free radicals. SOD can convert O2− to H2O2 [44,45], and POD removes H2O2 to generate H2O [46,47,48,49]. As a non-enzymatic antioxidant, GSH can also eliminate free radicals to protect plants from ROS damage [50]. The synergistic action of these molecules can maintain free radicals at a low level to avoid membrane damage and protect cells [46]. Thus, our results indicated that overexpression of GsPRX9 could increase the activities of SOD and POD, and the GSH level, to enhance ROS scavenging capability when exposed to salt stress, which ultimately improves salt tolerance. In addition, other known antioxidant enzymes such as ascorbate peroxidase (APX), catalase (CAT), glutathione peroxidase (GPX), mono-dehydroascorbate reductase (MDHAR), dehydroascorbate reductase (DHAR), glutathione reductase (GR), and glutathione S-transferase (GST), could work together to detoxify ROS [51].
Although the regulation network of oxidative balance is complicated, H2O2 is known as the key signaling molecule [52]. GsPRX9 overexpressing soybean hairy roots can ultimately reduce the H2O2 content to protect soybean roots from ROS damage, probably through a complex antioxidant machinery in addition to the increased activities of SOD and POD, and the GSH level. It is interesting that, based on protein-protein interaction network analyses, GsPRX9 might interact with 10 other proteins (Figure S5), with five of them annotated as involved in the oxidation-reduction process (GO: 0055114) and two annotated as involved in the response to oxidative stress (GO: 0006979) (Table S3). The genes encoding these interacting proteins might be co-expressed with GsPRX9 at the transcriptional level. Therefore, we performed qRT-PCR to determine the relative expression of these seven genes that might be related to oxidation–reduction or response to oxidative stress, including four CAD (encoding cinnamyl-alcohol dehydrogenase) genes, two PAL (encoding phenylalanine ammonia-lyase) genes, and one FAH (encoding Ferulate-5-hydroxylase) gene. The relative expression level of GsCAD9-14g, GsCAD9-17g, and GsCAD at 12 h and GsCAD9-17g, GsPAL-19g, GsCAD4, and GsPAL-20g at 24 h after salt treatment in the roots of GsPRX9-overexpressing hairy roots showed a significantly greater increase than in hairy roots containing the empty vector (Figure 7). These results suggest that the overexpression of GsPRX9 increased the expression of other genes of soybean hairy roots in response to salt stress. Taken together, overexpression of GsPRX9 enhanced soybean salt tolerance through mediation of the ROS regulatory network.
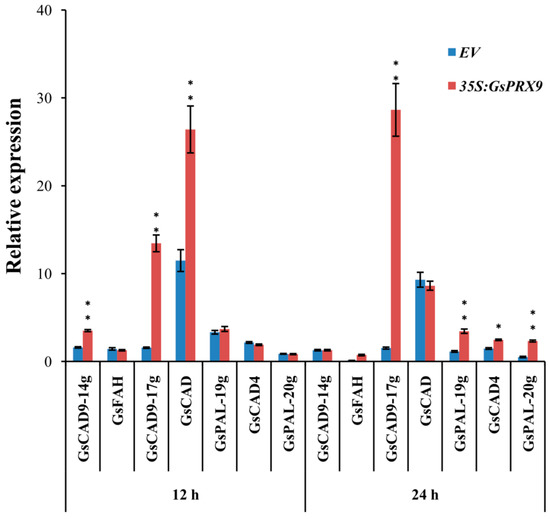
Figure 7.
Relative expression of genes encoding potential GsPRX9-interacting proteins in soybean hairy roots. Root samples receiving 0 mM NaCl treatment at each time point were used as controls. Data represent mean ± standard deviation of four biological replications with three repeats within each replication (n = 4 × 3 = 12). EV represents soybean hairy roots with the empty vector pBinGFP4, and 35S:GsPRX9 represents roots with the recombinant vector pBinGFP4–GsPRX9 (GsPRX9 was expressed in fusion with GFP, driven by a CaMV 35S promoter). * and ** represents significant difference between EV and 35S:GsPRX9 for each time point at the 0.05 or 0.01 level by Student’s t-test, respectively.
4. Materials and Methods
4.1. Plant Materials and Growth Conditions
Soybean seeds, including salt-tolerant (“LY01-10”, “LY16-08”) and -sensitive varieties (“LY01-06”, “Tianlong1”), were obtained from the National Center for Soybean Improvement, Nanjing Agricultural University, Nanjing, China. Soybean seeds were germinated in sterile nutrient soil (turf + vermiculite + perlite, 2:2:1) and grown in a greenhouse for 12 days, at 28 °C (day)/24 °C (night) with 14 h (light)/10 h (dark) photoperiod, and the soybean seedlings were then subjected to 0 or 180 mM NaCl treatment.
4.2. RNA Isolation and Gene Cloning
Total RNA was isolated from soybean roots using an RNAprep Pure Plant Kit (Tiangen Biotech, Beijing, China), and the first-strand cDNA was synthesized using a PrimeScript™ 1st Strand cDNA Synthesis Kit (TaKaRa, Dalian, China). Primers were designed by Primer Premier 5 software (Premier Biosoft International, Palo Alto, CA, USA), and the specificities of primers were analyzed by Primer-BLAST (Figure S6) (https://www.ncbi.nlm.nih.gov/tools/primer-blast/). The primers were synthesized at GenScript (Nanjing, China) and their sequences are listed in Table S4. The sequence of Glyma.14g070800 was downloaded from Phytozome (https://phytozome.jgi.doe.gov/pz/portal.html) and used as a reference to design primers for cloning GsPRX9. The full-length CDS of GsPRX9 was amplified from the cDNA of a wild soybean variety (“LY01-10”) following the PCR protocol: 94 °C for 5 min; 35 cycles of 94 °C for 30 s, 58 °C for 30 s, and 72 °C for 2 min; and 72 °C for 5 min, in a 50 μL reaction mixture (600 μg of DNA, 0.25 mM of each primer (Table S4), 25 μL of 2 × Gflex PCR buffer and 1 unit of Tks Gflex DNA polymerase (TaKaRa, Dalian, China)), and sequenced by GenScript (Nanjing, China).
4.3. Phylogenetic Analysis of Soybean PRX9 and Other Peroxidase Proteins
The 159 seed sequences of the peroxidases protein superfamily (Table S1) were identified using the structural domain of “peroxidase” (PF00141) and downloaded from PFAM (http://pfam.xfam.org/family/PF00141.22#tabview=tab3). The full protein sequences of the above peroxidases and soybean PRX9 were used for multiple sequence alignments by ClustalW2 (https://www.ebi.ac.uk/Tools/msa/clustalw2/) [53]. The unrooted phylogenetic tree was then constructed using MEGA 6.0 [54], based on the Maximum Likelihood (ML) algorithm with 1000 bootstraps.
4.4. Quantitative Real-Time PCR (qRT-PCR) Analysis
Total RNA, cDNA, and primers were obtained as described above. The amplicon specificity was verified by melting curve analysis (Figure S7) and agarose gel electrophoresis. The qRT-PCR was performed on a Roche 480 Realtime detection system (Roche Diagnostics, Rotkreuz, Switzerland) following the manufacturer’s instructions, using SYBR Premix ExTaq II Mix (TaKaRa, Dalian, China) in a final volume of 15 μL containing 2 μL cDNA, 7.5 μL SYBR Premix ExTaq II (TaKaRa, Dalian, China), and 200 nM of forward and reverse primers. The amplification program was set as follows: initial denaturation at 95 °C for 5 min; 40 cycles of denaturation at 95 °C for 10 s, annealing at 58 °C for 20 s, and extension at 72 °C for 20 s. The experiments were performed in triplicate. The amplification efficiencies (E) of primer pairs were estimated by qRT-PCR using 1×, 5×, 10×, 20×, and 30× dilutions of cDNA, according to the equation: E = 10−1/slope−1 [55]. Primers and amplification efficiencies of qRT-PCR were shown in Table S4. GmUKN1 was used as the reference gene [56], and the relatively constant Ct values of GmUKN1 across all samples demonstrated its invariant expression under our experimental conditions (Table S5), suggesting that it is suitable for the internal control of qRT-PCR. The relative expression levels of test genes were analyzed by the 2−△△Ct methods [57].
4.5. Plasmid Construction and Genetic Transformation
The PCR products of GsPRX9 with A-Tailing were cloned into a pMD19-T vector (TaKaRa, Dalian, China) using a One-Step Cloning Kit (Vazyme, Nanjing, China), and confirmed by sequencing. The CDS of GsPRX9 was then cloned into pBinGFP4 [58] and pYES2 vectors (Vazyme, Nanjing, China), respectively, using the Kpn I and Bam HI (TaKaRa, Dalian, China) sites, to obtain the recombinant plasmids of pBinGFP4–GsPRX9 (GsPRX9 was expressed in fusion with GFP, driven by a CaMV 35S promoter) and pYES2–GsPRX9. After confirmation by sequencing, the recombinant pBinGFP4–GsPRX9 plasmid and empty vector (pBinGFP4) were transformed into soybeans using Agrobacterium (A. rhizogenes K599)-mediated genetic transformation [59]. The pYES2–GsPRX9 plasmid and empty vector (pYES2) were transformed into the Saccharomyces cerevisiae strain INVSc1 and salt-sensitive mutant strain G19 using the PEG/LiAc procedure (TaKaRa, Dalian, China) according to the manufacturer’s instructions.
4.6. Evaluation of the Tolerance of Yeast Strains of INVSc1 and G19 to Salt and H2O2 Stress
Yeasts were grown in a synthetic medium minus the appropriate amino acids (SD-Ura) to select the transformants, as previously described [29]. The positive transformants were screened by PCR [60], and then grown on s YPD medium (TaKaRa, Dalian, China) supplemented with different concentrations of NaCl (0, 0.5, 0.8, and 1 M) or H2O2 (0, 3, 3.2, and 3.4 mM) at 30 °C until an obvious phenotypic difference was observed between GsPRX9 overexpressing yeast and the corresponding control yeast with empty vector [29].
4.7. Salt Tolerance Analysis Using Soybean Composite Plants
The seeds of salt-sensitive soybean “LY01-06” were germinated in sterile vermiculite with 1/2 Hoagland solution (pH = 6.5) for five days, then soybean hypocotyls were incised and infected by A. rhizogenes K599 containing pBinGFP4–GsPRX9 or pBinGFP4, and kept in the dark for 24 h with the wound wrapped in aluminum foil to maintain high humidity. The soybean seedlings were then transferred to 1/2 Hoagland solution and grown under high humidity at 28 °C (day) / 24 °C (night) under a 14 h (light) / 10 h (dark) photoperiod for 14 days. Next, the positive transgenic soybean composite plants with pBinGFP4–GsPRX9 or pBinGFP4 were identified by green fluorescence signals using a stereoscopic fluorescence microscope (Olympus DP72, Tokyo, Japan), and the negative roots were removed. Five days later, these plants were treated with 1/2 Hoagland solution containing 0 or 100 mM NaCl (pH = 6.5) for seven days. The shoot fresh weight and leaf relative water content [61] were measured at day seven post-treatment. Three biological replications were performed and 10 independent transgenic plants were measured for each repeat.
4.8. Salt Tolerance Analysis Using Soybean Hairy Roots
The salt tolerance evaluation of soybean hairy roots was performed according to previously published methods [3,62]. Seeds of salt-sensitive soybean variety “Tianlong1” were surface-sterilized and placed onto MS medium (pH = 6.5) for germination. The fully developed cotyledons were cut in half and incised with sterile scalpels, and then co-cultivated with A. rhizogenes K599 (containing pBinGFP4–GsPRX9 plasmid or pBinGFP4) on White solid medium (MDBio, pH = 5.8) for 15 days without light. Positive transgenic soybean hairy roots were identified by green fluorescence signals with a stereoscopic fluorescence microscope (Olympus DP72, Tokyo, Japan). The soybean cotyledons with all hairy roots shown as positives were then transferred to the White solid medium (MDBio, pH = 5.8) with 0 mM (control) and 150 mM NaCl containing 500 mg/L carbenicillin and 50 mg/L cefotaxime (Sangon Biotech, Shanghai, China) at 22 °C for 14 days. Root fresh weight was recorded at day 14 post-treatment. To regenerate positive transgenic roots, the soybean hairy roots with green fluorescence signals were selected and their root tips (3 cm in length) were cut, and then transferred onto White solid medium (pH = 5.8, including carbenicillin 500 mg/L and cefotaxime 50 mg/L) containing 0 or 150 mM NaCl. Roots were sampled at 24 h post-treatment for detection of the GsPRX9 gene expression. The positive hairy roots continued to grow until day 14, and the lengths of primary hairy roots were measured. Four biological replications were performed and at least three hairy roots were measured for each repeat.
4.9. Measurement of POD and SOD Activities, H2O2 Content, and GSH Level
The activities of POD and SOD, H2O2 content, and GSH level in soybean hairy roots were measured as described previously [63,64]. In brief, total proteins were extracted using the vegetable protein extraction kit (KeyGene BioTECH, Nanjing, China) and quantified using a BCA protein assay kit (KeyGene BioTECH). The activities of POD and SOD, H2O2 content, and GSH level were measured using a peroxidase kit (Jiancheng BioTECH, Nanjing, China), superoxide dismutase kit (Keming BioTECH, Suzhou, China), H2O2 test kit (Jiancheng BioTECH, Nanjing, China), and GSH test kit (Jiancheng BioTECH, Nanjing, China) according to the instructions from the manufacturers and previously published methods [63,64]. All measurements were performed with four biological replications and three independent soybean hairy roots were used in each replication.
4.10. Protein–Protein Interaction Network Analysis
In order to identify the potential GsPRX9 interacting proteins that might be helpful to understand the function of GsPRX9, the Search Tool for the Retrieval of Interacting Genes (STRING, https://string-db.org/) was employed to predicate the protein–protein interaction (PPI) network, using the combined_score ≥ 0.9. Cytoscape software (http://www.cytoscape.org/) [65] was used for the visualization of protein–protein interaction network. Annotations of the potential GsPRX9 interacting proteins were obtained from the gene ontology (GO) database (http://www.geneontology.org/).
4.11. Statistical Analysis
All experiments were performed at least in triplicate, and the results were reported as mean ± standard deviation (SD). Statistical analyses were performed using SAS 9.2 (SAS Institute Inc., Cary, NC, USA). Differences between the two groups were analyzed using Student’s t-tests, while differences among more than two groups were analyzed using Duncan’s multiple range tests.
5. Conclusions
To conclude, GsPRX9 encodes a peroxidase protein that was induced by salt stress, and its upregulation was higher in salt-tolerant than in salt-sensitive soybean varieties. Overexpression of GsPRX9 enhanced the salt tolerance of yeast (strains of INVSc1 and G19), soybean hairy roots, and soybean composite plants. The root fresh weight, primary root length, activities of POD and SOD, as well as GSH level in soybean hairy roots overexpressing GsPRX9 were greater than those in controls (empty vector). Taken together, these findings suggest that GsPRX9 plays an important role in soybean tolerance to salt stress.
Supplementary Materials
The following are available online at https://www.mdpi.com/1422-0067/20/15/3745/s1.
Author Contributions
Y.L. and T.J. conceived and designed the research. T.J., Y.S., R.Z., and Z.S. conducted the experiments. T.J analyzed the data. Y.L. and J.G. contributed reagents/materials. Y.L and T.J. wrote and revised the manuscript. All authors read and approved the final manuscript.
Funding
This work was supported by the National Key R & D Program for Crop Breeding (2016YFD0100304), the Fundamental Research Funds for the Central Universities (KYT201801), and the Program for Changjiang Scholars and Innovative Research Team in University (IRT_17R55).
Acknowledgments
We would like to thank Daolong Dou (Nanjing Agricultural University) for kindly providing us with the vectors of pBinGFP4.
Conflicts of Interest
The authors declare no conflict of interest.
Abbreviations
| APxs | Ascorbate peroxidases |
| CcPs | Cytochrome-c peroxidases |
| CDS | Coding sequence |
| CPs | Catalase peroxidases |
| GSH | Glutathione |
| GsPRX9 | Peroxidase 9 from the wild soybean (Glycine soja) |
| H2O2 | Hydrogen peroxide |
| LiPs | Lignin peroxidases |
| MnPs | Manganese-dependent peroxidases |
| PCR | Polymerase chain reaction |
| POD | Peroxidase |
| Prxs | Class III peroxidases |
| qRT-PCR | Quantitative real-time PCR |
| ROS | Reactive oxygen species |
| SOD | Superoxide dismutase |
| SD | Standard deviation |
| VPs | Versatile peroxidases |
| YPD | Yeast extract–peptone–dextrose |
References
- Munns, R.; Tester, M. Mechanisms of salinity tolerance. Annu. Rev. Plant Biol. 2008, 59, 651–681. [Google Scholar] [CrossRef] [PubMed]
- Li, X.; An, P.; Inanaga, S.; Eneji, A.E.; Tanabe, K. Salinity and defoliation effects on soybean growth. J. Plant Nutr. 2006, 29, 1499–1508. [Google Scholar] [CrossRef]
- Qi, X.; Li, M.W.; Xie, M.; Liu, X.; Ni, M.; Shao, G.; Song, C.; Kay-Yuen Yim, A.; Tao, Y.; Wong, F.L.; et al. Identification of a novel salt tolerance gene in wild soybean by whole-genome sequencing. Nat. Commun. 2014, 5, 4340. [Google Scholar] [CrossRef] [PubMed]
- Zhou, L.; Wang, C.; Liu, R.; Han, Q.; Vandeleur, R.K.; Du, J.; Tyerman, S.; Shou, H. Constitutive overexpression of soybean plasma membrane intrinsic protein GmPIP1;6 confers salt tolerance. BMC Plant Biol. 2014, 14, 181. [Google Scholar] [CrossRef] [PubMed]
- Gao, S.Q.; Chen, M.; Xu, Z.S.; Zhao, C.P.; Li, L.; Xu, H.J.; Tang, Y.M.; Zhao, X.; Ma, Y.Z. The soybean GmbZIP1 transcription factor enhances multiple abiotic stress tolerances in transgenic plants. Plant Mol. Biol. 2011, 75, 537–553. [Google Scholar] [CrossRef]
- Welinder, K.G. Superfamily of plant, fungal and bacterial peroxidases. Curr. Opin. Struc. Biol. 1992, 2, 388–393. [Google Scholar] [CrossRef]
- Zamocky, M. Phylogenetic relationships in class I of the superfamily of bacterial, fungal, and plant peroxidases. Eur. J. Biochem. 2004, 271, 3297–3309. [Google Scholar] [CrossRef]
- Lazzarotto, F.; Turchetto-Zolet, A.C.; Margis-Pinheiro, M. Revisiting the non-animal peroxidase superfamily. Trends Plant Sci. 2015, 20, 807–813. [Google Scholar] [CrossRef]
- Passardi, F.; Bakalovic, N.; Teixeira, F.K.; Margis-Pinheiro, M.; Penel, C.; Dunand, C. Prokaryotic origins of the non-animal peroxidase superfamily and organelle-mediated transmission to eukaryotes. Genomics 2007, 89, 567–579. [Google Scholar] [CrossRef]
- Hofrichter, M.; Ullrich, R.; Pecyna, M.J.; Liers, C.; Lundell, T. New and classic families of secreted fungal heme peroxidases. Appl. Microbiol. Biotechnol. 2010, 87, 871–897. [Google Scholar] [CrossRef]
- Kellner, H.; Luis, P.; Pecyna, M.J.; Barbi, F.; Kapturska, D.; Kruger, D.; Zak, D.R.; Marmeisse, R.; Vandenbol, M.; Hofrichter, M. Widespread occurrence of expressed fungal secretory peroxidases in forest soils. PLoS ONE 2014, 9, e95557. [Google Scholar] [CrossRef] [PubMed]
- Cosio, C.; Ranocha, P.; Francoz, E.; Burlat, V.; Zheng, Y.; Perry, S.E.; Ripoll, J.J.; Yanofsky, M.; Dunand, C. The class III peroxidase PRX17 is a direct target of the MADS-box transcription factor AGAMOUS-LIKE15 (AGL15) and participates in lignified tissue formation. New Phytol. 2017, 213, 250–263. [Google Scholar] [CrossRef] [PubMed]
- Passardi, F.; Longet, D.; Penel, C.; Dunand, C. The class III peroxidase multigenic family in rice and its evolution in land plants. Phytochemistry 2004, 65, 1879–1893. [Google Scholar] [CrossRef] [PubMed]
- Duroux, L.; Welinder, K.G. The peroxidase gene family in plants: A phylogenetic overview. J. Mol. Evol. 2003, 57, 397–407. [Google Scholar] [CrossRef] [PubMed]
- Hiraga, S.; Sasaki, K.; Ito, H.; Ohashi, Y.; Matsui, H. A large family of class III plant peroxidases. Plant Cell Physiol. 2001, 42, 462–468. [Google Scholar] [CrossRef] [PubMed]
- Passardi, F.; Penel, C.; Dunand, C. Performing the paradoxical: How plant peroxidases modify the cell wall. Trends Plant Sci. 2004, 9, 534–540. [Google Scholar] [CrossRef] [PubMed]
- Liszkay, A.; Kenk, B.; Schopfer, P. Evidence for the involvement of cell wall peroxidase in the generation of hydroxyl radicals mediating extension growth. Planta 2003, 217, 658–667. [Google Scholar] [CrossRef]
- Shigeto, J.; Tsutsumi, Y. Diverse functions and reactions of class III peroxidases. New Phytol. 2016, 209, 1395–1402. [Google Scholar] [CrossRef]
- Cosio, C.; Vuillemin, L.; De Meyer, M.; Kevers, C.; Penel, C.; Dunand, C. An anionic class III peroxidase from zucchini may regulate hypocotyl elongation through its auxin oxidase activity. Planta 2009, 229, 823–836. [Google Scholar] [CrossRef]
- Bernards, M.A.; Fleming, W.D.; Llewellyn, D.B.; Priefer, R.; Yang, X.; Sabatino, A.; Plourde, G.L. Biochemical characterization of the suberization-associated anionic peroxidase of potato. Plant Physiol. 1999, 121, 135–146. [Google Scholar] [CrossRef]
- Cosio, C.; Dunand, C. Transcriptome analysis of various flower and silique development stages indicates a set of class III peroxidase genes potentially involved in pod shattering in Arabidopsis thaliana. BMC Genom. 2010, 11, 528. [Google Scholar] [CrossRef]
- Kunieda, T.; Shimada, T.; Kondo, M.; Nishimura, M.; Nishitani, K.; Hara-Nishimura, I. Spatiotemporal secretion of PEROXIDASE36 is required for seed coat mucilage extrusion in Arabidopsis. Plant Cell 2013, 25, 1355–1367. [Google Scholar] [CrossRef]
- Llorente, F.; Lopez-Cobollo, R.M.; Catala, R.; Martinez-Zapater, J.M.; Salinas, J. A novel cold-inducible gene from Arabidopsis, RCI3, encodes a peroxidase that constitutes a component for stress tolerance. Plant J. 2002, 32, 13–24. [Google Scholar] [CrossRef]
- Linkies, A.; Schuster-Sherpa, U.; Tintelnot, S.; Leubner-Metzger, G.; Muller, K. Peroxidases identified in a subtractive cDNA library approach show tissue-specific transcript abundance and enzyme activity during seed germination of Lepidium sativum. J. Exp. Bot. 2010, 61, 491–502. [Google Scholar] [CrossRef]
- Tu, D.D.; Jiang, M.; Gu, W.B.; Zhou, Y.L.; Zhu, Q.H.; Zhou, Z.K.; Chen, Y.Y.; Shu, M.A. Identification and characterization of atypical 2-cysteine peroxiredoxins from mud crab Scylla paramamosain: The first evidence of two peroxiredoxin 5 genes in non-primate species and their involvement in immune defense against pathogen infection. Fish Shellfish Immunol. 2017, 69, 119–127. [Google Scholar] [CrossRef]
- Cui, L.G.; Shan, J.X.; Shi, M.; Gao, J.P.; Lin, H.X. DCA1 acts as a transcriptional co-activator of DST and contributes to drought and salt tolerance in rice. PLoS Genet. 2015, 11, e1005617. [Google Scholar] [CrossRef]
- Suzuki, N.; Rivero, R.M.; Shulaev, V.; Blumwald, E.; Mittler, R. Abiotic and biotic stress combinations. New Phytol. 2014, 203, 32–43. [Google Scholar] [CrossRef]
- Wei, P.; Wang, L.; Liu, A.; Yu, B.; Lam, H.M. GmCLC1 confers enhanced salt tolerance through regulating chloride accumulation in soybean. Front. Plant Sci. 2016, 7, 1082. [Google Scholar] [CrossRef]
- Guan, Q.J.; Ma, H.Y.; Wang, Z.J.; Wang, Z.Y.; Bu, Q.Y.; Liu, S.K. A rice LSD1-like-type ZFP gene OsLOL5 enhances saline-alkaline tolerance in transgenic Arabidopsis thaliana, yeast and rice. BMC Genomics 2016, 17, 142. [Google Scholar] [CrossRef]
- Cai, R.; Dai, W.; Zhang, C.; Wang, Y.; Wu, M.; Zhao, Y.; Ma, Q.; Xiang, Y.; Cheng, B. The maize WRKY transcription factor ZmWRKY17 negatively regulates salt stress tolerance in transgenic Arabidopsis plants. Planta 2017, 246, 1215–1231. [Google Scholar] [CrossRef]
- Seok, H.Y.; Nguyen, L.V.; Park, H.Y.; Tarte, V.N.; Ha, J.; Lee, S.Y.; Moon, Y.H. Arabidopsis non-TZF gene AtC3H17 functions as a positive regulator in salt stress response. Biochem. Biophys. Res. Commun. 2018, 498, 954–959. [Google Scholar] [CrossRef]
- Mostek, A.; Borner, A.; Badowiec, A.; Weidner, S. Alterations in root proteome of salt-sensitive and tolerant barley lines under salt stress conditions. J. Plant Physiol. 2015, 174, 166–176. [Google Scholar] [CrossRef]
- Choi, W.G.; Toyota, M.; Kim, S.H.; Hilleary, R.; Gilroy, S. Salt stress-induced Ca2+ waves are associated with rapid, long-distance root-to-shoot signaling in plants. Proc. Natl. Acad. Sci. USA 2014, 111, 6497–6502. [Google Scholar] [CrossRef]
- Farhangi-Abriz, S.; Torabian, S. Antioxidant enzyme and osmotic adjustment changes in bean seedlings as affected by biochar under salt stress. Ecotoxicol. Environ. Saf. 2017, 137, 64–70. [Google Scholar] [CrossRef]
- He, M.; Wang, H.; Yiu, Z.L.; Gao, W.J.; Gao, Y.H.; Wang, F.; Zhou, Y.W. Cloning and characterization of ChiMYB in Chrysanthemum indicum with an emphasis on salinity stress tolerance. Genet. Mol. Res. 2016, 15. [Google Scholar] [CrossRef]
- An, J.; Hu, Z.; Che, B.; Chen, H.; Yu, B.; Cai, W. Heterologous Expression of Panax ginseng PgTIP1 confers enhanced salt tolerance of soybean cotyledon hairy roots, Composite, and Whole Plants. Front. Plant Sci. 2017, 8, 1232. [Google Scholar] [CrossRef]
- Muller, K.; Linkies, A.; Vreeburg, R.A.; Fry, S.C.; Krieger-Liszkay, A.; Leubner-Metzger, G. In vivo cell wall loosening by hydroxyl radicals during cress seed germination and elongation growth. Plant Physiol. 2009, 150, 1855–1865. [Google Scholar] [CrossRef]
- Singh, K.L.; Chaudhuri, A.; Kar, R.K. Role of peroxidase activity and Ca2+ in axis growth during seed germination. Planta 2015, 242, 997–1007. [Google Scholar] [CrossRef]
- Lariguet, P.; Ranocha, P.; De Meyer, M.; Barbier, O.; Penel, C.; Dunand, C. Identification of a hydrogen peroxide signalling pathway in the control of light-dependent germination in Arabidopsis. Planta 2013, 238, 381–395. [Google Scholar] [CrossRef]
- Chakraborty, K.; Bishim, S.K.; Goswami, N.; Singhm, A.L.; Zalam, P.V. Differential fine-regulation of enzyme driven ROS detoxification network imparts salt tolerance in contrasting peanut genotypes. Environ. Exp. Bot. 2016, 128, 79–90. [Google Scholar] [CrossRef]
- Silva, E.N.; Silveira, J.A.G.; Rodrigues, C.R.F.; Viégas, R.A. Physiological adjustment to salt stress in Jatropha curcas is associated with accumulation of salt ions, transport and selectivity of K+, osmotic adjustment and K+/Na+ homeostasis. Plant Biol. 2015, 17, 1023–1029. [Google Scholar] [CrossRef]
- Zhu, M.; Zhou, M.; Shabala, L.; Shabala, S. Linking osmotic adjustment and stomatal characteristics with salinity stress tolerance in contrasting barley accessions. Funct. Plant Biol. 2014, 42, 252–263. [Google Scholar] [CrossRef]
- Peng, J.; Li, Z.; Wen, X.; Li, W.; Shi, H.; Yang, L.; Zhu, H.; Guo, H. Salt-induced stabilization of EIN3/EIL1 confers salinity tolerance by deterring ROS accumulation in Arabidopsis. PLoS Genet. 2014, 10, e1004664. [Google Scholar] [CrossRef]
- Kelley, E.E.; Khoo, N.K.; Hundley, N.J.; Malik, U.Z.; Freeman, B.A.; Tarpey, M.M. Hydrogen peroxide is the major oxidant product of xanthine oxidase. Free Radic. Biol. Med. 2010, 48, 493–498. [Google Scholar] [CrossRef]
- Liu, N.; Lin, Z.; Guan, L.; Gaughan, G.; Lin, G. Antioxidant enzymes regulate reactive oxygen species during pod elongation in Pisum sativum and Brassica chinensis. PLoS ONE 2014, 9, e87588. [Google Scholar] [CrossRef]
- Tenhaken, R. Cell wall remodeling under abiotic stress. Front. Plant Sci. 2014, 5, 771. [Google Scholar] [CrossRef]
- Aghelan, Z.; Shariat, S.Z. Partial purification and biochemical characterization of peroxidase from rosemary (Rosmarinus officinalis L.) leaves. Adv. Biomed. Res. 2015, 4, 159. [Google Scholar]
- Perkins, A.; Nelson, K.J.; Parsonage, D.; Poole, L.B.; Karplus, P.A. Peroxiredoxins: Guardians against oxidative stress and modulators of peroxide signaling. Trends Biochem. Sci. 2015, 40, 435–445. [Google Scholar] [CrossRef]
- Poynton, R.A.; Hampton, M.B. Peroxiredoxins as biomarkers of oxidative stress. BBA-Gen. Subjects 2014, 1840, 906–912. [Google Scholar] [CrossRef]
- Wang, L.; Hu, W.; Feng, J.; Yang, X.; Huang, Q.; Xiao, J.; Liu, Y.; Yang, G.; He, G. Identification of the ASR gene family from Brachypodium distachyon and functional characterization of BdASR1 in response to drought stress. Plant Cell Rep. 2016, 35, 1221–1234. [Google Scholar] [CrossRef]
- You, J.; Chan, Z. ROS regulation during abiotic stress responses in crop plants. Front. Plant Sci. 2015, 6, 1092. [Google Scholar] [CrossRef] [PubMed]
- Winterbourn, C.C. Are free radicals involved in thiol-based redox signaling? Free Radic. Biol. Med. 2015, 80, 164–170. [Google Scholar] [CrossRef] [PubMed]
- Larkin, M.A.; Blackshields, G.; Brown, N.P.; Chenna, R.; McGettigan, P.A.; McWilliam, H.; Valentin, F.; Wallace, I.M.; Wilm, A.; Lopez, R.; et al. Clustal W and Clustal X version 2.0. Bioinformatics 2007, 23, 2947–2948. [Google Scholar] [CrossRef] [PubMed]
- Tamura, K.; Stecher, G.; Peterson, D.; Filipski, A.; Kumar, S. MEGA6: Molecular Evolutionary Genetics Analysis version 6.0. Mol. Biol. Evol. 2013, 30, 2725–2729. [Google Scholar] [CrossRef] [PubMed]
- Pfaffl, M.W. A new mathematical model for relative quantification in real-time RT-PCR. Nucleic Acids Res. 2001, 29, e45. [Google Scholar] [CrossRef] [PubMed]
- Guan, R.; Qu, Y.; Guo, Y.; Yu, L.; Liu, Y.; Jiang, J.; Chen, J.; Ren, Y.; Liu, G.; Tian, L.; et al. Salinity tolerance in soybean is modulated by natural variation in GmSALT3. Plant J. 2014, 80, 937–950. [Google Scholar] [CrossRef] [PubMed]
- Livak, K.J.; Schmittgen, T.D. Analysis of relative gene expression data using real-time quantitative PCR and the 2−ΔΔCt Method. Methods 2001, 25, 402–408. [Google Scholar] [CrossRef] [PubMed]
- Wu, H.; Tian, Y.; Wan, Q.; Fang, L.; Guan, X.; Chen, J.; Hu, Y.; Ye, W.; Zhang, H.; Guo, W.; et al. Genetics and evolution of MIXTA genes regulating cotton lint fiber development. New Phytol. 2018, 217, 883–895. [Google Scholar] [CrossRef]
- Cui, X.; Yan, Q.; Gan, S.; Xue, D.; Dou, D.; Guo, N.; Xing, H. Overexpression of gma-miR1510a/b suppresses the expression of a NB-LRR domain gene and reduces resistance to Phytophthora sojae. Gene 2017, 621, 32–39. [Google Scholar] [CrossRef] [PubMed]
- Gietz, R.D. Yeast transformation by the LiAc/SS carrier DNA/PEG method. Methods Mol. Biol. 2014, 1205, 1–12. [Google Scholar]
- Naus, J.; Smecko, S.; Spundova, M. Chloroplast avoidance movement as a sensitive indicator of relative water content during leaf desiccation in the dark. Photosynth. Res. 2016, 129, 217–225. [Google Scholar] [CrossRef] [PubMed]
- Kereszt, A.; Li, D.; Indrasumunar, A.; Nguyen, C.D.; Nontachaiyapoom, S.; Kinkema, M.; Gresshoff, P.M. Agrobacterium rhizogenes-mediated transformation of soybean to study root biology. Nat. Protoc. 2007, 2, 948–952. [Google Scholar] [CrossRef] [PubMed]
- Zhang, Y.; Tang, H.R.; Luo, Y. Variation in antioxidant enzyme activities of two strawberry cultivars with short-term low temperature stress. World J. Agri. Sci. 2008, 4, 458–462. [Google Scholar]
- Feng, J.; Wang, L.; Wu, Y.; Luo, Q.; Zhang, Y.; Qiu, D.; Han, J.; Su, P.; Xiong, Z.; Chang, J.; et al. TaSnRK2.9, a sucrose non-fermenting 1-Related protein kinase gene, positively regulates plant response to drought and salt stress in transgenic tobacco. Front. Plant Sci. 2018, 9, 2003. [Google Scholar] [CrossRef] [PubMed]
- Shannon, P.; Markiel, A.; Ozier, O.; Baliga, N.S.; Wang, J.T.; Ramage, D.; Amin, N.; Schwikowski, B.; Ideker, T. Cytoscape: A software environment for integrated models of biomolecular interaction networks. Genome Res. 2003, 13, 2498–2504. [Google Scholar] [CrossRef]


© 2019 by the authors. Licensee MDPI, Basel, Switzerland. This article is an open access article distributed under the terms and conditions of the Creative Commons Attribution (CC BY) license (http://creativecommons.org/licenses/by/4.0/).