Article

Transcriptome Analysis Reveals Key Seed-Development Genes in Common Buckwheat (Fagopyrum esculentum)

1
Research Center of Buckwheat Industry Technology, Guizhou Normal University, Guiyang 550001, China
2
School of Big Data and Computer Science, Guizhou Normal University, Guiyang 550025, China
*
Authors to whom correspondence should be addressed.
Int. J. Mol. Sci. 2019, 20(17), 4303; https://doi.org/10.3390/ijms20174303
Submission received: 8 July 2019 / Revised: 16 August 2019 / Accepted: 28 August 2019 / Published: 3 September 2019
(This article belongs to the Section Molecular Plant Sciences)

Abstract

:
Seed development is an essential and complex process, which is involved in seed size change and various nutrients accumulation, and determines crop yield and quality. Common buckwheat (Fagopyrum esculentum Moench) is a widely cultivated minor crop with excellent economic and nutritional value in temperate zones. However, little is known about the molecular mechanisms of seed development in common buckwheat (Fagopyrum esculentum). In this study, we performed RNA-Seq to investigate the transcriptional dynamics and identify the key genes involved in common buckwheat seed development at three different developmental stages. A total of 4619 differentially expressed genes (DEGs) were identified. Based on the results of Gene Ontology (GO) and KEGG analysis of DEGs, many key genes involved in the seed development, including the Ca2+ signal transduction pathway, the hormone signal transduction pathways, transcription factors (TFs), and starch biosynthesis-related genes, were identified. More importantly, 18 DEGs were identified as the key candidate genes for seed size through homologous query using the known seed size-related genes from different seed plants. Furthermore, 15 DEGs from these identified as the key genes of seed development were selected to confirm the validity of the data by using quantitative real-time PCR (qRT-PCR), and the results show high consistency with the RNA-Seq results. Taken together, our results revealed the underlying molecular mechanisms of common buckwheat seed development and could provide valuable information for further studies, especially for common buckwheat seed improvement.

1. Introduction

Seed or grain development is one of the most crucial processes in plant development. It not only determines the successful racial continuation of seed plants, but also affects the final seed yield and seed quality [1,2]. Generally, seed development can be broadly divided into two phases: Embryogenesis and maturation [3,4]. The embryogenesis phase mainly involves cell division and expansion, while maturation is usually an accumulation process of seed storage materials [3]. Seed development is predominantly regulated by genetic factors and is also greatly influenced by physiological pathways and environmental cues. At the physiological level, phytohormones—including auxins, cytokinins (CKs), gibberellins (GAs), brassinolides (BRs), abscisic acid (ABA), and ethylene (ET)—contribute to seed development [2]. At the molecular level, in the past two decades, many genes involved in seed development have been identified and their molecular pathways deciphered in the model plants Arabidopsis and rice through analysis of mutants, transcriptomes, and quantitative trait locus (QTLs) [2,5,6,7,8,9]. Furthermore, in the last few years, investigations of the molecular mechanisms of seed development have also been undertaken in some crop plants such as maize [10,11], wheat [12,13], soybean [14,15,16], barley [4], Tartary buckwheat [17,18], chickpea [19], and Brassica napus [20,21] by transcriptome analysis. These studies have identified large numbers of related regulatory and functional genes, and provided a better understanding of the molecular mechanisms of seed development.
Common buckwheat (Fagopyrum esculentum) is an annual minor crop which belongs to the eudicot family Polygonaceae, mainly cultivated in temperate regions of Asia, Europe, and North America [22]. As a major part of the human diet, common buckwheat seeds contain high levels of starch, protein, dietary fibers, vitamins, minerals, and flavonoids, which are beneficial to human health [23,24,25]. Furthermore, the seed of common buckwheat is larger than that of another cultivated buckwheat, tartary buckwheat (Fagopyrum tataricum). Therefore, it is of considerable interest to identify genes and dissect the molecular mechanisms of seed development in common buckwheat, as this will contribute to common buckwheat and tartary buckwheat seed improvement, including seed formation, morphogenesis, size, and nutrient accumulation. To date, several studies have investigated the transcriptional profile of the developing seeds of common buckwheat though RNA-Seq [26,27,28]. However, these studies only focused on one developmental time point of common buckwheat seed, and the differentially expressed genes that might be involved in seed development have not been identified.
In the present study, we carried out a transcriptomic analysis of common buckwheat seed at three developmental stages (pre-filling stage (S1), filling stage (S2), and initial maturity stage (S3)) with the purpose of investigating its transcriptional dynamics and identifying candidate genes involved in seed development. In addition, some vital seed-development candidate genes were verified by quantitative real-time PCR (qRT-PCR). The results obtained in this study will enhance our understanding of the molecular mechanisms of common buckwheat seed development and provide candidate genes for future common buckwheat seed improvement.

2. Results

2.1. Overview of Sequencing Data Analysis

To gain insight into the transcriptional dynamics of seed development in common buckwheat, nine libraries from three samples (three biological replicates for each sample) were constructed and subjected to high-throughput RNA-Seq. An overview of the sequencing data is shown in Table 1. A total of 248.53 million raw reads, with an average of 27.61 million raw reads for each library, were yielded. After removing the adaptor sequences and low-quality sequence reads, 242.86 million clean reads were obtained, with an average of 26.98 million clean reads for each library. The Q30 percentages for all libraries exceeded 93%, and the range of GC (Guanine and Cytosine) content for each library was 47.65 to 50.58%. A total of 63.32 to 69.46% of clean reads were mapped to the reference genome for each library. The Pearson’s rank correlation between any two of the three replicates for each sample was >0.95, with 0.979, 0.985, and 0.972 for S1, 0.952, 0.964, and 0.968 for S2, and 0.983, 0.993, and 0.998 for S3 (Table S1), indicating the high reliability and reproducibility of the data.

2.2. Identification and Annotation of Differentially Expressed Genes (DEGs)

To identify the DEGs during the common buckwheat seed development, the gene expression profile clustering was subjected to first analysis. All 54,582 genes were assigned to seven different clusters by the K-means method, which led to the identification of genes with similar expression during all stages of seed development, and indicated that a large number of genes were differentially expressed between different samples (Figure 1).
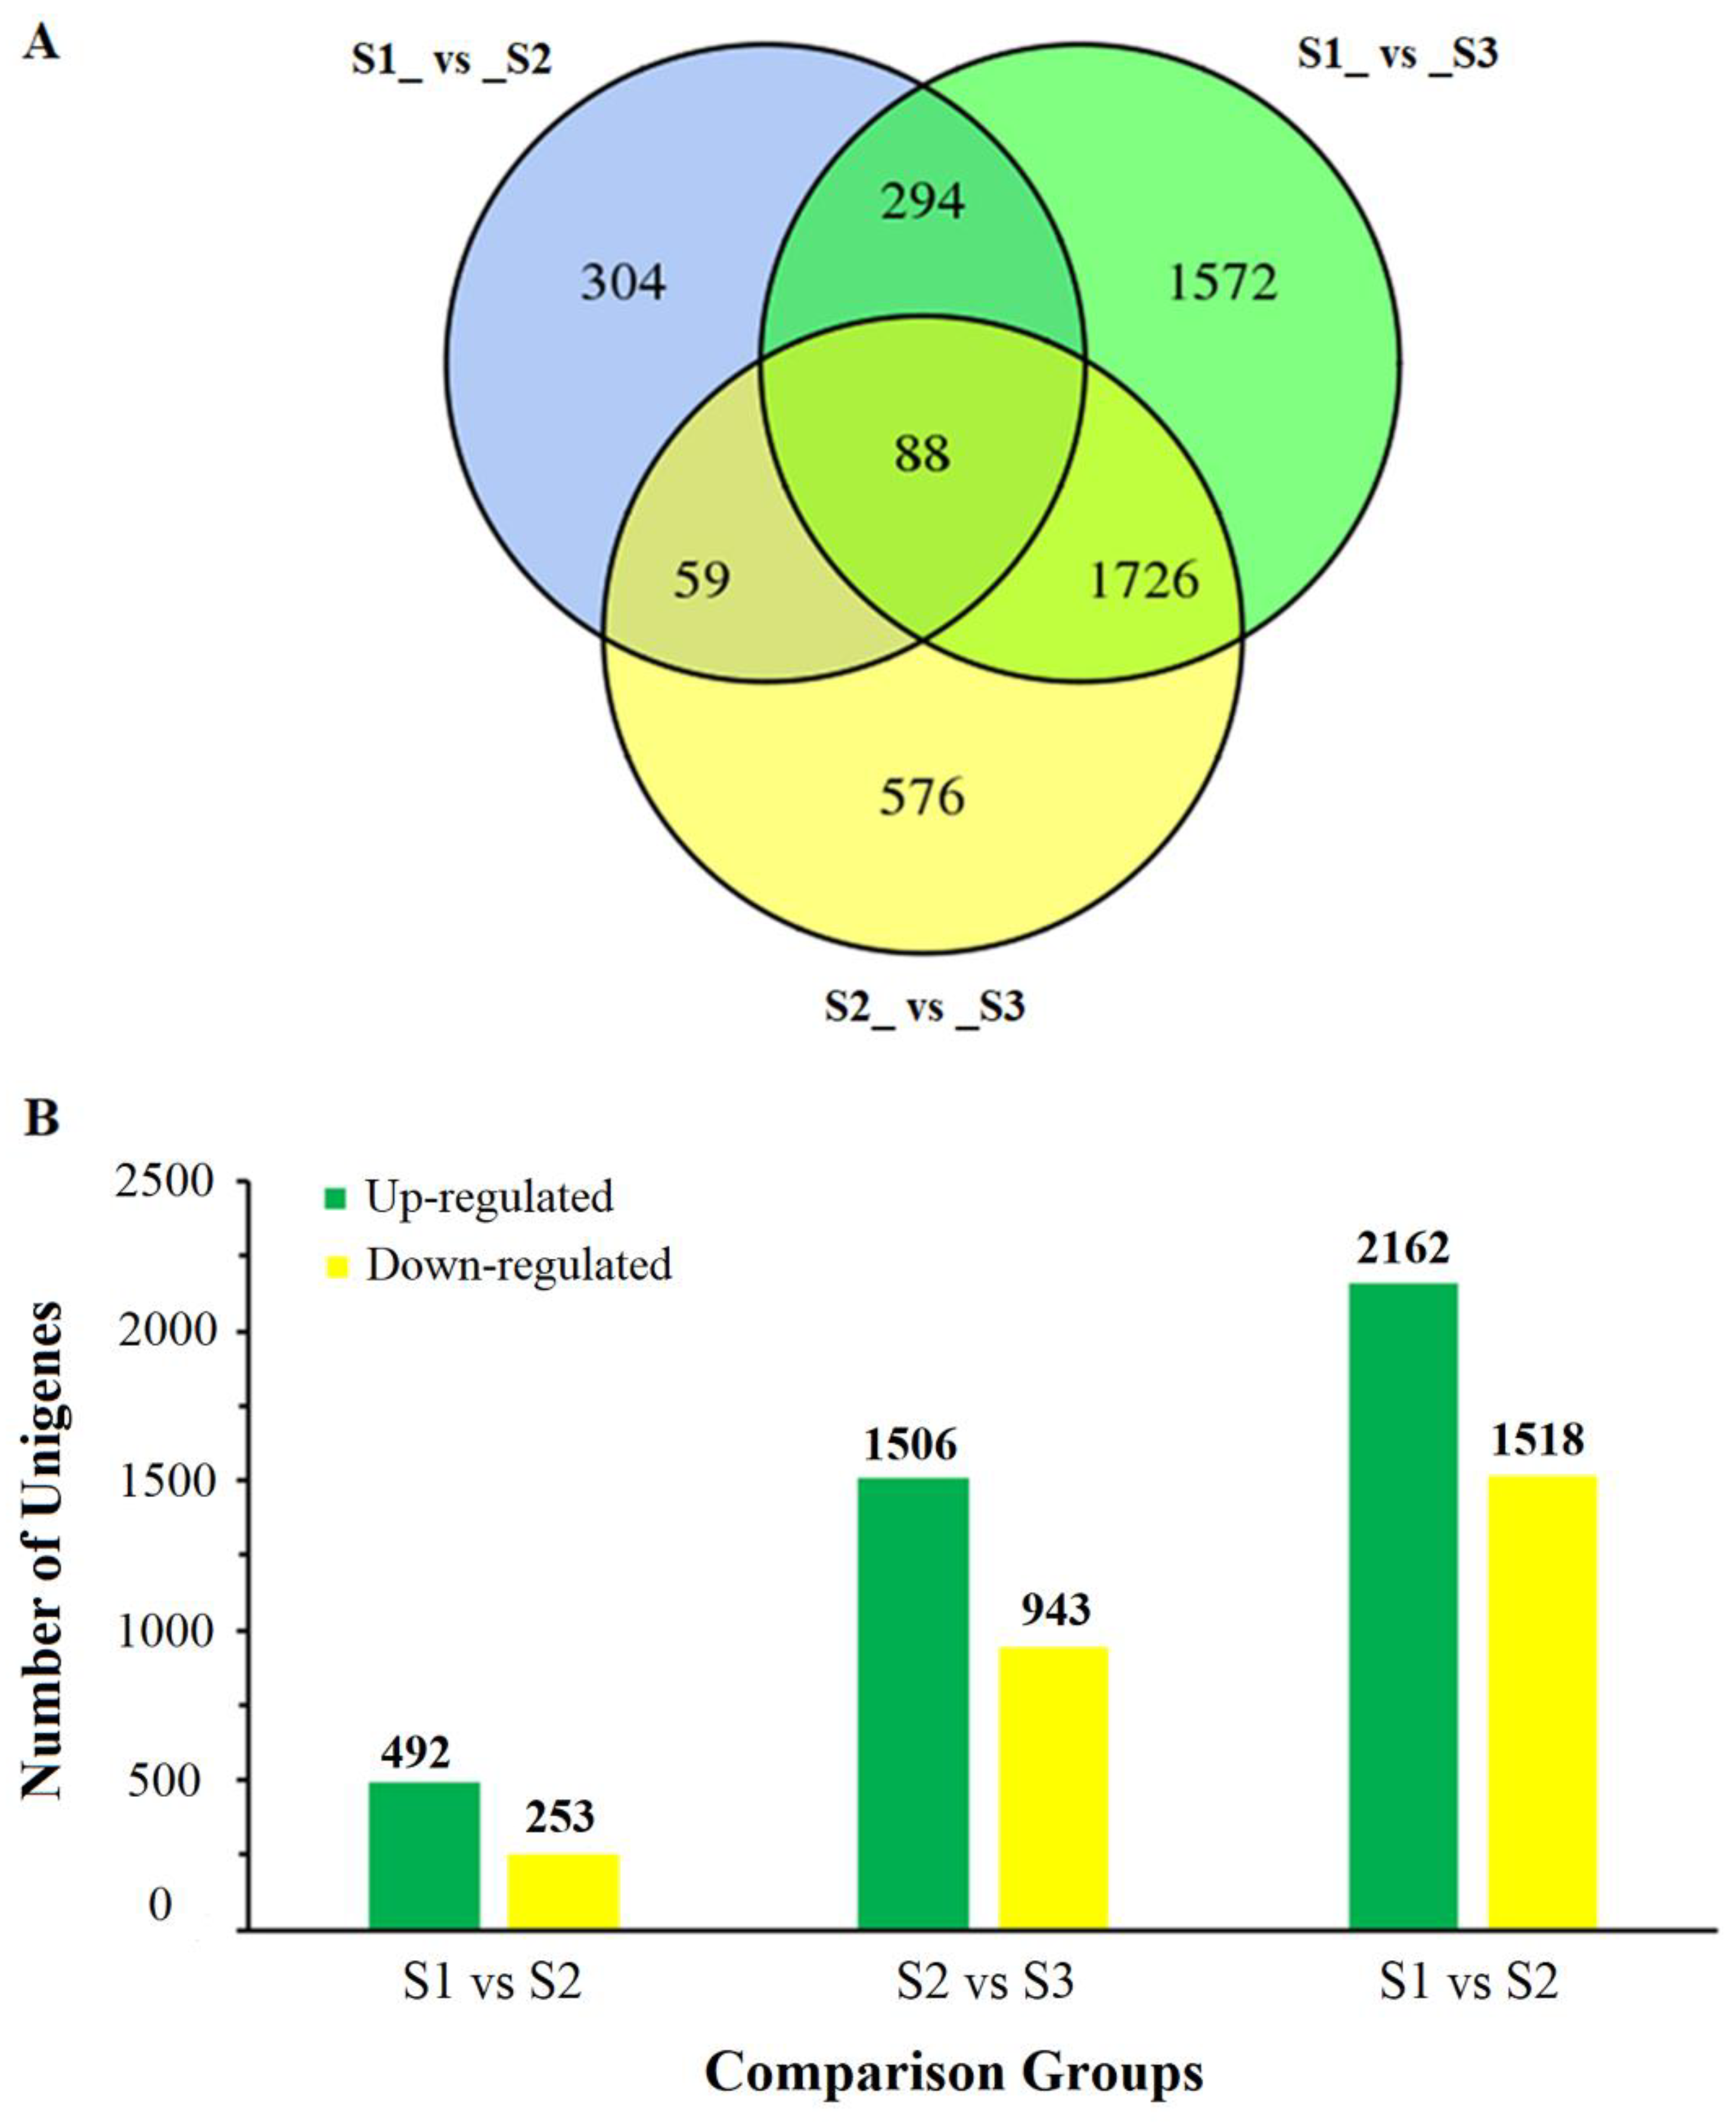
Then, gene expression levels among the three developmental stages were subjected to a pairwise comparison. A total of 4619 DEGs were identified, of which 745 (492 up- and 253 down-regulated), 2449 (1506 up- and 943 down- regulated), and 3680 (2162 up- and 1518 down-regulated) were found between S1 and S2, S2 and S3, and S1 and S3, respectively (Figure 2B). Of these DEGs, 304, 576, and 1572 DEGs specifically existed in the S1 vs. S2, S2 vs. S3, and S1 vs. S3 comparisons, respectively; 147, 382, and 1814 DEGs existed both in S1 vs. S2 and S2 vs. S3, S1 vs. S2 and S1 vs. S3, and S2 vs. S3 and S1 vs. S3, respectively; and 88 DEGs were contained in all three comparisons (Figure 2A).
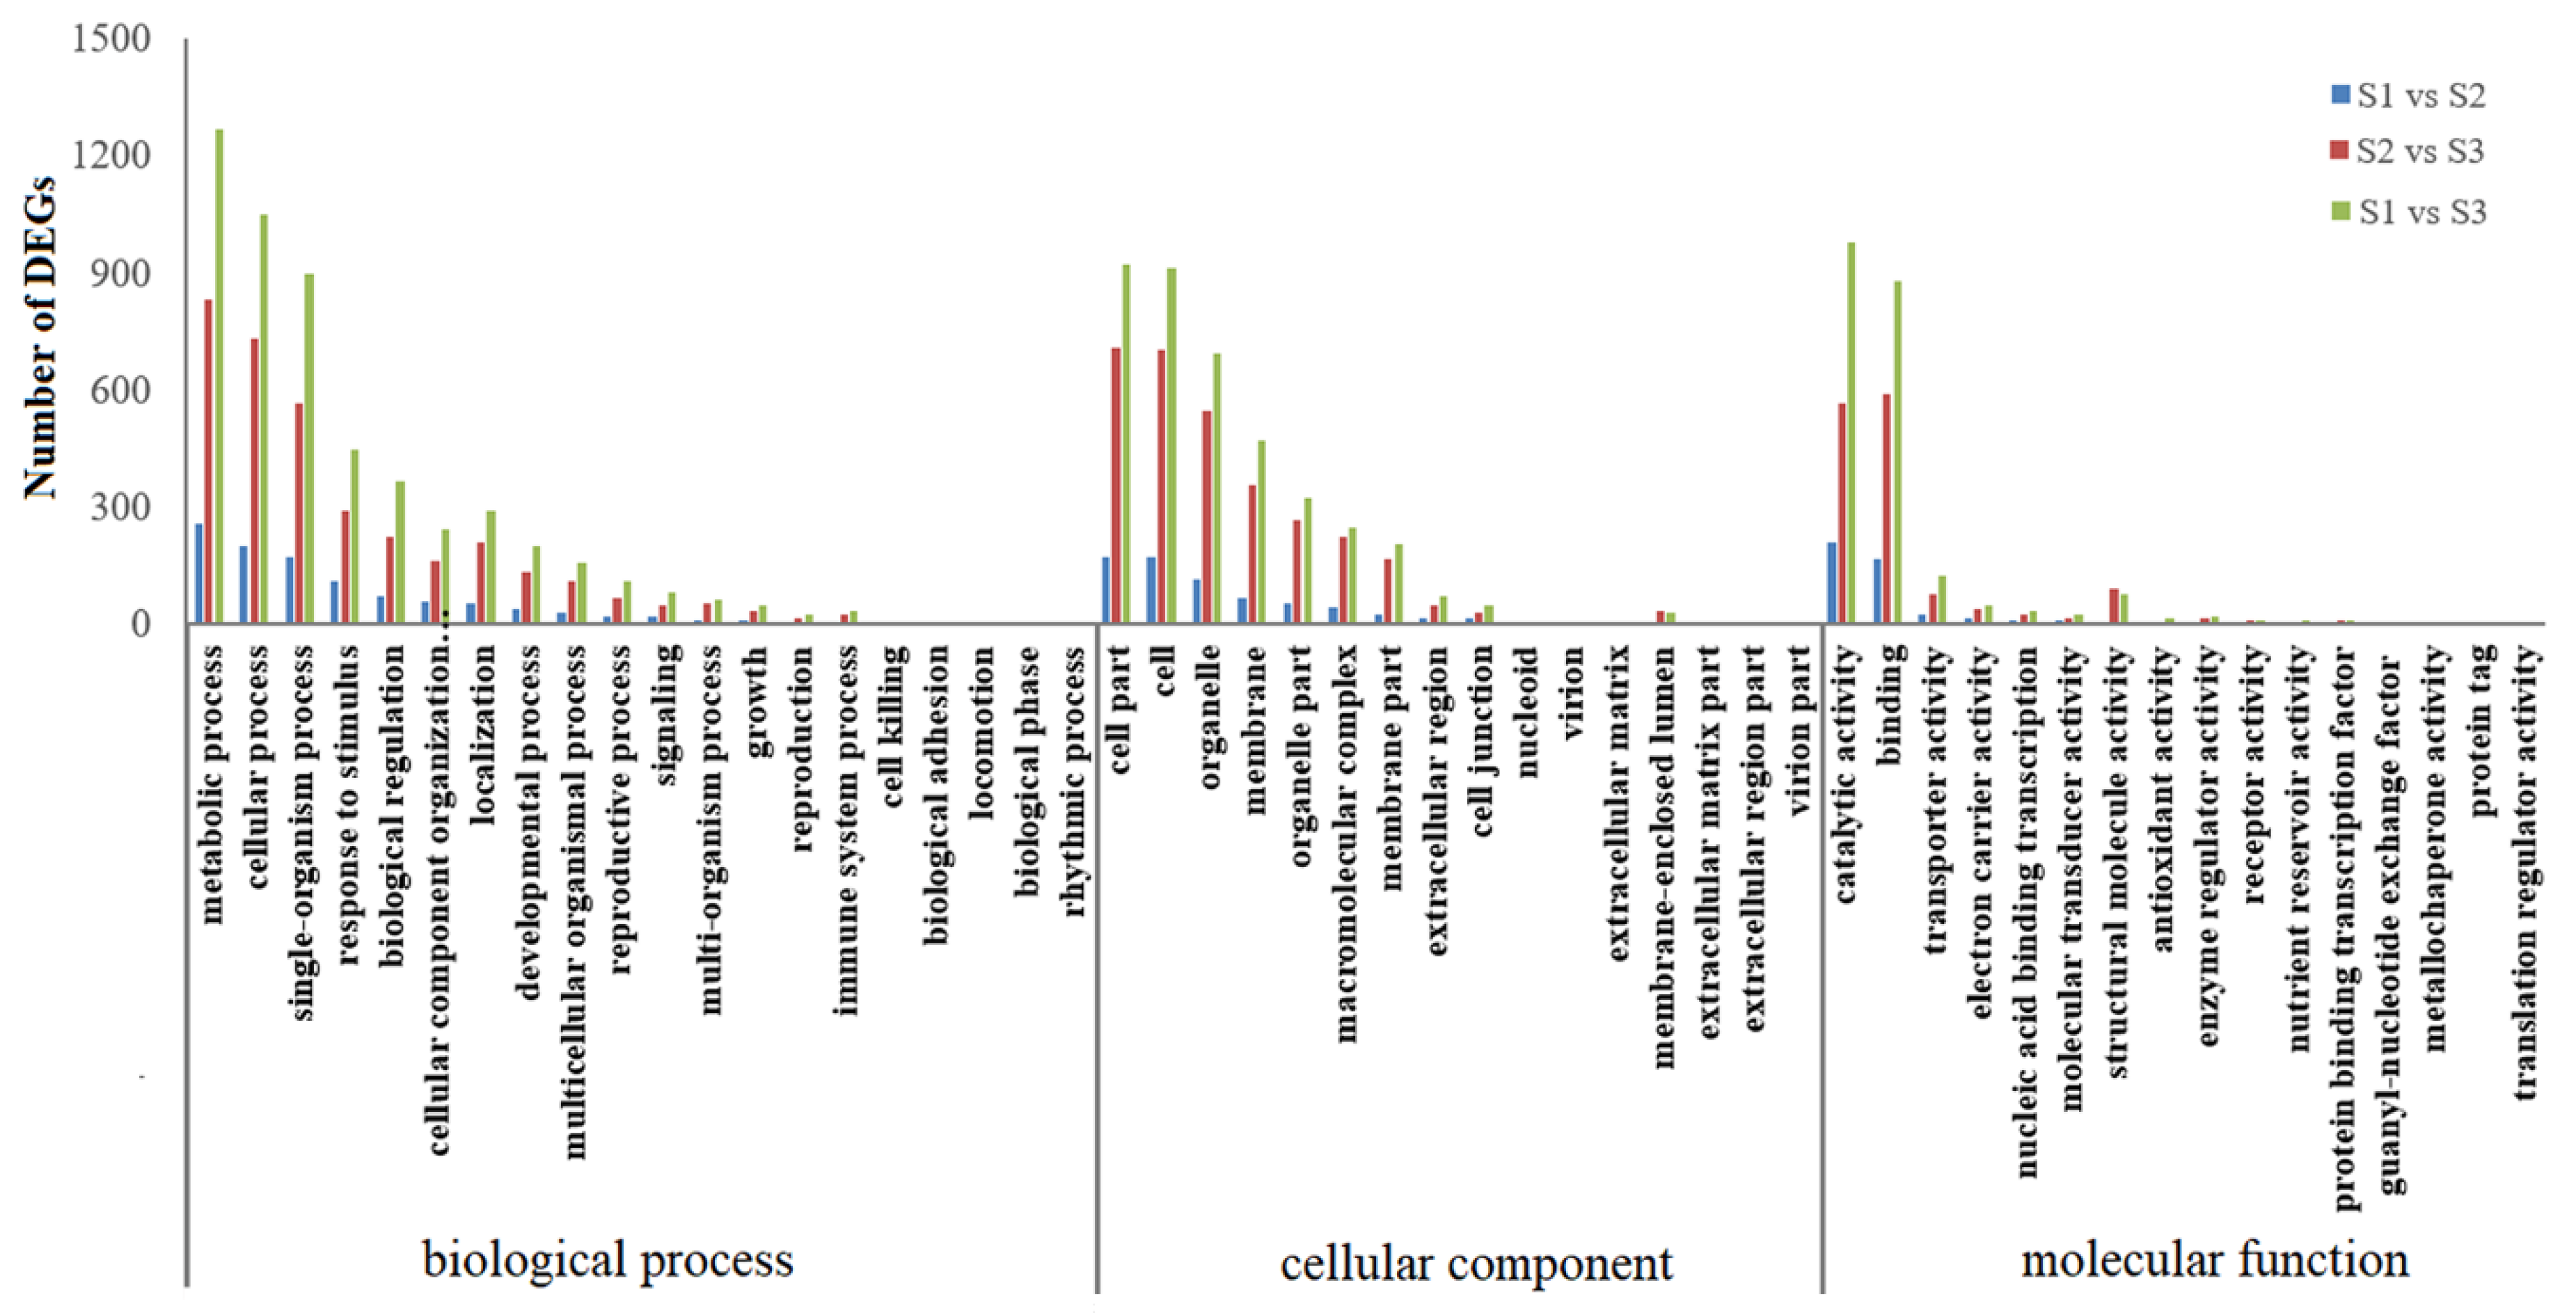
To further explore the function of these DEGs, Gene Ontology (GO) enrichment analysis was carried out. As a result, 395 (S1 vs. S2), 1244 (S2 vs. S3), and 1878 (S1 vs. S3) DEGs were divided into biological process, cellular component, and molecular function categories (Figure 3 and Table S2). As shown in Figure 3, the biological process category contained 20 functional groups, in which ‘metabolic process’, ‘cellular process’, and ‘single-organism process’ were the top three represented terms. In the cellular component category, 16 functional groups were enriched, and the most abundant terms were ‘cell part’, ‘cell’, and ‘organelle’. For the molecular function category, 16 functional groups were identified, and the terms with greatest abundance were ‘catalytic activity’, ‘binding’, and ‘transporter activity’.
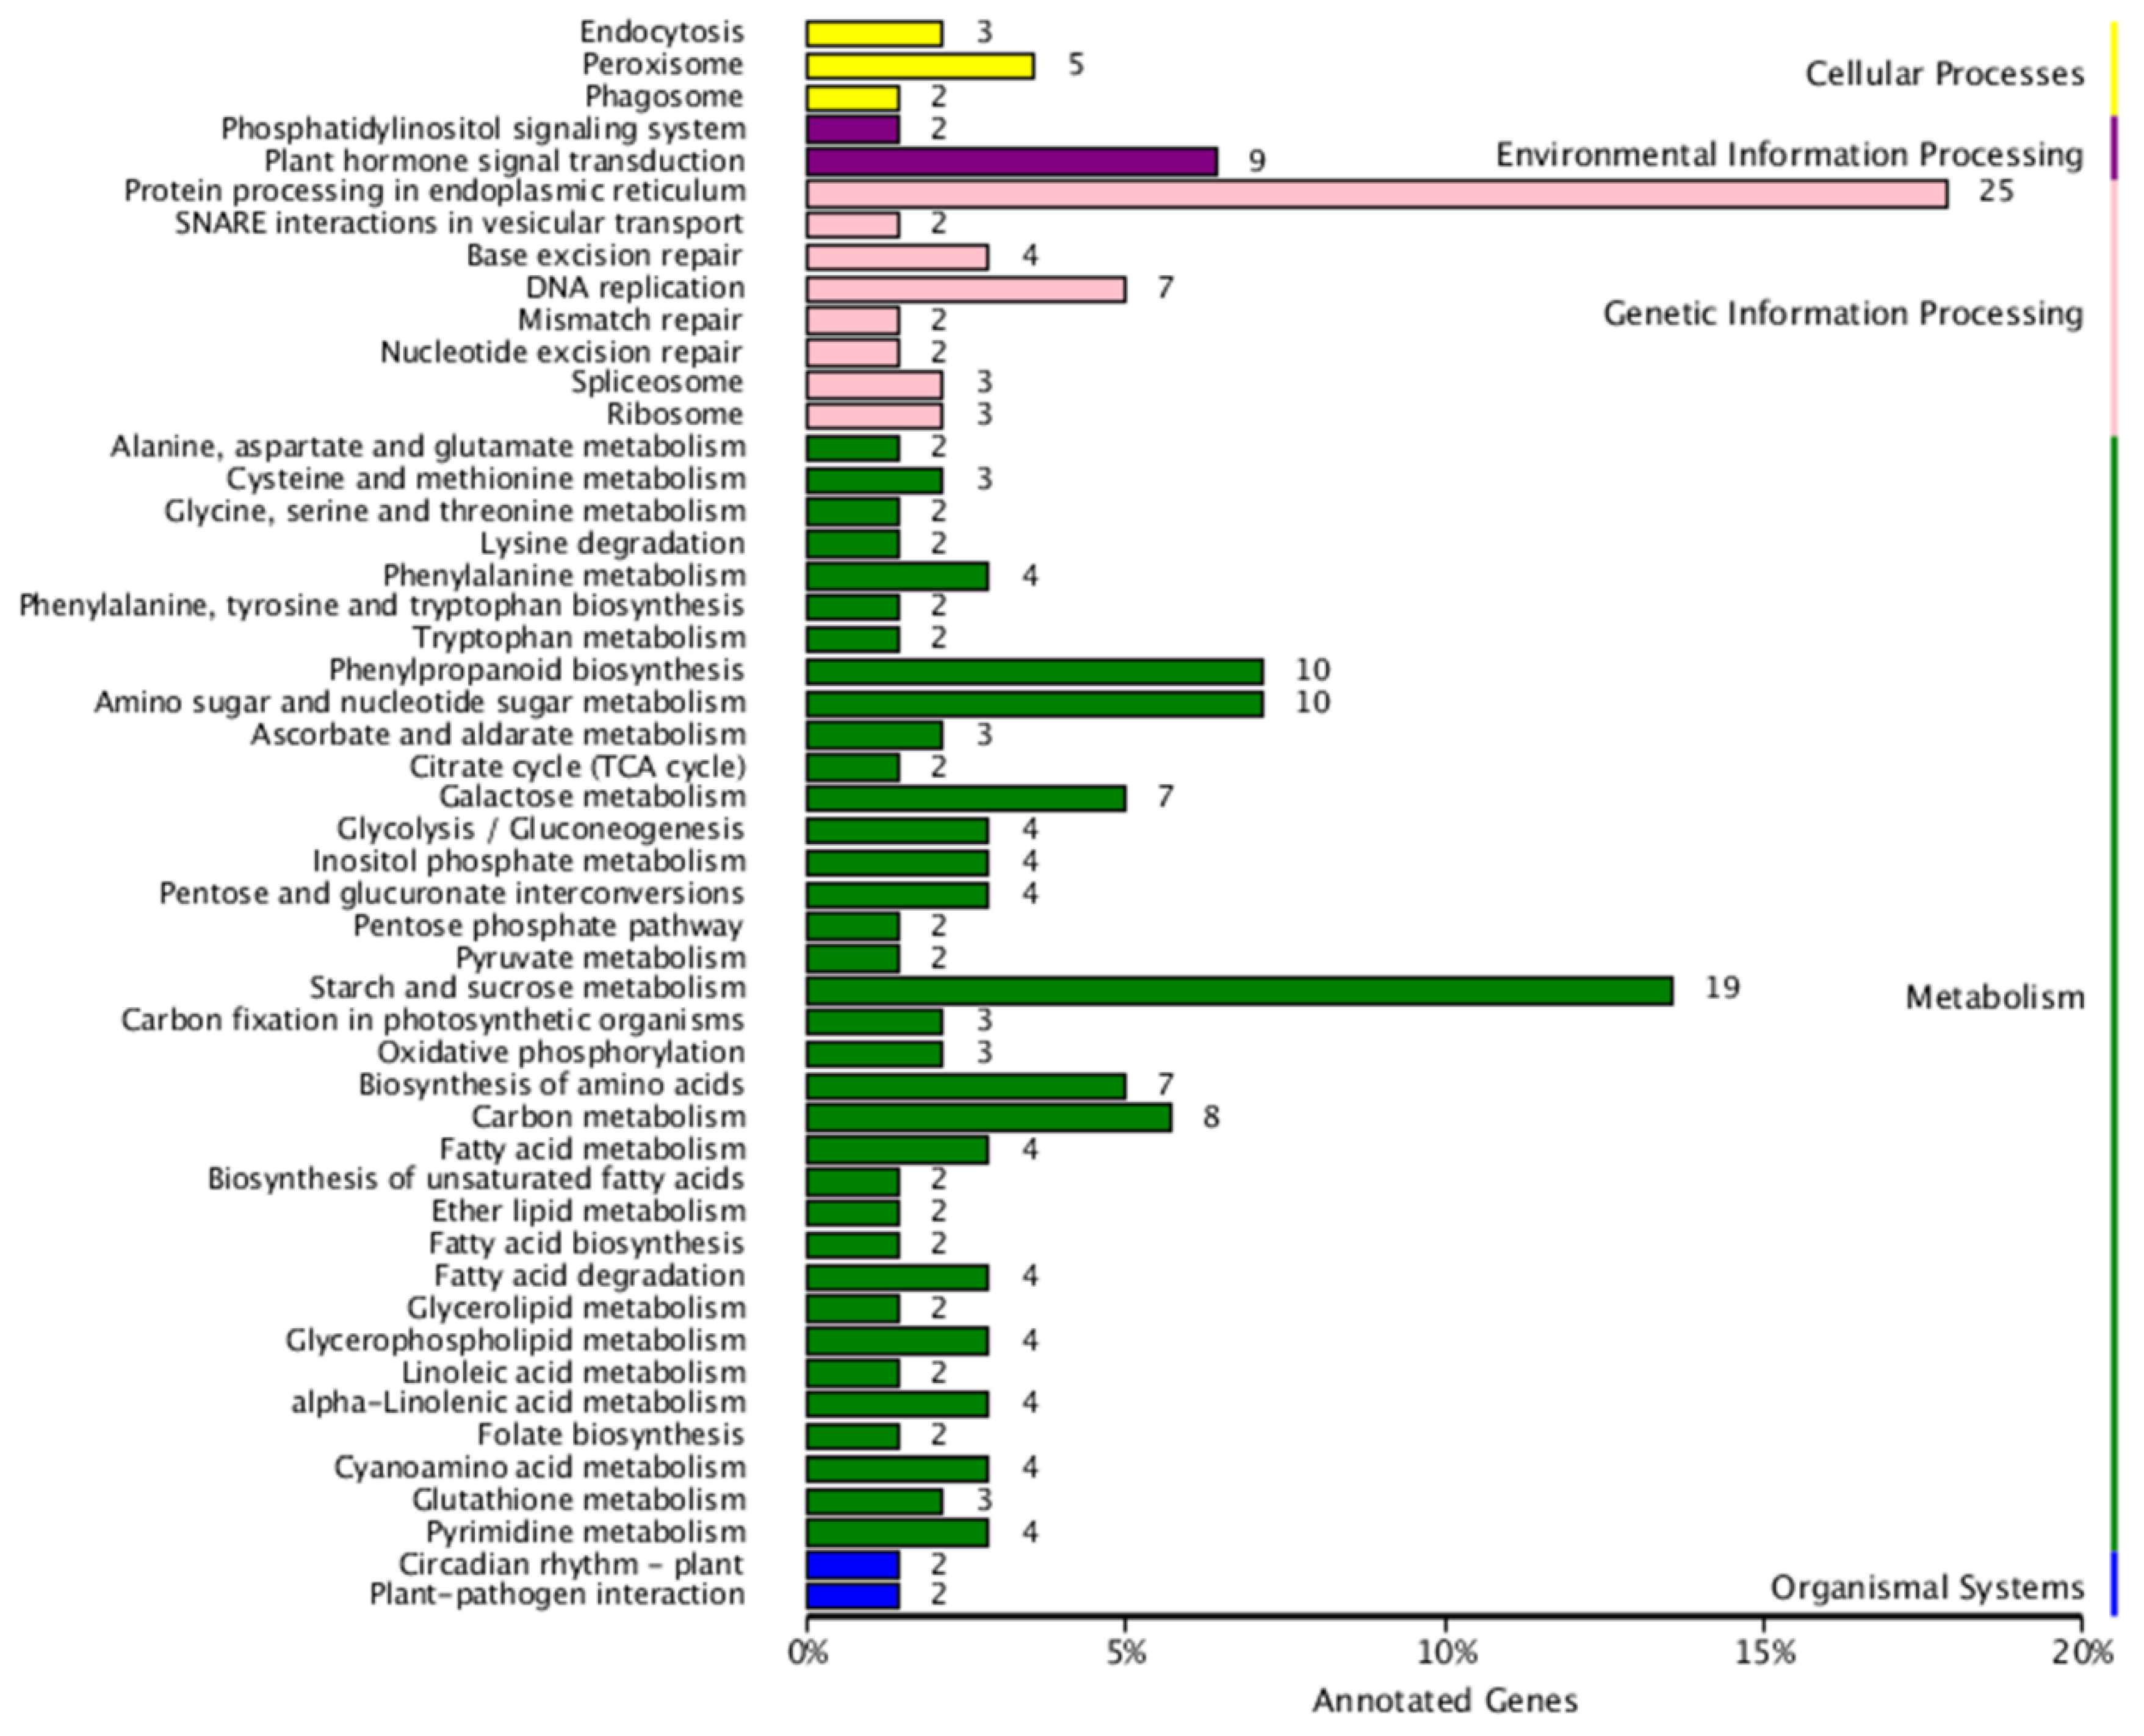
To investigate the metabolic pathways involved by the DEGs, Kyoto Encyclopedia of Genes and Genomes (KEGG) analysis was performed. A total of 237 (S1 vs. S2), 789 (S2 vs. S3), and 1244 (S1 vs. S3) DEGs were assigned to 69, 99, and 113 KEGG pathways, respectively (Table S3). All of the pathways from these three comparison groups could be further divided into five categories: Cellular processing, environmental information processing, genetic information processing, and metabolism and organismal systems (Figure 4 and Figures S1 and S2). Among the five groups, the metabolism group had the richest number of pathways. Furthermore, in the S1 vs. S2 comparison, the protein processing in endoplasmic reticulum (ko04141, 25genes), starch and sucrose metabolism (ko00500, 19 genes), amino sugar and nucleotide sugar metabolism (ko00520, 10 genes), and phenylpropanoid biosynthesis (ko00940, 10 genes) were the most abundant pathways (Figure 3). In S2 vs. S3, DEGs were most highly enriched in the ribosome (ko03010, 80 genes), protein processing in endoplasmic reticulum (ko04141, 62 genes), spliceosome (ko03040, 37 genes), and starch and sucrose metabolism (ko00500, 31genes) (Figure S1). The top four DEGs from S1 vs. S3 were mapped to the ribosome (ko03010, 60 genes), starch and sucrose metabolism (ko00500, 57 genes), protein processing in endoplasmic reticulum (ko04141, 53 genes), and carbon metabolism (ko01200, 43 genes) (Figure S2).

2.3. Key Genes Involved in the Seed Development of Common Buckwheat

2.3.1. DEGs Involved in Ca2+ Signal Transduction Pathways

Genes involved in Ca2+ signaling pathway regulate many plant development processes, including seed development [29,30]. According to the GO annotations, 22 DEGs involved in the Ca2+ signaling pathway were identified (Table 2). These genes encode calmodulin-like proteins (CMLs), calmodulin binding-like proteins (CBLs), cation/Ca2+ exchangers (CCXs), Ca2+-dependent protein kinases (CDPKs), CBL-interacting protein kinases (CIPKs), Ca2+-transporting ATPase, and Cation/H+ antiporter (CHX). As shown in Table 2, these genes display five different expression patterns: Up-regulated both at S2 and S3 (1 CML), up-regulated at S2 and down-regulated at S3 (1 CBL, 2 CDPKs, 1 CIPK, and 2 Ca2+-transporting ATPases), only down-regulated at S2 (1 CDPK), only up-regulated at S3 (2 CMLs), and only down-regulated at S3 (1 CBL, 2 CCXs, 1 CDPK, 4 CIPKs, 2 Ca2+-transporting ATPases, and 2 CHXs).

2.3.2. DEGs Involved in Hormone Signal Transduction Pathways

Hormone signals play an important role in plant seed development. Based on the KEGG enrichment analysis results, 30 DEGs were assigned to “plant hormone signal transduction” (ko04075), including the auxin, CK, GA, BR, ABA, ET, JA, and SA signaling pathways (Table 3). In the auxin signaling pathway, one gene encoding auxin-responsive protein (IAA) was up-regulated at S2, five IAA genes were up-regulated at S3, and one ortholog of AFR encoding for auxin response factor was up-regulated both at S2 and S3 (Table 3). Moreover, one ortholog of AUX1 encoding for auxin influx carrier and two IAA were down-regulated at S3. In the cytokinin pathway, one ARR (two-component response regulator) and one AHP (histidine-containing phosphotransfer protein) were increased at S2 and S3, respectively (Table 3). In the GA pathway, one PIF3 (phytochrome-interacting factor 3) showed up-regulated trends during seed development, and one ortholog of bHLH127 was increased only at S3 (Table 3). In the ABA pathway, there were two up- and one down-regulated transcripts at S2, which belonged to PP2C (protein phosphatase 2C) and ABF (encoding for ABA responsive element binding factor), respectively. In addition, one PYR/PYL (abscisic acid receptor), one PP2C, and one SnRK2 (serine/threonine protein kinase) were down-regulated at S3 (Table 3). In the ET pathway, two orthologs of EIN3 (Ethylene-Insensitive Protein 3) were up-regulated at S2 and S3, respectively. Furthermore, two ETR (Ethylene Receptor), one EIN4 (Ethylene-Insensitive Protein 4), and one CTR1 (serine/threonine-protein kinase) were down-regulated at S3 (Table 3). In the BR pathways, one BRI1 (Brassinosteroid Insensitive 1) was down-regulated at S3, and other BRI1 displayed up-regulated at S2 and down-regulated at S3 (Table 3). In addition, one DEG was involved in both the JA and SA pathways, which was up-regulated (JAZ) at S3 and down-regulated (TGA) at S2 (Table 3), respectively.

2.3.3. DEGs Involved in TFs

TFs are the key regulatory proteins in seed development. Therefore, the expression dynamics of TF genes in the development of common buckwheat were investigated. According to the RNA-seq data, a total of 2453 TFs were identified as expressed in at least one development phase (Table S4). The top ten largest TF families were FAR1 (231), C2H2 (185), AP2 (169), bHLH (158), MYB (154), MYB-like (137), ZF-HD (110), NAC (107), bZIP (105), and B3 (97). The comparison among these three development samples found that 41 (30 up- and 11 down-regulated), 82 (47 up- and 35 down-regulated), and 144 (86 up- and 58 down-regulated) TFs had significantly differential expression in S1 vs. S2, S2 vs. S3, and S1 vs. S3, respectively (Table S3). Among these, the TF families with the largest numbers were AP2 (9), bHLH (11), and AP2 (22) for these three comparison groups, respectively (Table S5).

2.3.4. DEGs Involved in Seed Size

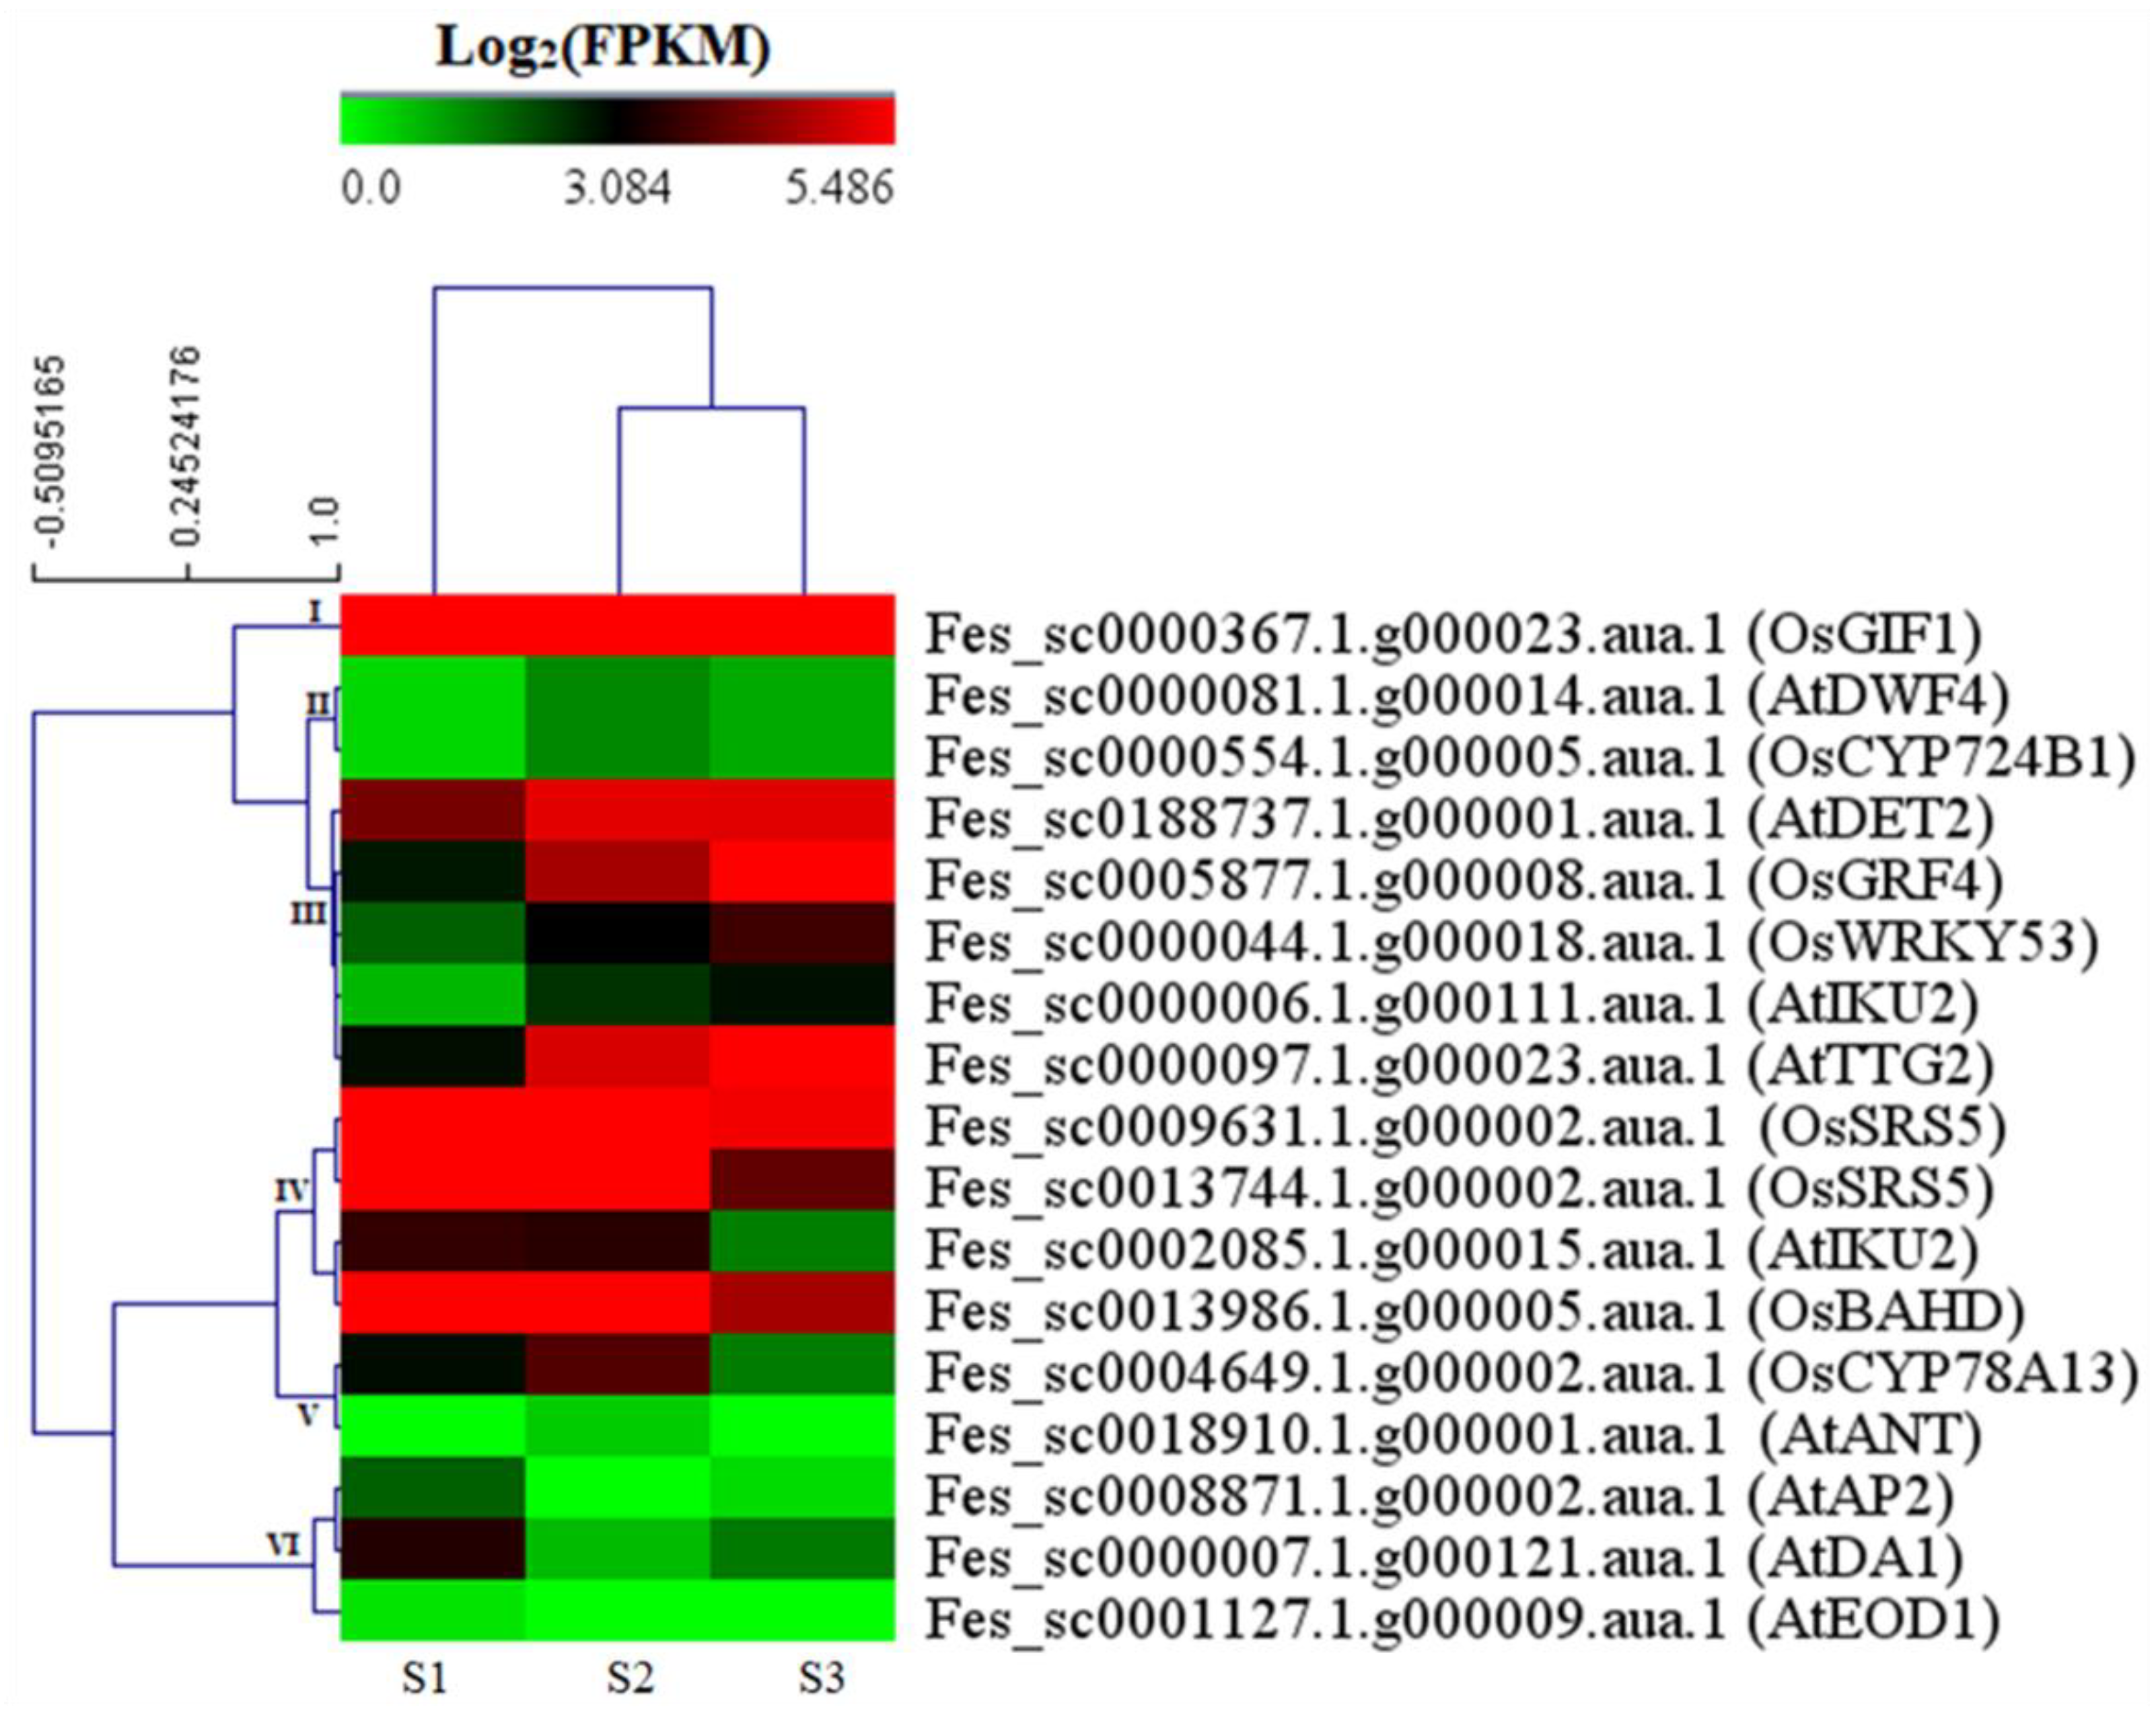
Seed size is a key factor to determine seed yield in crops. To identify the genes involved in the seed size of common buckwheat, 95 known seed size-related genes from different plant species were used to homologously search the DEGs (Table S6). As a result, 17 DEGs were identified as the orthologs of 15 known seed size-related genes (AtANT, AtAP2, AtDA1, AtDET2, AtDWF4, AtEOD1, AtIKU2, AtTTG2, OsSLG, OsGRF4, OsGIF1, OsSRS5, OsWRKY53, OsCYP78A13, and OsCYP724B1) (Table S7). Of these, two genes (DWF4 and CYP724B1) and one gene (GIF1) showed up-regulation only at S2 or at S3, respectively; five genes (DET2, GRF4, WRKY53, IKU2, and TTG2) were up-regulated during seed development stages; four genes (SSR5, SSR5, IKU2, and SLG), with high expression at S1 and S2, were down-regulated at S3; two genes (CYP78A13 and ANT) were up-regulated at S1 compared to S2, and followed by down-regulation at S3; however, three genes (AP2, DA1, and EOD1) displayed the opposite expression pattern with CYP78A13 and ANT, which were down-regulated at S1 compared to S2, and followed by up-regulation at S3 (Figure 5 and Table S7).

2.3.5. DEGs Involved in Starch Biosynthesis

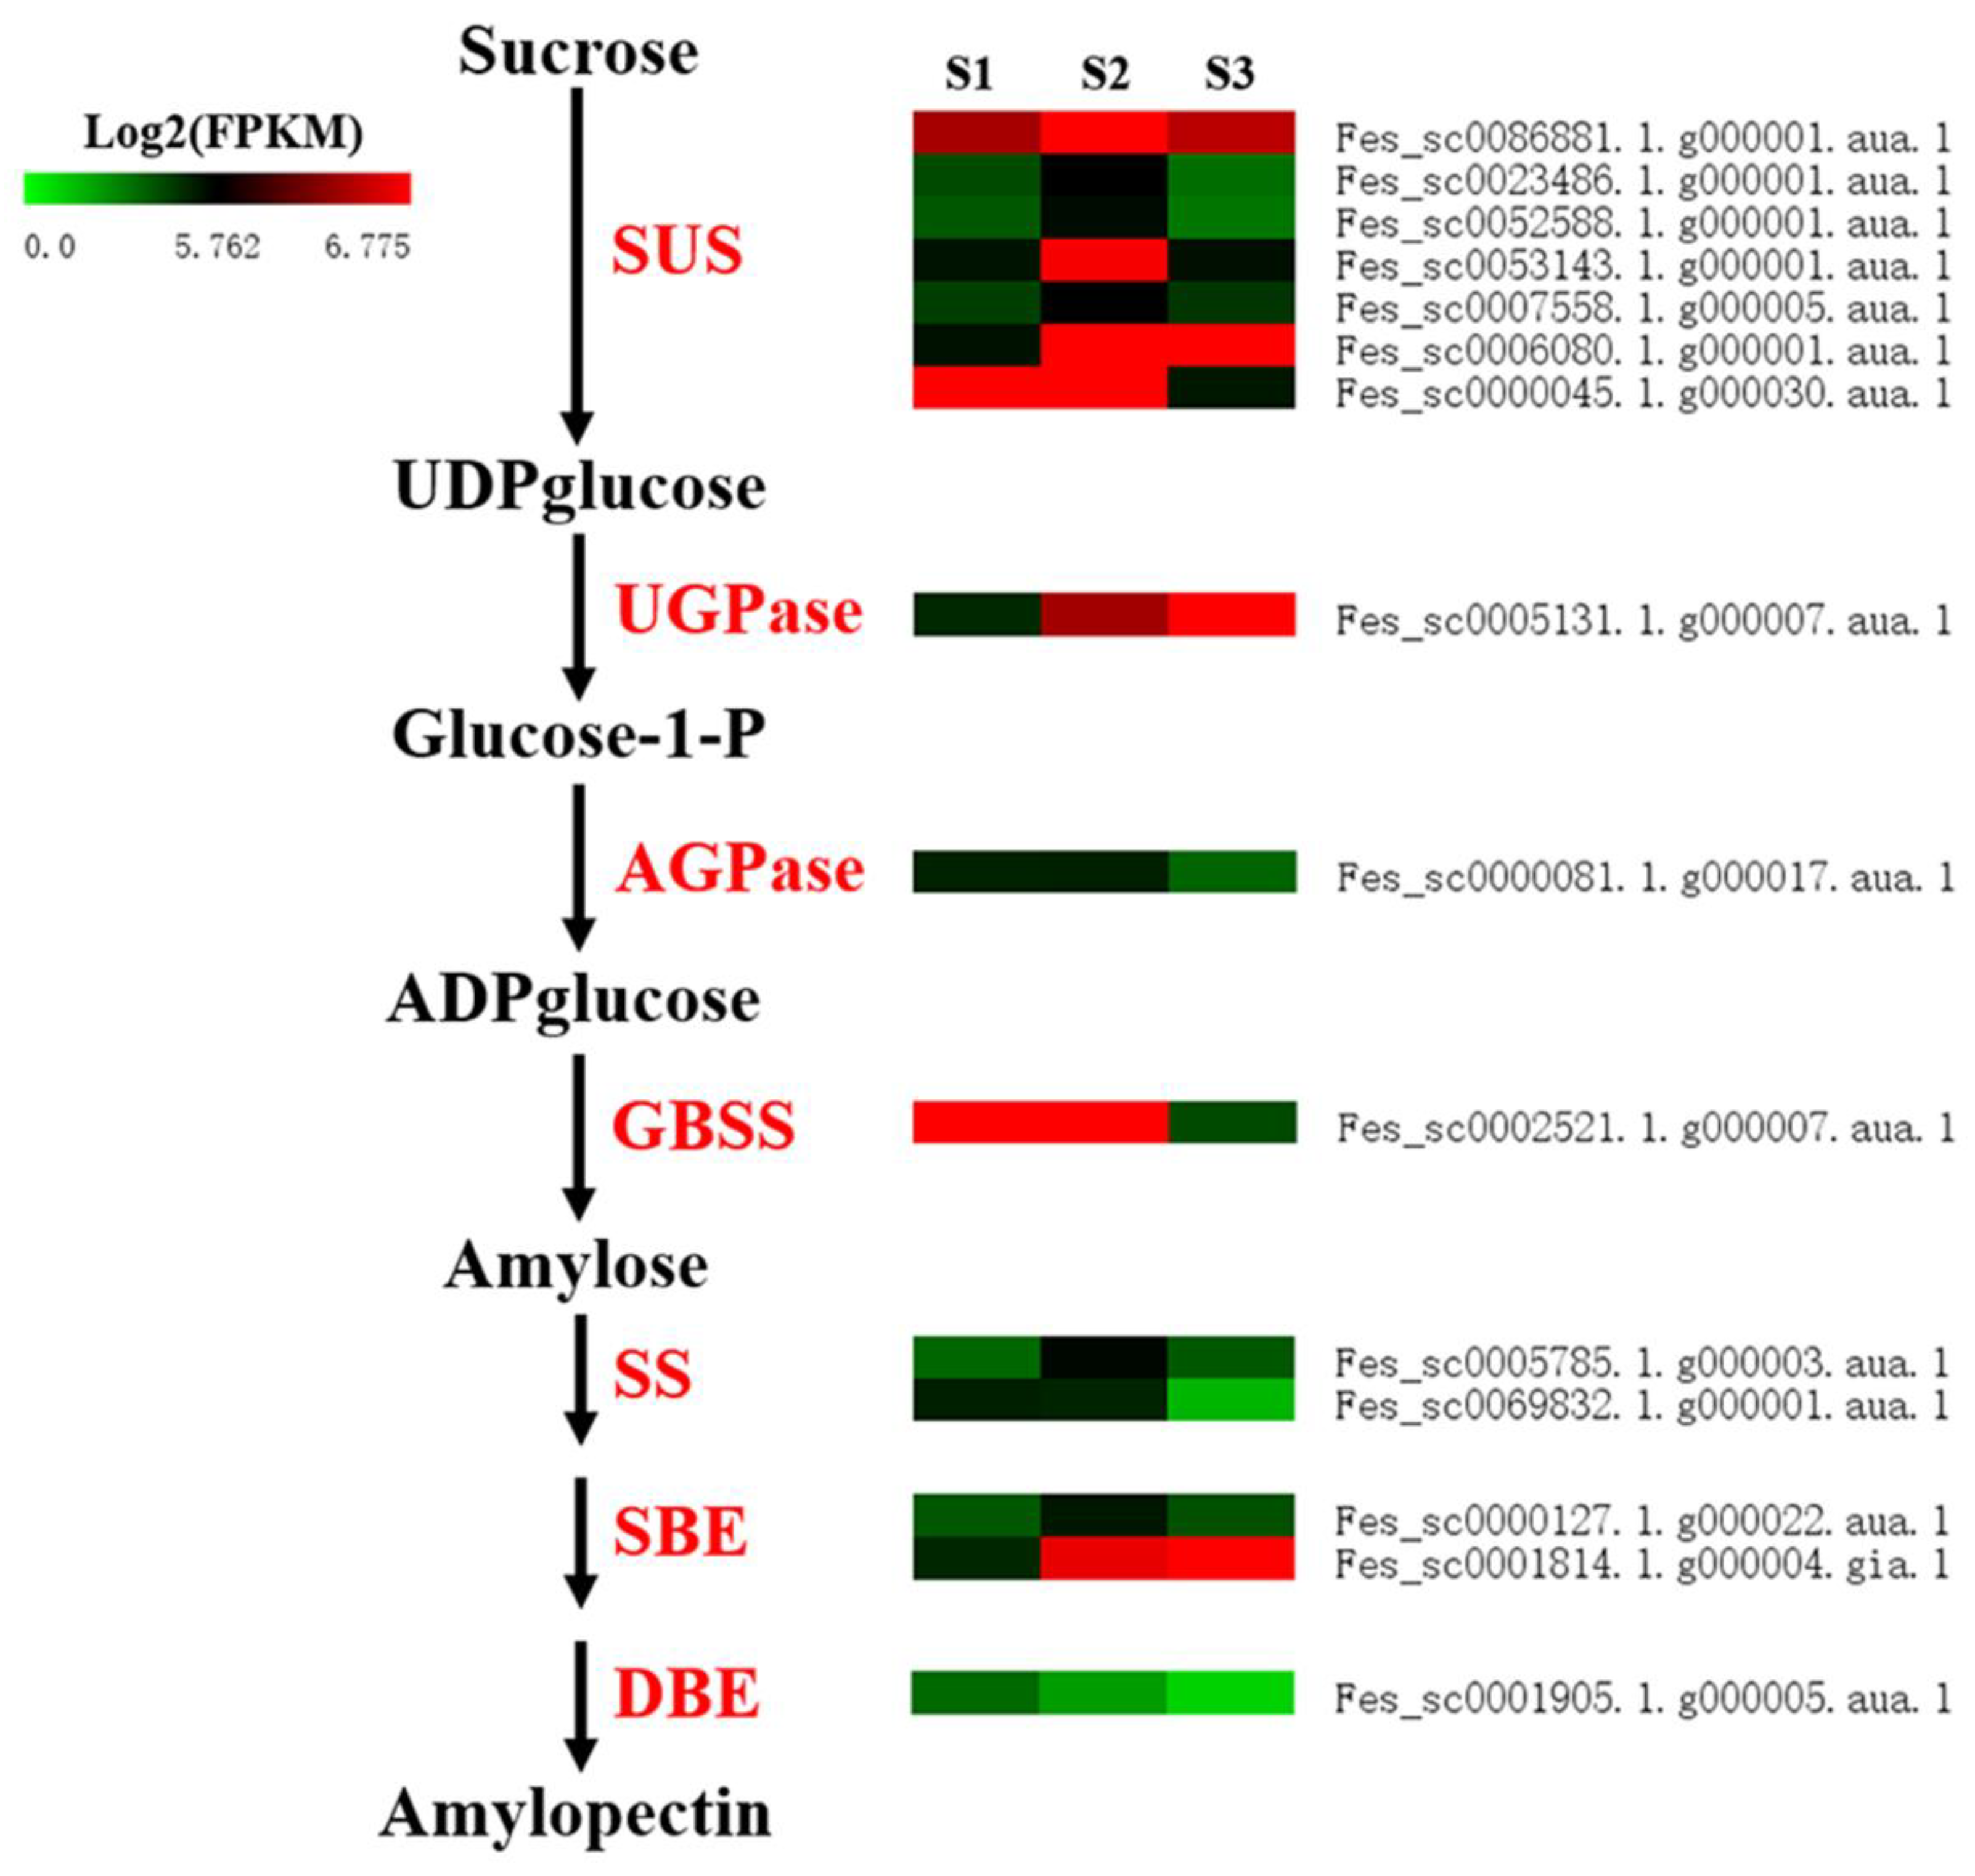
To provide insight into the transcriptional dynamics of starch biosynthesis genes, a total of 25 sucrose synthase (SUS), 3 UDP glucose pyrophosphorylase (UGPase), 14 ADP glucose pyrophosphorylase (AGPase), 8 granule bound starch synthase (GBSS), 24 starch synthase (SS), 4 starch-branching enzyme (SBE), and 3 debranching enzyme (DBE) genes were identified by using the starch biosynthesis-related genes in Arabidopsis to perform a homologous comparative search in the common buckwheat genome database (Table S8). Of these, four SUS, one UGPase, and one SBE genes showed up-regulation only at S2; one SUS, one AGPase, one GBSS, and one SS displayed down-regulation only at S3; two SUSs and one SS, and one SBE gene were up-regulated at S2, and followed by down-regulation at S3; one DBE gene was down-regulated with all seed development stages (Table 4 and Figure 6).

2.4. qRT-PCR Validation of RNA-Seq Results

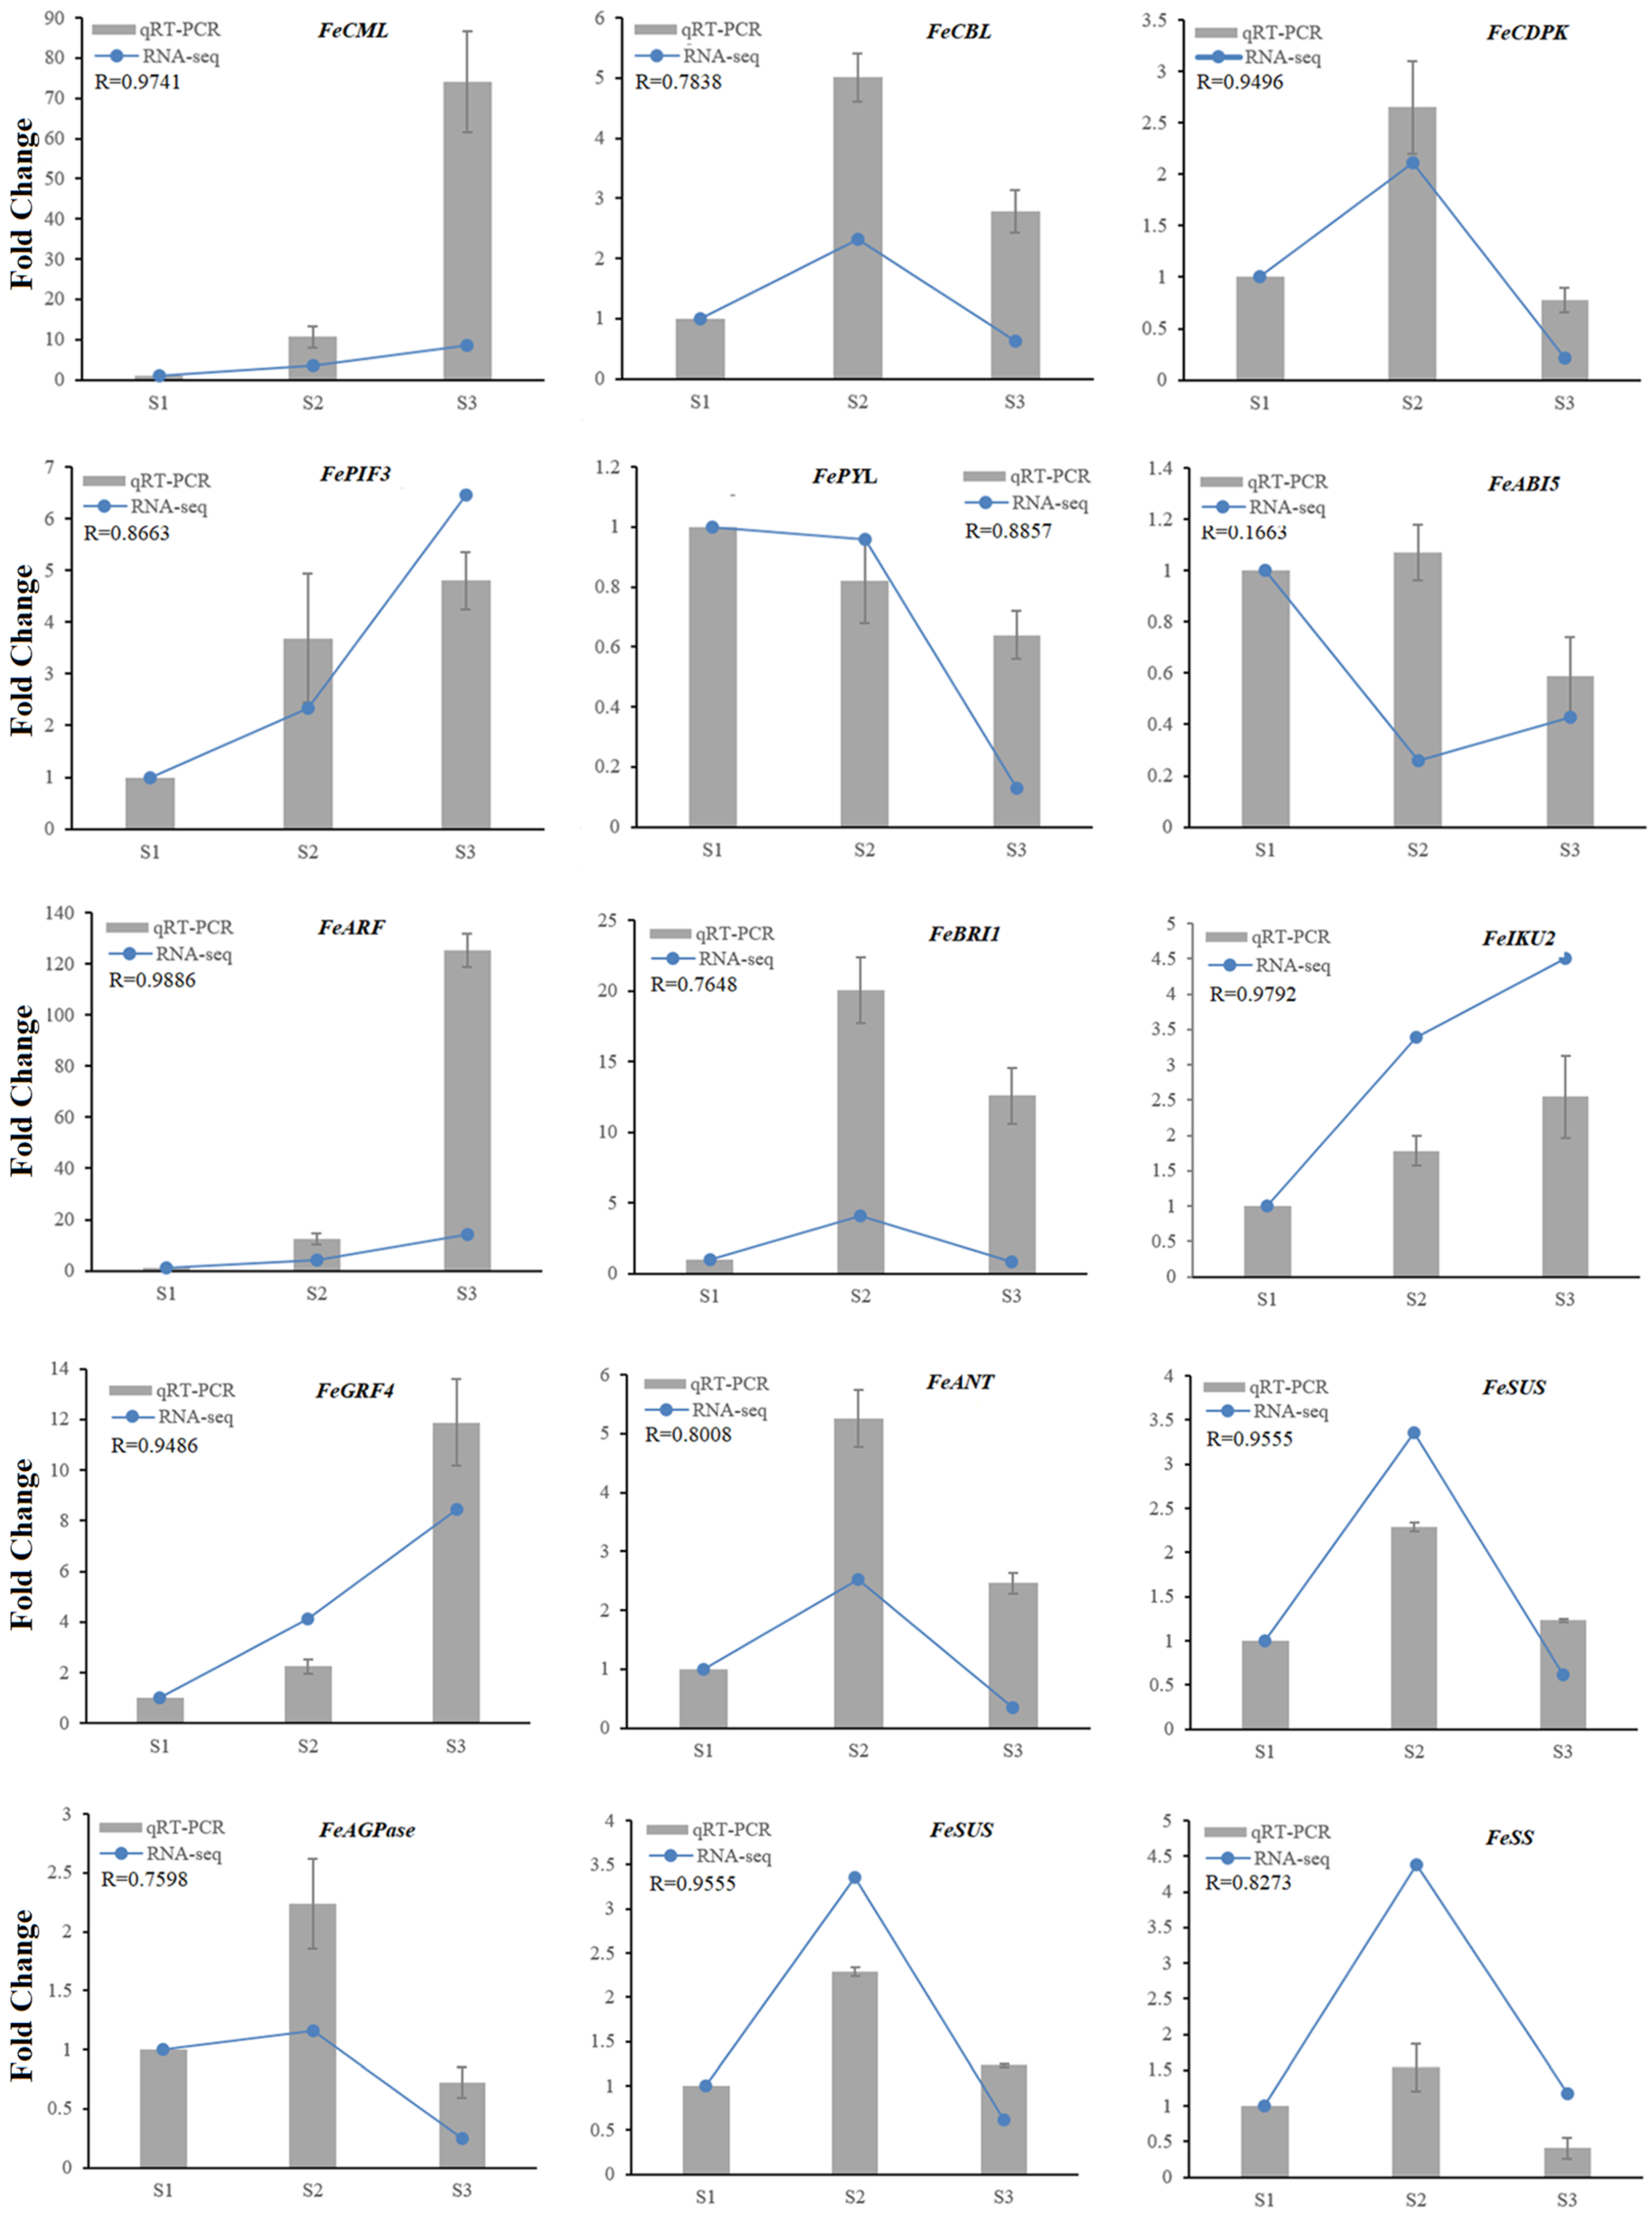
Based on the results mentioned above, 15 genes which had significantly differential expression during seed development were selected by performing qRT-PCR assays to validate the correlation against RNA-Seq. The results showed that 14 genes had high correlation between the qPCR and RNA-Seq data sets (Figure 7), which thus verified the transcriptomic data.

3. Discussion

The seed development of crop plants affects not only seed fate, but also final seed yield and quality. Thus, an in-depth understanding of the molecular mechanisms of seed development is crucial in improving seed yield and quality of crop plants. To date, many genes that contribute to seed development have been identified and functionally verified, and molecular pathways have been deciphered in the model plants Arabidopsis and rice [4,5,6,7,8,9]. Furthermore, in some other crop plants, transcriptome analysis has been performed to give insight into the transcriptional dynamics of seed development and provided some clues as to the development of seeds [10,11,12,13,14,15,16,17,18,19,20,21]. In this study, we performed a transcriptome analysis during common buckwheat seed development to give insight into its transcriptional dynamics and find candidate genes that might be involved in seed development.
In total, 242.86 million clean reads were obtained from nine sequencing libraries, and 63.32 to 69.46% clean reads for each library were mapped to the reference genome. The map rate was relatively low, which might have been caused by the draft assembly of the common buckwheat genome [22]. The Q30 percentage was over 93% for each library, and the range of GC content was 47.77–50.58% for each library. Furthermore, the reproducibility was very well (r > 0.95) for the three replicates of each sample. These results indicated that the RNA-Seq had higher quality. Through comparison of gene expression patterns between different samples, 4619 DEGs were identified, and the DEGs involved in the Ca2+ signaling pathway, hormone signaling pathway, TFs, seed size, and starch biosynthesis were the main focus of this study.
The Ca2+ signal transduction pathways participate in many developmental processes in plants, including pollen tube growth, stem elongation, vascular development, embryogenesis, and seed germination [29,30]. In addition, some studies have also indicated that the Ca2+ signal transduction pathways play an important role in seed development with a focus on CDPK. For example, several CDPK genes were differential or special expression during seed development in rice, maize, and peanut, some of which expressed dominant in the early stage, while others expressed prominently in the latter stage [29,31,32,33,34,35,36], suggesting that different CDPK genes might be involved in different development process of seeds. Furthermore, OsCDPK2, OsCDPK11, and OsCDPK23 in rice and RcCDPK1 in castor have been functionally verified to be essential for seed development [32,34,35,36]. In this study, four CDPK genes were identified as DEGs during common buckwheat seed development. Among them, two were up-regulated at S2 and down-regulated at S3, and one was only decreased at S3, indicating that they might have an important role in the early stages of common buckwheat seed development. In contrast, the other one was down-regulated at S2, suggesting that it might have an opposed function during common buckwheat seed development with the previous three CDPK genes. In addition, we also identified another 18 DEGs involved in the Ca2+ signaling pathway, including 3 CML, 2 CBL, 2 CCX, 5 CIPK, 4 Ca2+-ATPase, and 2 CHX genes, which displayed similar expression patterns with CDPK genes. These results indicate that the Ca2+ signaling pathway is conserved in regulatory seed development and that these identified DEGs could be key candidate genes for the seed development of common buckwheat.
It is well known that hormone signaling, including auxin, CK, GA, BR, ABA, and ET signaling, plays a crucial role in seed development [8,9]. In tartary buckwheat (Fagopyrum Tararicum), a dozen of these hormone-related DEGs were identified by RNA-seq, which displayed different expression patterns during seed development [17,18]. In this study, based on KEGG pathway enrichment analysis, we also identified a dozen genes expressed differentially in these hormone signaling pathways during common buckwheat seed development, and also found that some of them have the similar expression patterns with those in tartary buckwheat. Both our study and previous studies have suggested that these hormone signaling pathways are conserved for seed development in different seed plants. Notably, we found one JAZ and one TAG gene, which are the key genes in the JA and SA signaling pathways, respectively, were also differentially expressed during common buckwheat seed development, implying that the JA and SA signaling pathways probably also have important roles in common buckwheat seed development.
Seed size is a key factor to determine yield in crops. The identification of genes associated with seed size will support yield improvement. To date, over 90 genes have been identified and functionally validated to regulate seed size in different seed plants [9]. In our study, 17 DEGs were identified as the orthologs of 15 known seed size genes from Arabidopsis and rice. Among these, the expression level of the orthologs of AtAP2, AtDA1, AtEOD1, and OsSLG were down-regulated during seed development. Interestingly, AtAP2 [37,38], AtDA1 [39], AtEOD1[39,40], and OsSLG [41] have been demonstrated to negatively regulate the seed size in Arabidopsis and rice, respectively. This indicates that these genes from common buckwheat may also negatively regulate the seed size. In contrast, the orthologs of several positively-regulated genes for seed size, such as AtIKU2 [42], OsGRF4 [43,44], OsGIF1 [43,44], OsCYP78A13 [45,46], OsCYP724B1 [47], AtDET2 [48], AtDWF4 [48], OsWRKY53 [49], AtANT [50], and AtTTG2 [51], were increased at express level in at least one development stage, suggesting that they have a conservative function of positively regulating the seed size of common buckwheat. Notably, the expression level of the orthologs of OsCYP78A13 and AtANT were up-regulated at filling stage and down-regulated at initial maturity stage, indicating that they might regulate the accumulation of seed storage materials and ultimately affect seed size. In addition, an ortholog of AtIKU2 and two orthologs of OsSRS5 (positively regulated seed size) were down-regulated at both filling stage and initial maturity stage, suggesting that they might preform function for seed size at the embryogenesis phase, mainly related to cell division and expansion.
The seeds of common buckwheat contain abundant starch, accounting for over 70% of seed dry weight [23,24,25]. However, the mechanism of starch biosynthesis in common buckwheat remains unclear. It is well known that seven class genes, including SUS, UGPase, AGPase, GBSS, SS, SBE, and DBE, catalyze starch biosynthesis [52]. In our data, we identified 25 SUS, 3 UGPase, 14 AGPase, 8 GBSS, 24 SS, 4 SBE, and 3 DBE genes. Of these, seven SUS, one AGPase, one UGPase, one GBSS, two SS, two SBE, and one DBE genes were differentially expressed during the seed development of common buckwheat. This finding suggests that these identified starch biosynthesis DEGs might be the major functional genes for starch biosynthesis in common buckwheat seed, and could accelerate further functional analysis of them as well.
Seed development is predominantly regulated by genetic factors and is also greatly influenced by physiological pathways [1,2]. Usually, seed development is involved in seed size change and various nutrients accumulation, which determine crop yield and quality [2]. In this study, we provided insight into the transcriptional dynamics of seed development in common buckwheat at three different stages, and identified DEGs involved in the development of common buckwheat seed. Of these DEGs, some were prominently expressed in the early stage, and some other were highly expressed in the latter stage, indicating different DEGs play different roles during common buckwheat seed development. More importantly, of these DEGs, some genes were identified as the key candidate genes that might participate in the seed development of common buckwheat, including Ca2+ signaling, hormone signaling, TFs, seed size, and starch biosynthesis-related genes, and its differential expression patterns during common buckwheat seed development were verified by qRT-PCR. The results are helpful to further dissect the molecular mechanism of buckwheat seed development and provide a basis for buckwheat seed size and quality improvement.

4. Materials and Methods

4.1. Plant Material and Sample Collection

The common buckwheat cultivar “Chitian No. 1” was used in this study. It was planted in the growth chamber of the Research Center of Buckwheat Industry Technology, Guizhou Normal University (Lat. 26˚62’ N, 106˚72’ E, Alt. 1168 m), China, in Spring 2018. All plants were grown under natural daylight and subjected to normal management during the growth periods. Seeds were harvested on the 8th, 14th, and 21st days after full bloom, which corresponded to the pre-filling stage (S1), filling stage (S2), and initial maturity stage (S3). For each stage, approximately 200 mixed seeds were collected from the same five plants, and three independent biological replicates were performed. All samples were immediately frozen in liquid nitrogen and stored at −80 °C for RNA-Seq and qRT-PCR validation analyses.

4.2. RNA Extraction, Library Construction, and Sequencing

Total RNA was extracted using the EASYspin Plus Plant RNA Kit (Aidlab, Beijing, China) with three replicates for each sample, according to the manufacturer’s instructions. Contaminated DNA in the total RNA samples was removed using DNase I (TAKARA, Dalian, China). The quality and concentration of the total RNA were determined using 1.2% agarose gel electrophoresis and a NanoDrop 2000c spectrophotometer (NanoDrop, Wilmington, DE, USA). Then, the cDNA libraries for Illumina sequencing were constructed using the NEBNext®Ultra™ II RNA Library Prep Kit for Illumina® (New England BioLabs, Ipswich, MA, USA). Finally, the constructed cDNA libraries were sequenced using the Illumina XtenPE150 system by Biomarker Technologies Co., Ltd. (Beijing, China).

4.3. Analysis of RNA-Seq Data

The raw reads were processed to produce clean reads by removing the adaptor sequences, low-quality sequence reads (Q < 20), and poly-N stretches (>10%). Then, the clean reads were mapped to the common buckwheat reference genome (ftp://ftp.kazusa.or.jp/pub/buckwheat/) to obtain the unigenes by using Tophat2 software [53]. Moreover, TopHat alignment using Cufflinks reference annotation was applied to identify the novel transcripts [54]. All unigenes and novel transcripts were functionally annotated by searching against public databases, including NR [55], Swiss-Prot [56], GO [57], COG [58], KOG [59], Pfam [60], and KEGG [61].

4.4. Identification of DEGs

The transcript abundance of each unigene was calculated and normalized to fragments per kilobase of transcript per killion fragments mapped (FPKM) [62]. Significantly differential gene expression among the three samples was evaluated using the DEseq package [63]. Genes with a threshold of FDR (false discovery rate) value <0.05 and |log2(fold change)| ≥ 1 were assigned as differentially expressed genes (DEGs). The identified DEGs were further subjected to analysis through Gene Ontology (GO) functions, COG (Cluster of Orthologous Groups of proteins), and KEGG pathway analysis.

4.5. Validation of DEGs by qRT-PCR

qRT-PCR analysis was performed to verify the RNA-Seq data. These genes that reflected some of the functional categories and different expression levels were selected. The reference cDNA sequences of these genes were obtained from the common buckwheat genome sequence database. The RT-qPCR primers were designed using Primer 5.0 software according to the reference cDNA sequences (Table S9). FeActin7 was used as the internal control. RT-qPCR was conducted using the SYBR premix Ex Taq kit (TaKaRa, Dalian, China) on ABI 7500 Fast Real-time PCR system (ThermoFisher Scientific, Waltham, MA, USA). Each sample was analyzed in triplicate. The relative expression change of each gene was calculated using the 2−ΔΔCt method [64]. The Pearson correlation coefficients between the fold change among different stages from qRT-PCR and from RNA-Seq were calculated using Origin 8.0.

Supplementary Materials

Supplementary materials can be found at https://www.mdpi.com/1422-0067/20/17/4303/s1. Figure S1. KEGG pathway assignment of the DEGs in S2 vs. S3 comparison group (top 50 pathways according to enrichment factor). Figure S2. KEGG pathway assignment of the DEGs in S1 vs. S3 comparison group (top 50 pathways according to enrichment factor). Table S1. Pearson’s rank correlation of nine libraries; Table S2. KEGG pathway of S1 vs. S2, S2 vs. S3, and S2 vs. S3 in RNA-Seq; Table S3. Identified TFs in RNA-seq data; Table S4. Differentially expressed TFs in S1 vs. S2, S2 vs. S3, and S2 vs. S3 in RNA-Seq; Table S5. Seed size-related genes from different plant species; Table S6. DEGs involved in seed size; Table S7. List of genes related to starch biosynthesis in common buckwheat; Table S8. Primers of sequences for qRT-PCR analysis; Table S9. Primers of sequences for qRT-PCR analysis.

Author Contributions

H.L. designed the study and wrote the manuscript. Q.C. designed the study and revised the manuscript. H.L. and Q.L. analyzed the data. H.L., J.D., J.H., F.C., C.L., Q.C., and Y.W. participated in experiments. L.Z., and X.Z. revised the manuscript. All authors approved the final manuscript.

Funding

This research was funded by the National Natural Science Foundation of China (31701494, 31860408), the National Natural Science Foundation of China-Project of Karst Science Research Center of Guizhou Provincial People’s Government (U1812401), the Guizhou Provincial Science and Technology Foundation (QianKeHeJiChu [2019]1235), the Training Program of Guizhou Normal University (QianKeHePingTaiRenCai [2017]5726), the Science and Technology Cooperation Project in Guizhou Province (QianKeHeLHzi [2015]7766), the Initial Fund for Doctor Research in Guizhou Normal University (11904/0517051, 11904/0516026), and the Guizhou provincial department of education youth science and technology talent growth project (Qianjiaohe KY Zi [2018]128).

Conflicts of Interest

The authors declare no conflicts of interest.

Abbreviations

ABAAbscisic acid
ABFABA responsive element binding factor
AGPaseADP glucose pyrophosphorylase
AHP Histidine-containing phosphotransfer protein
BR Brassinolides
BRI1 Brassinosteroid insensitive 1
CBLs Calmodulin binding-like proteins
CCXs Cation/Ca2+ exchangers
CDPKs Ca2+-dependent protein kinases
CHX Ca2+-transporting ATPase and Cation/H+ antiporter
IAA Auxin-responsive protein
CK Cytokinins
CMLs Calmodulin-like proteins
CTR1 Serine/threonine-protein kinase
DEB Debranching enzyme
DEGs Differentially expressed genes
ET Ethylene
ETR Ethylene Receptor
EIN3 Ethylene-Insensitive Protein 3
EIN4 Ethylene-Insensitive Protein 4
GAGibberellins
GBSSGranule bound starch synthase
GO Gene ontology
JA Jasmonic acid
PIF3 Phytochrome-interacting factor 3
PP2C Protein phosphatase 2C
PYR/PYL Abscisic acid receptor
qRT-PCR Quantitative real-time PCR
SA Salicylic acid
SBE Starch-branching enzyme
SnRK2 Serine/threonine protein kinase
SS Starch synthase
SUS Sucrose synthase
TFs Transcription factors
UGPase UDP glucose pyrophosphorylase
QTLsQuantitative trait locus

References

  1. Kong, L.; Guo, H.; Sun, M. Signal transduction during wheat grain development. Planta 2015, 241, 789–801. [Google Scholar] [CrossRef] [PubMed]
  2. Savadi, S. Molecular regulation of seed development and strategies for engineering seed size in crop plants. Plant Growth Regul. 2018, 84, 401–422. [Google Scholar] [CrossRef]
  3. Locascio, A.; Roig-Villanova, I.; Bernardi, J.; Varotto, S. Current perspectives on the hormonal control of seed development in Arabidopsis and maize: a focus on auxin. Front. Plant Sci. 2014, 5, 412. [Google Scholar] [CrossRef] [PubMed]
  4. Bian, J.; Deng, P.; Zhan, H.; Wu, X.; Nishantha, M.D.L.C.; Yan, Z.; Du, X.; Nie, X.; Song, W. Transcriptional dynamics of grain development in barley (Hordeum vulgare L.). Int. J. Mol. Sci. 2019, 20, 962. [Google Scholar] [CrossRef] [PubMed]
  5. Ruuska, S.A.; Girke, T.; Benning, C.; Ohlrogge, J.B. Contrapuntal networks of gene expression during Arabidopsis seed filling. Plant Cell 2002, 4, 1191–1206. [Google Scholar] [CrossRef] [PubMed]
  6. Tzafrir, I.; Pena-Muralla, R.; Dickerman, A.; Berg, M.; Rogers, R.; Hutchens, S.; Sweeney, T.C.; McElver, J.; Aux, G.; Patton, D.; et al. Identification of genes required for embryo development in Arabidopsis. Plant Physiol. 2004, 135, 1206–1220. [Google Scholar] [CrossRef] [PubMed]
  7. Devic, M. The importance of being essential: EMBRYO-DEFECTIVE genes in Arabidopsis. C.R. Biol. 2008, 331, 726–736. [Google Scholar] [CrossRef] [PubMed]
  8. Wang, L.; Xie, W.; Chen, Y.; Tang, W.; Yang, J.; Ye, R.; Liu, L.; Lin, Y.; Xu, C.; Xiao, J.; et al. A dynamic gene expression atlas covering the entire life cycle of rice. Plant J. 2010, 61, 752–766. [Google Scholar] [CrossRef] [PubMed]
  9. Li, N.; Xu, R.; Li, Y. Molecular networks of seed size control plants. Annu. Rev. Plant Biol. 2019, 70, 435–463. [Google Scholar] [CrossRef] [PubMed]
  10. Chen, J.; Zeng, B.; Zhang, M.; Xie, S.; Wang, G.; Hauck, A.; Lai, J. Dynamic transcriptome landscape of maize embryo and endosperm development. Plant Physiol. 2014, 166, 252–264. [Google Scholar] [CrossRef]
  11. Li, G.; Wang, D.; Yang, R.; Logan, K.; Chen, H.; Zhang, S.; Skaggs, M.I.; Lloyd, A.; Burnett, W.J.; Laurie, J.D.; et al. Temporal patterns of gene expression in developing maize endosperm identified through transcriptome sequencing. Proc. Natl. Acad. Sci. USA 2014, 111, 7582–7587. [Google Scholar] [CrossRef] [PubMed] [Green Version]
  12. Cantu, D.; Pearce, S.P.; Distelfeld, A.; Christiansen, M.W.; Uauy, C.; Akhunov, E.; Fahima, T.; Dubcovsky, J. Effect of the down-regulation of the high grain protein content (GPC) genes on the wheat transcriptome during monocarpic senescence. BMC Genomics 2011, 12, 492. [Google Scholar] [CrossRef] [PubMed]
  13. Li, H.Z.; Gao, X.; Li, X.Y.; Chen, Q.J.; Dong, J.; Zhao, W.C. Evaluation of assembly strategies using RNA-seq data associated with grain development of wheat (Triticum aestivum L.). PLoS ONE 2013, 8, e83530. [Google Scholar] [CrossRef]
  14. Jones, S.I.; Vodkin, L.O. Using RNA-Seq to profile soybean seed development from fertilization to maturity. PLoS ONE 2013, 8, e59270. [Google Scholar] [CrossRef] [PubMed]
  15. Lu, X.; Li, Q.T.; Xiong, Q.; Li, W.; Bi, Y.D.; Lai, Y.C.; Liu, X.L.; Man, W.Q.; Zhang, W.K.; Ma, B.; et al. The transcriptomic signature of developing soybean seeds reveals the genetic basis of seed trait adaptation during domestication. Plant J. 2016, 86, 530–544. [Google Scholar] [CrossRef] [PubMed] [Green Version]
  16. Du, J.; Wang, S.; He, C.; Zhou, B.; Ruan, Y.L.; Shou, H. Identification of regulatory networks and hub genes controlling soybean seed set and size using RNA sequencing analysis. J. Exp. Bot. 2017, 68, 1955–1972. [Google Scholar] [CrossRef] [PubMed] [Green Version]
  17. Huang, J.; Deng, J.; Shi, T.; Chen, Q.; Liang, C.; Meng, Z.; Zhu, L.; Wang, Y.; Zhao, F.; Yu, S.; et al. Global transcriptome analysis and identification of genes involved in nutrients accumulation during seed development of rice tartary buckwheat (Fagopyrum Tararicum). Sci. Rep. 2017, 7, 11792. [Google Scholar] [CrossRef] [PubMed]
  18. Liu, M.; Ma, Z.; Zheng, T.; Sun, W.; Zhang, Y.; Jin, W.; Zhan, J.; Cai, Y.; Tang, Y.; Wu, Q.; et al. Insights into the correlation between physiological changes in and seed development of tartary buckwheat (Fagopyrum tataricum Gaertn.). BMC Genomics 2018, 19, 648. [Google Scholar] [CrossRef] [PubMed]
  19. Garg, R.; Singh, V.K.; Rajkumar, M.S.; Kumar, V.; Jain, M. Global transcriptome and coexpression network analyses reveal cultivar-specific molecular signatures associated with seed development and seed size/weight determination in chickpea. Plant J. 2017, 91, 1088–1107. [Google Scholar] [CrossRef] [PubMed] [Green Version]
  20. Basnet, R.K.; Moreno-Pachon, N.; Lin, K.; Bucher, J.; Visser, R.G.; Maliepaard, C.; Bonnema, G. Genome-wide analysis of coordinated transcript abundance during seed development in different Brassica rapa morphotypes. BMC Genomics 2013, 14, 840. [Google Scholar] [CrossRef] [PubMed]
  21. Zhou, L.H.; Wang, H.Y.; Chen, X.; Li, Y.L.; Hussain, N.; Cui, L.B.; Wu, D.Z.; Jiang, L.X. Identification of candidate genes involved in fatty acids degradation at the late maturity stage in Brassica napus based on transcriptomic analysis. Plant Growth Regul. 2017, 83, 385–396. [Google Scholar] [CrossRef]
  22. Yasui, Y.; Hirakawa, H.; Ueno, M.; Matsui, K.; Katsube-Tanaka, T.; Yang, S.J.; Aii, J.; Sato, S.; Mori, M. Assembly of the draft genome of buckwheat and its applications in identifying agronomically useful genes. DNA Res. 2016, 23, 215–224. [Google Scholar] [CrossRef]
  23. Przybylski, R.; Gruczynska, E. A review of nutritional and nutraceutical components of buckwheat. Eur. J. Plant Sci. Biotechnol. 2009, 3, 10–22. [Google Scholar]
  24. Comino, I.; de Lourdes Moreno, M.; Real, A.; Rodríguez-Herrera, A.; Barro, F.; Sousa, C. The gluten-free diet: Testing alternative cereals tolerated by celiac patients. Nutrients 2013, 5, 4250–4268. [Google Scholar] [CrossRef] [PubMed]
  25. Giménez-Bastida, J.A.; Zielinski, H. Buckwheat as a functional food and its effects on health. J. Agric. Food Chem. 2015, 63, 7896–7913. [Google Scholar] [CrossRef]
  26. Chen, Y.; Lee, C.K.; Su, F.T.; Liao, Y.L.; Chen, H.B. De Novo sequencing and characterization of developing seed transcriptome in two buckwheat species and metabolome profiling. Planta Med. 2012, 78, 11. [Google Scholar] [CrossRef]
  27. Gao, J.; Wang, T.; Liu, M.; Liu, J.; Zhang, Z. Transcriptome analysis of filling stage seeds among three buckwheat species with emphasis on rutin accumulation. PLoS ONE 2017, 12, e0189672. [Google Scholar] [CrossRef]
  28. Shi, T.X.; Li, R.Y.; Chen, Q.J.; Li, Y.; Pan, F.; Chen, Q.F. De novo sequencing of seed transcriptome and development of genic-SSR markers in common buckwheat (Fagopyrum esculentum). Mol. Breeding 2017, 37, 147. [Google Scholar] [CrossRef]
  29. Jain, M.; Pathak, B.P.; Harmon, A.C.; Tillman, B.L.; Gallo, M. Calcium dependent protein kinase (CDPK) expression during fruit development in cultivated peanut (Arachis hypogaea) under Ca2⁺-sufficient and -deficient growth regimens. J. Plant Physiol. 2011, 168, 2272–2277. [Google Scholar] [CrossRef]
  30. Pawełek, A.; Szmidt-Jaworska, A.; Świeżawska, B.; Jaworski, K. Genomic structure and promoter characterization of the CDPK kinase gene expressed during seed formation in nil. J. Plant Physiol. 2015, 189, 87–96. [Google Scholar] [CrossRef]
  31. Kawasaki, T.; Hayashida, N.; Baba, T.; Shinozaki, K.; Shimada, H. The gene encoding a calcium-dependent protein kinase located near the sbe1 gene encoding starch branching enzyme I is specifically expressed in developing rice seeds. Gene 1993, 129, 183–189. [Google Scholar] [CrossRef]
  32. Frattini, M.; Morello, L.; Breviario, D. Rice calcium-dependent protein kinase isoforms OsCDPK2 and OsCDPK11 show different response to light and different expression patterns during seed development. Plant Mol. Biol. 1999, 41, 753–764. [Google Scholar] [CrossRef] [PubMed]
  33. Szczegielniak, J.; Klimecka, M.; Liwosz, A.; Ciesielski, A.; Kaczanowski, S.; Dobrowolska, G.; Harmon, A.C.; Muszyńska, G. A wound-responsive and phospholipid-regulated maize calcium-dependent protein kinase. Plant Physiol. 2005, 139, 1970–1983. [Google Scholar] [CrossRef] [PubMed]
  34. Morello, L.; Frattini, M.; Giani, S.; Christou, P.; Breviario, D. Overexpression of the calcium-dependent protein kinase OsCDPK2 in transgenic rice is repressed by light in leaves and disrupts seed development. Transgenic Res. 2000, 9, 453–462. [Google Scholar] [CrossRef]
  35. Shimada, H.; Koishihara, H.; Saito, Y.; Arashima, Y.; Furukawa, T.; Hayash, H. A rice antisense SPK transformant that lacks the accumulation of seed storage substances shows no correlation between sucrose concentration in phloem sap and demand for carbon sources in the sink organs. Plant Cell Physiol. 2004, 45, 1105–1109. [Google Scholar] [CrossRef] [PubMed]
  36. Ying, S.; Hill, A.T.; Pyc, M.; Anderson, E.M.; Snedden, W.A.; Mullen, R.T.; She, Y.M.; Plaxton, W.C. Regulatory phosphorylation of bacterial-type PEP carboxylase by the Ca2+-dependent protein kinase RcCDPK1 in developing castor oil seeds. Plant Physiol. 2017, 174, 1012–1027. [Google Scholar] [CrossRef]
  37. Jofuku, K.D.; Omidyar, P.K.; Gee, Z.; Okamuro, J.K. Control of seed mass and seed yield by the floral homeotic gene APETALA2. Proc. Natl. Acad. Sci. USA 2005, 102, 3117–3122. [Google Scholar] [CrossRef] [PubMed]
  38. Ohto, M.A.; Fischer, R.L.; Goldberg, R.B.; Nakamura, K.; Harada, J.J. Control of seed mass by APETALA2. Proc. Natl. Acad. Sci. USA 2005, 102, 3123–3128. [Google Scholar] [CrossRef] [PubMed]
  39. Li, Y.; Zheng, L.; Corke, F.; Smith, C.; Bevan, M.W. Control of final seed and organ size by the DA1 gene family in Arabidopsis thaliana. Genes Dev. 2008, 22, 1331–1336. [Google Scholar] [CrossRef] [PubMed]
  40. Disch, S.; Anastasiou, E.; Sharma, V.K.; Laux, T.; Fletcher, J.C.; Lenhard, M. The E3 ubiquitin ligase BIG BROTHER controls Arabidopsis organ size in a dosage-dependent manner. Curr. Biol. 2006, 16, 272–279. [Google Scholar] [CrossRef]
  41. Feng, Z.; Wu, C.; Wang, C.; Roh, J.; Zhang, L.; Chen, J.; Zhang, S.; Zhang, H.; Yang, C.; Hu, J.; et al. SLG controls grain size and leaf angle by modulating brassinosteroid homeostasis in rice. J. Exp. Bot. 2016, 67, 4241–4253. [Google Scholar] [CrossRef] [PubMed]
  42. Luo, M.; Dennis, E.S.; Berger, F.; Peacock, W.J.; Chaudhury, A. MINISEED3 (MINI3), a WRKY family gene, and HAIKU2 (IKU2), a leucine-rich repeat (LRR) KINASE gene, are regulators of seed size in Arabidopsis. Proc. Natl. Acad. Sci. USA 2005, 102, 17531–17536. [Google Scholar] [CrossRef] [PubMed]
  43. Che, R.; Tong, H.; Shi, B.; Liu, Y.; Fang, S.; Liu, D.; Xiao, Y.; Hu, B.; Liu, L.; Wang, H.; et al. Control of grain size and rice yield by GL2-mediated brassinosteroid responses. Nat. Plants 2015, 2, 15195. [Google Scholar] [CrossRef] [PubMed]
  44. Duan, P.; Ni, S.; Wang, J.; Zhang, B.; Xu, R.; Wang, Y.; Chen, H.; Zhu, X.; Li, Y. Regulation of OsGRF4 by OsmiR396 controls grain size and yield in rice. Nat. Plants 2016, 14, 2134–2146. [Google Scholar] [CrossRef]
  45. Nagasawa, N.; Hibara, K.; Heppard, E.P.; Vander Velden, K.A.; Luck, S.; Beatty, M.; Nagato, Y.; Sakai, H. GIANT EMBRYO encodes CYP78A13, required for proper size balance between embryo and endosperm in rice. Plant J. 2013, 75, 592–605. [Google Scholar] [CrossRef] [PubMed]
  46. Xu, F.; Fang, J.; Ou, S.; Gao, S.; Zhang, F.; Du, L.; Xiao, Y.; Wang, H.; Sun, X.; Chu, J.; et al. Variations in CYP78A13 coding region influence grain size and yield in rice. Plant Cell Environ. 2015, 38, 800–811. [Google Scholar] [CrossRef]
  47. Wu, Y.; Fu, Y.; Zhao, S.; Gu, P.; Zhu, Z.; Sun, C.; Tan, L. CLUSTERED PRIMARY BRANCH 1, a new allele of DWARF11, controls panicle architecture and seed size in rice. Plant Biotechnol. J. 2016, 14, 377–386. [Google Scholar] [CrossRef] [PubMed]
  48. Jiang, W.B.; Huang, H.Y.; Hu, Y.W.; Zhu, S.W.; Wang, Z.Y.; Lin, W.H. Brassinosteroid regulates seed size and shape in Arabidopsis. Plant Physiol. 2013, 162, 1965–1977. [Google Scholar] [CrossRef]
  49. Tian, X.; Li, X.; Zhou, W.; Ren, Y.; Wang, Z.; Liu, Z.; Tang, J.; Tong, H.; Fang, J.; Bu, Q. Transcription factor OsWRKY53 positively regulates brassinosteroid signaling and plant architecture. Plant Physiol. 2017, 175, 1337–1349. [Google Scholar] [CrossRef]
  50. Meng, L.S.; Wang, Z.B.; Yao, S.Q.; Liu, A. The ARF2-ANT-COR15A gene cascade regulates ABA signaling-mediated resistance of large seeds to drought in Arabidopsis. J. Cell Sci. 2015, 128, 3922–3932. [Google Scholar] [CrossRef]
  51. Garcia, D.; Fitz Gerald, J.N.; Berger, F. Maternal control of integument cell elongation and zygotic control of endosperm growth are coordinated to determine seed size in Arabidopsis. Plant Cell 2005, 17, 52–60. [Google Scholar] [CrossRef] [PubMed]
  52. Nougue, O.; Corbi, J.; Ball, S.G.; Manicacci, D.; Tenaillon, M.I. Molecular evolution accompanying functional divergence of duplicated genes along the plant starch biosynthesis pathway. BMC Evol. Biol. 2014, 14, 103. [Google Scholar] [CrossRef] [PubMed]
  53. Kim, D.; Pertea, G.; Trapnell, C.; Pimentel, H.; Kelley, R.; Salzberg, S.L. TopHat2: Accurate alignment of transcriptomes in the presence of insertions, deletions and gene fusions. Genome Biol. 2013, 14, R36. [Google Scholar] [CrossRef] [PubMed]
  54. Altschul, S.F.; Madden, T.L.; Schäffer, A.A.; Zhang, J.; Zhang, Z.; Miller, W.; Lipman, D.J. Gapped BLAST and PSI BLAST: A new generation of protein database search programs. Nucleic. Acids Res. 1997, 25, 3389–3402. [Google Scholar] [CrossRef] [PubMed]
  55. Deng, Y.Y.; Li, J.Q.; Wu, S.F.; Zhu, Y.P.; Chen, Y.W.; He, F.C. Integrated nr database in protein annotation system and its localization. Comput. Eng. 2006, 32, 71–74. [Google Scholar]
  56. Apweiler, R.; Bairoch, A.; Wu, C.H.; Barker, W.C.; Boeckmann, B.; Ferro, S.; Gasteiger, E.; Huang, H.; Lopez, R.; Magrane, M.; et al. UniProt: The universal protein knowledgebase. Nucleic. Acids Res. 2004, 32, D115–D119. [Google Scholar] [CrossRef] [PubMed]
  57. Ashburner, M.; Ball, C.A.; Blake, J.A.; Botstein, D.; Butler, H.; Cherry, J.M.; Davis, A.P.; Dolinski, K.; Dwight, S.S.; Eppig, J.T.; et al. Gene ontology: Tool for the unification of biology. Nat. Genet. 2000, 25, 25–29. [Google Scholar] [CrossRef]
  58. Tatusov, R.L.; Galperin, M.Y.; Natale, D.A. The COG database: A tool for genome scale analysis of protein functions and evolution. Nucleic. Acids Res. 2000, 28, 33–36. [Google Scholar] [CrossRef]
  59. Koonin, E.V.; Fedorova, N.D.; Jackson, J.D.; Jacobs, A.R.; Krylov, D.M.; Makarova, K.S.; Mazumder, R.; Mekhedov, S.L.; Nikolskaya, A.N.; Rao, B.S.; et al. A comprehensive evolutionary classification of proteins encoded in complete eukaryotic genomes. Genome Biol. 2004, 5, R7. [Google Scholar] [CrossRef]
  60. Finn, R.D.; Bateman, A.; Clements, J.; Coggill, P.; Eberhardt, R.Y.; Eddy, S.R.; Heger, A.; Hetherington, K.; Holm, L.; Mistry, J.; et al. Pfam: The protein families database. Nucleic. Acids Res. 2014, 42, D222–D230. [Google Scholar] [CrossRef]
  61. Kanehisa, M.; Goto, S.; Kawashima, S.; Okuno, Y.; Hattori, M. The KEGG resource for deciphering the genome. Nucleic. Acids Res. 2004, 32, D277–D280. [Google Scholar] [CrossRef] [PubMed]
  62. Trapnell, C.; Williams, B.A.; Pertea, G.; Mortazavi, A.; Kwan, G.; van Baren, M.J.; Salzberg, S.L.; Wold, B.J.; Pachter, L. Transcript assembly and quantification by RNA-Seq reveals unannotated transcripts and isoform switching during cell differentiation. Nat. Biotechnol. 2010, 28, 511–515. [Google Scholar] [CrossRef] [PubMed] [Green Version]
  63. Anders, S.; Huber, W. Differential expression analysis for sequence count data. Genome Biol. 2010, 11, R106. [Google Scholar] [CrossRef] [PubMed]
  64. Livak, K.J.; Schmittgen, T.D. Analysis of relative gene expression data using real-time quantitative PCR and the 2-DELTADELTACT method. Methods 2001, 25, 402–408. [Google Scholar] [CrossRef] [PubMed]
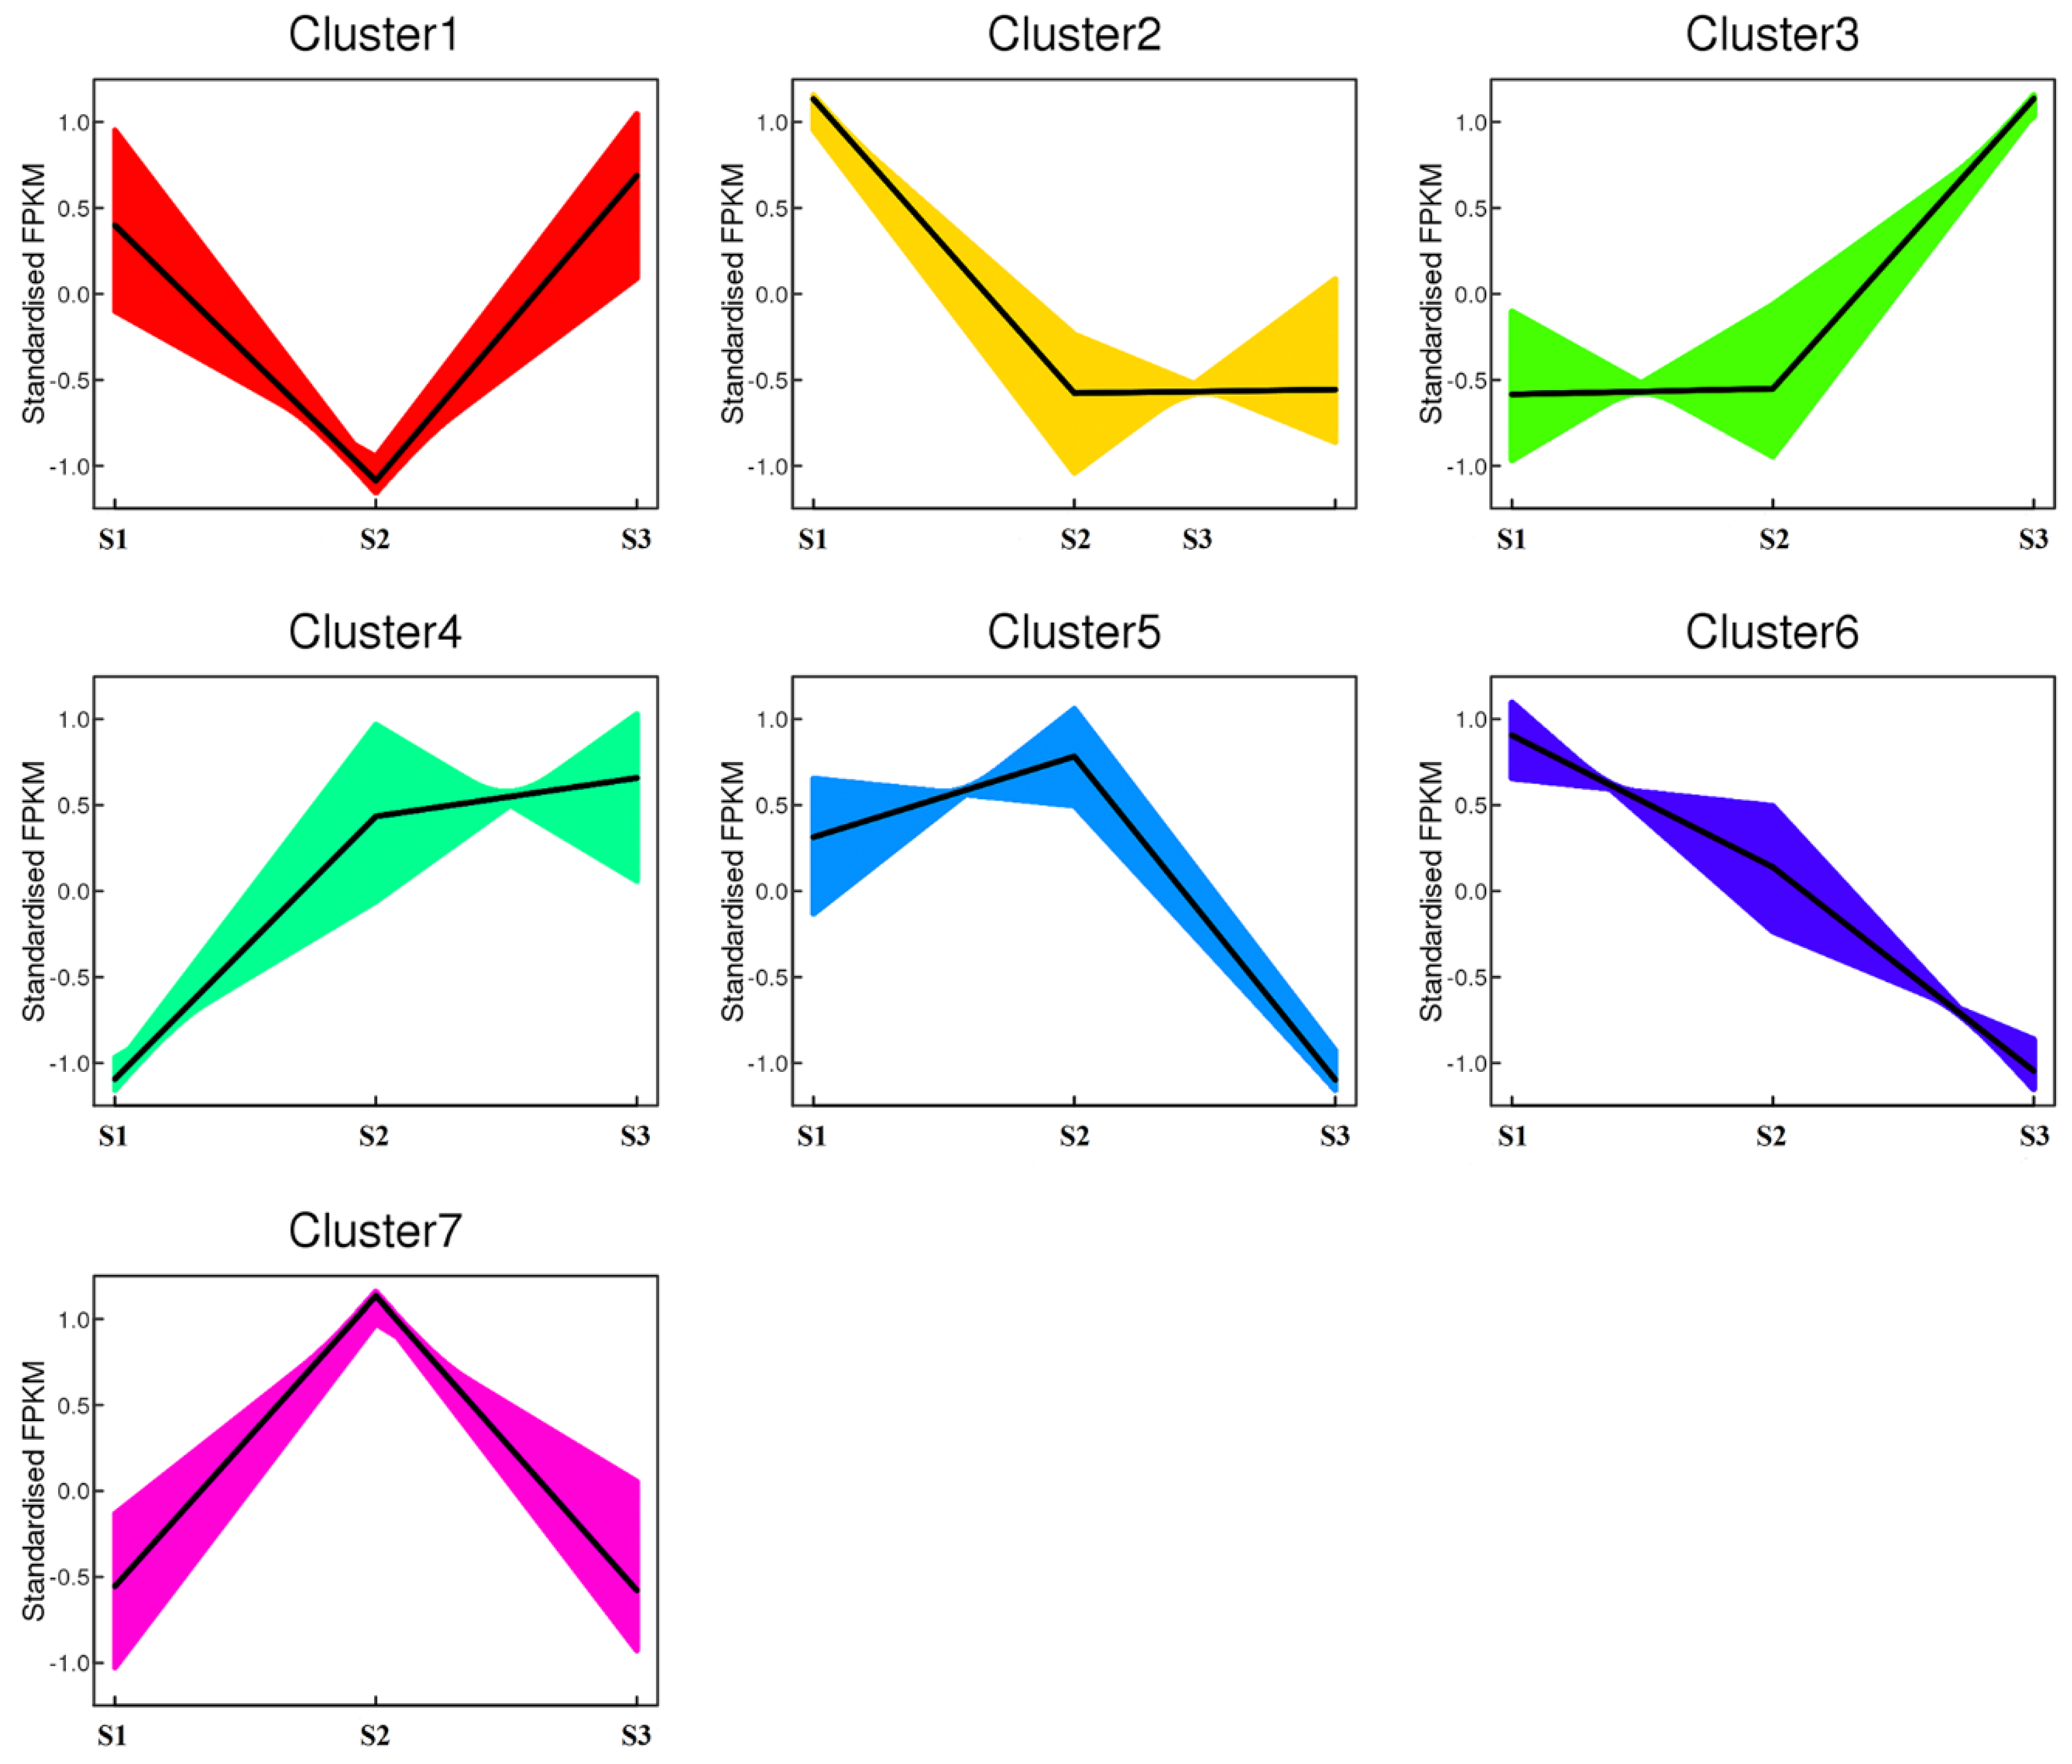
Figure 1. Clustered gene expression profiles from developing tartary buckwheat seeds. The clusters were defined on the basis of genes’ temporal expression profiles in R using K-means. The Y-axis represents the standardized FPKM value of genes, and the X-axis represents the different sample. S1, S2, and S3 stand for the seed samples at pre-filling stage, filling stage, and initial maturity stage, respectively.
Ijms 20 04303 g001
Figure 2. Numbers of specific differentially expressed genes (DEGs) in different comparison groups during common buckwheat seed development. (A) Venn diagram for DEGs at different development stages of common buckwheat. (B) Numbers of up- and down-regulated DEGs in different comparison groups. S1, S2, and S3 stand for the seed samples at pre-filling stage, filling stage, and initial maturity stage, respectively.
Ijms 20 04303 g002
Figure 3. GO enrichment of identified DEGs in developing common buckwheat seeds. S3. S1, S2, and S3 stand for the seed samples at pre-filling stage, filling stage, and initial maturity stage, respectively.
Ijms 20 04303 g003
Figure 4. KEGG pathway assignment of the DEGs in S1 vs. S2 comparison group (top 50 pathways according to enrichment factor). S1 and S2 stand for the seed samples at pre-filling stage and filling stage, respectively.
Ijms 20 04303 g004
Figure 5. Heat map diagrams of relative expression levels of the differentially expressed orthologs of seed size-related genes in the different development stages of common buckwheat. The heat map was constructed using MeV 4.9.0 based on the Log2(FPKM) value of genes. S1, S2, and S3 stand for the seed samples at pre-filling stage, filling stage, and initial maturity stage, respectively.
Ijms 20 04303 g005
Figure 6. Expression patterns of starch biosynthesis genes that were differentially expressed during seed development. SUS: Sucrose synthase, UGPase: UDP glucose pyrophosphorylase, AGPase: ADP glucose pyrophosphorylase, GBSS: Granule bound starch synthase, SS: Starch synthase, SBE: Starch-branching enzyme (SBE), DBE: Debranching enzyme. S1, S2, and S3 stand for the seed samples at pre-filling stage, filling stage, and initial maturity stage, respectively.
Ijms 20 04303 g006
Figure 7. qRT-PCR confirmed 15 DEGs in developing common buckwheat seed. Blue lines represent the RNA-seq values of these selected genes, and grey columns indicate the qRT-PCR results. Relative expression levels of qRT-PCR were calculated using β-actin as a standard. Pearson correlation coefficients were calculated by comparing qRT-PCR and RNA-Seq data for each gene across all samples.
Ijms 20 04303 g007
Table 1. Overview of the RNA-Seq results in developing tartary buckwheat seed.
ItemS1-1S1-2S1-3S2-1S2-2S2-3S3-1S3-2S3-3
Raw Reads25,672,94922,929,58924,865,37425,424,45727,829,98130,527,43925,646,27037,234,14028,939,774
Clean Reads25,494,67222,747,87024,566,71825,250,03327,625,28730,212,77921,406,24536,901,84228,656,479
GC Content (%)47.7748.4647.6548.9448.8249.7148.6150.5848.33
Q_30 (%)93.8293.6593.3893.5993.8094.0294.4694.1893.63
Mapped Reads17,576,027
(68.94%)
14,624,606
(64.29%)
16,309,844
(66.39%)
17,149,822
(67.92%)
17,492,332
(63.32%)
19,840,732
(65.67%)
14,868,778
(69.46%)
25,263,001
(68.46%)
19,801,627
(69.21%)
Unique Mapped Reads17,327,070
(68.14%)
14,438,073
(63.47%)
16,088,744
(65.49%)
16,942,772
(67.10%)
17,265,804
(62.50%)
19,611,115
(64.91%)
14,671,840
(68.54%)
25,000,998
(67.75%)
19,580,972
(68.33%)
Multiple Mapped Reads203,957
(0.80%)
186,533
(0.82%)
221,100
(0.90%)
207,050
(0.82%)
226,528
(0.82%)
229,617
(0.76%)
196,938
(0.92%)
262,003
(0.71%)
220,655
(0.88%)
Notes: S1, S2, and S3 stand for the seed samples at pre-filling stage, filling stage, and initial maturity stage, and -1, -2, and -3 represent the three replicates per sample. GC Content (%) represents the percentage of Guanine and Cytosine in clean reads. Q_30 (%) represents the percentage of nucleotides with quality value ≥30.
Table 2. DEGs involved in Ca2+ signaling pathways. S1, S2, and S3 stand for the seed samples at pre-filling stage, filling stage, and initial maturity stage, respectively. FDR stands for false discovery rate. Log2FC stand for Log2 fold change.
Gene IDS1 vs. S2S2 vs. S3Annotation
FDRLog2FCup/downFDRLog2FCup/down
CaM/CMLFes_sc0060020.1.g000001.aua.14.52 × 10−61.84up0.000051.23upCalcium-like protein CML38
Fes_sc0006049.1.g000004.aua.1---1.17 × 10−92.25upCalmodulin-like protein 4
Fes_sc0002338.1.g000002.aua.1---3.71 × 10−141.74upCalmodulin-like protein 9
CBLFes_sc0011071.1.g000006.aua.17.98 × 10−141.21up0.00021−1.89downCalmodulin binding protein-like
Fes_sc0011071.1.g000006.aua.1---3.54 × 10⁻¹⁸−1.89downCalmodulin binding protein-like
CCXFes_sc0000003.1.g000052.aua.1---3.39 × 10⁻⁷−1.94downCation calcium exchanger 4
Fes_sc0000035.1.g000047.aua.1---5.08 × 10⁻⁹−2.11downCation calcium exchanger 3
CDPKFes_sc0006858.1.g000001.aua.10.00016−3.92down---Calcium-dependent protein kinase 1
Fes_sc0219194.1.g000001.aua.10.000491.56up0.00023−3.15downCalcium-dependent protein kinase 8
Fes_sc0000035.1.g000053.aua.16.85 × 10−111.08up0.00013−3.33downCalcium-dependent protein kinase 13
Fes_sc0080717.1.g000001.aua.1---1.83 × 10⁻⁸−4.95downCalcium-dependent protein kinase 1
CIPKFes_sc0008411.1.g000003.aua.14.26 × 10−71.08up0.00024−2.68downCBL-interacting -protein kinase
Fes_sc0220933.1.g000001.aua.1---3.22 × 10⁻⁶−3.43downCBL-interacting protein kinase 18
Fes_sc0097817.1.g000001.aua.1---2.67 × 10⁻⁶−2.60downCBL-interacting protein kinase 2
Fes_sc0093645.1.g000001.aua.1---3.39 × 10⁻⁹−2.31downCBL-interacting protein kinase 5
Fes_sc0000542.1.g000013.aua.1---0.00004−2.44downCBL-interacting protein kinase 7
Ca2+-ATPaseFes_sc0074374.1.g000001.aua.11.88 × 10−111.24up0.00002−5.85downCalcium-transporting ATPase 10
Fes_sc0049771.1.g000001.aua.13.53 × 10−81.74up3.30 × 10−16−2.19downCalcium-transporting ATPase 8
Fes_sc0023460.1.g000001.aua.1---0.00009−2.64downCalcium-transporting ATPase 1
Fes_sc0009288.1.g000009.aua.1---0.00026−2.00downCalcium-transporting ATPase 10
CHXFes_sc0150773.1.g000001.aua.1---0.00008−7.37downCation/H(+) antiporter 17
Fesculentum_newGene_621---5.17 × 10⁻¹³−4.99downCation/H(+) antiporter 15
Table 3. DEGs involved in hormone signaling pathways. S1, S2, and S3 stand for the seed samples at pre-filling stage, filling stage, and initial maturity stage, respectively. FDR stands for false discovery rate. Log2FC stand for Log2 fold change.
Gene IDS1 vs. S2S2 vs. S3Annotation
FDRLog2FCup/downFDRLog2FCup/down
AuxinFes_sc0003131.1.g000008.aua.13.57 × 10−72.13up---Auxin responsive protein/IAA
Fes_sc0008308.1.g000001.aua.1---0.00023−1.73downAuxin-responsive protein/IAA12
Fes_sc0076315.1.g000001.aua.1---0.00239−5.90downAuxin transporter-like protein/AUX1
Fes_sc0096151.1.g000001.aua.1---4.49 × 10⁻¹⁴−3.12downAuxin-responsive protein/IAA9
Fes_sc0032547.1.g000002.aua.11.85 × 10−62.08up0.006261.76upAuxin response factor 7/ARF7
Fes_sc0001323.1.g000012.aua.1---0.000424.27upAuxin responsive protein/IAA
Fes_sc0006670.1.g000009.aua.1---3.41 × 10−92.07upAuxin-induced protein/IAA
Fes_sc0007310.1.g000002.aua.1---1.36 × 10−153.66upAuxin responsive protein/IAA
Fes_sc0007969.1.g000004.aua.1---1.90 × 10−82.19upAuxin responsive protein/IAA
Fes_sc0010815.1.g000005.aua.1---7.27 × 10−142.26upAuxin responsive protein/IAA
CytokinineFes_sc0001025.1.g000012.aua.1---0.000191.93upHistidine-containing phosphotransfer protein 1/AHP
Fes_sc0040103.1.g000001.aua.10.0283.44up---Two-component response regulator /ARR8
GibberellinFes_sc0005307.1.g000002.aua.15.01 × 10−181.22up0.000111.47upTranscription factor/PIF3
Fes_sc0000054.1.g000047.aua.1---2.56 × 10−64.92upTranscription factor bHLH127
Abscisic acidFes_sc0011976.1.g000004.aua.1---0.00118−2.93downAbscisic acid receptor/PYR/PYL
Fes_sc0002839.1.g000004.aua.12.99 × 10−152.38up Protein phosphatase 2C/PP2C
Fes_sc0011132.1.g000002.aua.10.00012.17up Protein phosphatase 2C/PP2C
Fes_sc0000642.1.g000010.aua.1---4.93 × 10⁻¹⁰−1.72downProtein phosphatase 2C/PP2C
Fes_sc0002743.1.g000004.aua.1---2.60 × 10⁻⁷−1.83downSerine/threonine-protein kinase/SRK2A
Fes_sc0000024.1.g000035.aua.10.00035−1.93down---ABSCISIC ACID-INSENSITIVE 5 /ABF
EthyleneFes_sc0005120.1.g000005.aua.1---4.22 × 10⁻¹⁵−3.46downProtein EIN4
Fes_sc0125064.1.g000001.aua.1---4.90 × 10⁻¹⁰−3.45downEthylene receptor 2/ETR
Fes_sc0043049.1.g000001.aua.1---1.91 × 10⁻⁷−2.07downEthylene receptor 1/ETR
Fes_sc0027826.1.g000001.aua.1---0.00006−4.68downSerine/threonine-protein kinase/CTR1
Fes_sc0004642.1.g000013.aua.16.60 × 10−93.43up Ethylene insensitive 3/EIN3
Fes_sc0006207.1.g000001.aua.1---0.032482.01upEthylene insensitive 3-like protein/EIN3
BrassinosteroidFes_sc0009187.1.g000001.aua.12.80 × 10−122.02up0.01759−2.33downBRASSINOSTEROID INSENSITIVE 1/BRI1
Fes_sc0361928.1.g000001.aua.1---3.83 × 10⁻⁷−3.60downBRASSINOSTEROID INSENSITIVE 1/BRI1
Jasmonic acidFes_sc0000770.1.g000005.aua.1---0.000112.07upProtein TIFY 6B
Salicylic acidFes_sc0002899.1.g000004.aua.10.00027−1.76down---bZIP transcription factor
Table 4. DEGs involved in starch biosynthesis. S1, S2, and S3 stand for the seed samples at pre-filling stage, filling stage, and initial maturity stage, respectively. FDR stands for false discovery rate. Log2FC stand for Log2 fold change.
Gene IDS1 vs. S2S2 vs. S3Annotation
FDRLog2FCup/downFDRLog2FCup/down
SUSFes_sc0086881.1.g000001.aua.11.06 × 10−91.74up3.08 × 10−14−1.66downSucrose synthase 2
Fes_sc0023486.1.g000001.aua.12.69 × 10−61.75up5.57 × 10−9−2.47downSucrose synthase 3 isoform 4
Fes_sc0052588.1.g000001.aua.10.000151.73up---Sucrose synthase 4
Fes_sc0053143.1.g000001.aua.10.006271.57up---Sucrose synthase 4
Fes_sc0007558.1.g000005.aua.14.33 × 10−141.51up---Sucrose synthase 3
Fes_sc0006080.1.g000001.aua.10.000011.72up---Sucrose synthase 1
Fes_sc0000045.1.g000030.aua.1---0.00035−1.87downSucrose synthase
UGPaseFes_sc0005131.1.g000007.aua.13.89 × 10−81.33up---UDP glucose pyrophosphorylase
AGPaseFes_sc0000081.1.g000017.aua.1---1.42 × 10⁻⁶−2.09downADP-glucose pyrophosphorylase
GBSSFes_sc0002521.1.g000007.aua.1---0.00001−2.75downGranule-bound starch synthase 1
SSFes_sc0005785.1.g000003.aua.12.02 × 10−112.13up2.93 × 10−10−1.89downStarch synthase 1
Fes_sc0069832.1.g000001.aua.1---1.87 × 10⁻⁶−3.03downStarch synthase 3
SBEFes_sc0000127.1.g000022.aua.10.000271.38up1.13 × 10-12−1.32downStarch-branching enzyme
Fes_sc0001814.1.g000004.gia.10.002681.37up---Starch-branching enzyme
DBEFes_sc0001905.1.g000005.aua.13.21 × 10−12−1.53up4.66 × 10−122.21downDebranching enzyme